Abstract
Microbolometer thermal cameras in UAVs and manned aircraft allow for the acquisition of high-resolution temperature data, which, along with optical reflectance, contributes to monitoring and modeling of agricultural and natural environments. Furthermore, these temperature measurements have facilitated the development of advanced models of crop water stress and evapotranspiration in precision agriculture and heat fluxes exchanges in small river streams and corridors. Microbolometer cameras capture thermal information at blackbody or radiometric settings (narrowband emissivity equates to unity). While it is customary that the modeler uses assumed emissivity values (e.g. 0.99–0.96 for agricultural and environmental settings); some applications (e.g. Vegetation Health Index), and complex models such as energy balance-based models (e.g. evapotranspiration) could benefit from spatial estimates of surface emissivity for true or kinetic temperature mapping. In that regard, this work presents an analysis of the spectral characteristics of a microbolometer camera with regard to emissivity, along with a methodology to infer thermal emissivity spatially based on the spectral characteristics of the microbolometer camera. For this work, the MODIS UCBS Emissivity Library, NASA HyTES hyperspectral emissivity, Landsat, and Utah State University AggieAir UAV surface reflectance products are employed. The methodology is applied to a commercial vineyard agricultural setting located in Lodi, California, where HyTES, Landsat, and AggieAir UAV spatial data were collected in the 2014 growing season. Assessment of the microbolometer spectral response with regards to emissivity and emissivity modeling performance for the area of study are presented and discussed.
Keywords: Thermal emissivity, land surface temperature, UAV, microbolometer camera, NASA HYTES, MODIS Emissivity, Landsat
1. INTRODUCTION
A major goal of thermal remote sensing is the estimation of the true (kinetic) surface temperature due to its usefulness in diverse applications such as modeling energy balance 1–6, vegetation conditions 7,8, environmental stressors effects, and climate change 9–11. The importance of thermal remote sensing in agriculture has been demonstrated at scales from global to regional and from farm to sub-plant, the latter scale being addressed by infrared temperature sensors 12 and microbolometer cameras 13,14 Infrared sensors and microbolometer cameras differ from the technologies used in satellite missions. The main difference is the lack of “cooling” mechanisms to maintain the sensor at a constant operating temperature. Microbolometer cameras require additional procedures to stabilize the operation conditions before and during use, thus avoiding “drift” conditions that are difficult to correct/adjust after data collection 15–17 Furthermore, infrared sensors and microbolometer cameras have, by design, different spectral characteristics 18–20, making them distinct from the spectral characteristics from scientific satellite missions (Landsat, MODIS, ASTER, ECOSTRESS) 21–25 as seen in Figure 1.
Figure 1.
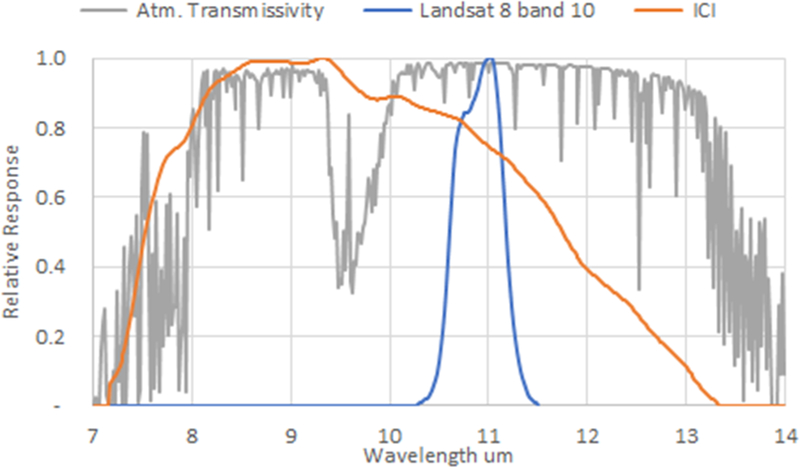
Spectral Response of the average Atmospheric Transmissivity, Landsat 8 Band 10 and ICI 9640-P26 Microbolometer Camera Relative Spectral Response in the 7 to 14 um region. Notice the spectral width of Landsat Band 10 vs ICI.
As shown in Fig.1, due to its spectral response, any microbolometer camera will be affected by the reduction in atmospheric transmissivity at the beginning and end of the spectral thermal windows and, additionally, by the significant atmospheric absorption due to Ozone molecules (“dip” in atmospheric transmissivity between 9 and 10 um). Furthermore, Landsat and other scientific thermal satellites choose a narrow spectral width to avoid a reduction in thermal signal due to atmospheric transmissivity. Microbolometer sensors technology rely on the width of the thermal spectral window to capture an adequate number of photons for thermal measurements. Therefore, it is expected that the spectral response of microbolometer cameras will affect kinematic temperature estimation procedures and prompting for methodologies to make them equivalent to satellite thermal products.
Regarding kinematic and sensor (blackbody) temperature, the spectral response of the thermal sensor is vital towards the estimation of the true (or Kinematic) surface temperature. The relationship between radiometric and the kinematic temperature can be approximated as shown here 27,28:
| (1) |
There Trad is the radiometric temperature (Kelvin) measured by the temperature sensor (Landsat or microbolometer), Tkin is the surface or kinematic temperature (Kelvin) and 8 is the thermal emissivity of the surface being measured. This emissivity is also called narrowband emissivity, due to its relationship to the spectral characteristics of the sensor measuring Trad. This equation can be considered valid only for very small distances between the sensor and the surface (1 to ~3m). A complete solution of the atmospheric transmissivity is required for longer distances (which includes UAVs, aircraft, and satellites) and is described in several publications 13,29–32.
Thermal emissivity is a property of every surface and is influenced by the characteristics of the surface, such as spectral response, reflectance, roughness, thickness, water content, and energy amount (kinetic energy). Emissivity is typically reported in educational literature as an average value within the 8 to 14μm range 27,28. For satellite temperature applications, a significant effort is made to estimate narrowband emissivity based on the spectral response of the sensor as presented here 33–35:
| (2) |
Where ελ is the emissivity value for a wavelength λ, and fλ is the spectral response of the sensor for a specific waveband. The integral of fλ is equal to unity, and λ1 and λ2 are the limits of the spectral response of the sensor. Details of the derivation of Equation 2 can be found here 33.
Given the spectral differences between satellite and microbolometer thermal sensors, the objectives of this study are twofold: (1) determine the impact of the spectral response of a microbolometer thermal sensor, (the ICI 9640-P Series radiometric camera 26), on the estimation of narrowband emissivities and surface temperature for agricultural and environmental environments, and (2) develop an initial model for spatially estimating narrowband emissivity that responds to the microbolometer camera characteristics based on optical and infrared information from Landsat / AggieAir UAV sensors.
2. METHODS
Relative to the first objective, the University of Notre Dame performed a laboratory test on the ICI 9640-P camera following a published procedure 36 to derive the lens plus microbolometer sensor spectral response that is presented in Fig. 1. Hyperspectral emissivity information for different agricultural and natural environment surface conditions in the 3 to 14 μm range was acquired from the MODIS UCSB Emissivity Library37 for assessment of narrowband emissivities for ICI and Landsat. Relative to the second objective, hyperspectral spatial information was retrieved from the NASA JPL
Hyperspectral Thermal Emission Spectrometer-HYTES airborne Program for multiple commercial agricultural vineyards located in California. These vineyards are part of the Grape Remote sensing Atmospheric Profile & Evapotranspiration experiment GRAPEX 38. Details of the HYTES sensor and technology can be found here 39–42 with a list of flown locations up to date here 43. For the area of study, the spatial emissivity information covered different agricultural lands, (vineyards, alfalfa) and natural environments as presented in Fig. 2.
Fig 2.
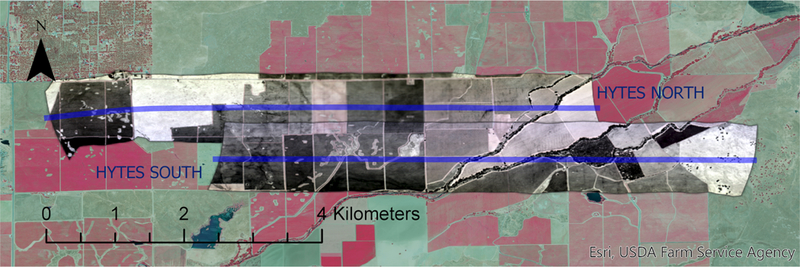
2014 NASA HYTES bands 150 (10.1 μm), 100 (9.2 μm), and 58 (8.5 μm) overpass over multiple vineyards and natural areas near Galt, CA. Two HYTES flights on the same date and time (NORTH and SOUTH, blue lines indicate flights) are included for this study.
Landsat ETM+ Surface Reflectance Product is available from USGS44 for the same date as the HYTES airborne flights. In addition, AggieAir optical information was captured in the same growing season at a later date but in conjunction with Landsat 7 overpasses. Details on the thermal sensors’ characteristics are presented in Table 1. Details on dates and times for HYTES, Landsat, and AggieAir are presented in Table 2.
Table 1:
NASA JPL HYTES and ICI 9640-P Characteristics and Products
| INSTRUMENT | Spectrometer | Thermal Camera |
|---|---|---|
| Brand/Model | JLP HYTES | ICI/9640-P |
| Weight (gr) | 12000 | 141 |
| Image Size (pixel) | 512 per track | 640 by 480 |
| Ground Resolution (m) | ~6 | ~0.6 |
| Sensor Type | pushbroom | snapshot |
| Spectral Range (μm) | 7.5–12 | 7 – 14 |
| Number of Bands | 256 | 1 |
| Spectral Band Centre (μm) | 9.75 | 10.35 |
| Operating Range | N/A | −40 to 140°C |
| Reported Accuracy | N/A | +/− 1.0°C |
| Reported Emissivity | per band | 1.0 |
| NIST Traceable? | N/A | NOT REPORTED |
| Available product | Surface temperature Hyperspectral Emissivity | Blackbody Temperature |
Table 2.
Spatial Products and Capture Times
| Spatial Product |
Spatial Information | Ground Resolution (m) |
Capture Date and Time (PST) |
|---|---|---|---|
| NASA JPL HYTES | Hyperspectral Emissivity | 6 | 2014–07-09 13:23 |
| Landsat ETM+ | Surface Corrected Reflectance | 30 | 2014–07-09 10:36 |
| AggieAir | High-Resolution Reflectance and Temperature | 0.15 Reflectance 0.60 Temperature | 2014–08-09 10:36 |
It is evident from Table 2 that a direct comparison of surface temperature between HYTES and NASA ETM+ is not possible due to the time difference (~3 hours), nor is a comparison between AggieAir, HYTES, and Landsat possible due to dates. The proposed procedure for Objective (2) is as follows:
The estimation of spatial emissivity using HYTES information tailored to the ICI microbolometer spectral response is based on several steps as shown in Fig. 4. The first step is the derivation of an HYTES emissivity product that responds to the ICI spectral response from Eq. 2. The ICI emissivity is then linearly aggregated to Landsat spatial scale for reflectance-emissivity model estimation. On the AggieAir UAV date, UAV reflectance information is “harmonized” to Landsat reflectance characteristics based on the work described here 45 taking advantage of the same data collection timing. Lastly, the reflectance-emissivity model is applied to harmonized AggieAir reflectance for estimation of emissivity at UAV resolution (0.15m).
Fig. 4.
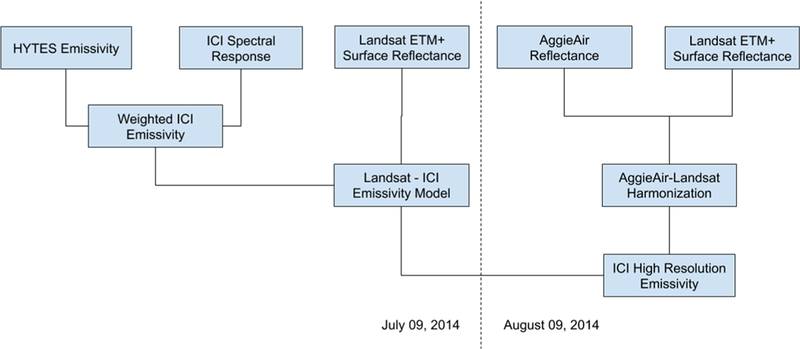
Flowchart for Estimation of High-Resolution Emissivity for ICI Cameras
3. RESULTS
3.1. Hyperspectral Emissivity Analysis for Landsat and ICI thermal sensors
Based on spectral emissivity curves available in the MODIS UCBS Emissivity Library, three major groups are considered for this analysis: water, vegetation, and soil. Not all vegetation nor soil types are available in MODIS UCBS, thus a representative set is analyzed. The emissivity spectral responses for these three major groups, along with Landsat and ICI spectral responses, are presented in Fig. 5. In addition, computation of the Landsat and ICI emissivities using Equation 2 along with emissivity typically reported in the 8–14um spectral range for the evaluated groups are presented in Table 3.
Fig. 5:
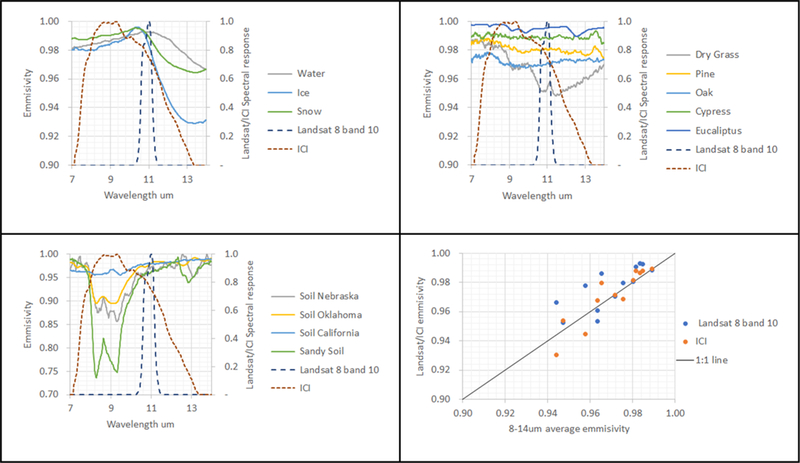
Emissivity comparison based on MODIS UCBS Emissivity Library, Landsat and ICI spectral response for water surfaces (top left), vegetation (top right), and soil (bottom left), and a comparison of derived emissivities for Landsat and ICI vs reported 8–14um (bottom left). It is evident that emissivity values agree for water, agree less for vegetation but not for soil surfaces.
Table 3:
Summary of emissivity values presented in Fig.5 for 8–14um, Landsat and ICI thermal sensors using MODIS UCBS Emissivity Library.
| Material | 8–14um | Landsat | ICI |
|---|---|---|---|
| Water | 0.98 | 0.99 | 0.99 |
| Ice | 0.97 | 0.99 | 0.98 |
| Snow | 0.98 | 0.99 | 0.99 |
| Soil Nebraska | 0.94 | 0.97 | 0.93 |
| Soil Oklahoma | 0.96 | 0.98 | 0.94 |
| Soil California | 0.98 | 0.98 | 0.97 |
| Sandy Soil | 0.96 | 0.96 | 0.89 |
| Dry Grass | 0.96 | 0.95 | 0.97 |
| Pine | 0.98 | 0.98 | 0.98 |
| Oak | 0.97 | 0.97 | 0.97 |
| Cypress | 0.99 | 0.99 | 0.99 |
| Eucalyptus | 0.95 | 0.95 | 0.95 |
It is evident that the spectral response of the thermal sensor plays a role in the narrowband emissivity estimates as shown in Fig. 5 and Table 3. Typical 8–14um averages for water surfaces agree with Landsat 8 and ICI sensors, as the differences between emissivity values are small. A similar affirmation can be made for vegetation. Nevertheless, for soil surfaces, the ICI sensor diverges from 8–14um and Landsat emissivities, depending on the soil type present, but it is clear that emissivity for sandy soils will diverge more. This divergence in emissivity for soils and sandy surfaces has been documented previously 46, is due to strong quartz absorption. To further estimate the magnitude of the effects of emissivity for Landsat and ICI sensors, differences between kinetic and sensor temperature from 0 to 70 degrees Celsius for water, vegetation and soil are calculated and presented in Fig. 6.
Fig. 6.
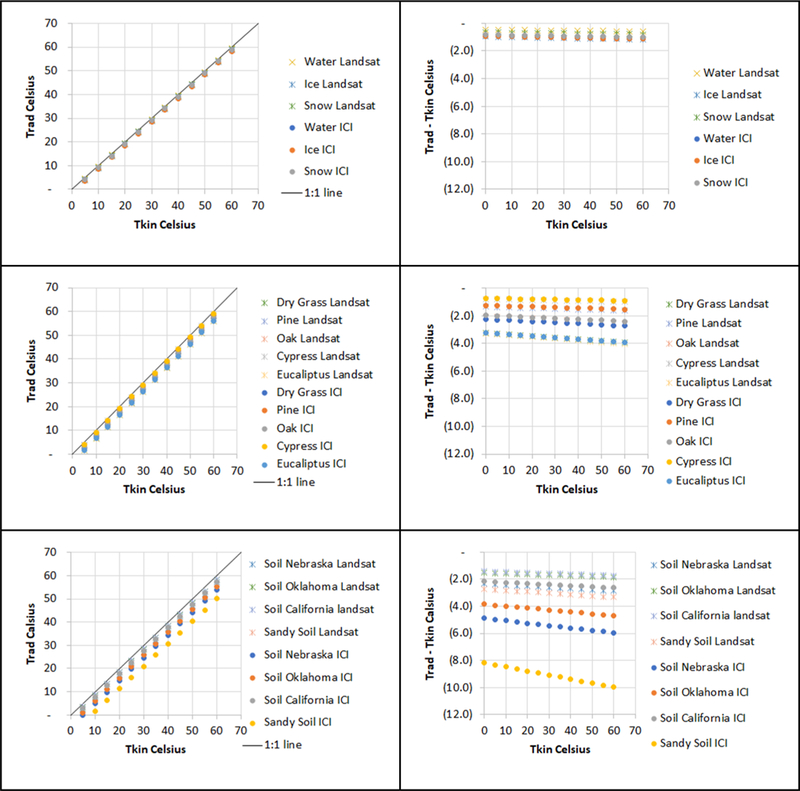
Kinetic and Radiation Temperatures comparison (left column) and differences (right column) based on Landsat and ICI emissivities for water (top row), vegetation (middle row) and soil (bottom row). Note the agreement of Landsat and ICI for water (< 2 degrees Celsius), and for vegetation (<4 degrees Celsius). Soil surfaces present a significantly larger difference for ICI than for Landsat.
The results presented in Fig. 6 for kinematic and radiometric temperatures using Landsat or ICI indicates that the spectral response of the microbolometer camera affects the kinetic temperature estimates of soils to a greater magnitude than for vegetation or water. For Landsat, the expected maximum temperature difference across all evaluated surface groups is up to 4 degrees Celsius. For the ICI camera, the difference can be up to 10 degrees Celsius. This comparison indicates that care must be taken when mapping soil surfaces for energy balance methodologies due to the larger emissivity correction needed when using microbolometer cameras.
3.2. ICI Emissivity Model
As described in Section 2 and Figure 4, an HYTES emissivity product that responds to the ICI spectral response derived for the two HYTES flights (North and South) was scaled to Landsat resolution and is presented in Fig. 7.
Fig.7.
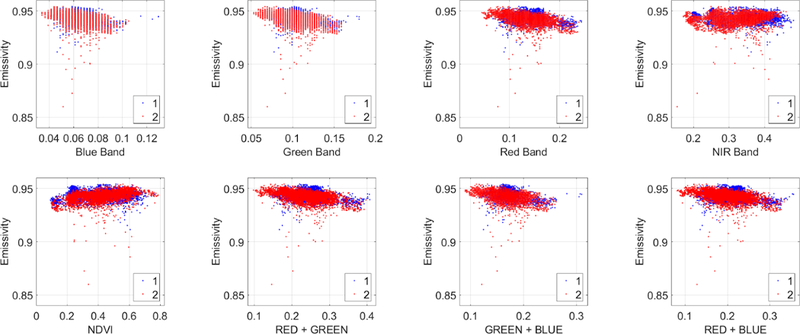
HYTES ICI derived emissivity at Landsat scale vs spectral bands (Blue, Green, Red, and NIR) and band combination from Landsat. SWIR bands are not considered due to lack of an equivalent in AggieAir UAV sensors. Blue and Red scatter color (named 1 and 2) are the HYTES North and South, respectively.
It is evident from the comparison of Landsat optical spectral bands and combinations and HYTES ICI emissivity values in Fig. 7, that the correlation is limited or weak. In every presented scatterplot, a linear trend is clear, but with a considerable variance along the trend, indicating significant limitations for linear modeling of emissivity. Nonetheless, an initial approach that considers a linear combination of spectral bands from Landsat is presented below (Table 4 and Fig. 8).
Table 4.
Performance of a Linear model for ICI emissivity estimation based on Landsat bands
| Model | Inputs | Coefficients | Fit Statistics |
|---|---|---|---|
| y = a + b*×1^2 +c* ×2^2 + d*×3^2 + e*×1 | x1:GREEN x2:NIR x3:NDVI |
a:0.943 b:−0.615 c:−0.056 d:−0.005 e:0.042 |
Obs: 9600 RMSE: 0.004 |
Fig. 8.
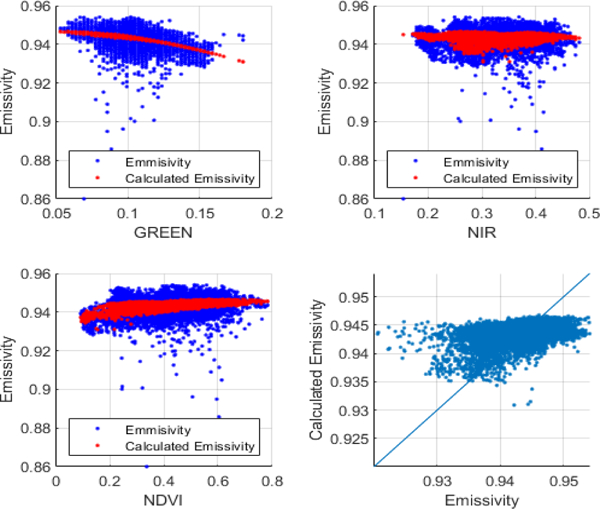
Performance of a Linear model for ICI emissivity estimation based on Landsat reflectance products.
Table 4 and Fig. 8 show that a linear model based on reflectance and vegetation indices has a limited prediction capability due to the weak linear relationship between Landsat spectral bands and the HYTES ICI emissivity. A second approach, based on machine learning (Regression Decision Tree) 47 and implemented in MATLAB (function fitrtree) is implemented as shown below:
The implemented Regression Decision Tree model provided a more adequate ICI derived emissivity estimation than the linear model. Nevertheless, the 1:1 comparison provided in Fig 8, indicates that the model can benefit from additional efforts in input variables and additional HYTES and Landsat datasets. Figs. 9 and 10 show the derivation of ICI emissivity at 0.15m/pixel using the Landsat/AggieAir UAV harmonized reflectance products.
Fig. 9.
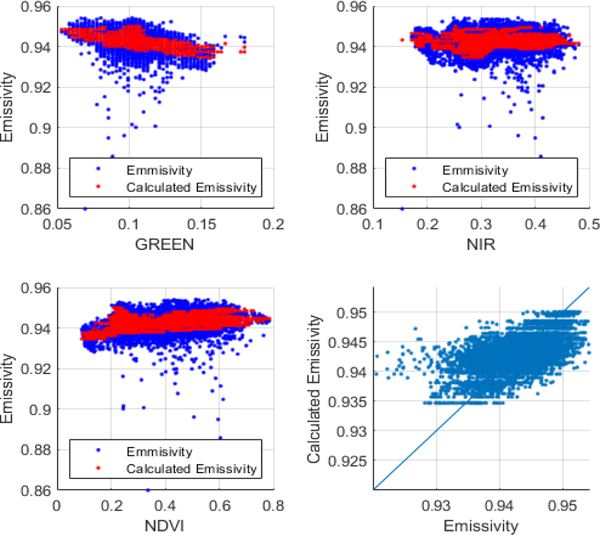
Performance of a Regression Decision Tree model for ICI emissivity estimation based on Landsat optical bands.
Fig. 10.
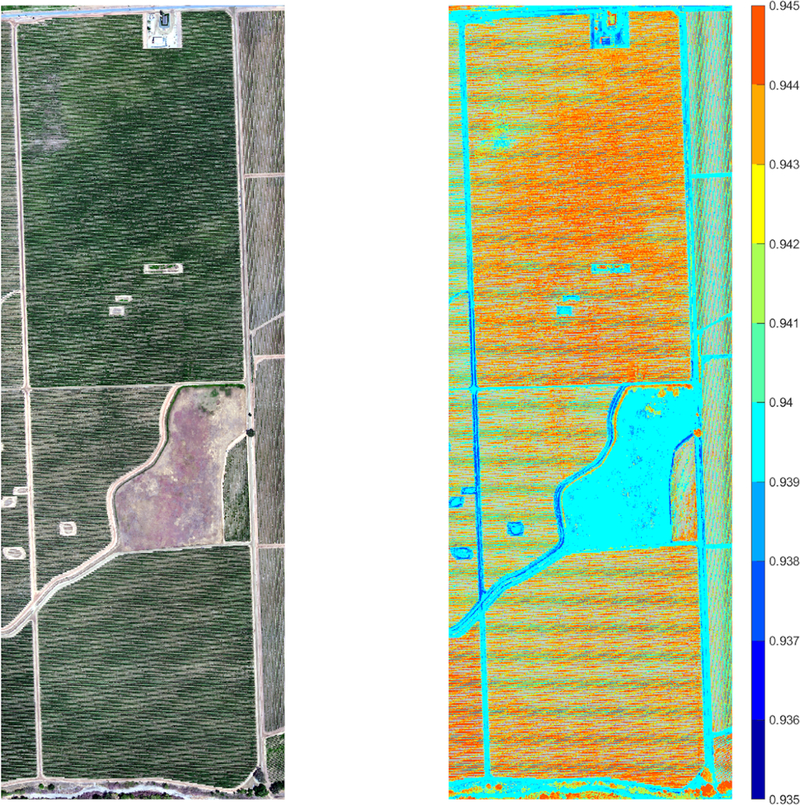
Estimation of High-resolution ICI emissivity using HYTES -Landsat Regression Decision Tree and AggieAir reflectance. Emissivity values range from 0.935 to 0.945. The model provides a clear differentiation between bare soil (soil and service roads) and vegetation (vineyards and forest)
4. CONCLUSIONS
Thermal emissivity is an important property that is necessary for quantification of kinematic or true surface temperature. Microbolometer technology allows for high-resolution thermal mapping from UAVs and airborne sensors, and the captured information can be enhanced by understanding the spectral characteristics of the microbolometer and its effects on the estimation of thermal emissivity.
This study shows that the spectral response of microbolometer cameras will affect the estimation of kinematic temperatures, due to different emissivity estimates than provided in the literature, and significantly diverge for soil surfaces. Furthermore, the relationship between a microbolometer emissivity (in this case an ICI camera) and reflectance products from Landsat (RGBNIR) is weak, requiring non-linear (i.e. machine learning) approaches for emissivity modeling. The Regression Decision Tree model applied to HYTES ICI derived emissivity and Landsat reflectance was proven to adequately perform for AggieAir high-resolution reflectance information, indicating its suitability for spatial estimation of microbolometer emissivity. While the presented work is an initial approach to estimating emissivity for microbolometer cameras, further work including additional HYTES datasets for different times and locations would refine and improve the accuracy of the estimation of emissivity. In addition, an extended emissivity analysis of microbolometer cameras can be performed by including additional emissivity datasets such as the ASTER spectral library 48 for manmade surfaces and urban settings as well as more diverse agricultural vegetation. Furthermore, this work has not considered the effect of changes in water content in vegetation (morning dew, sprinklers) nor soil (after irrigation or rainfall), both of which can cause emissivity values to increase with larger water content and decrease with the diurnal cycle 49.
Fig 3.
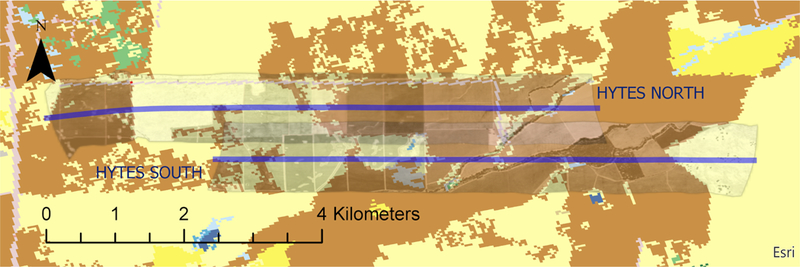
2014 NASA HYTES bands 150 (10.1 μm), 100 (9.2 μm), and 58 (8.5 μm) overpass, along with 2011 National Land Cover Database (NLCD). (Brown color indicates cultivated lands and yellow Grassland/Herbaceous). Note that in several locations 2011 NLCD classes do not correspond to 2014 agricultural development.
Fig 11:
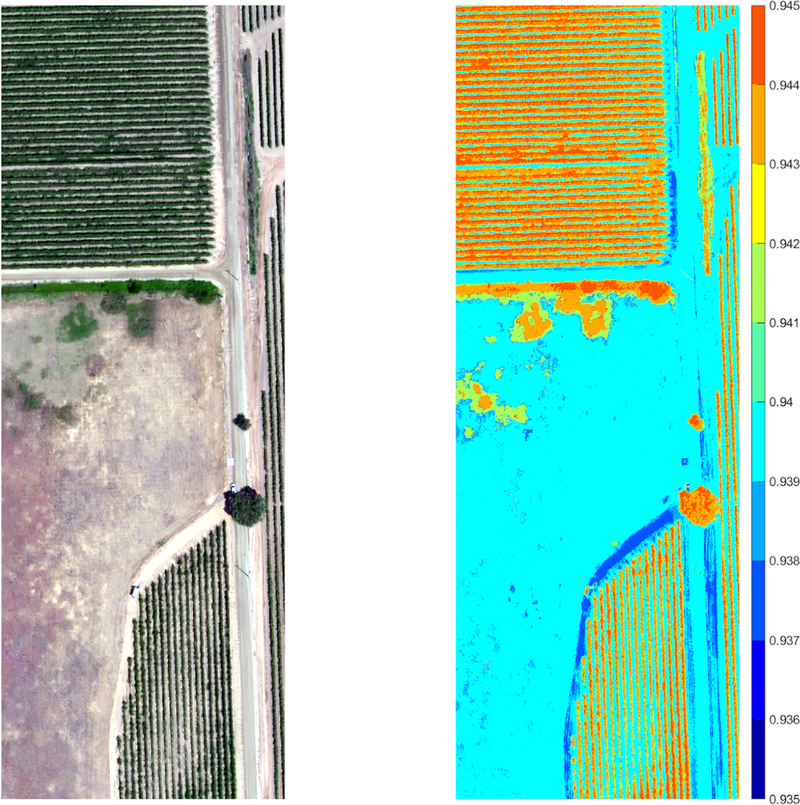
Close Up of Harmonized Landsat/AggieAir reflectance and derived ICI emissivity map.
Table 5.
Performance of a Regression model for ICI emissivity estimation based on Landsat bands
| Model | Inputs | Calibration scheme |
Fit Statistics |
|---|---|---|---|
| Regression Decision Tree | BLUE GREEN RED NIR |
70% Training 30% Testing |
Obs: 9600 RMSE: 0.004 |
Acknowledgement
This project was supported by USDA-ARS Hydrology and Remote Sensing Laboratory, NNX17AF51G award from NASA, and by the Utah Water Research Laboratory at Utah State University. The authors wish to thank E&J Gallo Winery for their continued collaborative support of this research, and the AggieAir UAV Remote Sensing Group at the Utah Water Research Laboratory for their UAV technology and their skill and hard work in acquiring the scientific quality, high-resolution aerial imagery used in this project.
REFERENCES
- [1].KUSTAS WP, ALFIERI JG, NIETO H, WILSON TG, GAO F AND ANDERSON MC, “UTILITY OF THE TWO-SOURCE ENERGY BALANCE (TSEB) MODEL IN VINE AND INTERROW FLUX PARTITIONING OVER THE GROWING SEASON,” IRRIG. SCI. (2018). [Google Scholar]
- [2].Nieto H, BELLVERT J, KUSTAS WP, ALFIERI JG, Gao F, PRUEGER J, TORRES-RUA AF, HIPPS LE, ELARAB M AND SONG L, “UNMANNED AIRBORNE THERMAL AND MULTISPECTRAL IMAGERY FOR ESTIMATING EVAPOTRANSPIRATION IN IRRIGATED VINEYARDS,” 2017 IEEE International Geoscience and Remote Sensing Symposium (IGARSS), 5510–5513 (2017). [Google Scholar]
- [3].KILIC a., Allen R, TREZZA R, RATCLIFFE I, KAMBLE B, ROBISON C and OZTURK D, “Sensitivity of évapotranspiration retrievals from the METRIC processing algorithm to IMPROVED RADIOMETRIC RESOLUTION OF LANDSAT 8 THERMAL DATA AND TO CALIBRATION BIAS IN Landsat 7 and 8 surface temperature,” Remote Sens. Environ. 185, 198–209 (2016). [Google Scholar]
- [4].Anderson M. c., Allen R. g., Morse A and KUSTAS W. p., “Use of Landsat thermal IMAGERY IN MONITORING EVAPOTRANSPIRATION AND MANAGING WATER RESOURCES,” REMOTE SENS. ENVIRON. 122, 50–65 (2012/7). [Google Scholar]
- [5].LIOU Y-A AND KAR SK, “EVAPOTRANSPIRATION ESTIMATION WITH REMOTE SENSING AND Various Surface Energy Balance Algorithms—A Review,” Energies 7(5), 2821–2849 (2014). [Google Scholar]
- [6].Hoffmann h., Nieto h., Jensen r., GUZINSKI r., ZARCO-Tejada P and FRIBORG t., “Estimating evaporation with thermal UAV data and two-source energy balance models,” HYDROL. Earth Syst. SCI. 20(2), 697–713 (2016). [Google Scholar]
- [7].Carlson TN, “Recent Advances in Modeling the Infrared Temperature of Vegetation Canopies,” [Land Surface Evaporation], 349–358 (1991). [Google Scholar]
- [8].ALAMDARLOO E. h., MANESH MB AND KHOSRAVI H, “PROBABILITY ASSESSMENT OF VEGETATION vulnerability to drought based on remote sensing data,” Environ. MONIT. Assess. 190(12), 702 (2018). [DOI] [PubMed] [Google Scholar]
- [9].Roy D. p., WULDER M. a., Loveland T. r., C.E., w, Allen R. g., Anderson M. c., HELDER D, Irons J. r., Johnson D. m., Kennedy r., SCAMBOS T. a., SCHAAF C. b., Schott J. r., Sheng y., VERMOTE EF, BELWARD AS, BINDSCHADLER r., Cohen W. b., Gao f., et al. , “Landsat-8: Science and product vision for terrestrial global change research,” Remote Sens. Environ. 145, 154–172 (2014). [Google Scholar]
- [10].Ji f., Wu Z, Huang J and CHASSIGNET E. p., “Evolution of land surface air temperature trend,” Nat. CLIM. Chang. 4(6), 462–466 (2014). [Google Scholar]
- [11].Ho HC, Abbas s., Yang j., Zhu R and Wong M. s., “SPATIOTEMPORAL Prediction of Increasing Winter Perceived Temperature across a Sub-Tropical City for Sustainable Planning and Climate Change Mitigation,” Int. J. Environ. Res. Public Health 16(3) (2019). [DOI] [PMC free article] [PubMed] [Google Scholar]
- [12].Torres-RUA a., Nieto h., Parry c., ELARAB m, COLLATZ w., COOPMANS C, McKee L, McKee M and KUSTAS w., “Inter-comparison of thermal measurements using ground- based SENSORS, UAV THERMAL CAMERAS, AND EDDY COVARIANCE RADIOMETERS,” AUTONOMOUS Air and Ground Sensing Systems for Agricultural Optimization and Phenotyping III 10664, 106640E, International Society for Optics and Photonics; (2018). [DOI] [PMC free article] [PubMed] [Google Scholar]
- [13].Torres-RUA a., “Vicarious Calibration of SUAS MICROBOLOMETER Temperature Imagery for Estimation of Radiometric Land Surface Temperature,” Sensors 17(7) (2017). [DOI] [PMC free article] [PubMed] [Google Scholar]
- [14].RIBEIRO-GOMES k., HERNÁNDEZ-LÓPEZ D, ORTEGA JF, BALLESTEROS R, POBLETE T AND Moreno M. a., “Uncooled Thermal Camera Calibration and Optimization of the Photogrammetry Process for UAV Applications in Agriculture,” Sensors 17(10) (2017). [DOI] [PMC free article] [PubMed] [Google Scholar]
- [15].STRAKOWSKI R and WIECEK b., “Temperature drift compensation in metrological MICROBOLOMETER camera using multi sensor approach,” Proceedings of the 2016 International Conference on Quantitative Infrared Thermography (2016). [Google Scholar]
- [16].DE VRIES J, “In-situ calibration of A MICROBOLOMETER camera for the study of large-scale FIRES,” THERMOSENSE: THERMAL INFRARED APPLICATIONS XXXV (2013). [Google Scholar]
- [17].KRUPIŃSKI M, BAREŁA J, KASTEK M and CHMIELEWSKI K, “Test stand for determining PARAMETERS OF MICROBOLOMETER CAMERA,” ELECTRO-OPTICAL AND INFRARED SYSTEMS: Technology and Applications XIII (2016). [Google Scholar]
- [18].“Apogee Instruments.”, 2010, <http://www.apogeeinstruments.com/infraredradiometer/> (24 February 2017 ).
- [19].“FLIR Systems.”, <http://www.flir.com/home/> (22 December 2016 ).
- [20].“Thermal Infrared Cameras, Service & Software.”, HTTPS://WWW.INFRAREDCAMERAS.COM (27 February 2019 ).
- [21].STOREY J, Choate M and Moe D, “Landsat 8 Thermal Infrared Sensor Geometric Characterization and Calibration,” Remote Sensing 6(11), 11153–11181 (2014). [Google Scholar]
- [22].XIONG X, Chiang V, Chen N and Barnes WL, “Aqua MODIS thermal emissive bands CALIBRATION ALGORITHM AND PRELIMINARY RESULTS,” EARTH OBSERVING SYSTEMS VII (2002). [Google Scholar]
- [23].DONLON C, BERRUTI B, BUONGIORNO A-H, FERREIRA M, FEMENIAS P, FRERICK J, GORYL P, Klein U, LAUR H, MAVROCORDATOS C, NIEKE J, REBHAN H, Seitz B, STROEDE J and SCIARRA R, “The Global Monitoring for Environment and Security (GMES) Sentinel-3 mission,” Remote Sens. Environ. 120, 37–57 (2012). [Google Scholar]
- [24].HULLEY G, HOOK S, FISHER J AND LEE C, “ECOSTRESS, A NASA EARTH-VENTURES Instrument for studying links between the water cycle and plant health over the DIURNAL CYCLE,” 2017 IEEE INTERNATIONAL GEOSCIENCE AND REMOTE SENSING SYMPOSIUM (IGARSS) (2017). [Google Scholar]
- [25].PALLUCONI FD, “VALIDATION OF THE ASTER THERMAL INFRARED SURFACE RADIANCE DATA product,” Earth Observing System (1996). [Google Scholar]
- [26].“9640 P-SERIES | USB CALIBRATED THERMAL CAMERA WITH TEMPERATURE MEASUREMENT | Infrared Cameras Inc”, Infrared Cameras Inc., HTTPS://WWW.INFRAREDCAMERAS.COM. (4 March 2019. ). [Google Scholar]
- [27].Jensen JR, [Remote Sensing of the Environment: An Earth Resource Perspective 2/e], Pearson Education India; (2009). [Google Scholar]
- [28].KUZNETSOV A, MELNIKOVA I, POZDNYAKOV D, SEROUKHOVA O and VASILYEV A, [Remote Sensing of the Environment and Radiation Transfer: An Introductory Survey], Springer Science & Business Media; (2012). [Google Scholar]
- [29].BERNI JAJ, ZARCO-TEJADA PJ, SUAREZ L AND FERERES E, “THERMAL AND NARROWBAND MULTISPECTRAL REMOTE SENSING FOR VEGETATION MONITORING FROM AN UNMANNED AERIAL Vehicle,” IEEE Trans. GEOSCI. Remote Sens. 47(3), 722–738 (2009). [Google Scholar]
- [30].Tardy B, RIVALLAND V, Hue M, HAGOLLE O, MARCQ S and Boulet G, “A Software Tool for Atmospheric Correction and Surface Temperature Estimation of Landsat Infrared Thermal data,” Remote Sensing 8(9), 696 (2016). [Google Scholar]
- [31].ROZENSTEIN O, QIN Z, DERIMIAN Y AND KARNIELI A, “DERIVATION OF LAND SURFACE TEMPERATURE FOR LANDSAT-8 TIRS USING A SPLIT WINDOW ALGORITHM,” SENSORS 14(4), 5768–5780 (2014). [DOI] [PMC free article] [PubMed] [Google Scholar]
- [32].BARSI JA, Barker JL and Schott JR, “An Atmospheric Correction parameter Calculator for a single thermal band earth-sensing instrument,” IGARSS 2003. 2003 IEEE International Geoscience and Remote Sensing Symposium. proceedings (IEEE Cat. NO.03CH37477) 5, 3014–3016 VOL.5 (2003). [Google Scholar]
- [33].Tang B-H, Wu H, Li C and Li Z-L, “Estimation of broadband surface emissivity from NARROWBAND EMISSIVITIES,” OPT. EXPRESS 19(1), 185–192 (2011). [DOI] [PubMed] [Google Scholar]
- [34].HULLEY GC and Hook SJ, “Generating Consistent Land Surface Temperature and Emissivity Products Between ASTER and MODIS Data for Earth Science Research,” IEEE Trans. GEOSCI. Remote Sens. 49(4), 1304–1315 (2011). [Google Scholar]
- [35].HULLEY GC, Hook SJ, Abbott E, MALAKAR N, Islam T and Abrams M, “The ASTER Global Emissivity Dataset (ASTER GED): Mapping Earth’s emissivity at 100 meter spatial scale: Aster Emissivity Dataset,” GEOPHYS. Res. Lett. 42(19), 7966–7976 (2015). [Google Scholar]
- [36].BENIRSCHKE D AND HOWARD S, “CHARACTERIZATION OF A LOW-COST, COMMERCIALLY AVAILABLE, vanadium oxide MICROBOLOMETER array for spectroscopic imaging,” Optical Engineering 56(4), 040502 (2017). [Google Scholar]
- [37].Wan ZM and Zhang Y, “MODIS UCSB emissivity library,” MODIS UCSB Emissivity Library; (1999). [Google Scholar]
- [38].KUSTAS W. p., ANDERSON MC, ALFIERI JG, KNIPPER K, TORRES-RUA A, PARRY CK, NIETO H, AGAM N, White WA, Gao F, McKee L, PRUEGER JH, HIPPS LE, Los S, ALSINA MM, Sanchez L, SAMS B, DOKOOZLIAN N, McKee M, et al. , “The grape remote sensing atmospheric profile and evapotranspiration experiment (GRAPEX),” Bull. Am. METEOROL. SOC. 99(9), 1791–1812 (2018). [DOI] [PMC free article] [PubMed] [Google Scholar]
- [39].Hook SJ, Johnson WR and Abrams MJ, “NASA’s Hyperspectral Thermal Emission Spectrometer (HYTES),” [Thermal Infrared Remote Sensing: Sensors, Methods, Applications], KUENZER C and DECH S, Eds., Springer; Netherlands, Dordrecht, 93–115 (2013). [Google Scholar]
- [40].Johnson WR, Hook SJ, MOUROULIS p. Wilson DW, GUNAPALA SD, Realmuto V, LAMBORN A, Paine C, MUMOLO JM and ENG BT, “HYTES: Thermal imaging spectrometer development,” 2011 AEROSPACE CONFERENCE, 1–8 (2011). [Google Scholar]
- [41].Gillespie A, ROKUGAWA S, Matsunaga T, COTHERN JS, Hook S and KAHLE AB, “A temperature and emissivity separation algorithm for Advanced SPACEBORNE Thermal Emission and Reflection Radiometer (ASTER) images,” IEEE Transactions on Geoscience and Remote Sensing 36(4), 1113–1126 (1998). [Google Scholar]
- [42].SEEMANN SW, BORBAS EE, KNUTESON RO, Stephenson GR and Huang H-L, “Development of a Global Infrared Land Surface Emissivity Database for Application to Clear Sky Sounding Retrievals from Multispectral Satellite Radiance Measurements,” Journal of Applied Meteorology and Climatology 47(1), 108–123 (2008). [Google Scholar]
- [43].“Hyperspectral Thermal Emission Spectrometer.”, <https://hytes.jpl.nasa.gov/> (4 March 2019 ).
- [44].“Landsat Surface Reflectance.”, <https://www.usgs.gov/land-resources/nli/landsat/landsat-surface-reflectance> (1 March 2019 ).
- [45].MAHYAR ABOUTALEBI, Alfonso Torres-RUA, Mac McKee, Hector Nieto, William KUSTAS, John PRUEGER, Lynn McKee, Joseph Alfieri, Lawrence HIPPS, Calvin COOPMANS., “Assessment of Landsat Harmonized SUAS Reflectance Products Using Point Spread Function (PSF) on Vegetation Indices (VIs) and Evapotranspiration (ET) Using the Two-Source Energy Balance (TSEB) Model” (2018). [Google Scholar]
- [46].HULLEY G, MALAKAR N, Hughes T, Islam T and Hook S, “Moderate Resolution Imaging SPECTRORADIOMETER (MODIS) MOD21 LAND SURFACE TEMPERATURE AND EMISSIVITY ALGORITHM THEORETICAL BASIS DOCUMENT,” JPL PUBLICATION 12–17, REV. 2, JET PROPULSION LABORATORY, National Aeronautics and Space Administration; (2016). [Google Scholar]
- [47].BREIMAN L, Friedman J, Stone CJ and OLSHEN RA, [Classification and Regression Trees], CRC Press; (1984). [Google Scholar]
- [48].Baldridge AM, Hook SJ, Grove CI and Rivera G, “The ASTER spectral library version 2.0,” Remote Sens. Environ. 113(4), 711–715 (2009). [Google Scholar]
- [49].Mira M, Valor E, CASELLES V, Rubio E, COLL C, GALVE JM, NICLOS R, Sanchez JM AND BOLUDA R, “SOIL MOISTURE EFFECT ON THERMAL INFRARED (8–13-MM) EMISSIVITY,” IEEE Trans. GEOSCI. Remote Sens. 48(5), 2251–2260 (2010). [Google Scholar]


