

Abstract
We have discovered a new class of pyrido[b]bindole derivatives that show potent and broad spectrum anticancer activity with IC50 values down to submicromolar levels. Structure-activity relationship data acquired with the compounds as antiproliferative agents against several cancer cell lines, i.e. human HCT116 colon cancer cell line, and HPAC, Mia-PaCa2 and Panc-1 pancreatic cancer cell lines, were subjected to two different QSAR modeling methods. A kernel-based partial least squares (KPLS) regression analysis with chemical 2D fingerprint descriptors, and a PHASE pharmacophore alignment with 3D-QSAR study. The KPLS method afforded successful predictive QSAR models for antiproliferative activity of the HCT116 colon cell line and on two of the pancreatic cancer cell lines HPAC and Mia-PaCa2, with the following statistics: R2s of 0.99, 0.99 and 0.98, for training set coefficients of determination, and external test set predictive r2s of 0.70, 0.58 and 0.70, respectively. The best 2D fingerprint descriptor for both the HCT116 and HPAC data out of the eight finger prints utilized was the atom triplet fingerprint; whereas the one that worked best for the Mia-PaCa2 data was the linear fingerprint descriptor. The PHASE pharmacophore based 3D-QSAR study afforded a four-point pharmacophore model comprising one hydrogen bond donor (D) and three ring (R) elements, which yielded a successful 3D-QSAR model only with the HCT116 cell line data with training set R2 of 0.683, and an external test set predictive r2 of 0.562. With the PHASE 3D-QSAR, the influence of electronic effects and hydrophobicity were visualized, and were in agreement with the observed SAR of substitutions, while the KPLS method the relative extent of contribution of each atom in a compound to the activity. These models will foster the lead optimization process for this potent series of anticancer pyrido [3,4-b]indole compounds.
Keywords: KPLS, Fingerprints, 3D-QSAR, anticancer activity, beta-carboline, Pharmacophore
Introduction
Quantitative structure-activity relationship (QSAR) methodology which derives mathematical relationships between molecular structural descriptors and/or properties and biological activity of molecules is one of the most effective ways to understand the structure and activity relationship and device predictive models for designing new chemical entities. In this case, we have antiproliferative data on a series of compounds which an example has exhibited inhibition of the oncoprotein MDM2, as a possible mechanism of anticancer activity (Wang et al. 2014a and 2014b). However, even though we show an interaction of the lead compound SP141 designated here as compound 10 with MDM2 (Wang et al. 2014a), at this point we do not know where it binds to the protein at the atomic level. Thus, a QSAR methodology with the currents series will be a major way forward for understanding in more detail the chemical structural determinants of antiproliferative activity and for constructing predictive models for new compound design. To achieve this goal, we have applied two QSAR methods: 1) Kernel based partial least square analysis (KPLS) using fingerprints and 2) pharmacophore alignment-based 3D-QSAR.
Fingerprints are a set of descriptors that are easy to assemble into a “string” that characterizes a compound. These descriptors can be binary, numeric (integers, real numbers, etc.) or categorical. Fingerprints-based similarity analysis offers a wide variety of possibilities in terms of fragment-based strategies, atom/bond typing schemes, bit scaling rules, and in crafting similarity indices (Willett et al. 2006; Canvas user manual 2015; Duan et al. 2010; Sastry et al. 2010; Hert et al. 2005). Thus, fingerprints are very useful in studying features responsible for biological of activity of molecules. In the present study, a QSAR model generated using the Kernel based partial least square analysis (KPLS) using fingerprints as a molecular descriptor. The KPLS was combined with the 2D fingerprints definitions implemented in the Canvas module of the Schrodinger software suit, to obtain predictive QSAR models. KPLS is a nonlinear Gaussian kernel method with a higher predictive ability than conventional statistical methods (Rosipal et al. 2003). It is an extension of partial least-squares regression that introduces some nonlinearity into the scalar products of the X variables used in the regression via a “kernel”, which is a nonlinear function of the scalar products (Duan et al. 2010; An et al. 2013). In the present study, we studied the relationship between fingerprints and molecular structures to derive KPLS-based quantitative structure-activity relationship (QSAR) models for understanding structural features important for the biological activity.
In addition to the KPLS analysis, we also studied the data using a pharmacophore mapping and 3D-QSAR approach. A pharmacophore is an important and unifying concept in rational drug design that is based on the notion that compounds are active at a particular enzyme or receptor because they possess a number of chemical features that favorably interact with the target and which has a particular 3D geometrical orientation complementary to target binding site (Marriott et al. 2010). Thus we applied pharmacophore modelling and atom-based 3D-QSAR development to this series of beta-carboline anticancer compounds using the PHASE (Pharmacophore Alignment and Scoring Engine) program (Marriott et al. 2006) and flexible system for common pharmacophore identification and assessment, 3D-QSAR model development and 3D database creation and searching tool implemented in the Schrodinger modeling suite.
METHODS
Kernel-Based Partial Least-Squares Regression
Eight different 2D fingerprint descriptors as implemented in the cheminformatics package Canvas 1.7 of the Schrodinger Suite were applied to the datasets of beta-carboline derivatives tested activity against HCT116 (colon cancer, CC), HPAC (pancreatic cancer, PC), or Mia-PaCa2 (PC) cancer cell lines for developing QSAR models. The 2D fingerprints included seven hashed type fingerprints Linear, Dendritic, Radial, MOLPRINT2D, Pairwise, Triplet, and Torsion as well as 1 structural key type fingerprint MACCS (Duan et al. 2010; Sastry et al. 2010; Hert et al. 2005). The numbers of molecules used in the QSAR studies were 27, 42 and 42 for HCT116, HPAC, and Mia-PaCa2 cell lines, respectively. The IC50 μM activity was converted to –logIC50 (pIC50) as dependent (Y) variables. Molecules were energy-minimized and then used for defining the 2D fingerprints used as independent (X) variable and combined with the pIC50 values for the KPLS QSAR analysis. The KPLS factor of 1 used was 5, while Kernel nonlinearity was retained at the default value of 0.05. The uncertainty in the predictions for the test sets were calculated using a bootstrapping method run for 10 cycles each. Bootstrapping was done by sampling the training set randomly with replacement to generate a new analysis is set of the same size (that may include compound duplicates), building a model and making predictions of the test set, and then repeating the procedure a specified number of times. The standard deviation from the original test set is then calculated as the uncertainty.
The detailed description of these methods and the general application of 2D fingerprints are given below. For hashed finger prints, the Linear descriptor is obtained by performing a hashing operation on a string-based description of a linear fragment which contains up to seven bonds mapped to a structure. The maximum path is expanded from seven to fourteen bonds for ring closure to improve the description of rings without causing a massive proliferation in the number of fragments. The Dendritic fingerprints encodes both linear and branched features, linear paths are augmented with intersections of linear paths, with a maximum of five bonds, with no special treatment of rings. Radial fingerprints also known as extended connectivity finger prints (ECFPs) are obtained by growing a set of fragments radially from each heavy atom over a series of iterations. Using a variant of the Morgan algorithm, each chemically unique fragment is mapped to a distinct integer value by hashing a description of the atoms and bonds within the fragment, and the bonds that connect it to the surrounding region. Pairwise fingerprints are based on the concept of an atom pair made up of their types and the topological distance separating them. This representation is hashed, byte-by-byte, to an integer value. By default, all pairs of atoms in the molecule are considered, and the distances are the number of bonds in the shortest path between each atom pair. Triplet fingerprints are an extension of the atom pair concept, where triplet consists of a set of three atoms and the topological distances separating them.
Since there are six different ways to order the atoms in a triplet, a canonicalization is performed to ensure that there are no bits in the fingerprint that differ only in a mutation of the atoms. Torsion (Topological Torsions) fingerprints are a special case of linear fingerprints, wherein every fragment consists of a linear path of four atoms. As only fragments containing four atoms are enumerated, the number of bits in a torsion fingerprint tends to be about an order of magnitude smaller than the number of bits in a linear fingerprint. The final 2D fingerprint descriptor, MOLPRINT2D is a radial-like fingerprint that encodes atom environments using lists of atom types located at different topological distances. Each heavy atom in a structure is characterized by an environment that consists of all other heavy atoms within a distance of two bonds. A bit in the fingerprint is derived from a tabular data structure that stores the central heavy atom type, and lists of atom types found at distances of one and two bonds.
In addition to the hashed fingerprints, we also tested a fingerprint derived from MACCS structural keys, which are encoded using a set of 155 SMARTS patterns (An et al. 2013). To determine how many unique chemical features a structure possesses, 11 atom-typing schemes in the canvas program were used. These Daylight invariant atom types, are encoded by atomic number, formal charge, valence, and the numbers of hydrogen and non-hydrogen atom connections (An et al. 2013).
Pharmacophore Modeling and 3D-QSAR
Pharmacophore modeling was carried out using the PHASE program within the Schrodinger suite running on Linux. A set of 27 novel beta-carboline derivatives tested as antiproliferative agents against the HCT116 colon cancer cell line (Tables 1) were used for the development of a ligand-based pharmacophore hypothesis and atom-based 3D-QSAR model. Here again, prior to the pharmacophore modeling, the IC50 values were converted to pIC50 values. The pharmacophore hypothesis (CPH) was generated by first building the compounds using the Builder tool in Maestro (Schrodinger Suite 2015). All ligands were prepared using LigPrep with the OPLS_2005 force field (Jorgensen et al. 1996). Conformational search was carried out using Monte-Carlo Multiple Minimum (MCMM)/Low Mode (LMOD) with maximum number of conformers being 500 per structure and energy minimization steps of 100 applied (Chang et al. 1989; Kolossvary et al. 1996). Each minimized conformer was filtered through a relative energy window of 50 kJ/mol and a redundancy check of 2Å root mean square deviation (RMSD) in the heavy atom positions. Common pharmacophoric features were then identified with the requirement that all actives must match. After applying default feature definitions to each ligand, common pharmacophores containing four to six sites were generated. These pharmacophore hypotheses were validated by testing their ability to: (i) rationalize the varying activities of a training set of compounds, (ii) successfully predict the affinities of a test set of compounds, and (iii) selectively retrieve known actives from a database of drug-like compounds.
Table 1.
Compounds used in the study with their observed biological activity
| Compd # | Structure | HCT116 PIC | HCT116 Pred PIC | HPAC PIC | HPAC Pred PIC | Mia- PaCa2 PIC | Mia- PaCa2 Pred PIC |
|---|---|---|---|---|---|---|---|
| 1 | 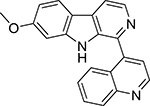 |
5.16 | 5.464 | ND | ND | ND | ND |
| 2 | 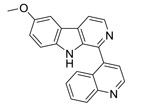 |
6.29 | 6.316 | 6.252 | 6.317 | 6.31 | 6.249 |
| 3 | 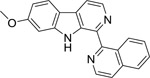 |
ND | ND | 4.459 | 4.442 | 4.308 | 4.321 |
| 4 | 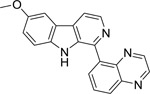 |
4.58 | 4.56 | 4.301 | 4.242 | 4.301 | 4.294 |
| 5 | 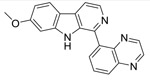 |
4.30 | 4.242 | 4.301 | 4.333 | 4.301 | 4.245 |
| 6 | 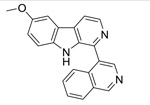 |
5.24 | 5.248 | 5.133 | 5.137 | 5.328 | 5.314 |
| 7 | 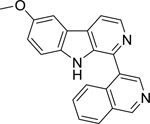 |
4.48 | 4.954 | 4.348 | 4.33 | 4.435 | 4.412 |
| 8 | 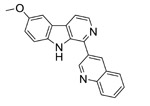 |
4.85 | 4.903 | 4.66 | 4.683 | 4.769 | 4.784 |
| 9 | 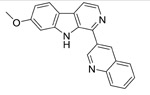 |
4.88 | 4.874 | 4.84 | 4.583 | 6.699 | 6.389 |
| 10 | 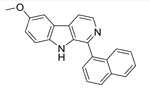 |
6.80 | 6.889 | 6.538 | 6.493 | 5.18 | 5.149 |
| 11 | 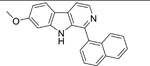 |
5.44 | 5.371 | 4.593 | 4.753 | 5.588 | 5.127 |
| 12 | 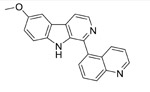 |
6.05 | 5.969 | 5.234 | 5.508 | 4.544 | 4.535 |
| 13 | 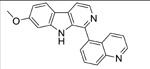 |
4.89 | 5.004 | 4.301 | 4.715 | 5.008 | 5.098 |
| 14 | 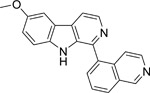 |
5.05 | 5.036 | 4.798 | 4.755 | 4.619 | 4.566 |
| 15 | 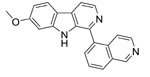 |
4.82 | 4.858 | 4.463 | 4.431 | 5.614 | 5.599 |
| 16 | 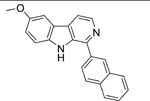 |
6.17 | 6.185 | 5.254 | 5.297 | 5.445 | 4.888 |
| 17 | 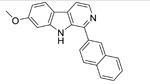 |
4.77 | 4.834 | 4.683 | 4.689 | 6.076 | 6.223 |
| 18 | 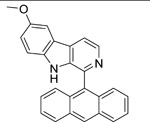 |
5.68 | 5.906 | 5.216 | 5.205 | 5.804 | 5.809 |
| 19 | 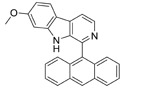 |
5.77 | 5.836 | 5.262 | 4.727 | 4.431 | 4.507 |
| 20 | 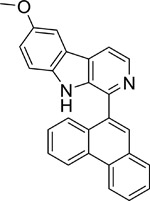 |
6.28 | 6.354 | 6.268 | 5.532 | 4.465 | 4.518 |
| 21 | 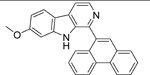 |
6.06 | 5.953 | 5.246 | 5.256 | 5.652 | 5.696 |
| 22 | 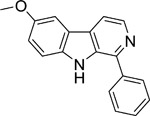 |
4.48 | 4.489 | 4.349 | 4.313 | 4.683 | 4.917 |
| 23 |  |
4.50 | 4.313 | 4.465 | 4.456 | 4.326 | 4.293 |
| 24 | 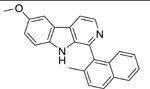 |
5.75 | 5.698 | 5.028 | 5.043 | 5.451 | 5.527 |
| 25 | 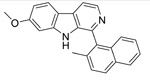 |
5.61 | 5.537 | 4.754 | 4.611 | 4.315 | 4.253 |
| 26 | 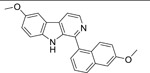 |
5.65 | 5.615 | 4.636 | 4.636 | 4.496 | 4.533 |
| 27 | 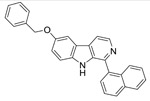 |
ND | ND | 6.081 | 6.074 | 4.38 | 4.503 |
| 28 | 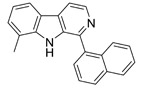 |
5.58 | 5.626 | 5.194 | 5.186 | 5.53 | 5.514 |
| 29 | 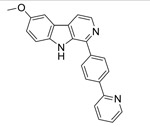 |
5.52 | 5.508 | 4.769 | 4.788 | 4.87 | 4.768 |
| 30 | 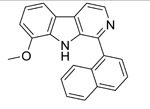 |
ND | ND | 4.687 | 4.641 | 4.474 | 4.364 |
| 31 | 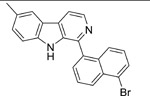 |
ND | ND | 4.301 | 4.393 | 4.301 | 4.523 |
| 32 | 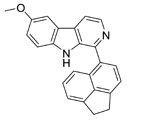 |
ND | ND | 5.319 | 5.314 | 5.769 | 5.772 |
| 33 | 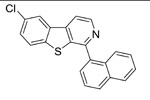 |
ND | ND | 4.301 | 4.223 | 4.883 | 5.112 |
| 34 | 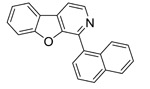 |
ND | ND | 4.301 | 4.357 | 5.064 | 5.234 |
| 35 | 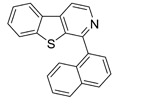 |
ND | ND | 4.301 | 4.463 | 4.394 | 4.381 |
| 36 | 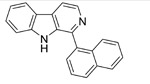 |
ND | ND | 5.607 | 5.572 | 4.581 | 4.502 |
| 37 | 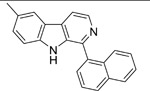 |
ND | ND | 4.301 | 4.633 | 4.756 | 4.735 |
| 38 | 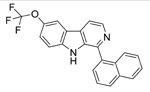 |
ND | ND | 4.45 | 4.403 | 4.428 | 4.374 |
| 39 | 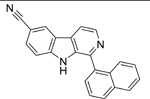 |
ND | ND | 4.301 | 4.48 | 4.468 | 4.604 |
| 40 | 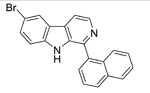 |
ND | ND | 4.964 | 4.84 | 4.777 | 4.359 |
| 41 | 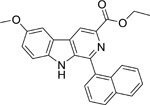 |
ND | ND | 4.891 | 4.916 | 5.866 | 5.974 |
| 42 |  |
ND | ND | 4.673 | 4.35 | 4.664 | 4.573 |
| 43 |  |
ND | ND | 4.355 | 4.405 | 6.292 | 6.411 |
CC = colon cancer
PC = pancreatic cancer
ND = not determined PIC = logarithm of IC50, Pred = Predicted
The pharmacophore hypotheses were then scored of with respect to activity of compounds using default parameters for site, vector, and volume terms. These common pharmacophore hypotheses were then examined for the one yielding the best alignment of the active ligands using an overall maximum RMSD value of 1.2 Å with default options for distance tolerance, and then a survival score was used to determine the quality of the pharmacophore and alignment; defined as: S = WsiteSsite + WvecSvec + WvolSvol +WselSsel +Wmrew, where W’s are a weights and S’s are scores. Wsite, Wvec, Wvol, and Wrew have default values of 1.0, while Wsel has a default value of 0.0. Wmrew represents reward weights defined by m−1, where m is the number of actives that match the hypothesis. Ssite represents an alignment score, the RMSD in the site point position; Svec represents a vector score, which averages the cosine of the angles formed by corresponding pairs of vector features in aligned structures; Svol represents volume score based on pair-wise overlap of van der Waals models of non-hydrogen atoms; and Ssel represents a selectivity score accounting for the fraction of compounds that are likely to match the hypothesis regardless of their biological activity.
A pharmacophore-based QSAR does not consider ligand features beyond the pharmacophore model, such as the role of certain chemical group’s contribution and possible steric clashes with the receptor, in which case an atom-based QSAR model is more useful in explaining the structure–activity relationship. In the atom-based QSAR model developed, a compound is treated as a set of overlapping van der Waals spheres. Each atom (and hence each sphere) is placed into one of six categories according to a simple set of rules: hydrogens attached to polar atoms are classified as hydrogen bond donors (D); carbons, halogens, and C–H hydrogen’s are classified as hydrophobic/non-polar (H); atoms with an explicit negative ionic charge are classified as negative ionic (N); atoms with an explicit positive ionic charge are classified as positive ionic (P); non-ionic electronegative atoms are classified as electron-withdrawing (W); and all other types of atoms are classified as miscellaneous (X). For purposes of QSAR development, van der Waals models of the aligned training set compounds were placed in a regular grid of cubes, with each cube allotted zero or more ‗bits’ to account for the different types of atoms in the training set that occupy the cube. This process gives rise to binary-valued occupation patterns that can be used as independent variables to create partial least-squares (PLS) QSAR models. Atom-based QSAR models were generated for all hypotheses using, the 27 compounds, which were divided into training set of 19 compounds and a test set of 8 compounds. The training set compounds were selected in such a way that they contained information in terms of both their chemical features and biological activity ranges. The most active compounds, moderately active, and less active compounds were included to spread out the range of activities (Golbraikh et al. 2003). In order to determine the predictive ability of the model, a set of 8 compounds was arbitrarily set aside as the test set. The test compounds were selected in such a way that they truly represent the training set in terms of activity profile.
Results and Discussion
Table 1 shows the structures and biological activities of the compounds used in the studies. KPLS regression analysis was the SAR data generated from the four cell lines, produced robust models only with the HCT116, HPAC, and Mia-PaCa2 cancer cell lines. The synthesis and biological activity testing of the compounds to acquire SAR data will be published elsewhere.
The best KPLS model selected for each data class is shown in Table 1, which shows a good coefficient of determination for the KPLS regression curves and high predictive ability of the models for the external test set data, as well as low uncertainties. Kernel-based partial least squares regression analysis (KPLS) is a nonlinear Gaussian kernel method with a higher predictive ability than conventional property-based methods. It is an extension of partial least-squares regression that introduces some nonlinearity into the scalar products of X variables used in the regression via a “kernel”, which is a nonlinear function of these scalar products. In the present study we used eight (8) two dimensional (2D) fingerprints in Canvas version 1.7 of the Schrodinger molecular modeling suite.
The Atom Triplet fingerprint descriptor gave the best models for the correlation with better predictive ability for the test set compounds, and showed the lowest uncertainty values than the other fingerprint descriptors tested for the HCT116, HPAC datasets; whereas the Linear 2D fingerprint descriptor performed the best for the Mia-PaCa-2 dataset. The successful predictive QSAR models with the HCT116, HPAC and Mia-PaCa2 cell line data, afforded the following metric values R2s of 0.99. 0.99 and 0.98, and test set predictive r2s of 0.70, 0.58 and 0.70, respectively (Table 1). Moreover, the uncertainties were also low. The inability to obtain a successful model with the Panc-1 cell line data might be due to the significantly lower efficacy of compounds against this cell line as many IC50 values were 10s of micromolar and many were >50 undefined values, more than any of the other data-sets; and in addition the activity range was very narrow. Traditionally it has been difficult to obtain good QSAR models with low activity data.
The reason for better performance of the Atom triplet and Linear 2D fingerprints might lie in the fact that the two are related, but with the Atom triplet being more sophisticated fingerprint than the linear fingerprint, which shows in the better performance of the Atom triplet relative to the Linear fingerprint with this datasets. Triplet fingerprints being more complex representing three-atom descriptors incorporating topological distances and a canonicalization to make it robust. It is therefore suggested here that for modeling this series of beta-carboline anticancer agents for lead optimization with fingerprint descriptors that the Atom triplet and linear fingerprints be given priority.
Another useful feature of the KPLS analysis is that the relative contributions of individual atoms can be displayed in the molecules, allowing the visualization favorable and unfavorable characteristics of individual atoms in the structures that helps to assess which atoms contributed positively or negatively towards the compounds activity (An et al. 2013) as depicted in Fig. 1.
Fig. 1.

Visualization of atomic effect of KPLS model (Green = Positive contribution, Red = negative contribution; color corresponds to degree of contribution).
The contributing roles of atoms are denoted by colored circles over them. Atoms that have positive contribution to activity are colored green, whereas atoms that have negative contribution are red. Additionally, the color intensity reflects the strength of the effect. Moreover, one can also predict the sensitivity of the cell line based on the colors and intensities. See for example, compound 17, which shows several of red-colored atoms in the model with HCT116 model, virtually has no red-colored atoms in the Mia-PaCa2 model; and also, while the N-methyl group in compound 43 shows up an intensely red colored with the HPAC model (low activity), this methyl group is not colored red and even has a faint greenish color in the Mia-PaCa2 model, again following the trend that the Mia-PaCa2 cell line is more sensitive than the other cell lines to this series of compounds. This color display scheme is not only useful in pointing to atoms and regions of the molecules that contribute positively or negatively to a compound’s individual biological activity, but also predicts which cell line will be most sensitive to the compound in question.
In the dataset HCT116, we can see that most active molecule compound 10 is all the atoms are colored with green spheres, and the color intensity of the spheres varies as per contribution of each atom for the activity. In compound 2, the naphthalene was modified to 4-quinoline. The incorporation of a nitrogen in the molecule resulted in decrease in activity. In compounds 5 and where the naphthalene ring of 10 has been replaced by a quinoxaline, there is even further red coloration corresponding to the further decrease in activity. In compound 16, which only differs from compound 10 by having the naphthalene ring attached at the naphthyl 2-position carbon, activity again decreases, reflecting that that change in conformation is detrimental to activity. The nitrogen on quinoline and quinoxaline of compound 5 marked with an unfavorable red sphere. Any modification on naphthalene or its position of attachment resulted in decrease in activity. Other change that caused a marked change in activity was changing the methyl substituent at the 6-position (higher activity) to the 7-position (lower activity), which was also captured clearly by the coloring distribution as shown for compounds 5 and 16, particularly for compound 16. The other non-contributing or less important atoms were marked with faint red color.
In HPAC dataset, we could see a similar trend, change of methoxy position or any other modification on R2, any change on naphthalene position or using any other ring system resulted decrease in activity. As exemplified by compound 43, a methyl substitution on nitrogen leads to decrease in activity (possibly due to disruption of H-bonding (see pharmacophore model in next section). In Mia-Paca2 dataset, we observed same activity trend with naphthalene ring system, when it was replaced by any other ring systems (compound 4) or substituted with any other functional group, the activity decreased. The change of methoxy position also resulted in decrease in activity. The KPLS analysis shows the atom triplet fingerprints are useful for QSAR study and were correlated well with three different biological activities. This might suggest that the molecules may be interacting with common target present in the different cell lines. Newer molecules can be designed and predicted using this model.
Pharmacophore generation and 3D-QSAR modeling
A total of 9 different four-point pharmacophore hypotheses were generated upon completion of the pharmacophore mapping process, and were ranked by survival scores, with the top 1% being analyzed further. The best pharmacophore model was found to consist of one hydrogen bond donor (D) and three Ring (R) elements, and was denoted as DRRR (Fig. 2).
Fig. 2.

Overlay of all molecules on best, 4-point pharmacophore model, DRRR. Orange rings show Ring pharmacophoric elements, and the cyan sphere with an arrow shows an H-bonding pharmacophoric element.
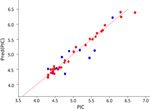
This model was used to derive an atom-based 3D-QSAR model to quantify physicochemical and electronic properties that influence for biological activity of these inhibitors, as well as a model for predicting the activity of compounds. Results of PLS statistics of the atom-based 3D-QSAR derived by this method are shown in Table 2, Graphs of observed versus predicted biological activity of training and test sets are shown in Figs 3 and 4, respectively.
Table 2.
Training and predictive statistics of the best KPLS regression modelsa (Red = Training set, Blue = Test set, n = number of compounds)
| Target | KPLS model Graph | R2 | Q2 | Uncertainty | n | Finger print |
|---|---|---|---|---|---|---|
| HCT116 | 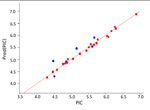 |
0.99 | 0.70 | 0.12 | 27 | Atomtriplet |
| HPAC | 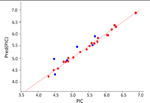 |
0.99 | 0.58 | 0.08 | 42 | Atomtriplet |
| Mia- PaCa2 |
 |
0.98 | 0.70 | 0.04 | 42 | Linear |
Fig. 3.

Graph of observed versus predicted biological activity of training set.
Fig. 4.

Graph of observed versus predicted biological activity of test set.
This pharmacophore-based 3D-QSAR model yielded a training correlation R2 of 0.683, and an external test set predictive correlation r2 of 0.562, which is a reasonable predictive model to use going forward for new compound design as antiproliferative agents. Additionally, the model hypothesis gives information about important features of these compounds for cancer cell proliferation inhibitory activity as shown by the electron (Fig. 5) or hydrophobicity (Fig. 6) distribution, represented by cubes generated from changes in the trends of atom-based parameters of the 3D-QSAR model. Thus, highlighting the effects of substituent type and position on the antiproliferative activities that will also be useful for further compound design and lead optimization. The electronic density distribution perturbations by substituents are portrayed in Fig. 5 by differently colored cubes; green cubes indicating favorable electronic density effects, whereas pale red cubes indicate detrimental effects of high electron density on biological activity giving a better understanding of the role of each functional group.
Fig. 5.

Favorable (green) and unfavorable (pale red) electronic effects of substituents relative to antiproliferative activity of pyrido[4,5-b]indole derivatives projected on selected compounds for illustration.
Fig. 6.

Favorable (green) and unfavorable (purple) electronic effects of substituents relative to antiproliferative activity of pyrido[4,5-b]indole derivatives projected on selected compounds for illustration.
Accordingly, in the most active compound, 10, the presence of the methoxy, R2 group at the 6-position is associated green cubes which indicating that the electron negative oxygen atom at this position is conducive to activity. When the position of the methoxy group was changed to the 7-position, R3, red cubes appeared around methoxy group as seen in compounds 5, 6, 13, 15 and 20, which are all of lower activity than compound 10. It is particularly telling with compound 11, where the only difference with compound 10 is the move of the methoxy group from 6-position to 7-position, and this change causes an activity loss of nearly 30-folds. In the R1 position there is again a prominent effect of the electronic nature of the substituent. The naphthalene ring with no ring nitrogen (electronegative atom) appears to be the standard. When nitrogen is introduced into the ring at R1, red colored cubes occur particularly around the nitrogen atom, indicating the electro negative atom at this position is detrimental to antiproliferative activity. This can be seen with the following examples, compounds 43, 5, 7, 8, 12, 13 and 15. Also, when the naphthalene ring of compound 10 was substituted with a methoxy group the activity decreased, and red cubes were placed around the methoxy group as shown with compound 26 from the QSAR model (Fig. 5).
Hydrophobicity distribution was also identified as a major player modulating antiproliferative activity according to the PHASE 3D-QSAR model. When the most active compound 10 was subjected to hydrophobic contributory plotting, the methoxy group at the 6-postion again fared opposite to the methoxy at the 7-position in terms of enhancing antiproliferative activity. Similarly, the R1 and naphthalene ring was favored by green cubes in contrast the rings that contained nitrogen atom. Interestingly, the higher the number of nitrogens, the worse the group fared, i.e. quinoxaline fared worse than quinolone and isoquinoline. In compound 22 in which the naphthalene ring was changed to phenyl the phenyl group was surrounded by purple cubes indicating that the resuction in hydrophobicity was unfavorable to activity. Compound 26 which has a methoxy on the R2 position naphthalene showed a combination of green and a few purple cubes, again indicating a tendency for decreased activity. Thus, the plotting of electronic and hydrophobic effects of these compounds according to the 3D-QSAR model is well able to predict whether a substituent will increase of decrease activity at least at positions 1, 2 and/or 3, which is quite remarkable. In fact, although this 3D-QSAR modeling was only able to handle the HCT116, data, the trends it is predicting also hold for the other cell line data by inspection of the observed trends of compound activities in these other data sets, the pancreatic cancer cell line data sets.
To summarize, we have applied two different QSAR methods to the SAR data acquired for a new series of pyrido[3,4-b]indole (β-carboline) derivatives shown to have broad-based anticancer cell proliferative activity. The 2D-fingerprint KPLS method was able to handle three cell line data sets obtained with colon cancer HCT116, and pancreatic cancer cell lines HPAC and Mia-PaCa-2. A pharmacophore-alignment QSAR method yielded a four-point pharmacophore which produced a good 3D-ASAR model with the HTCT116 colon cancer cell line SAR data. In addition to providing predictive models for compound design and activity prediction of new molecules, the models also provide insights into atom relative contributions to biological activity (KPLS) and how substituent influence on electronic and hydrophobicity distributions effects activity positively or negatively; and that will guide the choice of substituents in lead optimization. Both models predict that the N-methyl group is detrimental to activity, as shown by red coloring by the KPLS method (Fig. 1) or by interfering with the H-bonding pharmacophoric point indicated by the PHASE pharmacophore map (Fig. 2). These results agree with the observation that the position of substitution of the methoxy group significantly influences potency, with 6-position being much better than seven position substitution. Overall, the KPLS and pharmacophore mapping QSAR methods are complementary in providing atom-type and atom environment effects, while the PHASE pharmacophore-based 3D-QSAR provide different perspectives that together contribute to useful insights that will help direct structural modification to improve antiproliferative activity.
Table 3.
Results of PLS statistics of atom-based 3D-QSAR
| Training Set | Test Set |
|---|---|
| R2 = 0.683 | Pred r2 = 0.562, |
| SD = 0.424 | Pearson-R = 0.761 |
| F value = 36.7, | RMSE = 0.24 |
| n = 19 | n = 8 |
R2, r2 = correlation coefficients for training regression model and prediction, respectively, SD = standard deviation of the regression, F = variance ratio, Q2 ext =for the predicted activities, RMSE=root-mean-square error, Pearson-R = correlation between the predicted and observed activity for the test set, n = Number of molecules used
Acknowledgements
Financial support from the Colleges of Pharmacy at Rosalind Franklin University of Medicine and Science and the University of Tennessee Health Science Center is acknowledged, and so is financial support from National Institutes of Health (NIH)/ National Cancer Institute (NCI) grants CA100102 and RO1CA186662 subcontract (Zhang, PI) that partly supported the work in the Buolamwini laboratory. R. Z. was also supported by NIH/NCI grants R01 CA186662 and R01CA214019. The content is solely the responsibility of the authors, and does not necessarily represent the official views of the National Institutes of Health.
Footnotes
Compliance with ethical standards
Conflict of interest: The authors J. K. B., R. Z. and W. W. are co-inventors on patents pertaining to the compounds.
Contributor Information
Hemantkumar Deokar, Email: h.deokar@rosalindfranklin.edu.
Mrunalini Deokar, Email: mrunalnarkar@gmail.com.
Wei Wang, Email: wwang4@central.uh.edu.
Ruiwen Zhang, Email: rzhang27@central.uh.edu.
References
- An Y, Sherman W, Dixon SL (2013) Kernel-Based Partial Least Squares: Application to Fingerprint-Based QSAR with Model Visualization. J Chem Inf Model 53: 2312–23210 [DOI] [PubMed] [Google Scholar]
- Canvas version 1.7, Schrödinger, LLC, New York, NY, 2015 [Google Scholar]
- Canvas user manual, version 1.7, Schrödinger, LLC, New York, NY, 2015 [Google Scholar]
- Chang G, Guida WC, Still WC (1989) An internal-coordinate Monte Carlo method for searching conformational space. J Am Chem Soc 111: 4379–4386 [Google Scholar]
- Dixon SL, Smondyrev AM, Rao SN (2006) PHASE: A Novel Approach to Pharmacophore Modeling and 3D Database Searching. Chem Biol Drug Des 67: 370–372 [DOI] [PubMed] [Google Scholar]
- Duan J, Dixon SL, Lowrie JF, Sherman W (2010) Analysis and comparison of 2D fingerprints: Insights into database screening performance using eight fingerprint methods. J Mol Graph Model 29: 157–170 [DOI] [PubMed] [Google Scholar]
- Golbraikh A, Shen M, Xiao Z, Xiao YD, Lee KH, Tropsha A (2003) Rational selection of training and test sets for the development of validated QSAR models. J Comput Aided Mol Des 17: 241–253 [DOI] [PubMed] [Google Scholar]
- Hert J, Willett P, Wilton DJ, Acklin P, Azzaoui K, Jacoby E, Schuffenhauer A (2005) Enhancing the effectiveness of similarity-based virtual screening using nearest-neighbor information. J Med Chem 48: 7049–54 [DOI] [PubMed] [Google Scholar]
- Hert J, Willett P, Wilton DJ, Acklin P, Azzaoui K, Jacoby E, Schuffenhauer A (2004) Comparison of fingerprint-based methods for virtual screening using multiple bioactive reference structures. J Chem Inf Comput Sci 44: 1177–85 [DOI] [PubMed] [Google Scholar]
- Jorgensen WL, Maxwell DS, Tirado-Rives J (1996) Development and testing of the OPLS all-atom force field on conformational energetics and properties of organic liquids. J Am Chem Soc 118: 11225–11236 [Google Scholar]
- Kolossvary I, Guida WC (1996) Low mode search: an efficient, automated computational method for conformational analysis—application to cyclic and acyclic alkanes and cyclic peptides. J Am Chem Soc 118: 5011–5019 [Google Scholar]
- Marriott DP, Dougall IG, Meghani P, Liu YJ, Flower DR (1999) Lead generation using pharmacophore mapping and three-dimensional database searching: application to muscarinic M(3) receptor antagonists. J Med Chem 42: 3210–3216 [DOI] [PubMed] [Google Scholar]
- Rosipal R (2003) Kernel Partial Least Squares for Nonlinear Regression and Discrimination. Neural Network World 13: 291–300 [Google Scholar]
- Sastry M, Lowrie JF, Dixon SL, Sherman W (2010) Large-Scale Systematic Analysis of 2D Fingerprint Methods and Parameters to Improve Virtual Screening Enrichments. J Chem Inf Model 50: 771–784 [DOI] [PubMed] [Google Scholar]
- Suite Schrödinger 2015–4, Maestro, version 10.4, Schrödinger, LLC, New York, NY, 2015 [Google Scholar]
- Wang W, Qin JJ, Voruganti S, Wang MH, Sharma H, Patil S, Zhou J, Wang H, Mukhopadhyay D, Buolamwini JK, Zhang R (2014a) Identification of a new class of MDM2 inhibitor that inhibits growth of orthotopic pancreatic tumors in mice. Gastroenterology 147: 893–902 [DOI] [PMC free article] [PubMed] [Google Scholar]
- Wang W, Qin JJ, Voruganti S, Srivenugopal KS, Nag S, Patil S, Sharma H, Wang MH, Wang H, Buolamwini JK, Zhang R (2014b) The pyrido[b]indole MDM2 inhibitor SP-141 exerts potent therapeutic effects in breast cancer models. Nat Commun 5: 5086. [DOI] [PMC free article] [PubMed] [Google Scholar]
- Willett P (2006) Similarity-based virtual screening using 2D fingerprints. Drug Discov Today 11: 1046–1053 [DOI] [PubMed] [Google Scholar]