. 2019 Jul 29;8:e47891. doi: 10.7554/eLife.47891

Figure 3. Gains in CHG methylation do not alter H3K9me2 levels or distribution.

(A) Genome browser view of CHG methylation levels and H3K9me2 ChIP sequencing levels in the T3 and T5 generations of the AtCMT3-L1 and L2 lineages. Arrows indicate gains of CHG methylation over gene bodies in the AtCMT3-L2 generations that do not show H3K9me2 enrichment. Scales on methylation tracks designate the weighted percent methylation, with 1 = 100% on the top strand and −1 = 100% on the bottom strand. Scales on the H3K9me2 tracks indicate the number of mapped reads and are not adjusted for library size (See C-F for comparison of normalized reads). DNA methylation is only shown in the CHG context. For DNA methylation in all contexts see Figure 3—figure supplement 1. (B) Metaplot of % CHG methylation over H3K9me2 ChIP peaks identified in wild type plants. (C–F) Metaplot of H3K9me2 ChIP-sequencing enrichment over H3K9me2 ChIP peaks defined in wild type plants and over CHG-gain genes in AtCMT3-L1T3 (C), AtCMT3-L1T5 (D), AtCMT3-L2T3 (E), and AtCMT3-L2T5 (F). Reads were normalized to library size. See Supplementary file 5 for lists of CHG-gain genes in each lineage.

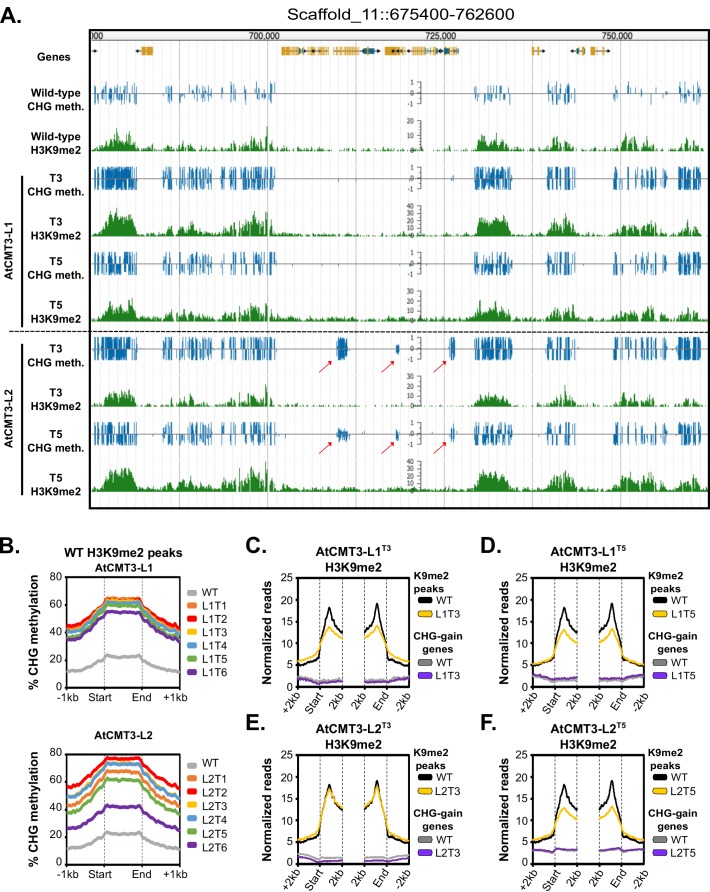
Figure 3.

Figure 3—figure supplement 1. Gains in CHG methylation do not alter H3K9me2 levels or distribution.

Figure 3—figure supplement 1.

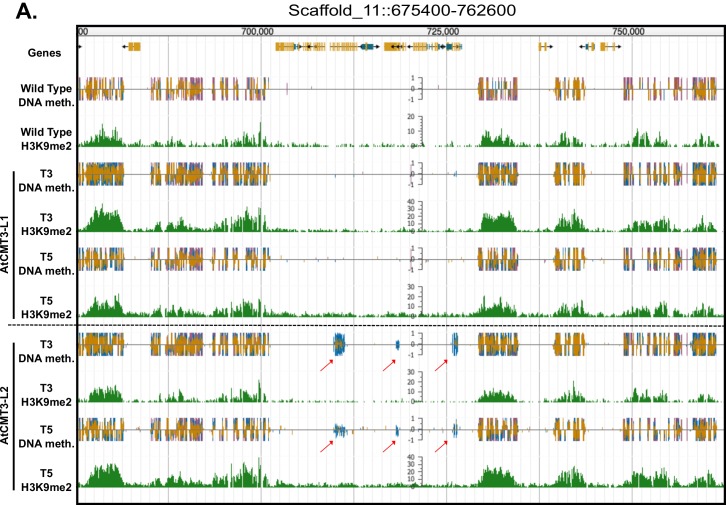
(A) Genome browser view of CHG methylation levels and H3K9me2 ChIP sequencing levels in the T3 and T5 generations of the AtCMT3-L1 and AtCMT3-L2 lineages. Arrows indicate gene bodies that gain CHG methylation in the AtCMT3-L2 generations but do not show H3K9me2 enrichment. Scales on methylation tracks designate the weighted percent methylation, with 1 = 100% on the top strand and −1 = 100% on the bottom strand. Scales on the H3K9me2 tracks indicate the number of mapped reads and are not normalized. Cytosine methylation is divided into CG (red), CHG (blue), and CHH (yellow) sequence contexts. Corresponds to the region shown in Figure 3A.
Figure 3—figure supplement 2. Gains in CHG methylation do not alter H3K9me1 levels or distribution.

Figure 3—figure supplement 2.

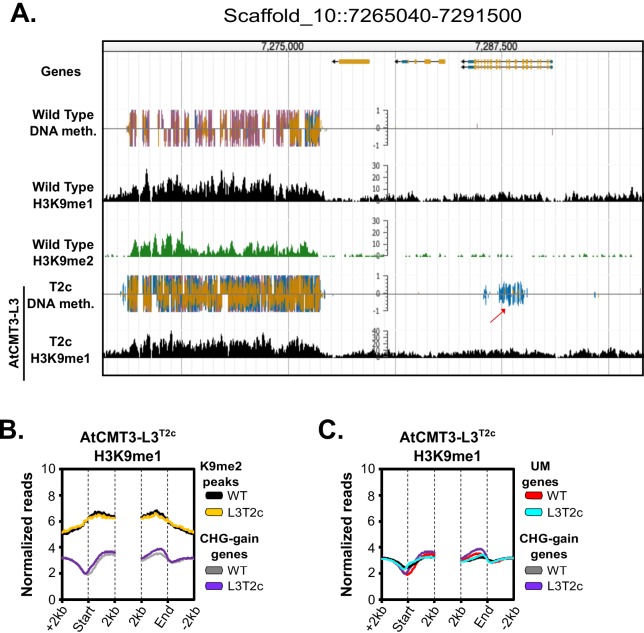
(A) Genome browser view of CHG methylation levels and H3K9me1 ChIP sequencing levels in the T2c generation of the AtCMT3-L3 lineage. In wild type and AtCMT3-L3T2c, H3K9me1 can be found enriched in regions also enriched for H3K9me2. The arrow indicates a gene body that gains CHG methylation in AtCMT3-L3 but does not show H3K9me1 enrichment. Scales on methylation tracks designate the weighted percent methylation, with 1 = 100% on the top strand and −1 = 100% on the bottom strand. Scales on the H3K9me1 tracks indicate the number of mapped reads and are not normalized. Cytosine methylation is divided into CG (red), CHG (blue), and CHH (yellow) sequence contexts. (B) Metaplot of H3K9me1 ChIP-sequencing enrichment over H3K9me2 ChIP peaks defined in wild type plants and over CHG-gain genes in AtCMT3-L3T2c. (C) Metaplot of H3K9me1 ChIP-sequencing enrichment comparing enrichment over CHG-gain genes in AtCMT3-L3T2c to genes that do not gain CHG methylation (UM genes).