

Abstract
Interest in niacin has increased in the setting of reports suggesting that niacin plays a role in diseases of aging. No study to date has examined the association of dietary niacin intake with multiple skeletal health parameters including bone mineral density (BMD), hip fractures, and body composition, and none have included both African American and white men and women. Participants included 5187 men and women ≥65 years from the Cardiovascular Health Study (CHS). Mean daily dietary niacin intake was 32.6 mg, with quartiles 1 through 4 defined as 3.6 to 21.8 mg/day, 21.9 to 30.2 mg/day, 30.3 to 40.9 mg/day, and 41.0 to 102.4 mg/day, respectively. Risk of incident hip fracture per 10 mg increment of daily dietary niacin intake was estimated using proportional hazards models. During a median follow-up of 13 years, 725 participants had an incident hip fracture. In models adjusted for demographic and clinical characteristics and diet, dietary niacin intake was significantly associated with an increased risk of hip fractures (hazard ratio [HR] 1.12; 95% CI, 1.01 to 1.24) with spline models suggesting a U-shaped association. In post hoc analyses, both the lowest (HR 1.31; 95% CI, 1.04 to 1.66) and highest (HR 1.53; 95% CI, 1.20 to 1.95) quartiles of niacin intake were associated with an increased risk of incident hip fracture versus quartiles 2 and 3. There was a trend for a significant inverse association of dietary niacin intake with hip BMD (p = 0.06), but no significant association with total body BMD or any body composition measures. In this cohort of elderly, community-dwelling African American and white men and women, both high and low dietary niacin intakes were associated with a significantly increased risk of subsequent hip fracture, suggesting a possible U-shaped association. By comparison, dietary niacin may have an inverse linear association with hip BMD.
Keywords: Epidemiology, Nutrition, Aging
Introduction
Nutrient deficiencies can accelerate loss of bone mineral density (BMD) and increase the propensity to fall, both of which are major causes of hip fracture among community-dwelling elderly populations (1–3). Niacin is a B3 vitamin that may be obtained from the diet (in particular from yeast, milk, meat, cereals, legumes, seeds, fish, coffee, tea, and green leafy vegetables) (4) or synthesized in vivo through the tryptophan pathway (5). Potential beneficial mechanisms of action of niacin on bone are through decreased inflammation and regulation of NAD-dependent deacetylase Sirtuin 1 (SIRT1 expression) (6). Niacin decreases C-reactive protein (CRP) levels (7, 8); higher levels of CRP are associated with fractures in elderly women (9) and lower levels are associated with higher BMD in pre and postmenopausal women (10). However, higher niacin intake may also have adverse skeletal effects, because niacin stimulates prostaglandin D2 (PGD2) and serotonin release. PGD2 stimulates osteoblastogenesis and peripheral serotonin may have a negative impact on bone (11, 12). Few human studies have examined the relationship of niacin intake with osteoporosis; these have had conflicting findings (13–16) and none have included measurements of body composition. Therefore, the purpose of this study was to determine the association between dietary intake of niacin and incident hip fractures and DXA-derived measurements of BMD of the hip and body composition.
Materials and Methods
Participants
The Cardiovascular Health Study (CHS) is a longitudinal, community-based study of older men and women (age ≥65 years) designed to determine the factors that predict development and progression of cardiovascular disease (11). Participants were recruited through random sampling from Medicare eligibility lists at four locations: Forsyth County, North Carolina; Sacramento County, California; Washington County, Maryland; and Allegheny County, Pennsylvania. Participants were excluded if they were institutionalized, required a proxy to complete informed consent, were planning to move out of the area within 3 years of recruitment, required a wheelchair in the home, were receiving hospice care, or were undergoing radiation or chemotherapy for cancer. The main cohort of 5201 participants were enrolled between June 10, 1989, and May 30, 1990, at which time dietary data were collected using a food frequency questionnaire (FFQ). For the present analyses, participants who reported extremes of total energy intake (≤500 kcal/day or ≥5000 kcal/day) were excluded. The remaining 5187 participants from the CHS main cohort were assessed for risk of incident hip fractures. Within this group, 1336 had BMD measured using DXA during the 1994–1995 visit at either of two of the four CHS sites, the Allegheny County and Sacramento County centers, and were included in the BMD and body composition analyses (Figure 1). The institutional review board (IRB) at the coordinating center and each study site approved the CHS and all participants provided written informed consent.
Figure 1:
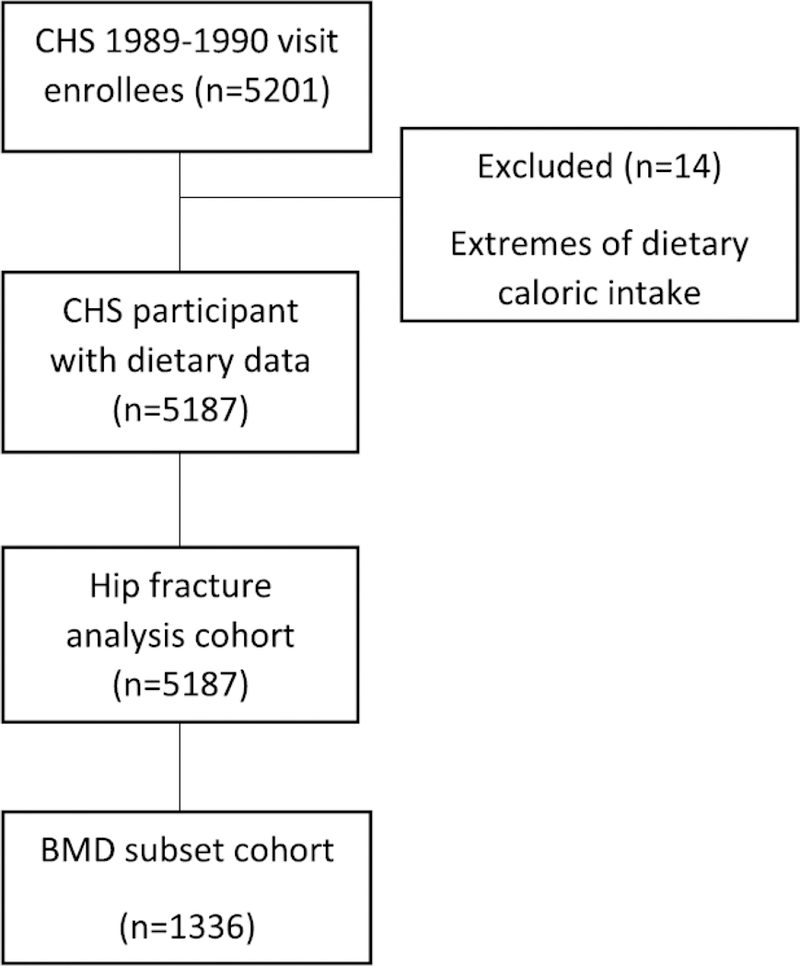
Analytic Cohort
Dietary Niacin Intake
Daily dietary niacin intake was estimated at the 1989–1990 CHS visit by administration of a qualitative, picture-sort, FFQ. Dietary intake was estimated by asking each participant to sort a deck of 99 cards, each with a picture of a food or food group, into five categories, according to how often they ate the pictured food: almost every day; one to four times per week; one to three times per month; five to 10 times per year; or never. The resulting food frequencies were then converted to mean daily nutrient intakes using information from the National Cancer Institute nutrient database (18). Studies on the relative validity of this questionnaire in a substudy in CHS reported that estimates of mean nutrient intakes from this picture-sort questionnaire were comparable with estimates based on 24-hour recalls, and correlations with reference data were similar to those reported in the literature for conventionally administered FFQs (19).
Outcomes
Incident Hip Fractures
Incident hip fractures were defined by a hospital discharge International Classification of Diseases, Ninth Revision (ICD-9), code 820.xx. Among those, no one had a code for hardware revisions (ICD-9 78.65 or 81.53). CHS obtained all hospitalization data, including discharge summaries, from participants every 6 months. These data were checked against Medicare claims data to identify any hospitalizations not reported by participants and Centers for Medicare & Medicaid Services (CMS) Part A data were obtained for all Medicare fee-for-service beneficiaries through June 2013. In addition, CHS conducted surveillance activities and identified incident events and hospitalizations for Medicare beneficiaries enrolled in managed care plans and for those treated at Veterans Administration Hospitals. Discharge summaries from the hospitalized events were obtained so that the CHS hospitalization database would include discharge diagnoses for all participants (20). Surveillance activities consisted of calling a participant every 6 months and asking about hospitalizations. If he or she was hospitalized, records were obtained. If the participant was unavailable, a proxy was contacted. Because this CHS active surveillance provided information on the CMS non–fee-for-service hospitalizations, we were able to include all participants and all available follow-up time in the analysis. Hip fractures caused by motor vehicle accidents or severe injury (E810.xx to E825.xx) were excluded. Follow-up for incident hip fracture began in 1989–1990 (following FFQ collection) and was continued to a hip fracture event, death, loss to follow-up, or June 30, 2013, whichever occurred first.
Bone Density and Body Composition Measurements
Total hip and total body BMD were measured in participants at the 1994–1995 study visits using Hologic QDR-2000 densitometers (Hologic, Inc., Waltham, MA, USA) and read centrally at the University of California San Francisco reading center using Hologic software, version 7.10. All scans were completed using the array beam mode. Standardized positioning and use of QDR software was based on the manufacturer’s recommended protocol. The coefficient of variation for the total hip BMD was 0.75% (21). Body composition measurements, including percent fat, total fat, percent lean, total lean and total body mass, were also obtained (22).
Covariates
The covariates chosen were assessed in 1989–1990. Age, gender, and race were determined by participant self-report. Body weight was measured using a calibrated balance beam scale. Height was measured with a wall-mounted stadiometer. Height and weight were used to calculate body mass index (BMI) in kg/m2. Renal function was assessed by cystatin C using a particle-enhanced immunonephelometric assay by the BN II nephelometer (Dade Behring, Deerfield, IL, USA) in stored fasting blood samples (intraassay coefficients of variation: 2.0% to 2.8%; interassay coefficients of variation: 2.3% to 3.1%) (23).
A history of diabetes was defined as use of hypoglycemic agents, nonfasting glucose ≥200 mg/dL, or fasting glucose level ≥126 mg/day. Impaired fasting glucose was defined as a blood glucose between 100 and 125 mg/dL The highest level of education achieved (≥12th grade or <12th grade); dietary intakes of calcium, vitamin D, total energy, and protein; and physical activity (total kcal/week) were self-reported by participants. Medication use was determined by review of prescription bottle labels for medications currently used by the participant (24). Estrogen, estrogen/progesterone, loop diuretics, thiazides, thyroid medications, antidepressants, antipsychotics, benzodiazepines, oral corticosteroids, and osteoporosis medications were included in the analyses. Smoking history (current, former, never) and alcohol use (0 drinks/week, 1 to 7 drinks/week, >7 drinks/week) were self-reported by participants. Prior reports have reported significant relationships between frailty and osteoporotic fractures. Further, it has been suggested that frailty may be in the causative pathway of fractures (25); thus, frailty status was included. Frailty was categorized using the following criteria: unintentional weight loss of ≥10 pounds in past year, self-reported exhaustion, low physical activity, weak grip strength, and low walking speed.
Grip strength was calculated as the mean of three serial measurements of the dominant hand-adjusted for gender and BMI with cutoffs in men and women as given in Table 1.
Table 1.
Grip Strength in Men and Women by BMI Cutoffs
| Grip Strength | |
|---|---|
| Men | |
| BMI ≤24 | ≤29 |
| BMI 24.1–26 | ≤30 |
| BMI 26.1–28 | ≤30 |
| BMI >28 | ≤32 |
| Women | |
| BMI ≤23 | ≤17 |
| BMI 23.1–26 | ≤17.3 |
| BMI 26.1–29 | ≤18 |
| BMI >29 | ≤21 |
Grip strength (in kg) was calculated as the mean of three serial measurements of the dominant hand, adjusted for gender and BMI with cutoffs (in kg/m2) in men and women.
Walking speed (timed walk over 4.57 m or 15 feet at usual pace by height and gender) was defined in men and women as given in Table 2.
Table 2.
Walking Speed by Height and Gender
| Walking speed (m/s) | |
|---|---|
| Men | |
| Height ≤173cm | ≥0.65m/s |
| Height >173cm | ≥0.76m/s |
| Women | |
| Height ≤159cm | ≥0.65m/s |
| Height >159cm | ≥0.76m/s |
Walking speed was determined by timed walk over 4.57 m (15 feet) at usual pace.
Frailty was defined by the presence of three or more of the following criteria: Unintentional weight loss, weakness, self-reported poor energy, slow walking speed, and low physical activity; intermediate (pre-frail) was defined as having two or more of these criteria (26, 27).
C-reactive protein (CRP) was measured as a marker of inflammation. CRP was measured in CHS by use of an enzyme-linked immunosorbent assay developed at the CHS central blood laboratory. It was a colorimetric competitive immunoassay that uses purified protein and polyclonal anti-CRP antibodies. The interassay coefficient of variation was 5.5% (28, 29).
Statistical Analyses
Owing to differences in the natural history of hip fractures between men and women, we performed a priori analyses combining both genders and stratifying by gender. Descriptive characteristics were compared across quartiles of daily dietary niacin intake with linear trend tests for continuous variables and chi-square tests for categorical variables. Cox proportional hazard models were used to estimate the hazard ratio (HR) of incident hip fracture associated with dietary niacin intake. Several nested models were used: M0 = unadjusted; M1 = adjusting for age, gender, race, and clinic site; M2 = further adjusting for BMI, cystatin C, diabetes, education, calcium and vitamin D intake, medication use, smoking, alcohol, and frailty status; and M3 = (final multivariable adjusted models) further adjusting for total energy (caloric) intake (kcal/day) and protein intake. In the subcohort with BMD measurements, linear regression analysis was used to estimate the association between dietary niacin intake and total hip and total body BMD values. Further, we estimated associations between dietary niacin intake and body composition measures of total mass, total lean mass, total fat mass, percentage of fat mass, and percentage of lean mass.
We used niacin on a continuous linear scale. To address the parametric assumption of linearity of niacin in the models, we used generalized additive models (GAMs) with splines for niacin. We found no departures from linearity in linear regression for BMD sites and the body composition measures. The GAM for modeling incident hip fracture hazard suggested some departures from linearity (Figure 2), which when formally testing based on permutations (30) confirmed departures of linearity (p = 0.002). Thus, in a post hoc analysis, we further modeled niacin as contrasts between values of 21.8 mg/day and 40.9 mg/day (combined category of quartile 2 and 3) versus values below 21.8 mg/day and values above 40.8 mg/day.
Figure 2:
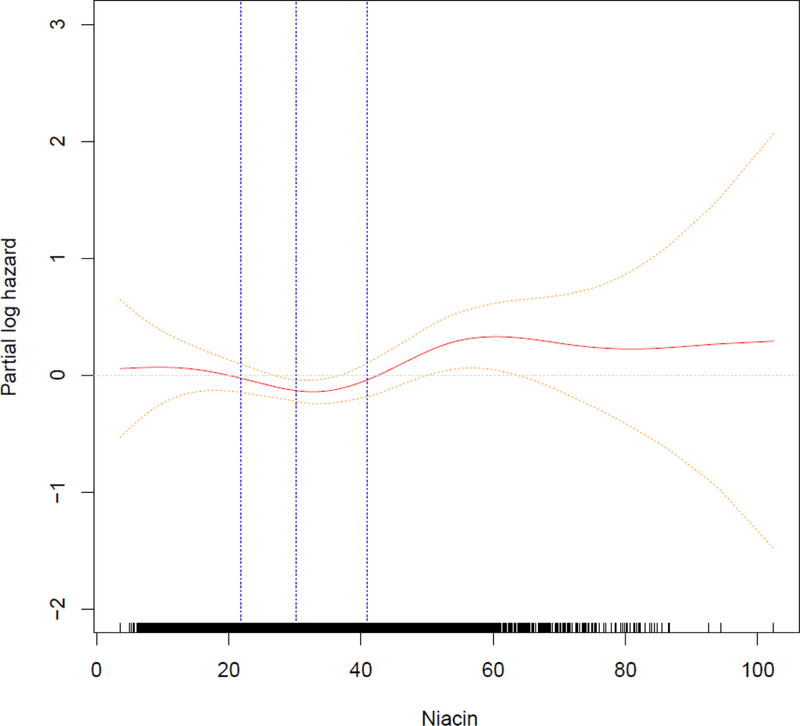
Generalized additive model for MV3 with 95% pointwise confidence interval. Quartiles of niacin are highlighted.
We further performed two sensitivity analyses: (i) including those who had DXA measurements in the hip fracture analyses; and (ii) excluding the 13 persons who were taking supplemental niacin.
Recommended Dietary Allowances (RDAs) for nutrients are of importance as they are utilized in both the food and health fields and serve as the basis for the US Food and Drug Administration’s (FDA) standards for nutrition labeling of food (31). Accordingly, we determined the relationship of niacin intake by RDAs for niacin (2) (11 mg/day for women and 14 mg/day for men) in Cox regression for hip fracture and linear regression for BMDs and body composition measures.
We also computed the population attributable risk for niacin intake (32), based on binary exposure of low or high niacin (defined as lower than 21.8 mg/day or 41.0 to 102.4 mg/day) compared with intermediate values (21.8 to 40.9 mg/day) using a Cox regression hazard model fully adjusted (MV3) at 5 years, 10 years, 15 years, 20 years, and 25 years by gender.
Values of p and confidence intervals are not adjusted for multiple testing. A p value of 0.10 is considered significant for interactions. Analyses were conducted using R environment for statistical computing (33).
Results
The mean dietary intake of niacin in CHS at baseline (1988–1989) was 32.6 mg/day (range, 3.6 to 102.4 mg/day) (quartile 1: 3.6 to 21.8 mg/day; quartile 2: 21.9 to 30.2 mg/day; quartile 3: 30.3 to 40.9 mg/day; and quartile 4: 41.0 to 102.4 mg/day). The distribution of niacin intakes in the form of a histogram is shown in Figure 3.
Figure 3.
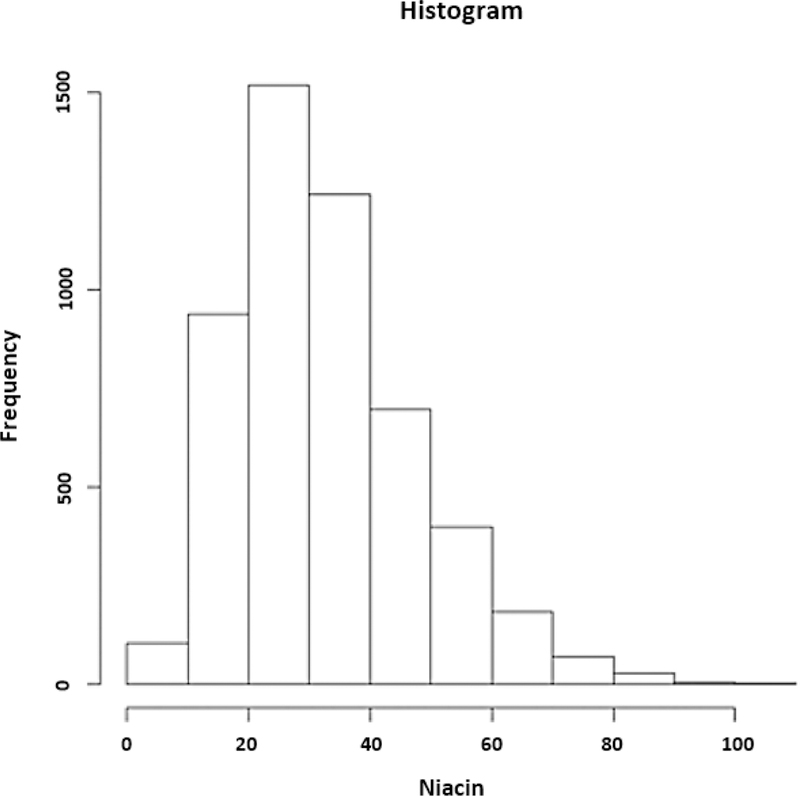
Histogram. Distribution of niacin intakes.
Baseline characteristics of the study population overall and by quartiles of dietary niacin intake are shown in Table 3. There were significant differences in gender, education level, intakes of total energy, protein, calcium, and vitamin D use of bisphosphonates (p = 0.02), and smoking status (p = 0.03) by quartile of dietary niacin intake (Table 3). The mean dietary intakes of niacin were significantly higher in men than women (by 1.26 mg/day) (p = 0.003) but were not significantly associated with age.
Table 3.
Baseline Characteristics of Study Population by Niacin Intake
| All (n=5187) |
Quartile 1 (n=1297) (3.6–21.8 mg/day) |
Quartile 2 (n=1298) (21.9–30.2 mg/day) |
Quartile 3 (n=1295) (30.3–40.9 mg/day) |
Quartile 4 (n=1297) (41.0–102.4 mg/day) |
P- Value |
|
|---|---|---|---|---|---|---|
| Age (y) (mean±SD) | 72.77 ±5.6 | 72.85 ±5.63 | 72.6 ±5.59 | 72.53 ±5.61 | 73.11 ±5.57 | 0.31 |
| BMI (kg/m2 ) (mean±SD) | 26.42 ±4.52 | 26.43 ±4.64 | 26.4 ±4.55 | 26.67 ±4.61 | 26.17 ±4.27 | 0.35 |
| Male gender (number (%)) | 2231 (43%) | 520 (40.1%) | 556 (42.8%) | 546 (42.2%) | 609 (47%) | <0.01 |
| African American race (number (%)) | 245 (4.7%) | 58 (4.5%) | 53 (4.1%) | 57 (4.4%) | 77 (5.9%) | 0.12 |
| Age at menopause (y) (mean±SD) | 47.15 ±6.72 | 46.93 ±6.69 | 47.01 ±6.97 | 47.17 ±6.58 | 47.55 ±6.65 | 0.08 |
| Cystatin C (mean±SD) | 1.05 ±0.31 | 1.06 ±0.36 | 1.05 ±0.29 | 1.04 ±0.28 | 1.06 ±0.29 | 0.66 |
| Diabetes (number (%) | 0.63 | |||||
| Not diabetic | 3666 (71.1%) | 893 (69.5%) | 921 (71.6%) | 925 (71.7%) | 927 (71.7%) | |
| Impaired fasting glucose | 702 (13.6%) | 177 (13.8%) | 176 (13.7%) | 182 (14.1%) | 167 (12.9%) | |
| Diabetes | 786 (15.3%) | 215 (16.7%) | 190 (14.8%) | 183 (14.2%) | 198 (15.3%) | |
| Education (≥12 grades completed, number (%)) | 2314 (44.7%) | 507 (39.2%) | 597 (46.1%) | 632 (48.9%) | 578 (44.7%) | <0.01 |
| Calcium intake (mg/d) (mean±SD) | 1025.6 ±353.96 | 741.54 ±215.18 | 886.16 ±267.04 | 1079.73 ±231.91 | 1395.17 ±300.24 | <0.01 |
| Vitamin D intake (IU/d) (mean±SD) | 365.13 ±220.73 | 203.98 ±132.61 | 314.25 ±182.96 | 428.31 ±196.7 | 514.11 ±224.63 | <0.01 |
| Energy (Caloric) intake (Kcal/d) (mean±SD) | 2030.16 ±681.36 | 1426.94 ±348.02 | 1809.14 ±445.78 | 2213.77 ±449.71 | 2671.23 ±691.18 | <0.01 |
| Protein intake (g/d) (mean±SD) | 97.79 ±37.15 | 61.14 ±15.43 | 86.68 ±17.18 | 109.71 ±23.06 | 133.64 ±39.54 | <0.01 |
| Physical activity levels (kcal/week) | 675 (150–1620) | 560 (79–1522) | 675 (179–1560) | 725 (202–1709) | 735 (175–1706) | 0.07 |
| Clinic site (number (%)) | <0.01 | |||||
| Bowman Gray, NC | 1299 (25%) | 399 (30.8%) | 359 (27.7%) | 279 (21.5%) | 262 (20.2%) | |
| Davis, CA | 1318 (25.4%) | 341 (26.3%) | 336 (25.9%) | 347 (26.8%) | 294 (22.7%) | |
| Hagerstown, MD | 1297 (25%) | 309 (23.8%) | 283 (21.8%) | 310 (23.9%) | 395 (30.5%) | |
| Pittsburgh, PA | 1273 (24.5%) | 248 (19.1%) | 320 (24.7%) | 359 (27.7%) | 346 (26.7%) | |
| Medication use (number (%)) | ||||||
| Loop diuretic | 171 (3.3%) | 41 (3.2%) | 51 (3.9%) | 41 (3.2%) | 38 (2.9%) | 0.51 |
| Thiazide diuretic | 739 (14.2%) | 194 (15%) | 181 (13.9%) | 180 (13.9%) | 184 (14.2%) | 0.86 |
| Thyroid medication | 464 (9%) | 123 (9.5%) | 124 (9.6%) | 108 (8.3%) | 109 (8.4%) | 0.55 |
| Estrogen and estrogen/progesterone | 84 (1.6%) | 15 (1.2%) | 25 (1.9%) | 28 (2.2%) | 16 (1.2%) | 0.11 |
| Antidepressants | 98 (1.9%) | 22 (1.7%) | 33 (2.5%) | 16 (1.2%) | 27 (2.1%) | 0.09 |
| Antipsychotics | 526 (10.1%) | 136 (10.5%) | 111 (8.6%) | 130 (10%) | 149 (11.5%) | 0.10 |
| Benzodiazepines | 487 (9.4%) | 124 (9.6%) | 104 (8%) | 121 (9.3%) | 138 (10.6%) | 0.15 |
| Corticosteroids | 106 (35) | 23 (1.8%) | 30 (2.3%) | 25 (1.9%) | 28 (2.2%) | 0.78 |
| Bisphosphonate | 127 (2.4%) | 21 (1.6%) | 37 (2.9%) | 43 (3.3%) | 26 (2%) | 0.02 |
| Smoking status (number (%)) | 0.03 | |||||
| Current | 600 (11.6%) | 183 (14.1%) | 139 (10.7%) | 131 (10.1%) | 147 (11.3%) | |
| Former | 2194 (42.3%) | 545 (42%) | 538 (41.5%) | 571 (44.1%) | 540 (41.6%) | |
| Never | 2390 (46.1%) | 569 (43.9%) | 619 (47.8%) | 592 (45.7%) | 610 (47%) | |
| Alcohol use (drinks/week) (number (%)) | 0.25 | |||||
| 0 | 2472 (47.9%) | 648 (50%) | 612 (47.8%) | 601 (46.4%) | 611 (47.2%) | |
| 1–7 | 2022 (39.2%) | 476 (36.8%) | 493 (38.5%) | 540 (41.7%) | 513 (42) | |
| >7 | 669 (13%) | 171 (13.2%) | 174 (13.6%) | 154 (11.9%) | 170 (13.1%) | |
| Frailty status (number (%)) | 0.09 | |||||
| Not frail | 2274 (48.4%) | 544 (46.3%) | 611 (51.4%) | 587 (49%) | 532 (46.7%) | |
| Prefrail | 2128 (45.3%) | 557 (47.4%) | 496 (41.8%) | 544 (45.4%) | 531 (46.6%) | |
| Frail | 297 (6.3%) | 74 (6.3%) | 81 (6.8%) | 66 (5.5%) | 76 (6.7%) | |
The overall incidence rate for hip fractures was 1.08 per 100 person-years (95% CI, 0.91 to 1.3) overall, including 535 hip fractures in 2956 women with an incidence rate of 1.30 per 100 person-years of follow-up (95% CI, 1.14 to 1.48); and 190 hip fractures in 2231 men with an incidence rate of 0.73 per 100 person-years of follow-up (95% CI, 0.44 to 1.21). The log-rank test across quartiles of niacin intake was significant (p = 4 × 10⁻⁴) (Figure 4). In final multivariable-adjusted models (MV3), higher dietary niacin intake (each 10 mg/day increment) was significantly associated with hip fractures in overall models (HR 1.12; 95% CI, 1.01 to 1.24) and in women (HR 1.15; 95% CI, 1.03 to 1.30), but not in men (HR 1.11; 95% CI, 0.89 to 1.39) (Table 4).
Figure 4.
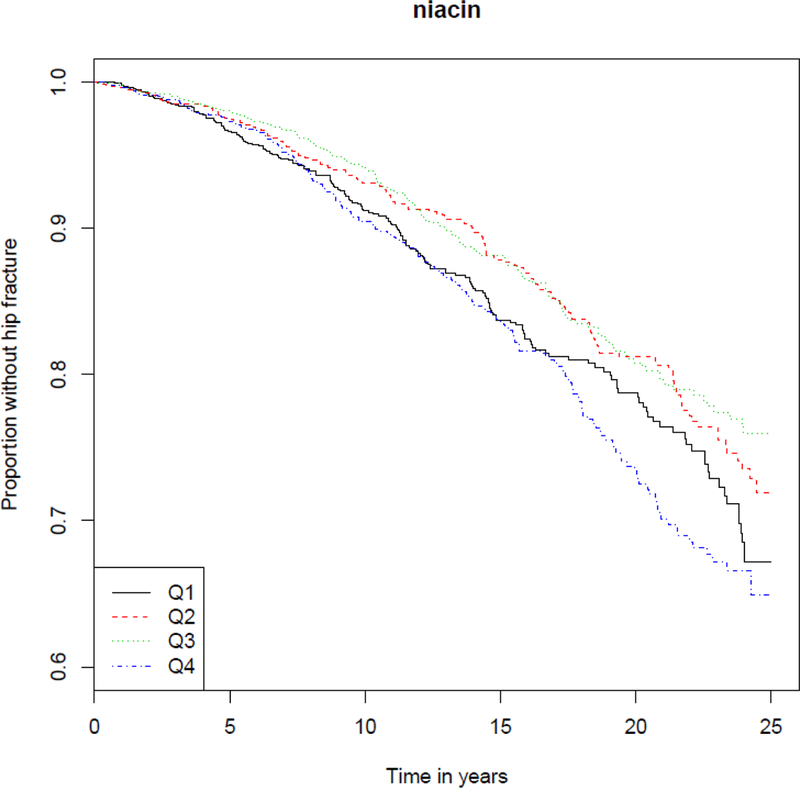
Kaplan–Meier plot of probability of staying hip fracture free among alive individuals by quartiles of niacin.
Table 4:
Risk of Incident Hip Fractures by Daily Dietary Niacin Intake (per 10 mg/day)
| All (n=725/5187) | Women (n=535/2956) | Men (n=190/2231) | |
|---|---|---|---|
| HR (95% CI) | HR (95% CI) | HR (95% CI) | |
| MV0 | 1.04 (0.99,1.10) | 1.05 (1.00, 1.11) | 1.04 (0.94, 1.15) |
| MV1 | 1.05 (1.00,1.10) | 1.05 (0.99, 1.12) | 1.04 (0.94, 1.15) |
| MV2 | 1.06 (0.97,1.16) | 1.06 (0.96,1.17) | 1.12 (0.92,1.36) |
| MV3 | 1.12 (1.01,1.24) | 1.15 (1.03,1.30) | 1.11 (0.89,1.39) |
MV0: unadjusted
MV1: age, gender, race, clinic site
MV2: age, gender, race, clinic site, BMI, cystatin C, physical activity, diabetes, education, calcium and vitamin D intake, medication use, smoking, alcohol and frailty
MV3: age, gender, race, clinic site, BMI, cystatin C, diabetes, education, calcium and vitamin D intake, medication use, smoking, alcohol, frailty, calories, protein intake
In the population of 1336 men and women with available DXA measurements, final multivariable adjusted models (MV3), there was a trend for a significant inverse association of niacin intake with hip BMD (p = 0.06) in overall models and in women (p = 0.05), but not in men (Table 5). There was no significant association of niacin intake with total body BMD or any measures of body composition in multivariable adjusted models overall or by gender (Table 5).
Table 5.
Association of Bone Mineral Density and Body Composition Measurements with Dietary Niacin Intake
| β | SE | 95%CI | P-Value | ||
|---|---|---|---|---|---|
| All | |||||
| Total Hip BMD | MV0 | −0.02 | 0.30 | (−0.80,0.50) | 0.63 |
| MV1 | −0.40 | 0.30 | (−1.00,0.10) | 0.10 | |
| MV2 | −0.90 | 0.40 | (−1.70,−0.10) | 0.04 | |
| MV3 | −0.90 | 0.50 | (−1.90,0.00) | 0.06 | |
| Total BMD | MV0 | 0.20 | 0.30 | (−0.40,0.80) | 0.54 |
| MV1 | −0.10 | 0.20 | (−0.60,0.30) | 0.54 | |
| MV2 | −0.70 | 0.40 | (−1.40,0.00) | 0.06 | |
| MV3 | −0.40 | 0.40 | (−1.30,0.40) | 0.29 | |
| Percent Fat | MV0 | −0.70 | 0.20 | (−1.00, −0.30) | <0.01 |
| MV1 | −0.50 | 0.10 | (−0.70, −0.20) | <0.01 | |
| MV2 | −0.20 | 0.20 | (−0.60,0.20) | 0.27 | |
| MV3 | −0.20 | 0.20 | (−0.60,0.30) | 0.49 | |
| Total Fat | MV0 | −0.80 | 0.20 | (−1.10,−0.40) | <0.01 |
| MV1 | −0.70 | 0.20 | (−1.00,−0.30) | <0.01 | |
| MV2 | −0.40 | 0.20 | (−0.70,−0.10) | 0.02 | |
| MV3 | −0.30 | 0.20 | (−0.70,0.10) | 0.15 | |
| Percent Lean | MV0 | 0.70 | 0.20 | (0.30,1.00) | <0.01 |
| MV1 | 0.50 | 0.10 | (0.20,0.70) | <0.01 | |
| MV2 | 0.20 | 0.20 | (−0.20,0.60) | 0.27 | |
| MV3 | 0.20 | 0.20 | (−0.30,0.60) | 0.49 | |
| Total Lean | MV0 | 0.10 | 0.20 | (−0.30,0.50) | 0.62 |
| MV1 | −0.10 | 0.10 | (−0.40,0.10) | 0.19 | |
| MV2 | −0.20 | 0.20 | (−0.50,0.20) | 0.32 | |
| MV3 | −0.20 | 0.20 | (−0.50,0.20) | 0.44 | |
| Total Mass | MV0 | −0.70 | 0.30 | (−1.20,−0.10) | 0.01 |
| MV1 | −0.80 | 0.20 | (−1.30,−0.40) | <0.01 | |
| MV2 | −0.60 | 0.30 | (−1.10,−0.10) | 0.03 | |
| MV3 | −0.50 | 0.30 | (−1.00,0.10) | 0.14 | |
| Women | |||||
| Total Hip BMD | MV0 | −1.10 | 0.30 | (−1.70,−.040) | <0.01 |
| MV1 | −1.10 | 0.30 | (−1.70,−0.50) | <0.01 | |
| MV2 | −1.10 | 0.50 | (−2.10,−0.20) | 0.02 | |
| MV3 | −1.10 | 0.60 | (−2.20,0.00) | 0.05 | |
| Total BMD | MV0 | −0.40 | 0.30 | (−0.90,0.10) | 0.13 |
| MV1 | −0.50 | 0.30 | (−1.00,0.00) | 0.07 | |
| MV2 | −1.00 | 0.40 | (−1.80,−0.20) | 0.02 | |
| MV3 | −0.80 | 0.50 | (−1.70,0.20) | 0.13 | |
| Percent Fat | MV0 | −0.50 | 0.20 | (−0.80,−0.10) | 0.02 |
| MV1 | −0.50 | 0.20 | (−0.80,−0.10) | 0.02 | |
| MV2 | 0.00 | 0.20 | (−0.50,0.40) | 0.98 | |
| MV3 | −0.10 | 0.30 | (−0.60,0.50) | 0.85 | |
| Total Fat | MV0 | −0.70 | 0.20 | (−1.20,−0.20) | <0.01 |
| MV1 | −0.70 | 0.20 | (−1.20,−0.30) | <0.01 | |
| MV2 | −0.20 | 0.20 | (−0.60,0.20) | 0.34 | |
| MV3 | −0.20 | 0.30 | (−0.70,0.30) | 0.41 | |
| Percent Lean | MV0 | 0.50 | 0.20 | (0.10,0.80) | 0.02 |
| MV1 | 0.50 | 0.20 | (0.10,0.80) | 0.02 | |
| MV2 | 0.00 | 0.20 | (−0.40,0.50) | 0.98 | |
| MV3 | 0.10 | 0.30 | (−0.50,0.60) | 0.85 | |
| Total Lean | MV0 | −0.20 | 0.10 | (−0.40,0.10) | 0.11 |
| MV1 | −0.20 | 0.10 | (−0.50,0.00) | 0.06 | |
| MV2 | −0.20 | 0.20 | (−0.50,0.20) | 0.38 | |
| MV3 | −0.20 | 0.20 | (−0.60,0.20) | 0.35 | |
| Total Mass | MV0 | −0.90 | 0.30 | (−1.50,−0.30) | 0.01 |
| MV1 | −0.90 | 0.30 | (−1.60,−0.30) | <0.01 | |
| MV2 | −0.40 | 0.30 | (−1.00,0.20) | 0.24 | |
| MV3 | −0.40 | 0.40 | (−1.10,0.30) | 0.26 | |
| Men | |||||
| Total Hip BMD | MV0 | 0.50 | 0.50 | (−0.40,1.50) | 0.26 |
| MV1 | 0.50 | 0.50 | (−0.40,1.40) | 0.24 | |
| MV2 | −0.20 | 0.80 | (−1.80,1.30) | 0.77 | |
| MV3 | −0.40 | 0.90 | (−2.20,1.50) | 0.70 | |
| Total BMD | MV0 | 0.40 | 0.40 | (−0.30,1.10) | 0.26 |
| MV1 | 0.40 | 0.40 | (−0.40,1.10) | 0.33 | |
| MV2 | −0.20 | 0.70 | (−1.50,1.10) | 0.77 | |
| MV3 | 0.00 | 0.80 | (−1.50,1.50) | 0.98 | |
| Percent Fat | MV0 | −0.60 | 0.20 | (−1.00,−0.20) | <0.01 |
| MV1 | −0.50 | 0.20 | (−0.90,−0.10) | 0.01 | |
| MV2 | −0.60 | 0.30 | (−1.20,−0.10) | 0.03 | |
| MV3 | −0.40 | 0.30 | (−1.10,0.30) | 0.24 | |
| Total Fat | MV0 | −0.70 | 0.20 | (−1.20,−0.20) | <0.01 |
| MV1 | −0.60 | 0.20 | (−1.10,−0.20) | 0.01 | |
| MV2 | −0.80 | 0.30 | (−1.40,−0.30) | 0.01 | |
| MV3 | −0.50 | 0.40 | (−1.20,0.10) | 0.12 | |
| Percent Lean | MV0 | 0.60 | 0.20 | (0.20,1.00) | <0.01 |
| MV1 | 0.50 | 0.20 | (0.10,0.90) | 0.01 | |
| MV2 | 0.60 | 0.30 | (0.10,1.20) | 0.03 | |
| MV3 | 0.40 | 0.30 | (−0.30,1.10) | 0.24 | |
| Total Lean | MV0 | 0.00 | 0.20 | (−0.40,0.40) | 0.99 |
| MV1 | 0.00 | 0.20 | (−0.40,0.40) | 0.89 | |
| MV2 | −0.20 | 0.30 | (−0.90,0.50) | 0.55 | |
| MV3 | −0.10 | 0.40 | (−0.90,0.70) | 0.80 | |
| Total Mass | MV0 | −0.70 | 0.40 | (−1.40,0.00) | 0.06 |
| MV1 | −0.60 | 0.40 | (−1.30,0.10) | 0.07 | |
| MV2 | −1.00 | 0.50 | (−2.00,−0.10) | 0.03 | |
| MV3 | −0.70 | 0.50 | (−1.70,0.40) | 0.23 | |
MV0: unadjusted
MV1: age, gender, race, clinic site
MV2: age, gender, race, clinic site, BMI, cystatin C, diabetes, education, calcium and vitamin D intake, medication use, smoking, alcohol and frailty
MV3: age, gender, race, clinic site, BMI, cystatin C, diabetes, education, calcium and vitamin D intake, medication use, smoking, alcohol, frailty calories, protein intake
There was no significant interaction of CRP concentrations with the association of niacin intake with incident hip fracture, BMD or any measurement of body, although higher niacin intakes were associated with lower CRP (data not shown). There were no significant associations of niacin intake stratified by RDA (2) intakes for niacin (11 mg/day for women and 14 mg/day for men) in any models for hip fracture, BMD, or body composition (data not shown).
In the post hoc analysis in final multivariable adjusted models (MV3), persons with a niacin intake below 21.8 mg/day had a hip fracture HR of 1.31 (95% CI, 1.04 to 1.66) compared to persons with a niacin intake range of 21.9 to 40.9 mg/day, and persons with a niacin intake above 40.9 mg/day had a hip fracture HR of 1.53 (95% CI, 1.20 to 1.95) compared to those with a niacin intake of 21.9 to 40.9 mg/day. Gender-stratified estimates in women comparing those with niacin intake above 40.9 mg/day to those between 21.9 and 40.9 mg/day were also significant (HR 1.60; 95% CI, 1.20 to 2.14), with a trend for significance in men (HR 1.69; 95% CI, 1.00 to 2.84) (Table 6).
Table 6:
Risk of Incident Hip Fractures by Quartiles of Dietary Niacin Intake
| All | Women | Men | ||
|---|---|---|---|---|
| HR (95% CI) | HR (95% CI) | HR (95% CI) | ||
| Quartile 1* | MV0 | 1.28 (1.07, 1.53) | 1.21 (0.99,1.49) | 1.43 (1.01, 20.4) |
| MV1 | 1.43 (1.20, 1.70) | 1.43 (1.17, 1.76) | 1.51 (1.08, 2.11) | |
| MV2 | 1.23 (1.03, 1.48) | 1.17 (0.94, 1.45) | 1.41 (0.99, 2.00) | |
| MV3 | 1.31 (1.04, 1.66) | 1.21 (0.91, 1.59) | 1.62 (.97, 2.7) | |
| Quartile 4* | MV0 | 1.4 (1.17, 1.67) | 1.36 (1.1, 1.68) | 1.53(1.09, 2.14) |
| MV1 | 1.36 (1.09, 1.69) | 1.32 (1.02, 1.72) | 1.52 (0.95, 2.46) | |
| MV2 | 1.48 (1.17, 1.88) | 1.48 (1.12, 1.95) | 1.78 (1.08, 2.94) | |
| MV3 | 1.53 (1.20, 1.95) | 1.60 (1.20, 2.14) | 1.69 (1.00, 2.84) | |
Compared with Quartiles 2,3
MV0: unadjusted
MV1: age, gender, race, clinic site
MV2: age, gender, race, clinic site, BMI, cystatin C, diabetes, education, calcium and vitamin D intake, medication use, physical activity, smoking, alcohol and frailty
MV3: age, gender, race, clinic site, BMI, cystatin C, diabetes, education, calcium and vitamin D intake, medication use, smoking, alcohol, frailty, calories, protein intake
The sensitivity analysis including femoral neck BMD in the final multivariable model was only able to include the1336 persons (184 hip fractures) with valid DXA measurements. The HR contrasting participants with niacin intake above 40.9 mg/day with those between 21.9 and 40.9 mg/day remains significant in MV3 in this small population, and the magnitudes are similar in both models (MV3: HR 1.63; 95% CI, 1.02 to 2.61; p = 0.041; and MV4 [including femoral neck BMD]: HR 1.63; 95% CI, 1.03 to 2.6; p = 0.038); the HR comparing individuals with lower niacin intake was not significant in either model. Second sensitivity analyses, excluding the 13 patients on supplemental niacin, showed no meaningful differences from the main analyses (data not shown). The population attributable risk for low or high niacin intake versus intermediate intakes, by gender shown in Table 7.
Table 7.
Population Attributable Fraction of Niacin Intake by Gender
| Time (years) | Attributable risk % (95% CI) |
|---|---|
| Women | |
| 5 | 11.5 (3.1–19.9) |
| 10 | 10.8 (2.94–18.7) |
| 15 | 9.99 (2.7–17.3) |
| 20 | 8.98 (2.4–15.6) |
| 25 | 7.89 (2.10–13.7) |
| Men | |
| 5 | 18.6 (4.89–32.3) |
| 10 | 17.9 (4.7–31.1) |
| 15 | 16.7 (4.34–29.11) |
| 20 | 15.6 (3.96–27.3) |
| 25 | 14.0 (3.5–24.5) |
Discussion
In this cohort of older community-dwelling women and men, we found a significant positive association between dietary niacin intake and risk of incident hip fractures, with spline analyses suggesting a U-shaped association and categorical analyses showing highest risk in the lowest and highest quartiles of dietary intake. Dietary niacin intake also was associated with a significant trend for lower hip BMD.
Previous reports of the association of niacin intake with skeletal health in humans have yielded conflicting findings. In a cross-sectional study including 137 postmenopausal (ages 39 to 60 years) Japanese women, niacin intake was not significantly associated with BMD at the calcaneus (13). In the Singapore Chinese Health Study, a population-based prospective cohort study that enrolled 63,257 men and women ages 45 to 74 years between 1993 and 1998, dietary intake of niacin was not associated with hip fracture after a mean follow-up of 13.8 years (14). In contrast, in 100 Polish women aged 51 to 70 years, those with osteoporosis had a 16% lower dietary intake of niacin than those without osteoporosis (15). Another study reported reduced cortical bone area in rib bone biopsies in 26 patients with pellagra (16). There are a number of mechanisms by which dietary niacin may be associated with skeletal health. In experimental studies in chicks, supplemental niacin was associated with adverse effects on both bone strength (34) and geometry (35) although mechanisms for these findings were not discussed. Mechanistically, niacin intake may have adverse skeletal effects because niacin stimulates prostaglandin D2 (PGD2) and serotonin release. PGD2 stimulates osteoblastogenesis and peripheral serotonin may have a negative impact on bone (11, 12). Conversely, niacin may also have positive effects on bone through its effects on SIRT1 gene expression (6, 36) and by decreasing inflammation (7). It is possible that these opposing effects on bone from niacin intake are a function of the specific amount of dietary intake, with lower and higher intakes placing one at risk for osteoporosis. Our data suggesting that high dietary niacin intake may be associated with osteoporosis is in contrast with the concept that there are no adverse effects from naturally occurring niacin from food (37). In agreement with the idea that dietary intake of niacin needs to be considered with respect to disease states, a recent meta-analysis suggested that the limits of nicotinic acid for nutritional supplements should be reconsidered, and that appropriate limits may differ for healthy versus disease states (38). Our findings in CHS suggest that trials including niacin intake for diseases of the aging, in particular, studies including patients at high risk for fracture, should include assessments of BMD and incident fractures and measure concentrations of niacin to understand more about the apparently complex association of niacin with BMD and osteoporosis, with careful consideration of different levels of dietary intake of niacin.
This study has a number of important strengths. To date, it is the largest study to examine the association of dietary niacin intake with risk of incident hip fracture including elderly white and African American women and men. It is the first study to evaluate the association of dietary niacin intake with body composition measures. The analyses also controlled for potentially important covariates, including physical activity that may interact with nutrition on bone parameters and inflammation (39).
The study also has several limitations. To start, misclassification of dietary intake of niacin may have occurred. The analyses relied on a one-time assessment of dietary niacin intake and the diets of study participants may have changed over time. There is no published information on changes in dietary intakes of niacin in persons in CHS. The findings were from an elderly cohort of men and women and may not be generalizable to other populations. The time gap between diet assessments and DXA measurements was 5 years, with niacin intake assessed at the baseline visit of CHS during years 1988–1989 and the DXA measurements in years 1994–1995. Further, we did not have serial DXAs to determine changes in BMD. We did not have urinary measurements of vitamin B3, which would have reflected recent dietary intake (40); we also did not measure blood levels of vitamin B3 (41). There were few hip fractures in men (n = 190) and we may not have had sufficient power to examine the association of dietary niacin intake with hip fractures in men. Finally, a recent editorial indicated the numerous challenges in nutritional epidemiological research that remain a potential issue in this study, including that relatively uncommon chemicals within food or components that appear only under specific conditions, genetic background, and other environmental exposures (42) which may be influencing our findings that we were not able to account for. Our findings are strictly that there is an epidemiological association of dietary intake of niacin with osteoporosis and in no way should this be misconstrued as a causative effect.
In conclusion, in this cohort of older community-dwelling women and men, our preliminary findings suggest that there is a weak association between dietary niacin intakes and hip fracture risk. However, replication in future studies in other cohorts is imperative and inclusion of measurements of urinary and blood concentrations of vitamin B3 should be considered.
Acknowledgements
Drs. Carbone, Bůžková, Fink, Isales, Le, Shikany, Coughlin, and Robbins participated in the analysis/interpretation of the data, drafting and/or critical analysis of the manuscript and approved the final version of the submitted manuscript. Mattie Raiford participated in drafting the manuscript, approved the final version and assisted with interpretation of the data. Drs. Carbone, Bůžková and Robbins accept responsibility for the integrity of the data analysis.
This work was supported by contract numbers N01-HC-85079; through N01-HC-85086; N01-HC-35129; N01 HC-15103; N01 HC-55222; N01-HC-75150; N01-HC-45133; grant number U01 HL080295 from the National Heart, Lung, and Blood Institute, with additional contribution from the National Institute of Neurological Disorders and Stroke.
Footnotes
The contents do not represent the views of the Department of Veterans Affairs or the United States Government.
References
- 1.Bonjour JP, Schurch MA, Rizzoli R Nutritional aspects of hip fractures. Bone. 1996; 18( 3 Suppl): 139s–44s. [DOI] [PubMed] [Google Scholar]
- 2.Jordan KM, Cooper C Epidemiology of osteoporosis. Best Pract Res Clin Rheumatol. 2002; 16( 5): 795–806. [DOI] [PubMed] [Google Scholar]
- 3.Sambrook P, Cooper C Osteoporosis. Lancet. 2006; 367( 9527): 2010–8. [DOI] [PubMed] [Google Scholar]
- 4.Erdman J Present Knowledge in Nutrition. 10th ed Oxford: Wiley-Blackwell; 2012. [Google Scholar]
- 5.Fukuwatari T, Shibata K Nutritional aspect of tryptophan metabolism. Int J Tryptophan Res. 2013; 6( Suppl 1): 3–8. [DOI] [PMC free article] [PubMed] [Google Scholar]
- 6.Iyer S, Han L, Bartell SM, et al. Sirtuin1 (Sirt1) promotes cortical bone formation by preventing beta-catenin sequestration by FoxO transcription factors in osteoblast progenitors. J Biol Chem. 2014; 289( 35): 24069–78. [DOI] [PMC free article] [PubMed] [Google Scholar]
- 7.Karacaglar E, Atar I, Altin C, et al. The effects of niacin on inflammation in patients with non-ST elevated acute coronary syndrome. Acta Cardiol Sin. 2015; 31( 2): 120–6. [DOI] [PMC free article] [PubMed] [Google Scholar]
- 8.Lipszyc PS, Cremaschi GA, Zorrilla-Zubilete M, et al. Niacin modulates pro-inflammatory cytokine secretion. a potential mechanism involved in its anti-atherosclerotic effect. Open Cardiovasc Med J. 2013; 7: 90–8. [DOI] [PMC free article] [PubMed] [Google Scholar]
- 9.Pasco JA, Kotowicz MA, Henry MJ, et al. High-sensitivity C-reactive protein and fracture risk in elderly women. JAMA. 2006; 296( 11): 1353–5. [DOI] [PubMed] [Google Scholar]
- 10.Koh JM, Khang YH, Jung CH, et al. Higher circulating hsCRP levels are associated with lower bone mineral density in healthy pre- and postmenopausal women: evidence for a link between systemic inflammation and osteoporosis. Osteoporos Int. 2005; 16( 10): 1263–71. [DOI] [PubMed] [Google Scholar]
- 11.Morrow JD, Parsons WG 3rd, Roberts LJ 2nd. Release of markedly increased quantities of prostaglandin D2 in vivo in humans following the administration of nicotinic acid. Prostaglandins. 1989; 38( 2): 263–74. [DOI] [PubMed] [Google Scholar]
- 12.Ducy P, Karsenty G The two faces of serotonin in bone biology. J Cell Biol. 2010; 191( 1): 7–13. [DOI] [PMC free article] [PubMed] [Google Scholar]
- 13.Sasaki S, Yanagibori R Association between current nutrient intakes and bone mineral density at calcaneus in pre- and postmenopausal Japanese women. J Nutr Sci Vitaminol (Tokyo). 2001; 47( 4): 289–94. [DOI] [PubMed] [Google Scholar]
- 14.Dai Z, Wang R, Ang LW, Yuan JM, Koh WP. Dietary B vitamin intake and risk of hip fracture: the Singapore Chinese Health Study. Osteoporos Int. 2013; 24( 7): 2049–59. [DOI] [PMC free article] [PubMed] [Google Scholar]
- 15.Wawrzyniak A, Klimczyk P, Wozniak A, Anyzewska A, Leonkiewicz M Assessment of differences in nutrients consumption in women diagnosed with osteoporosis as compared to a healthy control group. Rocz Panstw Zakl Hig. 2017; 68( 2): 143–9. [PubMed] [Google Scholar]
- 16.Paine RR, Brenton BP. Dietary health does affect histological age assessment: an evaluation of the Stout and Paine (1992) age estimation equation using secondary osteons from the rib. J Forensic Sci. 2006; 51( 3): 489–92. [DOI] [PubMed] [Google Scholar]
- 17.Fried LP, Borhani NO, Enright P, et al. The Cardiovascular Health Study: design and rationale. Ann Epidemiol. 1991; 1( 3): 263–76. [DOI] [PubMed] [Google Scholar]
- 18.Diehr P, Beresford SA. The relation of dietary patterns to future survival, health, and cardiovascular events in older adults. J Clin Epidemiol. 2003; 56( 12): 1224–35. [DOI] [PubMed] [Google Scholar]
- 19.Kumanyika S, Tell GS, Fried L, Martel JK, Chinchilli VM. Picture-sort method for administering a food frequency questionnaire to older adults. J Am Diet Assoc. 1996; 96( 2): 137–44. [DOI] [PubMed] [Google Scholar]
- 20.Psaty BM, Delaney JA, Arnold AM, et al. Study of cardiovascular health outcomes in the era of claims data: the Cardiovascular Health Study. Circulation. 2016; 133( 2): 156–64. [DOI] [PMC free article] [PubMed] [Google Scholar]
- 21.Robbins J, Hirsch C, Whitmer R, Cauley J, Harris T The association of bone mineral density and depression in an older population. J Am Geriatr Soc. 2001; 49( 6): 732–6. [DOI] [PubMed] [Google Scholar]
- 22.Mitchell D, Haan MN, Steinberg FM, Visser M Body composition in the elderly: the influence of nutritional factors and physical activity. J Nutr Health Aging. 2003; 7( 3): 130–9. [PubMed] [Google Scholar]
- 23.Erlandsen EJ, Randers E, Kristensen JH. Evaluation of the Dade Behring N Latex Cystatin C assay on the Dade Behring Nephelometer II System. Scand J Clin Lab Invest. 1999; 59( 1): 1–8. [DOI] [PubMed] [Google Scholar]
- 24.Psaty BM, Lee M, Savage PJ, Rutan GH, German PS, Lyles M Assessing the use of medications in the elderly: methods and initial experience in the Cardiovascular Health Study. The Cardiovascular Health Study Collaborative Research Group. J Clin Epidemiol. 1992; 45( 6): 683–92. [DOI] [PubMed] [Google Scholar]
- 25.Kim HJ, Park S, Park SH, et al. Prevalence of frailty in patients with osteoporotic vertebral compression fracture and its association with numbers of fractures. Yonsei Med J. 2018; 59( 2): 317–24. [DOI] [PMC free article] [PubMed] [Google Scholar]
- 26.Barzilay JI, Blaum C, Moore T, et al. Insulin resistance and inflammation as precursors of frailty: the Cardiovascular Health Study. Arch Intern Med. 2007; 167( 7): 635–41. [DOI] [PubMed] [Google Scholar]
- 27.Fried LP, Tangen CM, Walston J, et al. Frailty in older adults: evidence for a phenotype. J Gerontol A Biol Sci Med Sci. 2001; 56( 3): M146–56. [DOI] [PubMed] [Google Scholar]
- 28.Cushman M, Cornell ES, Howard PR, Bovill EG, Tracy RP. Laboratory methods and quality assurance in the Cardiovascular Health Study. Clin Chem. 1995; 41( 2): 264–70. [PubMed] [Google Scholar]
- 29.Macy EM, Hayes TE, Tracy RP. Variability in the measurement of C-reactive protein in healthy subjects: implications for reference intervals and epidemiological applications. Clin Chem. 1997; 43( 1): 52–8. [PubMed] [Google Scholar]
- 30.Young RL, Weinberg J, Vieira V, Ozonoff A, Webster TF. Generalized additive models and inflated type I error rates of smoother significance tests. Comput Stat Data Anal. 2011; 55( 1): 366–74. [DOI] [PMC free article] [PubMed] [Google Scholar]
- 31.National Research Council Subcommittee on the Tenth Edition of the Recommended Dietary Allowances. The National Academies Collection: reports funded by National Institutes of Health Recommended dietary allowances. 10th ed Washington, DC: National Academies Press; 1989. [Google Scholar]
- 32.Chen L, Lin DY, Zeng D Attributable fraction functions for censored event times. Biometrika. 2010; 97( 3): 713–26. [DOI] [PMC free article] [PubMed] [Google Scholar]
- 33.R Development Core Team. R environment for statistical computing. Vienna, Austria: R Foundation for Statistical Computing; 2018. [cited 2018 Nov 24]. Available from: https://www.R-project.org/. [Google Scholar]
- 34.Johnson NE, Harland BF, Ross E, Gautz L, Dunn MA. Effects of dietary aluminum and niacin on chick tibiae. Poult Sci. 1992; 71( 7): 1188–95. [DOI] [PubMed] [Google Scholar]
- 35.Johnson NE, Qiu XL, Gautz LD, Ross E Changes in dimensions and mechanical properties of bone in chicks fed high levels of niacin. Food Chem Toxicol. 1995; 33( 4): 265–71. [DOI] [PubMed] [Google Scholar]
- 36.Hwang ES, Song SB. Nicotinamide is an inhibitor of SIRT1 in vitro, but can be a stimulator in cells. Cell Mol Life Sci. 2017; 74( 18): 3347–62. [DOI] [PMC free article] [PubMed] [Google Scholar]
- 37.Institute of Medicine Standing Committee on the Scientific Evaluation of Dietary Reference I, its Panel on Folate OBV, Choline. The National Academies Collection: reports funded by National Institutes of Health Dietary reference intakes for thiamin, riboflavin, niacin, vitamin B6, folate, vitamin B12, pantothenic acid, biotin, and choline. Washington, DC: National Academies Press; 1998. [PubMed] [Google Scholar]
- 38.Minto C, Vecchio MG, Lamprecht M, Gregori D Definition of a tolerable upper intake level of niacin: a systematic review and meta-analysis of the dose-dependent effects of nicotinamide and nicotinic acid supplementation. Nutr Rev. 2017; 75( 6): 471–90. [DOI] [PubMed] [Google Scholar]
- 39.Beaudart C, Dawson A, Shaw SC, et al. Nutrition and physical activity in the prevention and treatment of sarcopenia: systematic review. Osteoporos Int. 2017; 28( 6): 1817–33. [DOI] [PMC free article] [PubMed] [Google Scholar]
- 40.Tsuji T, Fukuwatari T, Sasaki S, Shibata K Urinary excretion of vitamin B1, B2, B6, niacin, pantothenic acid, folate, and vitamin C correlates with dietary intakes of free-living elderly, female Japanese. Nutr Res. 2010; 30( 3): 171–8. [DOI] [PubMed] [Google Scholar]
- 41.Iwakawa H, Nakamura Y, Fukui T, et al. Concentrations of water-soluble vitamins in blood and urinary excretion in patients with diabetes mellitus. Nutr Metab Insights. 2016; 9: 85–92. [DOI] [PMC free article] [PubMed] [Google Scholar]
- 42.Ioannidis JPA. The challenge of reforming nutritional epidemiologic research. JAMA. 2018; 320( 10): 969–70. [DOI] [PubMed] [Google Scholar]