

Abstract
Genome analysis should allow the discovery of interdependent loci that together cause antibiotic resistance. In practice, however, the vast number of possible epistatic interactions erodes statistical power. Here, we extend an approach that has been successfully used to identify epistatic residues in proteins to infer genomic loci that are strongly coupled. This approach reduces the number of tests required for an epistatic genome-wide association study of antibiotic resistance and increases the likelihood of identifying causal epistasis. We discovered 38 loci and 240 epistatic pairs that influence the minimum inhibitory concentrations of 5 different antibiotics in 1,102 isolates of Neisseria gonorrhoeae that were confirmed in a second dataset of 495 isolates. Many known resistance-affecting loci were recovered; however, the majority of associations occurred in unreported genes, such as murE. About half of the discovered epistasis involved at least one locus previously associated with antibiotic resistance, including interactions between gyrA and parC. Still, many combinations involved unreported loci and genes. While most variation in minimum inhibitory concentrations could be explained by identified loci, epistasis substantially increased explained phenotypic variance. Our work provides a systematic identification of epistasis affecting antibiotic resistance in N. gonorrhoeae and a generalizable approach for epistatic genome-wide association studies.
Reporting Summary.
Further information on research design is available in the Nature Research Reporting Summary linked to this article.
Epistasis can both enable and prevent the evolution of antibiotic-resistant bacteria1. On the one hand, mutations that compensate for costly resistance variants2 can enable the evolution of multiresistant bacteria. On the other hand, epistasis can constrain the spread of antibiotic resistance if the fitness cost of resistance prohibits its transmission or spread by horizontal gene transfer. In the face of pathogens such as Neisseria gonorrhoeae that are rapidly evolving resistance to multiple antibiotics3, it has become increasingly important to identify the genetic factors causing resistance to develop new treatments.
In a pioneering study, Cui et al.4 found 5 epistatic interactions in an exhaustive genome-wide scan of pairs of 271,945 single nucleotide polymorphisms (SNPs) in 51 unrelated isolates of Vibrio parahaemolyticus. Nonetheless, in general it is difficult to discover all but the strongest epistatic interactions because the number of possible interactions to test is prohibitively large. To circumvent this problem, epistatic tests are often restricted to strong individual associations5. Alternatively, known protein–protein interactions and network information can be used to reduce the number of tests in genome-wide association studies (GWAS)6. In the end, neither of these approaches allow a systematic search for epistatic interactions.
To conduct a fully epistatic GWAS in the face of the combinatorial explosion of tests, we exploit sequence information by computing evolutionary couplings7 to identify epistatic interactions (Fig. 1). Evolutionary couplings analysis can separate causal interactions from indirect correlations8 including, to a large extent, global correlations caused by population structure and phylogeny9,10 or under-sampling. In recent years, evolutionary couplings methods have made breakthroughs in ab initio protein and RNA three-dimensional (3D) structure7,11, protein complex12 and mutation effects prediction13. Now, these methods are being adopted for bacterial genome analysis14,15. We hypothesized that evolutionary couplings, inferred from populations of bacterial pathogens, might represent functional or mechanistic dependencies betwfigeen loci that affect bacterial fitness. If true, evolutionary couplings can be used to filter pairs for epistatic GWAS, suggesting a principled alternative to pathway-based filtering approaches6.
Fig. 1 |. Evolutionary couplings power epistatic GWAS.
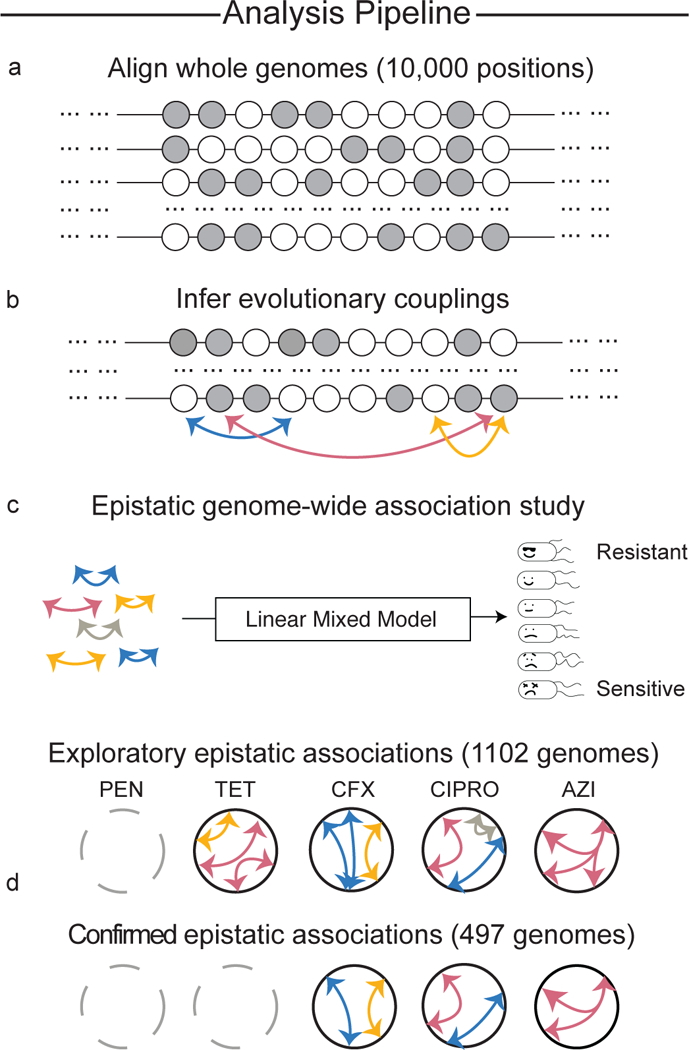
a, First, non-synonymous SNPs and non-coding variants with experimentally derived functional annotation are identified and used to generate a whole-genome alignment. b, Highly evolutionarily coupled loci are identified using an undirected graphical model given the multiple sequence alignment. c, The inferred evolutionary couplings are then tested in an exploratory set of 1,102 N. gonorrhoeae strains, using a linear mixed model, for their epistatic association to MICs for 5 antibiotics: PEN, TET, CFX, CIPRO and AZI. d, Significant epistatic associations are then confirmed in a geographically distinc set of 495 N. gonorrhoeae genomes.
Different approaches have been taken to scale evolutionary couplings analysis to whole genomes. Skwark et al.14 predefined fixed genomic windows then independently inferred and averaged parameters from loci sampled across genomic windows14. Puranen15 developed an optimized version of the standard pseudolikelihood inference method for evolutionary couplings analysis, capable of handling 104–105 polymorphic sites. Here we use our own optimized and parallelized inference method that can handle a similar magnitude of polymorphic sites.
In this work, we report SNPs and epistatic interactions, first identified with evolutionary couplings analysis, that were significantly associated with changes in minimal inhibitory concentration (MIC) in an exploratory dataset of clinical N. gonorrhoeae isolates and subsequently confirmed in a separate dataset. We found 35 significant loci and 240 epistatic interactions, many of which involved previously identified antibiotic resistance loci. Thus, our work provides a foundation for experimentalists and clinicians seeking to understand how epistatic interactions affect the rapid evolution of antibiotic resistance in clinical pathogens such as N. gonorrhoeae.
Results
N. gonorrhoeae isolate genomes and drug resistance.
We extracted whole-genome sequences and the MICs of five antibiotics (penicillin (PEN), tetracycline (TET), cefixime (CFX), ciprofloxacin (CIPRO) and azithromycin (AZI)) from clinical studies of N. gonorrhoeae infection (Supplementary Table 1). We used 1 dataset of 1,102 strains collected in the USA16 for exploration; for confirmation, a second dataset comprised 495 strains collected in Canada17 (n = 246) and England18 (n=249) (Supplementary Table 1). A phylogenetic analysis of all 1,597 isolates showed considerable diversity within both cohorts (Fig. 2, Methods). In general, MIC distributions across countries were broadly similar; however, the AZI MIC distribution in Canadian isolates was strikingly shifted to higher MICs compared to the distribution for the UK and US isolates (two-sample Kolmogorov–Smirnoff test, P ≤ 2.2×10⁻¹⁶; Fig. 2 and Supplementary Fig. 1). Ninety-two percent of isolates from both cohorts were resistant to at least one drug, using clinically defined thresholds from the European Committee ofAntimicrobial Susceptibility Testing (EUCAST)19 (Fig. 2 and Supplementary Fig. 1). Using N. gonorrhoeae FA1090 as a reference genome, we identified non-synonymous SNPs and SNPs in non-coding regions affecting gene expression20 that had a minor allele frequency≥ 0.5%, resulting in 8,686 loci (Methods).
Fig. 2 |. MIC (mgl−1) for N. gonorrhoeae strains.
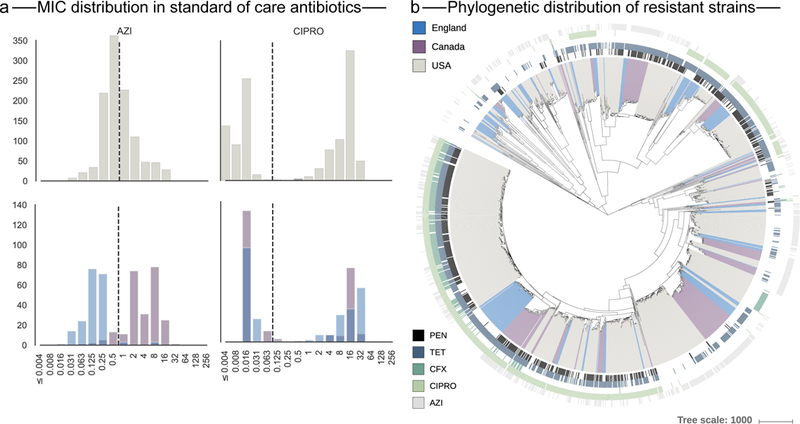
a, The dotted lines indicate clinical breakpoints for N. gonorrhoeae as defined by EUCAST. The upper panels show the MIC distribution in the exploratory dataset (n = 1,102) and the lower panels the distribution in the confirmatory dataset (n = 495). (See Supplementary Fig. 1 for details.) b, Geographic and phylogenetic distribution of resistance strains in the combined dataset. The coloured branches indicate the geographical origin of the strain and the lines surrounding the phylogenetic tree indicate resistance to one of the five antibiotics considered in this study (from PEN at the innermost ring, to TET, CFX, CIPRO and AZI at the outermost ring).
Probabilistic model to capture genome-wide interactions.
To identify epistatic contributions to the observed antibiotic resistance, it would be necessary to test over 37 million combinations of the 8,686 loci, resulting in low statistical power and a high probability of identifying spuriously correlated pairs. Since it seems reasonable to assume that only a small number of pairs of loci, if any, are causally related to the resistance phenotype, a logical approach would be to simply test the most correlated pairs. However, many of these pairs are probably non-causal, due to population structure that results in transitive correlations. This problem is seen in many areas of biological data analysis: correlation does not imply causation8. We solve this by applying a maximum entropy model to identify which pairs of loci best explain all other observed pairs in the data. The model and inference approaches we developed are based on a method that identifies causal dependencies and epistasis between residues in proteins and RNAs that has led to successful folding of 3D structure7,8 and prediction of mutation effects13 from sequence alone.
Therefore, we computed the epistatic relationships between the 8,686 loci before exploring the association to antibiotic resistance phenotypes. Our statistical model associates the genome sequence σ with a probability distribution P(σ) at equilibrium as
where Z is a normalization constant. We define E (σ) as the sum of coupling terms Jij between every pair of loci in a sequence and a locus-wise bias term hi:
We use regularized pseudolikelihood maximization inference21 to compute the parameters Jij and hi. To measure the evolutionary coupling strength between pairs of loci, the inferred parameters Jij are summarized using the Frobenius norm (FN):21
which is corrected for population structure and under-sampling using the average product correction22. From the set of all pairs (~37 million), we selected the most strongly coupled pairs using a two-component mixture model (Supplementary Fig. 2, Methods). This resulted in a high-confidence set of 242,360 pairs involving 7,868 loci in 1,438 genes with the majority in protein-coding genes (7,437); 178 within transcription start sites or 5′ untranslated regions; 224 within promoters; and 29 within ribosomal RNAs (rRNAs; Supplementary Table 2).
We found good evidence for our hypothesis that evolutionary couplings between genes often reflect functional interactions. The top interacting genes were pilY1 and a pilus protein-encoding gene (NGO1911a) that is 92% identical to pilC. Strikingly, pilY1 interacts with seven different opacity proteins (NGO1861a, NGO0066a, NGO1073a, NGO1277a, NGO1463a, NGO1513, NGO1040a) within the top 100 gene–gene interactions. Opacity and pilus proteins jointly affect adhesion to host cells during infection, so we hypothesize that these interactions affect adhesion and pathogenesis23. The second most coupled gene–gene interaction was found between transferrin-binding protein A and its cofactor, transferrin-binding protein B, which are co-transcribed, co-regulated and physically interact with each other24,25. We also found an interconnected evolutionary coupling network between the genes of the Mtr efflux pump (mtrC, mtrC, mtrE) and its repressor mtrR, as well as an interconnected evolutionary coupling network between genes of the type IV pilus (fimT, pilE, pilV, pilW and pilX), which is essential for host colonization and pathogenicity26,27, all within the top 100 interactions. murE and penA were also highly coupled and formed an interconnected evolutionary coupling network with murF. These cell wall biosynthesis genes occur in the same pathway and are highly likely to interact based on their co-occurrence in multiple organisms and occasional gene fusions28. Further examples and details are found in Supplementary Table 3.
Genome-wide, single-site analysis recapitulates known associations and predicts new ones.
Before testing the epistatic pairs, we performed a single-site GWAS analysis. We used a linear mixed model to measure the association strength of individual loci with the measured change in MICs, correcting for population structure29,30 (Methods). We tested all 8,686 loci for association, controlling for multiple hypothesis testing using a Bonferroni correction with an unadjusted α = 0.05.
Checking for lineage effects.
To control for spurious associations due to remaining phylogenetic correlations, we inferred the population structure of the combined dataset using RhierBAPS31,32, assigned the strains into 18 inferred clades and removed significant loci whose minor allele only occurred in one clade, following Coll et al.5 (see Methods). On average, significant loci were found in 11 (s.d. = 6) clades with a mean maximal clade distance of 23.4% (s.d. = 4.1, ~1,998 nucleotide differences), indicating that the associated loci evolved multiple times and were not caused by ancestral resistance. Loci within five genes (gyrA, gshB, doxX, pyrG and uvrC) associated with CIPRO were found in all clades, suggesting that these associations were spuriously caused by a deep ancestral origin. However, when we tested that hypothesis we found that the five loci occurred dozens of times on the phylogeny, contradicting a deep ancestral origin (Methods and Supplementary Fig. 3). An analysis of the homoplasy distribution of all SNPs showed that significant loci reoccurred on the phylogeny far more because of recurrent mutation and selection, or recurrent recombination, than the average SNP (two-sample Kolmogorov-Smirnoff test, P < 10−8). This result implies that the population structure correction successfully filtered out SNPs on deep internal branches as well as recent SNPs near the tips of the tree (Supplementary Fig. 3). Nearly half (38/82) of the significant associations in the exploratory dataset were also significant in the confirmatory dataset (Tables 1 and 2 and Supplementary Table 4).
Table 1 |.
Single loci associated with change in sensitivity or resistance to CIPRO
| Locus | Gene | Variant compared to FA1090 |
P value | β | Amino acid change |
Minor allele frequency in resistant isolates |
Number of clades containing strains with a minor allele |
|---|---|---|---|---|---|---|---|
| 620917a | gyrA (NGO0629) | S91F | 8.25 × 10−101 | 2.727 | 832 | 239/833 | 18 |
| 620905a | gyrA (NGO0629) | D95(A/G) | 1.98 × 10−43 | 2.091 | 254/783 | 299/833 | 18 |
| 1210781a | parC (NGO1259) | S87R | 9.96 × 10⁻¹⁸ | 1.929 | 700 | 702/833 | 6 |
| 894348a` | dldH (NGO0915) | A88Vb | 6.68 × 10⁻⁹ | −1.265 | 174 | 5/833 | 15 |
| 1167114a | gshB (NGO1217) | E221K | 2.71 × 10⁻⁸ | 0.920 | 859 | 242/833 | 18 |
| 1687733a | comF (NGO1726) | F43Y | 1.86 × 10⁻⁷ | −1.004 | N/A | 32/883 | 14 |
| 93476 | NGO0086 | D363E | 1.66 × 10⁻⁵ | −0.885 | 692 | 428/833 | 12 |
| 1167527 | gshB (NGO1217) | E83Ab | 1.91 × 10⁻⁵ | 0.647 | 116 | 44/833 | 18 |
| 89733 | pglD (NGO0083) | A360T | 2.07 × 10⁻⁵ | 0.728 | 325 | 5/833 | 11 |
| 1393066a | cirA (NGO1430) | R122P | 2.83 × 10⁻⁵ | 0.947 | N/A | 182/833 | 5 |
| 1921503a | doxX (NGO1948) | L139R | 4.09 × 10⁻⁵ | 0.837 | 33 | 3/833 | 18 |
| 1923171a | prfB (NGO1951) | −84A→G | 4.93 × 10⁻⁵ | −0.930 | 640 | 625/833 | 9 |
| 447535 | fimT (NGO0452) | G100Db | 9.02 × 10⁻⁵ | −0.553 | 828 | 228/833 | 15 |
| 11626001 | pyrG (NGO1212) | −12G→A | 1.76 × 10⁻⁴ | 0.647 | 1167 | 11/883 | 18 |
| 11626021 | pyrG (NGO1212) | −14A→G | 1.76 × 10⁻⁴ | 0.647 | 599/251 | 429/833 | 18 |
| 964051a | NGO0993 | K161Eb | 3.89 × 10−04 | −0.526 | N/A | 3/833 | 9 |
| 1378462 | nqrB (NGO1414) | A25V | 6.61 × 10−04 | −0.578 | 811 | 242/833 | 7 |
| 565114 | uvrC (NGO0578) | N258D | 6.96 × 10⁻⁴ | 0.664 | 603 | 37/833 | 18 |
| 1747633 | gapA/B NGO1776 | V267Ab | 8.82 × 10⁻⁴ | −0.568 | 334 | 3/833 | 11 |
| 13730032 | NGO1407 | L66M | 1.16 × 10⁻³ | −0.666 | 334 | 3/833 | 4 |
| 1372748 | NGO1407 | −61 A→G | 1.16 × 10⁻³ | −0.666 | 832 | 239/833 | 2 |
| 13730052 | NGO1407 | L66M | 1.16 × 10⁻³ | −0.666 | 254/783 | 299/833 | 4 |
Loci associated with significant epistatic interactions, as shown in Fig. 4.
Minor allele on the left (coding variants have the minor allele on the right). Non-coding variants are labelled with the distance upstream (–) from the closest gene. β is the regression coefficient associated with the minor allele variant in the linear mixed model, run on the confirmatory dataset. Reported P values were calculated using a Wald test and were Bonferroni corrected for multiple tests. Significance was first determined in the exploratory dataset (n = 1,102) and then confirmed in a second dataset (n = 495). The count of each variant (with respect to FA1090) in N. gonorrhoeae isolates from the combined exploratory and confirmatory data sets is reported, as is the fraction of resistant isolates in the combined data sets with the minor allele variant. Superscripted numbers indicate loci in perfect linkage disequilibrium. Loci in bold are known resistance variants. N/A, not applicable.
Table 2 |.
Single loci associated with change in sensitivity or resistance to AZi, PEN, TET and CFX
| Antibiotic | Locus | Gene | Variant | P value | β | Amino acid change |
Minor allele Frequency in resistant isolates |
Number of clades containing strains with a minor allele |
|---|---|---|---|---|---|---|---|---|
| AZI | 1116541a |
23 S rRNA (NGOr02) |
C2617T (C2611T) | 2.19 × 10⁻³¹ | 0.889 | N/A | 315/690 | 16 |
| PEN | 1789058 | porB (NGO1812) | A121(D/G/V) | 2.45 × 10⁻⁴ | 0.348 | 448/22/4 | 217/678 | 15 |
| PEN | 1789148 | porB (NG01812) | V151A | 4.78 × 10⁻³ | −0.249 | 544 | 47/678 | 15 |
| TET | 1789088 | porB (NG01812) | F131Y | 1.33 × 10⁻³ | −0.174 | 417 | 139/1061 | 15 |
| CFX | 1516685a,1 | penA (NG01542) | V160A | 2.14 × 10⁻¹⁵ | 0.958 | 398 | 277/283 | 5 |
| CFX | 1516646a,1 | penA (NG01542) | N173S | 2.14 × 10⁻¹⁵ | 0.958 | 398 | 277/283 | 5 |
| CFX | 1515528a | penA (NGO1542) | G546S | 5.08 × 10⁻¹² | 0.859 | 396 | 274/283 | 5 |
| CFX | 1516861a | penA (NG01542) | D101E | 1.54 × 10⁻¹⁰ | 0.954 | 406 | 277/283 | 4 |
| CFX | 1516798a | penA (NG01542) | V122(F/V) | 1.54 × 10⁻¹⁰ | 0.954 | ¼22 | 277/283 | 5 |
| CFX | 1514399 | murE (NG01541) | A331(E/G) | 1.41 × 10⁻⁹ | 0.835 | 408/5 | 27½83 | 4 |
| CFX | 1514450 | murE (NG01541) | A314G | 1.41 × 10⁻⁹ | 0.835 | 406 | 27½83 | 5 |
| CFX | 1516552a,2 | penA (NG01542) | D204E | 7.54 × 10⁻⁹ | 0.802 | 434 | 277/283 | 5 |
| CFX | 1516556a,2 | penA (NG01542) | E203G | 7.54 × 10⁻⁹ | 0.802 | 434 | 277/283 | 5 |
| CFX | 1516563a | penA (NG01542) | Y201H | 7.54 × 10⁻⁹ | 0.802 | 437 | 277/283 | 6 |
| CFX | 15152523 | murE (NG01541) | A47Tb | 2.83 × 10⁻⁴ | 0.465 | 1060 | 277/283 | 12 |
| CFX | 15152633 | murE (NG01541) | P43(L/Q)b | 2.83 × 10⁻⁴ | 0.465 | 4/1060 | 277/283 | 12 |
Loci associated with significant epistatic interactions, as shown in Fig. 4.
Minor allele on the left (coding variants have the minor allele on the right). β is the regression coefficient associated with the minor allele variant in the linear mixed model, run on the confirmatory dataset. Reported P values were calculated using a Wald test and were Bonferroni corrected for multiple tests. Significance was first determined in the exploratory dataset (n = 1,102) and then confirmed in a second dataset (n = 495). The count of each variant (with respect to FA1090) in N. gonorrhoeae isolates from the combined exploratory and confirmatory data sets is reported, as is the fraction of resistant isolates in the combined data sets with the minor allele variant. Superscripted numbers indicate loci in perfect linkage disequilibrium. Loci in bold are known resistance variants. N/A, not applicable
Single-site associations to CIPRO.
Of these 38 confirmed loci, 22 were associated with CIPRO, with known loci in gyrA (2 loci) and parC as the most significant (P = 8.25 × 10−101, 1.98 × 10−43 and 9.96 × 10⁻¹⁸, respectively) (Table 1). The 22 associations occur in 15 genes and 3 non-coding regions. Associations found in dldH (dihydrolip oyl dehydrogenase, p.A88V, P = 6.68 × 10⁻⁹) and gshB (glutathione synthetase, p.E221K, P = 2.71 × 10⁻⁸) suggest involvement of the oxidative stress response33, which can be induced by fluoroquinolones34 such as CIPRO. The dldH locus p.A88V lies on the homodimer interface of the multimeric enzyme, suggesting that multimerization stability is part of its mechanism (Fig. 3). Our analysis suggests that the dldH minor allele variant (alanine in the confirmatory dataset) causes greater CIPRO sensitivity, since it is uncommon in resistant isolates (5/833) and its regression coefficient (β) is negative. By contrast, the minor allele variant p.E221K in gshB is associated with a higher CIPRO MIC and a positive regression coefficient, suggesting that the lysine variant increases resistance. The highest density of CIPRO associations was found in the AsnC family transcriptional regulator NGO1407 (three loci), gyrA, gshB and in the 5′ untranslated region of pyrG (two loci each).
Fig. 3 |. Associations that occur in structural binding sites.
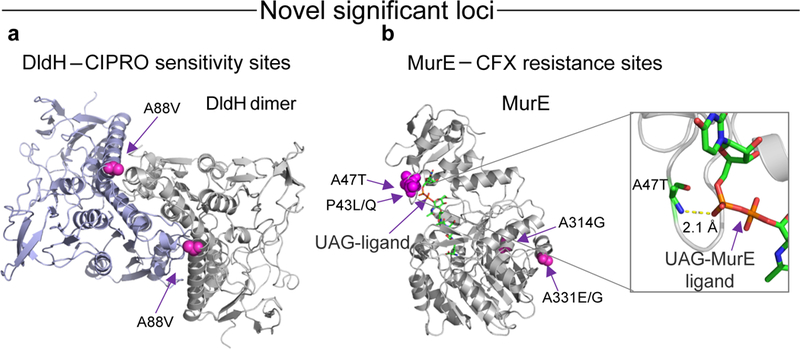
a, dldH A88 (magenta), associated with CIPRO resistance, maps onto the interface of the homodimer shown in the 3D structure of the homologous protein in Pisum sativum, 1dxl (ref. 59). b, Two out of four variants associated with CFX resistance in murE map onto the enzyme active site, as shown in the 3D structure of the homologous protein in E. coli, 1e8c (ref. 60), co-crystallized with its substrate uridine-5′-diphosphate-N-acetylmuramoyl-L-alanine-D-glutamate (UAG). See Tables 1 and 2 for details.
Single-site associations to CFX.
Eight of our CFX-associated loci are in the antibiotic target penA (penicillin-binding protein 2). penA is mosaic in the test isolates16 and only one of these eight associations has been shown to affect resistance35 (G546S, P = 5.08 × 10⁻¹²). The remaining four loci are in the cell wall biosynthesis gene, murE. Mutations in murE increase β-lactam resistance in Streptococcus pneumoniae36, but to our knowledge, have not been reported in N. gonorrhoeae (Fig. 3).
Single-site associations to PEN, TET and AZI.
We recovered a known porB site associated with increased resistance16 (p.A121D/G/V, P = 2.45 × 10⁻⁴) in our confirmatory dataset. We also identified loci in porB that are probably associated with increased antibiotic sensitivity (their regression coefficients (β) are negative). One was associated with PEN (p.V151A, P = 4.73 × 10⁻³) and another was associated with TET (p.F131Y, P = 1.33 × 10⁻³). This shows that porB variation can increase sensitivity as well as resistance to antibiotics. The only single association we see for AZI is a known locus in 23S rRNA c.C2617T, previously described as c.C2611T (P = 2.19 × 10⁻³¹).
As expected, a number of the significant loci (10 loci in 7 haplotypes) to all the antibiotics are in perfect linkage disequilibrium. When these are haplotypes of linked mutations, for example, penA or murE loci affecting CFX resistance, this suggests that the full haplotype affects antibiotic resistance. However, when they are instead mutually exclusive haplotypes, for example, pyrG or NGO1407 loci affecting CIPRO resistance, this suggests selection and parallel evolution for antibiotic resistance (Tables 1 and 2).
Genome-wide association identifies epistatic pairs associated with antibiotic resistance.
Next, we tested all 242,360 pairs of loci with high-scoring evolutionary couplings for epistatic association. To assess the contribution of each epistatic effect, we compared a linear mixed model with an interaction term against a model that considers the individual sites as additive effects. As before, we applied a Bonferroni correction for multiple testing at an unadjusted α = 0.05 and removed pairs if either of the two loci was only observed in one clade. We considered an epistatic pair to be present in a clade if one of the two loci were observed as minor allele in at least one strain of the associated clade. To rule out ancestral resistance, we verified that the allele co-frequency of each pair was dissimilar across the clades (Supplementary Table 5).
We verified 240 epistatic associations in the confirmatory dataset (Fig. 4 and Table 3), out of 729 significant epistatic associations in the exploratory dataset (Supplementary Tables 5 and 6). We confirmed epistatic interactions to CIPRO, CFX and AZI but not to TET (54/729 significant in the exploratory dataset) or PEN (0/729 significant in the exploratory dataset). Notably, all epistatic interactions involved loci that were confirmed in our single-locus GWAS; 10 epistatic associations connected two loci, each of which were significant in our single-locus GWAS. The remaining 230 interactions connected an associated locus to a non-associated one. In addition, most of the previously known resistance loci that we identified in our single-locus GWAS (5/6) also occurred in our epistatic GWAS analysis (135 occurrences); 119 of the confirmed epistatic associations were associated with CIPRO MIC change, 58 with CFX and 63 with AZI.
Fig. 4 |. Significant epistatic interactions affecting antibiotic resistance and sensitivity in N. gonorrhoeae.
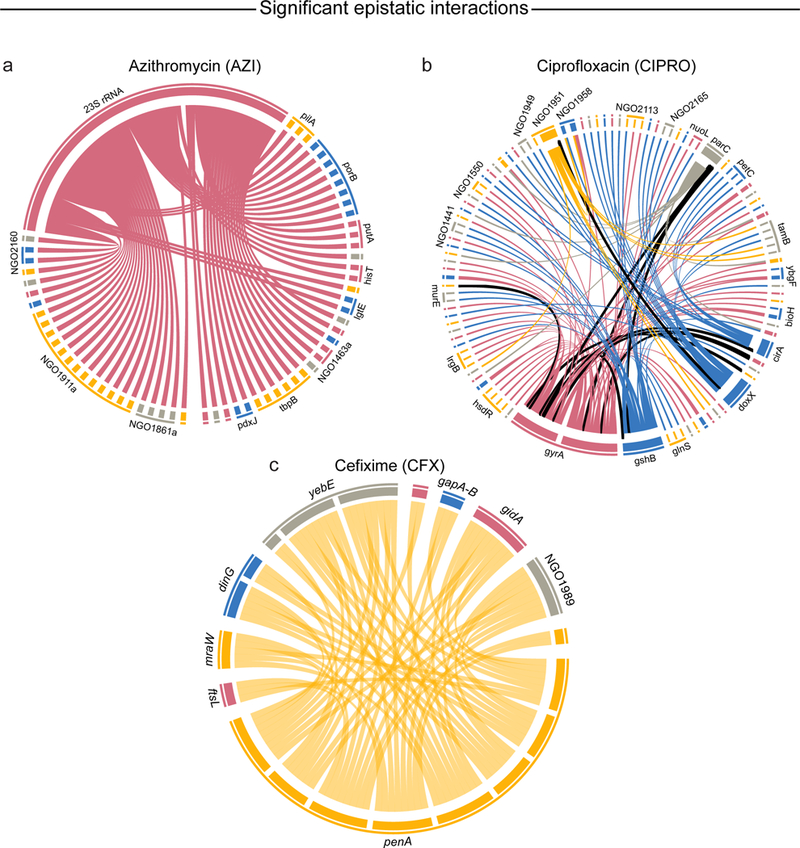
The edges between pairs of positions that are both individually associated with changes in MIC are outlined in black. a, Epistatic interactions affecting resistance to AZI (n = 63). All interactions are connected to a single C2617T variant in 23S rRNA, which is known to cause significant resistance to AZI. b, Epistatic interactions affecting resistance to CIPRO (n = 119). c, Epistatic interactions affecting resistance to CFX (n = 58). Significance was determined by a likelihood ratio test using a linear mixed model with and without an interaction term. Bonferroni correction was used to adjust for multiple comparison. See Supplementary Table 5 for more details.
Table 3 |.
Selected set of epistatic pairs of loci associated with change in antibiotic sensitivity or resistance (detailed results are found in Supplementary Table 5)
| Antibiotic | Locus i | Locus j | Gene i | Gene j | Variant i | Variant j | β | P value | Number of clades containing strains with at least one minor allele |
Co-frequency in resistant strains |
|||
|---|---|---|---|---|---|---|---|---|---|---|---|---|---|
| 00 | 01 | 10 | 11 | ||||||||||
| AZI | 1116541 | 1230597 | 23S rRNA | NGO1277 | C2617T | D173G | 0.877 | 5.77 × 10⁻²⁹ | 18 | 0.327 | 0.215 | 0.153 | 0.305 |
| AZI | 1116541 | 1427960 | 23S rRNA | NGO1463a | C2617T | V123L | 0.877 | 5.77 × 10⁻²⁹ | 17 | 0.499 | 0.044 | 0.455 | 0.003 |
| AZI | 1116541 | 1530961 | 23S rRNA | putA (NGO1552a) | C2617T | E1169G | 0.877 | 5.77 × 10⁻²⁹ | 17 | 0.281 | 0.262 | 0.172 | 0.286 |
| AZI | 1116541 | 1830643 | 23S rRNA | NGO1861a | C2617T | S90R | 0.877 | 5.77 × 10⁻²⁹ | 16 | 0.391 | 0.151 | 0.350 | 0.108 |
| CFX | 1516646 | 1517334 |
penA (NGO1542) |
ftsL (NGO1543) | N173S | L52V | 0.956 | 1.63 × 10⁻¹⁰ | 13 | 0.021 | 0.000 | 0.979 | 0.000 |
| CFX | 1516685 | 1665722 |
penA (NGO1542) |
yebE (NGO1709) | V160A | K90E | 0.959 | 1.63 × 10⁻¹⁰ | 8 | 0.021 | 0.000 | 0.067 | 0.912 |
| CFX | 1516861 | 1664127 |
penA (NGO1542) |
dinG (NGO1708) | D101E | A287T | 0.950 | 3.08 × 10⁻⁸ | 4 | 0.021 | 0.000 | 0.177 | 0.802 |
| CFX | 1516798 | 1665722 |
penA (NGO1542) |
NGO1709 | V122F/V | K90E | 0.950 | 3.08 × 10⁻⁸ | 7 | 0.021 | 0.000 | 0.067 | 0.912 |
| CIPRO | 620905 | 1210781 |
gyrA (NGO0629) |
parC (NGO1259) | D95A/G | S87R | 1.984 | 1.26 × 10⁻³⁰ | 18 | 0.054 | 0.621 | 0.102 | 0.222 |
| CIPRO | 620917 | 1210781 |
gyrA (NGO0629) |
parC (NGO1259) | S91F | S87R | 2.413 | 1.73 × 10−45 | 18 | 0.077 | 0.636 | 0.079 | 0.208 |
| CIPRO | 620917 | 2028211 |
gyrA (NGO0629) |
glmU (NGO2053) | S91F | T425A | 2.413 | 1.73 × 10−45 | 18 | 0.565 | 0.148 | 0.206 | 0.082 |
| CIPRO | 620917 | 1974020 |
gyrA (NGO0629) |
birA (NGO2001) | S91F | E261K | 2.413 | 1.73 × 10−45 | 18 | 0.667 | 0.046 | 0.266 | 0.022 |
| CIPRO | 620917 | 693931 |
gyrA (NGO0629) |
hsdS (NGO0699) | S91F | A173T | 2.413 | 1.73 × 10−45 | 18 | 0.680 | 0.032 | 0.263 | 0.024 |
| CIPRO | 620917 | 894348 |
gyrA (NGO0629) |
dldH (NGO0915) | S91F | A88V | 2.413 | 1.73 × 10−45 | 18 | 0.681 | 0.031 | 0.263 | 0.024 |
| CIPRO | 620917 | 1167114 |
gyrA (NGO0629) |
gshB (NGO1217) | S91F | E221K | 2.413 | 1.73 × 10−45 | 18 | 0.665 | 0.048 | 0.044 | 0.243 |
| CIPRO | 620917 | 1522835 |
gyrA (NGO0629) |
ftsN (NGO1549) | S91F | Q142R | 2.413 | 1.73 × 10−45 | 18 | 0.649 | 0.064 | 0.058 | 0.230 |
Loci in bold are known resistance variants. β is the regression coefficient associated with each locus in the linear mixed model. Reported P values were calculated using a likelihood ratio test comparing a linear mixed model with an interaction term against one without it. The P values were Bonferroni corrected to adjust for multiple comparisons. Significance was first determined in the exploratory dataset (n = 1,102) and then confirmed in a second dataset (n = 495).
Epistatic associations to AZI.
All significant epistatic associations to AZI involved a single, known antibiotic resistance locus C2617T (identical to C2611T in previous reports16) in the 23S rRNA (Table 3 and Fig. 4a). The interaction between 23S rRNA and the p.S90R locus of the NGO1861a opacity protein stood out as one of the pairs appearing in the fewest clades (16) with the highest maximum clade distance (25.9%) of all AZI-associated interactions (Fig. 5a). The S90R mutation was independently observed in 15% of resistant strains and co-occurred together with C2617T in 10.8% of resistant strains. Of the 12 genes containing 2 or more associated loci, 7 were either membrane proteins (NGO1496, NGO1861a, NGO1463a, PorB), cell wall biosynthesis proteins (LgtE) or pilus proteins (NGO1911a, PilA).
Fig. 5 |. Occurrence of selected epistatic pairs across phylogenetic clades.
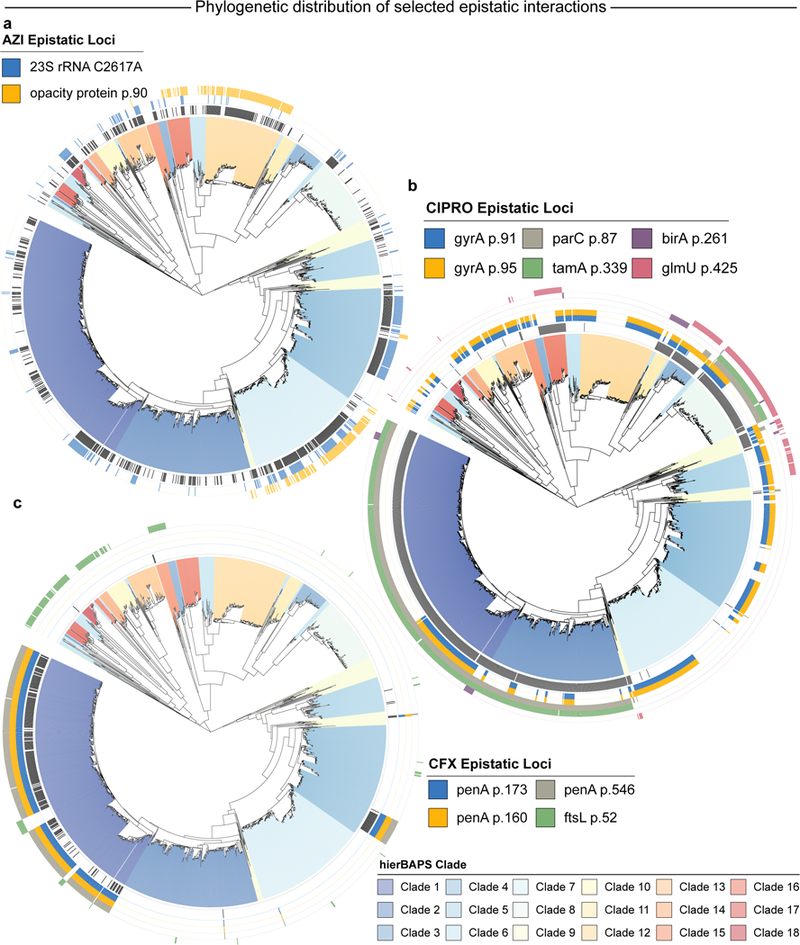
Each of the 18 clades inferred by RhierBAPS is coloured on the phylogeny. The occurrence of selected epistatic loci that are mentioned in the text is indicated by the coloured rings. A–c, The innermost black ring indicates strains that are resistant to AZI (a), CIPRO (b) and CFX (c). Detailed information can be found in Supplementary Table 5.
Epistatic associations to CIPRO.
Epistatic associations correlated with CIPRO MIC change involved 79 genes (Fig. 4b). The 26 most significant interactions (all at P = 1.73 × 10−45) involved the well-known p.S91F resistance locus in gyrA3. Epistatic pairs involving S91F and D95A/G are highly correlated, suggesting underlying epistatic interactions between a gyrA haplotype with both S91F and D95A/G variants and several other loci in the genome (Fig. 5b). These include strong interactions between known resistance variants in gyrA and parC (gyrA S91F to parC S87F, P = 1.73 × 10−45; gyrA D95A/G to parC S87F, P = 1.26 × 10⁻³⁰). parC and gyrA both encode type II topoisomerases and their resistance variants S91F (gyrA) and S87F (parC) are in homologous positions close to DNA and CIPRO binding sites, where these mutations allow the enzyme to religate DNA37 in the presence of antibiotic. To our knowledge, this is the first report of epistatic effects between these loci in N. gonorrhoeae; notably, homologous epistatic interactions (affecting both CIPRO resistance and fitness) have been seen in experiments with S. pneumoniae38. Several of the significant associations involved loci associated with sensitivity or resistance to CIPRO in other organisms. For instance, we identified interactions between gyrA S91F and birA E261K (P = 1.73 × 10−45), and between gyrA S91F and glmU T425A (P = 1.73 × 10−45). birA is known to increase sensitivity to CIPRO when under-expressed in Mycobacterium smegmatis39, while the abundance of GlmU protein increases under CIPRO stress in Salmonella typhimurium, possibly modulating cell wall permeability40.
We also identified an epistatic interaction between L339F in translocation and assembly module subunit TamA and S87F in parC (P = 5.73 × 10⁻¹⁵), co-occurring in 81% of all resistance strains. This epistatic pair was present in only 6 clades (Fig. 5b), with an average clade distance of 22% (max = 25.9%). This epistatic pair occurred in the fewest number of clades over all CIPRO resistance-associated pairs, indicating that the epistatic pairs that we identified are not artefacts caused by population structure. In total, 10 genes and 1 promoter contained 3 or more epistatic associations, dominated by inner and outer membrane proteins (DoxX, LrgB, CirA, PetC, TamA, TamB), some of which are associated with oxidative stress33.
Epistatic associations to CFX.
By contrast with CIPRO, epistatic associations with CFX involved only 11 genes (Fig. 4c), each with multiple associated loci (58 pairs of alleles). Seven epistatic interactions involved the known G546S resistance variant in penA. The 11 genes were dominated by cell membrane, cell wall and cell wall biosynthesis proteins (PenA, YebE, MdoB, OafA), but also included cell division (FtsL, GidA) and DNA repair (DinG) proteins. Mutations in ftsL are known to confer ampicillin resistance, affecting penicillin-binding proteins and leading to reduced β-lactam affinity41 causing potential resistance to first- and second-generation cephalosporins in Haemophilus influenzae42. Similar effects may also govern
N. gonorrhoeae resistance.
Three different penA loci (p.N173S, p.V160A and p.G546S) interacted with the p.L52V locus in ftsL and occurred in the same 13 clades distributed across the phylogeny (Fig. 5c). Each of these penA loci anti-correlate with the minor allele of ftsL. The close correlation among these epistatic pairs indicate an underlying haplotype block in penA that is epistatic with ftsL.
Taken together, significantly associated epistatic interactions often involve known antibiotic resistance loci. Of the interactions that did not involve known antibiotic resistance loci, some were found in genes associated with cell division and oxidative stress. However, the majority of epistatic loci were found in genes encoding inner and outer membrane proteins, or cell wall biosynthesis proteins that potentially affect N. gonorrhoeae’s permeability to antibiotics43,44.
Heritability increases with epistatic pairs.
To estimate how well the identified single loci and epistatic pairs explain observed MIC variation, we inferred SNP-based heritability (h2) using a linear mixed model45 (see Methods) considering either all common SNPs significant loci only or significant loci combined with all epistatic loci and their effects (Table 4, Supplementary Fig. 4). As expected, the heritability of the MIC for an antibiotic was high, ranging from 0.83 to 0.93. The identified loci could explain the majority of the observed variance, excepting the loci associated with PEN and TET MICs. This might be understood by the fact that these strains were not explicitly selected for TET and PEN resistance, and neither antibiotic is currently used as a treatment for gonococcal infection3. Thus, PEN or TET may not represent active selection pressures; resistance is mostly probably ancestral. The identified epistatic pairs further increased the explained heritability compared to (CFX: 5.3% increase; CIPRO: 24.9% increase; AZI: 43.3% increase); in the cases of CFX (3% increase) and CIPRO (2.4% increase), it explained even more than
Table 4 |.
SNP-based heritability of MIC for different antibiotics
| PEN | 0.830 | 0.203 | – |
| TET | 0.891 | 0.073 | – |
| CFX | 0.825 | 0.807 | 0.850 |
| CIPRO | 0.931 | 0.763 | 0.953 |
| AZI | 0.900 | 0.4970 | 0.712 |
Heritability was estimated on the whole dataset (n = 1,597) using a linear mixed model: estimated considering all common SNPs; was estimated considering significant loci only; and was estimated considering significant loci and significant epistatic pairs.
Discussion
We report the results of the first systematic GWAS of single loci and epistatic interactions affecting antimicrobial sensitivity and resistance in N. gonorrhoeae. As expected, we recovered many known resistance-causing loci; many of the epistatic interactions that we discovered involve known resistance-causing loci.
In our study, reported loci can cause either heightened sensitivity or greater resistance to antimicrobials. Examples for heightened sensitivity include loci in dldH and comF that are associated with CIPRO (Table 1). We also found several unreported loci and interactions that associate strongly with greater antibiotic resistance, including several loci in murE linked to CFX resistance and two interactions between gyrA and parC linked to CIPRO resistance. Each antibiotic showed distinct epistatic association patterns. While epistatic associations with CIPRO occurred in many genes, all epistatic associations with AZI involved a single resistance locus in 23S rRNA and all epistatic associations with CFX involved loci in a few genes, mostly concentrated in the peptidoglycan synthesis gene penA. These observations suggest that the mechanism of CIPRO-induced death involves many genes across diverse cellular pathways, including oxidative stress, while the mechanism of CFX and AZI killing is focused on disabling peptidoglycan synthesis and 23S rRNA, respectively.
Population structure can cause spurious associations in GWAS; for this reason, we took several measures to correct for population structure and verify that our findings were not confounded by relatedness among the sampled strains. First, we explicitly corrected for spurious phylogenetic correlations through the application of a linear mixed model that includes a population structure term as a random effect. Second, we applied a phylogenetic correction to the inferred strength of evolutionary couplings before identifying high-confidence interactions. Finally, we filtered out all loci and epistatic interactions that occurred in only one clade (as inferred by RhierBAPS) of the phylogeny and verified that significant loci were subject to greater homoplasy. Thus, all significant associations occurred multiple times across the phylogenetic tree and did not act as markers for particular resistant or sensitive lineages.
By calculating SNP heritability, we found that taking epistatic pairs into account significantly improved the amount of MIC variation that could be explained by the additive effects of significant loci, and even all common loci combined. This finding reinforces the causal nature of the identified epistatic pairs. However, we caution that a more rigorous statistical approach would be to estimate heritability for these loci and epistatic pairs on a distinct genomic dataset.
In principle, GWAS can identify causal variation. However, our study focuses only on point mutations found by comparison to the N. gonorrhoeae FA1090 reference genome. Thus, the effects of horizontally transmitted genes and more complex variants, such as gene duplications, indels and mobile element transpositions, will be missed. Some of these missing variants may be hidden yet causal variables that affect antibiotic resistance. If so, the effects of these missing variants will either be absent or associated to non-causative markers in our data that closely track the presence of the true, but missing, causal variants. We found some evidence of missing causal variables in our analysis because many epistatic associations are linked to genes that are highly variable in the genome alignment, such as transferrin-binding proteins46. Thus, it is possible that some associations involving highly variable genes are actually markers that represent the closest possible association to hidden causal variants. Nevertheless, our work demonstrates that evolutionary couplings combined with standard GWAS methods is a promising new approach for discovering epistatic interactions affecting antibiotic resistance in multiresistant pathogens, such as N. gonorrhoeae. The loci and interactions reported in this study may support efforts in predicting antibiotic resistance from whole-genome sequence data47. We anticipate that our findings and evolutionary couplings approach will be valuable in unravelling the genetics of complex traits.
Methods
Alignment construction and annotation.
We used breseq48 to call variants in each isolate with reference to the N. gonorrhoeae FA1090 genome. To identify variants in rRNAs, we masked all except the first copy of the rRNA operon in the reference genome. We ran breseq in consensus mode using the masked reference genome. We filtered variants in the consensus mode runs for SNPs, then mapped the SNPs onto the reference sequence using gdtools (part of breseq) to generate a genome alignment. We ran breseq in polymorphism mode to infer the copy number of rRNA variants in each isolate. The FA1090 reference genome was used to annotate the location of coding regions and other genomic features. Promoters and 5′ untranslated regions associated with experimentally determined RNA transcripts20 were annotated as follows. Regions bounded by the transcriptional start site and the location of the first gene on the transcript were annotated as 5′ untranslated regions as long as the annotated region was no more than 150 nucleotides (nt) long. This decision rule was based on experimental results on the distribution of 5′ untranslated region lengths in Bacillus subtilis, Escherichia coli and Pseudomonas aeruginosa49. Sequences up to 70 nt upstream of the transcript (or, the end of the upstream gene on the same strand if within 70 nt) were annotated as promoters, following Remmele et al.20. The genome alignment was filtered for variants that occurred in at least 5 strains (0.5% minor allele frequency). Synonymous variants within coding regions were excluded from the alignment.
Genome-wide evolutionary couplings inference.
To identify strongly coupled positions within a genome of length L, we fitted a q = 2 state undirected graphical model of the form:
using a multiple sequence alignment σ of N bacterial genomes. Minor alleles were encoded as 1 and major alleles were encoded as 0. To prevent overfitting, we used L2-regularized pseudolikelihood estimation, similar to previous work11–13,21,50. The site-specific regularization weight was set to λh = 0.01 and the pairwise regularization weight was set to We used maximum pseudolikelihood inference to fit the parameters of the model and summarized the evolutionary couplings strength of each pair of loci with the FN21 of each Jij matrix:
Identification of highly evolutionarily coupled loci.
To correct for under-sampling and phylogenetic bias in the alignment, we adjusted the summarized FN scores with an average product correction (APC):51
Where and represent the column and row mean of the FN matrix, respectively, while is the matrix mean.
Following Toth-Petroczy et al.50, we fitted a two-component mixture model to the corrected FN score distribution (Supplementary Fig. 2) to separate evolutionary couplings representing noise from strongly evolutionarily coupled genomic loci:
where π represents the mixing parameter, SN is a skew normal distribution with location at 0 and unknown scale ω and shape ζ parameters and LN represents a log-normal distribution with unknown mean μ and variance σ. The parameters were inferred by expectation maximization. All evolutionary couplings whose posterior probability of membership in the log-normal component was >0.95 were deemed significant and used for later analysis.
Detection of antibiotic-resistant loci and co-evolutionarily coupled pairs.
To test single-locus and epistatic associations to a specific phenotype, we employed a linear mixed model29,30 of the following form:
or denotes the design matrix with the loci or epistatic interactions of interest, y denotes the log-transformed MIC for a specific antibiotic measured for each strain, /denotes the identity matrix, and and denote the genetic and noise variance components. The bacterial sequences are first binary encoded in X with Xi = 0 as major and Xi = 1 as minor allele and then standardized for the purpose of association testing. represents the kernel matrix that is used to correct for population structure.
Parameters of the single-locus model were inferred with restricted maximum likelihood; the association strength was assessed with a Wald test. The regression coefficients of the epistatic model were inferred with maximum likelihood, assuming fixed variance components, while the variance components were inferred based on a null model following Kang et al.29. The epistatic association strength was tested using a likelihood ratio test with 1 d.f. comparing the full interaction model to a model disregarding the interaction effect. Bonferroni correction was used for multiple testing correction at α = 0.05.
Estimation of SNP-based heritability.
To estimate the SNP-based heritability h2 of the observed MICs, we fitted a variance component model of the following form:
with μ being the estimated mean and S a design matrix encoding the loci and epistatic interactions of interest. The same data encoding and normalization procedures conducted in the GWAS analysis were applied.
Heritability was defined as
and is a lower bound of the broad sense heritability52. We estimated h2 for all common SNPs, all significant loci and all significant loci combined with all significantly epistatic loci. Singly significant loci are encoded in S as additive terms and epistatic loci are encoded in S as interaction terms and single additive terms. Parameters were estimated with restricted maximum likelihood; the posterior of h2 was approximated using the sampled log-likelihood during parameter estimation (Supplementary Fig. 4).
Population structure analysis.
We used Gubbins53 to predict regions of recombination and ran FastTree54 with default parameters to make an approximately maximum likelihood phylogeny of all 1,597 strains, excluding regions of recombination. Bayesian analysis of population structure was performed with RhierBAPS31. To further reduce false associations caused by residual phylogenetic correlations, we removed all significant single loci which were clade-specific. For epistatic pairs, we considered a pair to be present in the clade if either of the two loci were observed as minor alleles and removed all epistatic pairs that were only present in one clade. Additionally, we calculated the average Hamming distance between two clades Ck and Cg,
as a measure of clade relatedness and annotated the maximum clade distance for each significant association to further substantiate their phylogenetic independence. Finally, we counted the number of homoplasies (parallel changes due to mutation or recombination events, possibly under selection) at each SNP locus along the phylogeny. As a fast approximation to a joint maximum likelihood ancestral sequence reconstruction55 of the full genome alignment, we binary encoded all SNPs in the genome and used RAxML56 under the BINCAT model to reconstruct ancestral states by marginal maximum likelihood. Many loci were subject to dozens, even hundreds, of homoplasies, consistent with high recombination rates in N. gonorrhoeae populations.
Implementation.
The undirected graphical model was inferred using plmc (https://github.com/debbiemarkslab/plmc). The linear mixed model was implemented in Python version 3.5 and is based on pylmm30. Population structure analysis was performed with RhierBAPS31, an R implementation of hierBAPS32 (https://github.com/gtonkinhill/rhierbaps). The remaining data analysis was performed in Python and Jupyter Notebook. Chord diagrams and phylogenetic tree visualization were made with circlize57 and iTOL version 358.
Supplementary Material
Acknowledgements
We thank members of the Marks laboratory and C. Sander for his support during this research project.
Footnotes
Competing interests
The authors declare no competing interests.
Supplementary information is available for this paper at https://doi.org/10.1038/s41564-018-0309-1.
Publisher’s note: Springer Nature remains neutral with regard to jurisdictional claims in published maps and institutional affiliations.
Data availability
Measured MICs and NCBI SRA identifiers for the raw sequencing data can be found in Supplementary Table 1.
References
- 1.Palmer AC & Kishony R Understanding, predicting and manipulating the genotypic evolution of antibiotic resistance. Nat. Rev. Genet. 14, 9.43–9.48 (9013) [DOI] [PMC free article] [PubMed] [Google Scholar]
- 2.de Sousa JM, Balbontín R, Durão P & Gordo I Multidrug-resistant bacteria compensate for the epistasis between resistances. PLoS Biol. 15, e2001741 (2017). [DOI] [PMC free article] [PubMed] [Google Scholar]
- 3.Unemo M & Shafer WM Antimicrobial resistance in Neisseria gonorrhoeae in the 21st century: past, evolution, and future. Clin. Microbiol. Rev. 27, 587–613 (2014). [DOI] [PMC free article] [PubMed] [Google Scholar]
- 4.Cui Y et al. Epidemic clones, oceanic gene pools, and eco-LD in the free living marine pathogen Vibrio parahaemolyticus. Mol. Biol. Evol. 32, 1396–1410 (2015). [DOI] [PubMed] [Google Scholar]
- 5.Coll F et al. Genome-wide analysis of multi- and extensively drug-resistant Mycobacterium tuberculosis. Nat. Genet. 50, 307–316 (2018). [DOI] [PubMed] [Google Scholar]
- 6.Emily M, Mailund T, Hein J, Schauser L & Schierup MH Using biological networks to search for interacting loci in genome-wide association studies. Eur. J. Hum. Genet. 17, 1231–1240 (2009). [DOI] [PMC free article] [PubMed] [Google Scholar]
- 7.Marks DS et al. Protein 3D structure computed from evolutionary sequence variation. PLoS ONE 6, e28766 (2011). [DOI] [PMC free article] [PubMed] [Google Scholar]
- 8.Lapedes AS, Giraud B, Liu L & Stormo GD Correlated mutations in models of protein sequences: phylogenetic and structural effects. Lect. Notes Monogr. Ser. 33, 236–256 (1999). [Google Scholar]
- 9.Qin C & Colwell LJ Power law tails in phylogenetic systems. Proc. Natl Acad. Sci. USA 115, 690–695 (2018). [DOI] [PMC free article] [PubMed] [Google Scholar]
- 10.Cocco S, Monasson R & Weigt M From principal component to direct coupling analysis of coevolution in proteins: low-eigenvalue modes are needed for structure prediction. PLoS Comput. Biol. 9, e1003176 (2013). [DOI] [PMC free article] [PubMed] [Google Scholar]
- 11.Weinreb C et al. 3D RNA and functional interactions from evolutionary couplings. Cell 165, 963–975 (2016). [DOI] [PMC free article] [PubMed] [Google Scholar]
- 12.Hopf TA et al. Sequence co-evolution gives 3D contacts and structures of protein complexes. eLife 3, e03430 (2014). [DOI] [PMC free article] [PubMed] [Google Scholar]
- 13.Hopft TA et al. Mutation effects predicted from sequence co-variation. Nat. Biotechnol. 35, 128–135 (2017). [DOI] [PMC free article] [PubMed] [Google Scholar]
- 14.Skwark MJ et al. Interacting networks of resistance, virulence and core machinery genes identified by genome-wide epistasis analysis. PLoS Genet. 13, e1006508 (2017). [DOI] [PMC free article] [PubMed] [Google Scholar]
- 15.Puranen S SuperDCA for genome-wide epistasis analysis. Microb. Genom. 4, e000184 (2018). [DOI] [PMC free article] [PubMed] [Google Scholar]
- 16.Grad YH et al. Genomic epidemiology of gonococcal resistance to extended-spectrum cephalosporins, macrolides, and fluoroquinolones in the United States, 2000–2013. J. Infect. Dis. 214, 1579–1587 (2016). [DOI] [PMC free article] [PubMed] [Google Scholar]
- 17.Demczuk W et al. Whole-genome phylogenomic heterogeneity of Neisseria gonorrhoeae isolates with decreased cephalosporin susceptibility collected in Canada between 1989 and 2013. J. Clin. Microbiol. 53, 191–200 (2015). [DOI] [PMC free article] [PubMed] [Google Scholar]
- 18.De Silva D et al. Whole-genome sequencing to determine transmission of Neisseria gonorrhoeae: an observational study. Lancet Infect. Dis. 16, 1295–1303 (2016). [DOI] [PMC free article] [PubMed] [Google Scholar]
- 19.Breakpoint Tables for Interpretation of MICs and Zone Diameters, Version 7.1 (European Committee on Antimicrobial Susceptibility Testing, 2017); http://www.eucast.org/fileadmin/src/media/PDFs/EUCAST_files/Breakpoint_tables/v_7.1_Breakpoint_Tables.pdf
- 20.Remmele CW et al. Transcriptional landscape and essential genes of Neisseria gonorrhoeae. Nucleic Acids Res. 42, 10579–10595 (2014). [DOI] [PMC free article] [PubMed] [Google Scholar]
- 21.Ekeberg M, Lövkvist C, Lan Y, Weigt M & Aurell E Improved contact prediction in proteins: using pseudolikelihoods to infer Potts models. Phys. Rev. E 87, 012707 (2013). [DOI] [PubMed] [Google Scholar]
- 22.Harrison OB et al. Genomic analyses of Neisseria gonorrhoeae reveal an association of the gonococcal genetic island with antimicrobial resistance. J. Infect. 73, 578–587 (2016). [DOI] [PMC free article] [PubMed] [Google Scholar]
- 23.Griffiss JM, Lammel CJ, Wang J, Dekker NP & Brooks G Neisseria gonorrhoeae coordinately uses Pili and Opa to activate HEC-1-B cell microvilli, which causes engulfment of the gonococci. Infect. Immun. 67, 3469–3480 (1999). [DOI] [PMC free article] [PubMed] [Google Scholar]
- 24.Ronpirin C, Jerse AE & Cornelissen CN Gonococcal genes encoding transferrin-binding proteins A and B are arranged in a bicistronic operon but are subject to differential expression. Infect. Immun. 69, 6336–6347 (2001). [DOI] [PMC free article] [PubMed] [Google Scholar]
- 25.Krell T et al. Insight into the structure and function of the transferrin receptor from Neisseria meningitidis using microcalorimetric techniques. J. Biol. Chem. 278, 14712–14722 (2003). [DOI] [PubMed] [Google Scholar]
- 26.Tønjum T & Koomey M The pilus colonization factor of pathogenic neisserial species: organelle biogenesis and structure/function relationships—a review. Gene 192, 155–163 (1997). [DOI] [PubMed] [Google Scholar]
- 27.Heckels JE Structure and function of pili of pathogenic Neisseria species. Clin. Microbiol. Rev. 2, S66–S73 (1989). [DOI] [PMC free article] [PubMed] [Google Scholar]
- 28.Szklarczyk D The STRING database in 2017: quality-controlled protein–protein association networks, made broadly accessible. Nucleic Acids Res. 45, D362–D368 (2017). [DOI] [PMC free article] [PubMed] [Google Scholar]
- 29.Kang HM et al. Variance component model to account for sample structure in genome-wide association studies. Nat. Genet. 42, 348–354 (2010). [DOI] [PMC free article] [PubMed] [Google Scholar]
- 30.Sul JH et al. Accounting for population structure in gene-by-environment interactions in genome-wide association studies using mixed models. PLoS Genet. 12, e1005849 (2016). [DOI] [PMC free article] [PubMed] [Google Scholar]
- 31.Tonkin-Hill G, Lees JA, Bentley SD, Frost SDW & Corander J RhierBAPS: an R implementation of the population clustering algorithm hierBAPS. Wellcome Open Res. 3, 93 (2018). [DOI] [PMC free article] [PubMed] [Google Scholar]
- 32.Cheng L, Connor TR, Sirén J, Aanensen DM & Corander J Hierarchical and spatially explicit clustering of DNA sequences with BAPS software. Mol. Biol. Evol. 30, 1224–1228 (2013). [DOI] [PMC free article] [PubMed] [Google Scholar]
- 33.Seib KL et al. Defenses against oxidative stress in Neisseria gonorrhoeae: a system tailored for a challenging environment. Microbiol. Mol. Biol. Rev. 70, 344–361 (2006). [DOI] [PMC free article] [PubMed] [Google Scholar]
- 34.Kohanski MA, Dwyer DJ & Collins JJ How antibiotics kill bacteria: from targets to networks. Nat. Rev. Microbiol. 8, 423–435 (2010). [DOI] [PMC free article] [PubMed] [Google Scholar]
- 35.Unemo M & Nicholas RA Emergence of multidrug-resistant, extensively drug-resistant and untreatable gonorrhea. Future Microbiol. 7, 1401–1422 (2012). [DOI] [PMC free article] [PubMed] [Google Scholar]
- 36.Todorova K et al. Transfer of penicillin resistance from Streptococcus oralis to Streptococcus pneumoniae identifies murE as resistance determinant. Mol. Microbiol. 97, 866–880 (2015). [DOI] [PubMed] [Google Scholar]
- 37.Redgrave LS, Sutton SB, Webber MA & Piddock LJ Fluoroquinolone resistance: mechanisms, impact on bacteria, and role in evolutionary success. Trends Microbiol. 22, 438–445 (2014). [DOI] [PubMed] [Google Scholar]
- 38.Rozen DE, McGee L, Levin BR & Klugman KP Fitness costs of fluoroquinolone resistance in Streptococcus pneumoniae. Antimicrob. Agents Chemother. 51, 412–416 (2007). [DOI] [PMC free article] [PubMed] [Google Scholar]
- 39.Duckworth BP et al. Bisubstrate adenylation inhibitors of biotin protein ligase from Mycobacterium tuberculosis. Chem. Biol. 18, 1432–1441 (2011). [DOI] [PMC free article] [PubMed] [Google Scholar]
- 40.Correia S et al. Comparative subproteomic analysis of clinically acquired fluoroquinolone resistance and ciprofloxacin stress in Salmonella Typhimurium DT104B. Proteomics Clin. Appl. 11, 1600107 (2017). [DOI] [PubMed] [Google Scholar]
- 41.Ubukata K et al. Association of amino acid substitutions in penicillin-binding protein 3 with β-lactam resistance in β-lactamase-negative ampicillin-resistant Haemophilus influenzae. Antimicrob. Agents Chemother. 45, 1693–1699 (2001). [DOI] [PMC free article] [PubMed] [Google Scholar]
- 42.Morikawa Y et al. In vitro activities of piperacillin against β-lactamase-negative ampicillin-resistant Haemophilus influenzae. Antimicrob. Agents Chemother. 48, 1229–1234 (2004). [DOI] [PMC free article] [PubMed] [Google Scholar]
- 43.Vaara M Outer membrane permeability barrier to azithromycin, clarithromycin, and roxithromycin in gram-negative enteric bacteria. Antimicrob. Agents Chemother. 37, 354–356 (1993). [DOI] [PMC free article] [PubMed] [Google Scholar]
- 44.Delcour AH Outer membrane permeability and antibiotic resistance. Biochim. Biophys. Acta 1794, 808–816 (2009). [DOI] [PMC free article] [PubMed] [Google Scholar]
- 45.Lee SH, Wray NR, Goddard ME & Visscher PM Estimating missing heritability for disease from genome-wide association studies. Am. J. Hum. Genet. 88, 294–305 (2011). [DOI] [PMC free article] [PubMed] [Google Scholar]
- 46.Barber MF & Elde NC Escape from bacterial iron piracy through rapid evolution of transferrin. Science 346, 1362–1366 (2014). [DOI] [PMC free article] [PubMed] [Google Scholar]
- 47.Bradley P et al. Rapid antibiotic-resistance predictions from genome sequence data for Staphylococcus aureus and Mycobacterium tuberculosis. Nat. Commun. 6, 10063 (2015). [DOI] [PMC free article] [PubMed] [Google Scholar]
- 48.Deatherage DE & Barrick JE Identification of mutations in laboratory-evolved microbes from next-generation sequencing data using breseq. Methods Mol. Biol. 1151, 165–188 (2014). [DOI] [PMC free article] [PubMed] [Google Scholar]
- 49.Johns NI et al. Metagenomic mining of regulatory elements enables programmable species-selective gene expression. Nat. Methods 15, 323–329 (2018). [DOI] [PMC free article] [PubMed] [Google Scholar]
- 50.Toth-Petroczy A et al. Structured states of disordered proteins from genomic sequences. Cell 167, 158–170 (2016). [DOI] [PMC free article] [PubMed] [Google Scholar]
- 51.Dunn SD, Wahl LM & Gloor GB Mutual information without the influence of phylogeny or entropy dramatically improves residue contact prediction. Bioinformatics 24, 333–340 (2008). [DOI] [PubMed] [Google Scholar]
- 52.Visscher PM, Hill WG & Wray NR Heritability in the genomics era—concepts and misconceptions. Nat. Rev. Genet. 9, 255–266 (2008). [DOI] [PubMed] [Google Scholar]
- 53.Croucher NJ et al. Rapid phylogenetic analysis of large samples of recombinant bacterial whole genome sequences using Gubbins. Nucleic Acids Res. 43, e15 (2015). [DOI] [PMC free article] [PubMed] [Google Scholar]
- 54.Price MN, Dehal PS & Arkin AP FastTree 2—approximately maximum-likelihood trees for large alignments. PLoS ONE 5, e9490 (2010). [DOI] [PMC free article] [PubMed] [Google Scholar]
- 55.Yang Z Computational Molecular Evolution (Oxford Univ. Press, Oxford, 2006). [Google Scholar]
- 56.Stamatakis A RAxML version 8: a tool for phylogenetic analysis and post-analysis of large phylogenies. Bioinformatics 30, 1312–1313 (2014). [DOI] [PMC free article] [PubMed] [Google Scholar]
- 57.Gu Z, Gu L, Eils R, Schlesner M & Brors B circlize implements and enhances circular visualization in R. Bioinformatics 30, 2811–2812 (2014). [DOI] [PubMed] [Google Scholar]
- 58.Letunic I & Bork P Interactive tree of life (iTOL)v3: an online tool for the display and annotation of phylogenetic and other trees. Nucleic Acids Res. 44, W242–W245 (2016). [DOI] [PMC free article] [PubMed] [Google Scholar]
- 59.Faure M et al. Interaction between the lipoamide-containing H-protein and the lipoamide dehydrogenase (L-protein) of the glycine decarboxylase multienzyme system 2. Crystal structures of H- and L-proteins. Eur. J. Biochem. 267, 2890–2898 (2000). [DOI] [PubMed] [Google Scholar]
- 60.Gordon E et al. Crystal structure of UDP-N-acetylmuramoyl-L-alanyl-D-glutamate: meso-diaminopimelate ligase from Escherichia coli. J. Biol. Chem. 276, 10999–11006 (2001). [DOI] [PubMed] [Google Scholar]
Associated Data
This section collects any data citations, data availability statements, or supplementary materials included in this article.