

Abstract
Tubulin, the subunit of microtubules, is a noncovalent heterodimer composed of one α- and one β-tubulin monomer. Both tubulins are encoded by multiple genes or composed of different isotypes, which are differentially expressed in different tissues and in development. Tubulin αβ dimers are found throughout the eukaryotes and, although very similar, are known to differ among organisms. We seek to investigate tubulins from different tissues and different organisms for a basic physical characteristic: heterodimer stability and monomer exchange between heterodimers. We previously showed that mammalian brain tubulin heterodimers reversibly dissociate, following the mass action law. Dissociation yields native monomers that can exchange with added tubulin to form new heterodimers. Here, we compared the dissociation of tubulins from multiple sources, including mammalian (rat) brain, cultured human cells (HeLa cells), chicken brain, chicken erythrocytes, and the protozoan Leishmania. We used fluorescence-detected analytical ultracentrifugation to measure tubulin dissociation over a >1000-fold range in concentration and found that tubulin heterodimers from different biological sources differ in Kd by as much as 150-fold under the same conditions. Furthermore, when fluorescent tracer tubulins from various sources were titrated with unlabeled tubulin from a single source (rat brain tubulin), heterologous dimerization occurred, exhibiting similar affinities, in some cases binding even more strongly than with autologous tubulin. These results provide additional insight into the regulation of heterodimer formation of tubulin from different biological sources, revealing that monomer exchange appears to contribute to the sorting of α- and β-tubulin monomers that associate following tubulin folding.
Keywords: tubulin, dimerization, analytical ultracentrifugation, fluorescence, protein conformation, cytoskeleton, dissociation constant, heterologous dimerization, monomer, non-interacting surface (NIS)
Introduction
Tubulins are a family of proteins that serve as building blocks of microtubules in all eukaryotes and therefore are intimately involved in key cellular functions such as intracellular transport, motility, and chromosome segregation. The major component of the microtubule wall is the αβ-tubulin heterodimer, which undergoes GTP-dependent polymerization to form the linear filaments that comprise the microtubule wall. This GTP-dependent polymerization is shared by other related proteins such as FtsZ3 in bacteria and archaea, which together form the tubulin/FtsZ family. Of this large family, only the α- and β-tubulins associate noncovalently to form high-affinity dimers in vivo and in vitro (1). Thus, formation and regulation of the dimeric state must contribute significantly to the biology of the microtubule. It is the durability and dynamics of the dimer state that we address in this research.
The production of assembly-competent αβ-tubulin dimers is accomplished by a complex folding machinery involving molecular chaperones and additional downstream cofactors. The correct folding of tubulin monomers requires prefoldin and cytosolic chaperonin containing TCP1 (CCT) of which both tubulins are substrates (2–4). After release from CCT, folded monomers are assembled into the αβ-tubulin dimer, assisted by five distinct tubulin-binding cofactors and the modulator Arl2 (5–7).
Misfolded tubulin molecules are degraded in the cytoplasm, but correctly folded and assembly-competent dimeric tubulin is very stable, with a cytoplasmic lifetime of up to 50 h (8). Not all tubulin dimers in the cytoplasm are assembled in microtubules, and free tubulin dimers can achieve concentrations up to 20 μm (9). It is not clear whether or not the monomers that initially associate to form a new dimer remain together during this extended period or whether they can exchange partners and form new dimers, for example with other isotypes.
Monomer sorting has been observed to occur in vivo (10), therefore indicating that distinct tubulin isotypes of α- and β-tubulin may preferentially associate to form αβ-tubulin dimers. Moreover, both isolated α- and isolated β-tubulins can be produced at low concentrations as soluble, native monomers by in vitro translation, with both the ability to exchange into and to coassemble with added αβ-tubulin dimers to form microtubules (11, 12).
We are here interested in the dynamics of the tubulin dimer once formed. Previously, it has been shown that purified αβ-tubulin, i.e. protein obtained postfolding and postdimerization, reversibly dissociates to native monomers, and these free monomers can exchange into added tubulin, reversibly forming new αβ dimers (13). This study and nearly all previous studies of tubulin dimer dissociation have used tubulin isolated from mammalian brain (13–19). Tubulin from brain is heterogeneous in its composition of α and β isotypes (20, 21) and is subject to many types of post-translational modifications that can modulate the protein's in vitro behavior (22). Other tubulins, isolated from different tissues or organisms, differ in isotype composition of α and β chains and in the content of PTMs (23), and all of these could alter dimer dissociation.
In this study, we show that tubulins from five independent biological origins (cells, tissues, and organisms) all share the following properties. All tubulin dimers reversibly dissociate; the free monomers all share the same hydrodynamic properties, indicating that they retain their native fold for at least a few hours; and all can undergo monomer exchange with dimers from heterologous origins.
Results
Tubulin dimer dissociation detected by sedimentation velocity analytical centrifugation
We wished to determine whether the properties of reversible dimer dissociation, monomer stability, and monomer exchange, which we previously demonstrated for rat brain tubulin (13), are shared with other tubulins. To this end, we used sedimentation velocity analytical ultracentrifugation to examine a broad range (>1000-fold) of concentrations of tubulins from a number of sources that have been studied little or not at all by such methods: rat and chicken brains, chicken red blood cells (RBCs), human HeLa cells, and the protozoan Leishmania tarentolae.
The tubulins analyzed here display a variety of isotype combinations ranging from a single isotype of both α- and β-tubulin, such as chicken RBCs and Leishmania, to combinations of many isotypes of α- and β-tubulins, such as tubulin from brains of rat and chicken. These tubulins also contain PTMs ranging from little or none, such as tubulin from chicken RBCs, to many combinations of PTMs, such as with tubulin from brain and Leishmania.
For each tubulin type, a series of samples of decreasing concentration was prepared and subjected to sedimentation velocity analytical ultracentrifugation. The data sets for each loading concentration were fitted with the c(s) sedimentation coefficient distribution model (24), which results in a single curve in Fig. 1 and single point (with error bars) in Fig. 2. This model contains information about the number of molecular species present in the form of peaks centered at the characteristic sedimentation coefficient of each species and peak amplitudes proportional to the concentration of each species. Using this methodology, we previously characterized the full dilution series of fluorescently labeled rat brain tubulin, from all dimers to all monomers. The monomer and dimer species showed a weight-average sedimentation coefficient in the range sw-monomer = 2.8–3.2 S and sw-dimer = 4.9–5.2 S, respectively (13).
Figure 1.
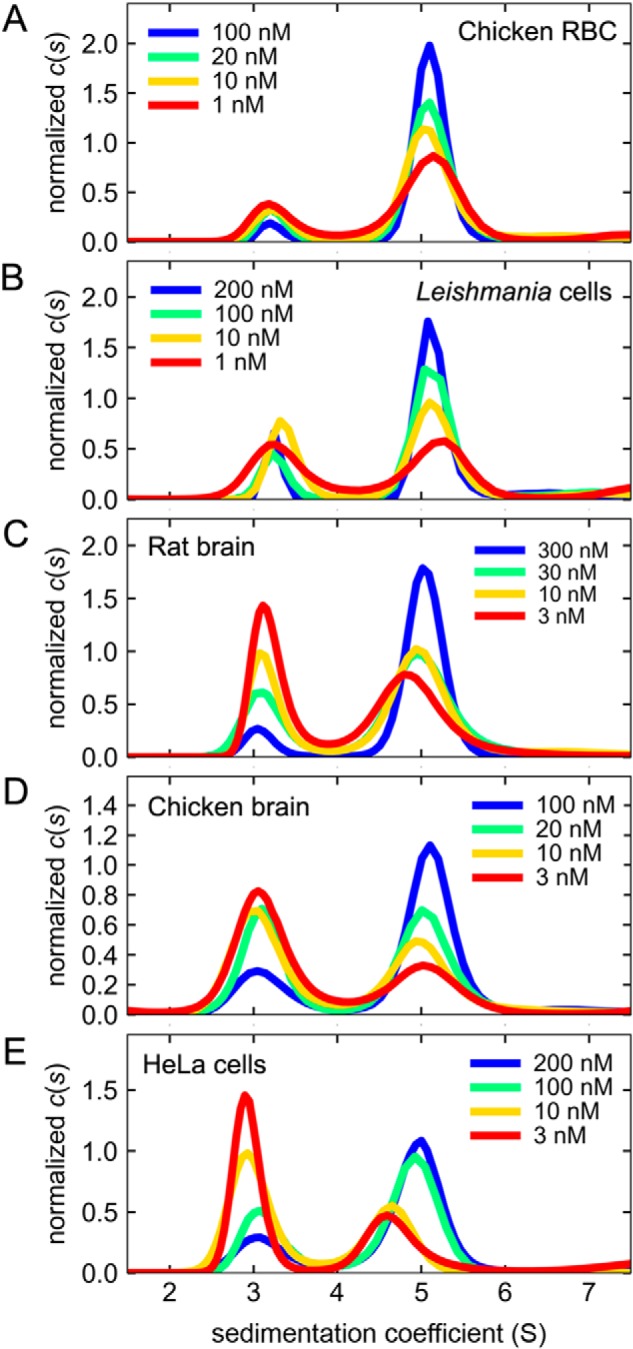
Reversible dissociation of tubulin dimers detected by sedimentation velocity analytical ultracentrifugation. Stocks of tubulin dimers labeled with DyLight-488 were serially diluted in PM buffer supplemented with 0.1 mg/ml BSA and incubated for ∼2 h before starting the sedimentation velocity run. Analysis of experimental data using the c(s) distribution model provided the fractions of monomer and dimer species. The resulting distributions are shown in A–E from which the sw values were obtained by integration at each tubulin concentration. The peaks centered at ∼3 and ∼5 S are the monomer and dimer species, respectively. Chicken RBC, tubulin from chicken red blood cells; Leishmania, tubulin from L. tarentolae cell cultures; rat brain, tubulin extracted from rat brains; chicken brain, tubulin extracted from chicken brains; HeLa cells, tubulin from human HeLa cell cultures.
Figure 2.
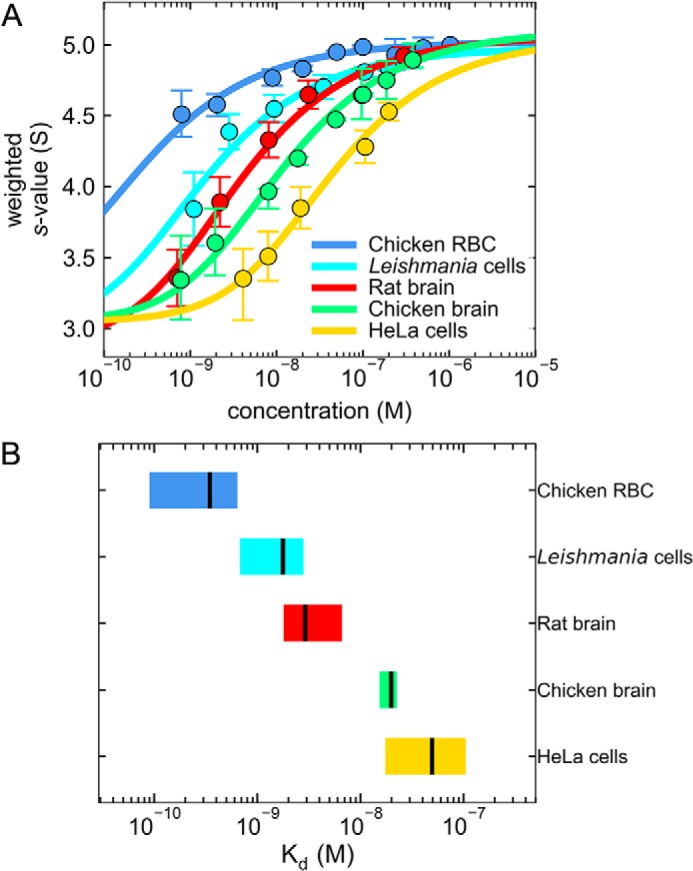
The dissociation constants of tubulins dimers extracted from distinct sources vary by 2 orders of magnitude. A shows the collection of weight-average sedimentation coefficients, sw, calculated by integration of the best-fit c(s) distributions at each concentration analyzed (circles). The error bars are the uncertainties of the integrated sw values. The dissociation constants (Kd) were determined by nonlinear regression analysis of the sw isotherms (solid lines) using the monomer–dimer self-association model. B shows a graphical comparison of the statistics of Kd determined with sw isotherms. The boxes are 68% confidence intervals, and the vertical black lines are the best-fit Kd. The plots demonstrate the 2 orders of magnitude variation of the measured Kd. The actual values obtained with the fitting routine are presented in Table 1.
For all tubulins studied here, inspection of the best-fit c(s) distributions in the range 1–8 S showed only two peaks, as in our previous study (13), corresponding to the monomer and dimer species, centered at ∼3 and ∼ 5 S, respectively (Fig. 1). Here, we used an improved method to prepare and analyze our samples by including the surface-passivating agent BSA, which helped to maintain the labeled tubulins in solution throughout the experiments (see Fig. S1 for more details).
At higher concentrations (>100 nm), the ∼5 S dimer peak is predominant (Fig. 1, blue curves), whereas at lower concentrations (<10 nm), the ∼3 S monomer peak is more pronounced (red curves). No additional peaks were observed in the c(s) distributions, indicating that no additional complexes are formed. Clearly, the hydrodynamics of the monomer (∼3 S) and dimer (∼5 S) species are similar among all the tubulins analyzed here. Equally clearly, all tubulins undergo concentration-dependent dissociation. In the best-fit c(s) distributions shown in Fig. 1, A–E, the positions of the peaks representing the monomer and dimer species remain mostly fixed in their position over >100-fold decrease in protein concentration, with accompanying changes in amplitudes, as expected for a monomer–dimer system with slow dissociation kinetics (25).
Tubulin from rat and chicken brain (Fig. 1, C and D) and tubulin from human HeLa cells (Fig. 1E) were substantially monomeric at 3 nm concentration. For these three tubulins, we could detect the full transition from majority dimer species (blue curves) to majority monomer species (red curves), indicating that the value of the Kd was found in the range of concentrations assayed (Fig. 1, C–E). In contrast, tubulin from chicken red blood cells and from the protozoan L. tarentolae (Fig. 1, A and B) showed a lower degree of dissociation at comparable protein concentrations. Although L. tarentolae tubulin dissociated to 50–60% at 1 nm concentration (Fig. 1B, red curve), the degree of dissociation of chicken red blood cell tubulin at 1 nm concentration was 20–30%, the lowest observed in these experiments.
The data in Fig. 1 were combined for each tubulin to produce an isotherm of signal-weighted average sedimentation coefficients sw as shown in Fig. 2. Kd values were determined by nonlinear regression using the monomer–dimer self-association model (Fig. 2A, solid lines). Note that the model used to fit a Kd to the hydrodynamic data does not distinguish α- from β-tubulin. This is the same model that we used previously and assumes the equilibrium M + M ↔ D where M represents the concentration of monomer species and D is concentration of dimer species. The best-fit values of the Kd with 68% confidence intervals are presented using a graphical comparison in Fig. 2B and in tabular form in Table 1 (we refer to this as autologous dimerization, meaning dimerization in which all tubulin molecules, labeled and not, are from the same biological source). By consideration of the best-fit values, the Kd values vary over a range of 2 orders of magnitude in the following order: chicken RBCs < Leishmania < rat brain < chicken brain < human HeLa cells.
Table 1.
Dissociation constants of tubulin dimers extracted from five distinct biological sources
Numbers in parentheses indicate the 68% confidence intervals of the best fit. Statistical analyses used constraints for the sw values of the monomer (2.8–3.2 S) and of the dimer species (4.9–5.2 S). ND, confidence intervals not determined. The Kd was calculated with the fractions of monomer and dimer species obtained from c(s) distributions.
| Tubulin source |
Kd |
|
|---|---|---|
| Autologous dimerization | Heterologous dimerization | |
| nm | ||
| Chicken red blood cells | 0.33 (0.087–0.64) | 5.3 (0.2–30) |
| Leishmania cells | 1.7 (0.68–2.8) | 6.1 (ND) |
| Rat brain | 2.8 (1.8–6.6) | 6.1 (ND) |
| Chicken brain | 19 (15–21) | 6.2 (3.3–8.3) |
| Human HeLa cells | 47 (17–110) | 5.4 (ND) |
Dimer dissociation and monomer exchange experiments
We previously showed that free tubulin monomers can exchange into tubulin dimers added at higher concentration (13). The experiment consisted of the titration of a tracer monomer solution with added dimers of the same tubulin at high concentration. This was done by preparing a sample of fluorescent tubulin diluted to low nm concentration such that it dissociates into free monomers. Then, at equilibrium, a 100-fold molar excess of nonfluorescent, but otherwise identical, tubulin is added to the fluorescent tubulin monomers. Samples, prior to and after addition of nonfluorescent tubulin, were studied simultaneously by sedimentation velocity. The exchange of the fluorescent monomers with a nonfluorescent monomer of the added dimers or, equivalently, the pairing with a monomer of the added tubulin is documented by the shift of the fluorescence signal from ∼3 (monomer) to ∼5 S (dimer).
In addition to repeating the demonstration that fluorescent tubulin monomers could exchange into added tubulin dimers from the same biological source (we shall refer to this as “autologous dimerization”), we tested the ability of labeled tubulin monomers to exchange into tubulin from a different biological source (we refer to this as “heterologous dimerization”). To do this, we analyzed the fluorescent tubulins used in Fig. 1 at 10 nm concentration (Fig. 3, red curves) and with the addition of 1 μm nonfluorescent rat brain tubulin (Fig. 3, blue curves). These pairs of samples were analyzed in parallel in the same sedimentation velocity experiment. Inspection of the resulting c(s) distributions for these samples (Fig. 3) showed the monomer and dimer peaks at the expected sw values of ∼3 and ∼5 S, respectively. In all cases, the amplitude of the monomer peak decreased in response to the addition of excess nonfluorescent rat brain tubulin. A concomitant increase in the dimer peak amplitude was observed, indicating dimerization of the free fluorescent tubulin monomers with the added nonfluorescent tubulin. We parameterized this shift by estimating a Kd from the fractions of monomer and dimer species observed in the c(s) distributions shown in Fig. 3 (Table 1, heterologous Kd). This estimate is of poorer quality than the number obtained from the analysis of the entire isotherm but may serve as a rough measure of the affinity among tubulins from different species. In all cases, the heterologous dimerization Kd (with rat brain tubulin) calculated from fractions of monomer and dimer species was similar in value (Table 1, heterologous Kd). Interestingly, we observed that the magnitude of heterologous Kd for all cases analyzed here was of similar value (if not the same) to the autologous Kd of rat brain tubulin alone (the protein used for titrations), which was obtained by full isotherm analysis. These heterologous dimerization Kd values vary by less than 25% from each other. By contrast, we observed a greater variability, near 150-fold variation, of the autologous dimerization Kd values of tubulins from different sources and tissues (Table 1, autologous dimerization).
Figure 3.
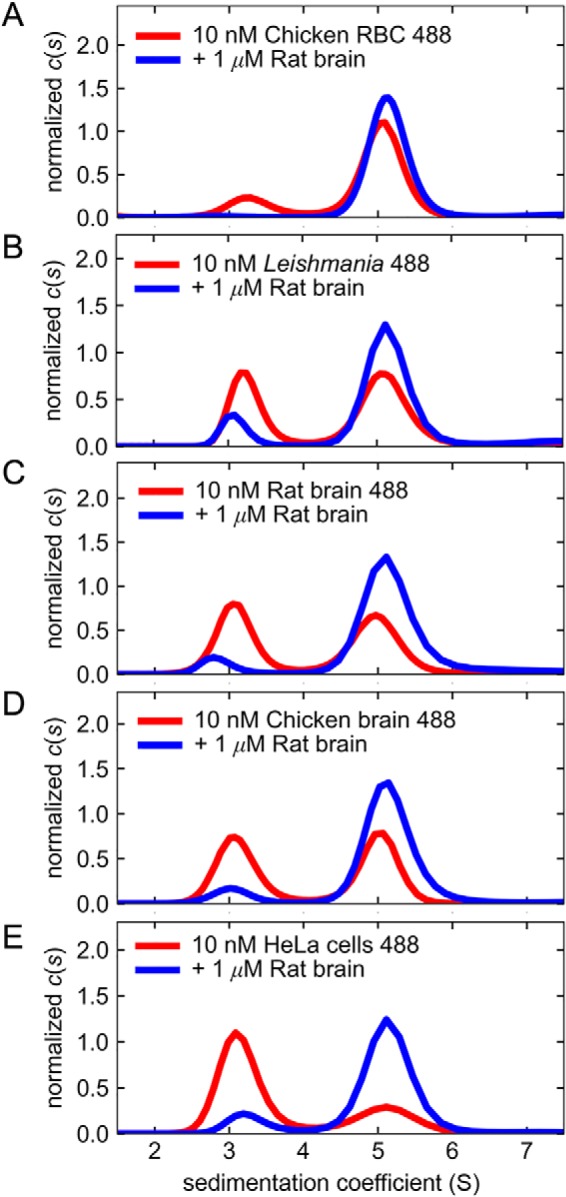
Free tubulin monomers are stable and reversibly exchange with heterologous tubulin. The reversibility of dimer dissociation and the stability of the free monomers are demonstrated with the monomer exchange experiment. Dissociation of the tubulin dimer is induced by dilution of the fluorescent stocks to 10 nm concentration. At equilibrium, a 100-fold molar excess of nonfluorescent tubulin dimers is added, and parallel samples with (blue curves) and without (red curves) addition of unlabeled tubulin are analyzed by sedimentation velocity experiments. Comparisons of the resulting fractions of monomer and dimer species for the two parallel samples provide information of the affinity of the heterologous interaction. A, chicken red blood cell tubulin; B, tubulin from L. tarentolae cell cultures; C, rat brain tubulin; D, chicken brain tubulin; E, tubulin from human HeLa cell cultures. The apparent dimer dissociation constants (Kd) calculated from the fractions of monomer and dimer species are shown in Table 1.
Because the values of apparent Kd measured with the monomer exchange experiments used only one concentration of tubulin, we wished to more precisely determine the Kd for interaction of these tubulins with heterologous tubulin by constructing a full isotherm over a broad range of concentrations. This was done by adding multiple concentrations of unlabeled rat brain tubulin to a dilute solution of fluorescent tubulin from chicken brain or from chicken red blood cells, which showed a 50-fold difference in Kd (Table 1, autologous dimerization). We adjusted the concentration of diluted fluorescent tubulin compared with Fig. 3 to increase the sensitivity of the sedimentation velocity experiment (see Fig. 4 legend). The c(s) distributions shown in Fig. 4, A and B, show a decrease in the amplitude of the 3 S peak (monomer) and the ensuing increase in the amplitude of the 5 S peak (dimer) following the multiple additions of unlabeled rat brain tubulin, demonstrating the dimerization of fluorescent monomers of chicken RBC tubulin and of chicken brain tubulin with added rat brain tubulin.
Figure 4.
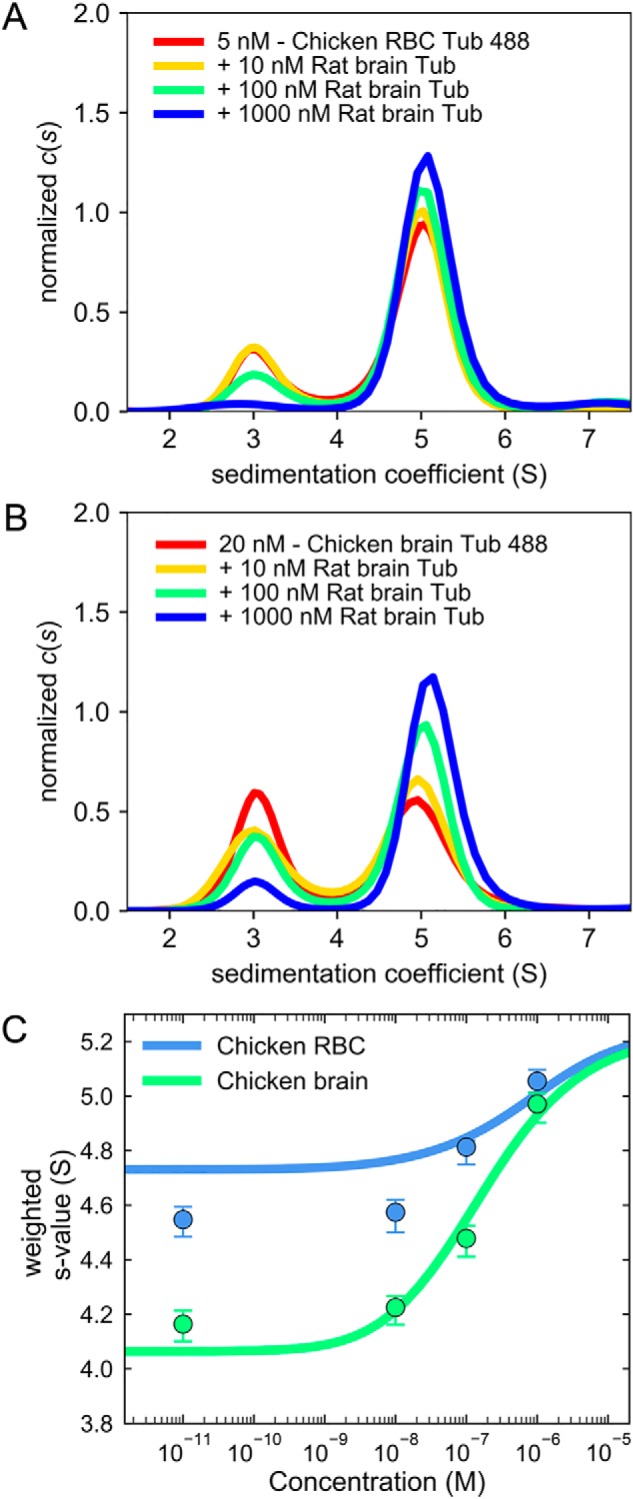
Free tubulin monomers from chicken red blood cells and from chicken brain bind to heterologous tubulin with similar affinities. The monomer exchange experiment was extended to a full titration to more precisely determine the apparent dissociation constant for interaction with heterologous tubulin (Tub) (rat brain). A low concentration of fluorescently labeled tubulin from chicken red blood cells (5 nm; A) and from chicken brain (20 nm; B) that showed significant amounts of free monomers was titrated with increasing concentrations of nonfluorescent tubulin dimers, inducing exchange of monomers. In both cases, the best-fit c(s) distributions showed a gradual decrease of the monomer species' population (∼3 S) and a concomitant increase in the dimer species' population (∼5 S) when the concentration of added rat brain tubulin increased from 0.01 to 1000 nm. The integrated sw values obtained from the c(s) distributions were plotted as a function of nonfluorescent rat brain tubulin concentration in C (the value at 0.01 nm represents the data in the absence of rat brain tubulin). The error bars are uncertainties of the integrated sw values. The resulting sw isotherms were analyzed using the heterologous dimer association model (see “Experimental procedures” for details) by nonlinear regression to determine the best-fit heterologous Kd, given known values of the autologous dimerization constants, as shown in Table 1.
In the monomer exchange experiment done with a single concentration of tubulin (Fig. 3), we observed complete depletion of the monomer peak of fluorescent tubulin from chicken red blood cells after addition of 1 μm unlabeled tubulin from rat brain. With the titration experiment (Fig. 4), we could confirm that, at 1 μm added unlabeled rat brain tubulin, all free chicken RBC monomers are incorporated into dimers, combining with tubulin of rat brain, which is an indication of the proper folded state of dissociated chicken RBC tubulin monomers. The quantitative analysis of the binding sw isotherms obtained with these experiments is shown in Fig. 4C, and the best-fit values for the heterologous Kd, given the previously measured autologous Kd values, are shown in Table 1. The nonlinear regression analysis of chicken RBC tubulin gave a fit of poorer quality than that of chicken brain tubulin (Fig. 4C, solid lines). We determined that this deviation can be alleviated by accounting for a concentration correction factor that does not change the best-fit value of the Kd (Fig. S2). Indeed, within statistical significance, the best-fit heterologous Kd values for the interaction of chicken red blood cell and of chicken brain tubulins with unlabeled rat brain tubulin are similar.
Discussion
Tubulins are conserved eukaryotic proteins that play critical roles in many cellular functions. Tubulins and other prokaryotic homologous proteins, such as FtsZ and BtubA/B, are grouped in the tubulin/FtsZ superfamily of proteins (1). All members of the tubulin/FtsZ superfamily bind the nucleotide GTP, share a similar 3D structure, and can self-assemble into linear polymers (26). To our knowledge, the only members of the tubulin family that associate, forming high-affinity dimers (in this case heterodimers), are α- and β-tubulin, although bacterial tubulin BtubA/B and FtsZ may form weak dimers as a step of polymerization (27–29).
It is well-documented that after translation both α- and β-tubulins require chaperonin-assisted monomer folding followed by chaperone-assisted dimerization to produce the native dimer (5). However, it has also been shown that other tubulins, e.g. γ-tubulin, remain as monomers following chaperonin-assisted folding (30, 31). The prokaryotic homologs FtsZ and BtubA/B are self-folding monomers that can form weak dimers depending on experimental conditions. Only eukaryotic tubulins require a set of protein-assisted steps to achieve the native folded structure, both in the case of proteins that stay monomers, like γ-tubulin, and for monomers that become dimers, like αβ-tubulin (32).
Although α- and β-tubulins form a native dimer, the dimer is not covalent, and dimerization is not required for α- or β-tubulin to fold correctly or to maintain the native monomeric fold. It has been shown that α- and β-tubulin can be synthesized and correctly folded in vitro in reticulocyte lysates, yielding low concentrations of isolated monomers that are capable of exchanging with added tubulin as well as copolymerizing with added tubulin to form normal microtubules (11, 12). Similarly, we have previously shown that, when diluted, tubulin will produce monomers by dissociation and that those monomers can then dimerize with added tubulin (13).
Multiple investigations have shown that native tubulin dimers undergo spontaneous reversible dissociation to yield stable monomers. Indeed, in the first report characterizing purified tubulin, the authors observed an equilibrium between dimers and monomers sustained by the dissociation of tubulin (33). More detailed examination of the subject, mostly of tubulin purified from mammalian brain, showed that this dissociation obeys a simple Kd (13–19). Here, we showed that (i) tubulin dimers from multiple different biological sources all reversibly dissociate, yielding monomers; (ii) the measured Kd (autologous dimerization) ranges from 3 × 10⁻¹⁰ to 5 × 10⁻⁸ m, or nearly 150-fold in variation (ΔΔG ∼ 3 kcal/mol); and (iii) the heterologous dimerization Kd (with unlabeled rat brain tubulin) is similar among the tubulins analyzed here. These data extend the range of observed dimer dissociation for the tubulin family. Although αβ-tubulin dimers dissociate with a Kd in the nanomolar range, at the opposite end of the range are prokaryotic BtubA/B and FtsZ, which are monomers at μm concentrations and weakly dimerize with a Kd of about 10 μm (29, 34, 35).
Once tubulin dimers dissociate, α and β monomers can form dimers with new partners. This monomer exchange or sorting has been shown in vitro with newly synthesized tubulin monomers with radioactive tags (11, 12) but also has been shown in vivo where distinct β-tubulin isotypes display different affinities for their α-tubulin partners (10). Moreover, direct quantitation of tubulin isotype expression levels with MS showed different specific relative amounts of α- and β-tubulin isotypes, which suggested an active sorting of tubulin isotypes (36). These studies demonstrate the formation of mixed αβ-tubulin heterodimers immediately following translation, suggesting that this exchange of isotypes may occur in vivo; i.e. the sorting of tubulin isotypes may not need to be spatiotemporally coordinated with gene expression to generate heterodimers of specific isotypes.
Thus, whereas previous studies used radioactive, immunological tags or MS to follow monomers and dimers of tubulin, here we used fluorescence detection in sedimentation velocity experiments. This was possible due to developments in analytical ultracentrifugation methods that allow detection of low concentrations of fluorescent molecules and the characterization of protein–protein interactions with dissociation constants of picomolar affinity (25, 37, 38). Our method in this study incorporates an improvement in sample preparation that prevents adsorption of tubulin to the analytical ultracentrifugation cell by adding BSA. This avoids protein loss and reduces the estimate of Kd for rat brain tubulin from the previously published value of 84 (54–123) nm to the value observed here of 2.8 (1.8–6.6) nm.
Using these methods, we showed here that tubulins from many different sources dissociate with very different Kd values, with values differing by more than 2 orders of magnitude. We also showed, for the first time, that monomers produced by dissociation of fluorescent tubulin dimers can form new dimers with added tubulin from very different biological sources (heterologous interactions).
It may seem surprising that tubulin from evolutionarily distant organisms can form dimers, but tubulin is very conserved in evolution, and tubulins have long been known to readily copolymerize with dimers from biologically distant sources (39–42). However, copolymerization of tubulin dimers involved the interdimer contact in the formation of the protofilaments, and this interaction interface is structurally different from the intradimer contact that participates in the stabilization of the dimer.
We characterized the conservation of the residues involved in the tubulin intradimer contact and showed a high sequence similarity (Fig. 5), almost fully identical with the consensus, suggesting that all these α and β monomers from heterologous sources should share the ability to associate to form dimers as previously (39–42) observed in copolymerization experiments with natural tubulin dimers extracted from distinct sources. However, even small differences in conformation and sequence should modulate the binding energetics substantially (see below).
Figure 5.

Conservation analysis of the residues involved in the intradimer contact between α- and β-tubulin. The residues involved in the intradimer contacts between the tubulin α and β monomers were selected on the crystal structure of the tubulin dimer (Protein Data Bank (PDB) codes 1JFF and 1SA0) based on the proximity to the neighboring chain (<4 Å). The nucleotides bound to α- and β-tubulin were removed before applying the selection criteria. In the case of the α-tubulin chain, 34 residues were selected, whereas 32 residues were selected from the β-tubulin chain. The positions and identities of the residues are shown in the molecular model (right panel). To find the consensus sequence and the degree of conservation of the residues involved in the intradimer contact, we performed a sequence alignment (MUSCLE v3.8) of the family of α- and β-tubulins from the tissues/species used in this study, Homo sapiens (eight α and nine β), Rattus norvegicus (six α and eight β), Gallus gallus (six α and six β), and L. tarentolae (one α and one β), and included the sequence of the α- and β-tubulins from the crystal structures, PDB codes 1JFF and 1SA0, corresponding to bovine tubulin genes TUBA1B and TUBB2B, respectively. The sequence alignments (left panel) showed a high degree of conservation as quantified by the conservation index, shown at the bottom of the sequence alignment. The numbers at the top of the alignments are the positions of the residues of α-tubulin (TUBA1B) and β-tubulin (TUBB2B) from the crystal structure of PDB code 1JFF. The conservation index was calculated as the reciprocal of the normalized Shannon entropy (using 20 as the number of amino acid types) calculated for each position. With few exceptions, the conservation of the residues of the intradimer contact is maximal. The two main contributors to the stability of protein–protein interactions, salt bridges and hydrophobic bonds, were also conserved. All tubulins considered in our sequence analysis showed the pairs Glu71-A/Asp98-B and Asp98-A/Arg253-B that are predicted to form a salt bridge between α- and β-tubulin in the intradimer contact. The fraction of hydrophobic residues in the interface was closely similar, with averages of 29% for α-tubulin and 36% for β-tubulin. The high degree of conservation of the residues involved in the intradimer contact suggests that the tubulin monomers from all these sources should be able to exchange and interact with each other.
We measured the affinity of these heterologous interactions between tubulin dimers extracted from various distinct sources and, somewhat unexpectedly, observed similar affinities when titrated with unlabeled RBT. Because the sequence of the interface is highly conserved for these tubulins, including its properties such as the fraction of polar, hydrophobic, and charged residues; the change in solvent-accessible surface area upon binding; and the size of the interface (43), we speculated that the affinities should be similar or close to the values of autologous Kd. Our data indicate that this was not case as the values of heterologous Kd were almost identical for all cases analyzed. Moreover, the heterologous Kd was closely similar to the autologous Kd of rat brain tubulin alone.
How can the value of heterologous Kd determined with our experiments be similar among all tubulins and also very close to the value of autologous Kd of RBT? To contemplate an answer to this question, we must consider the determinants of the binding affinities for protein–protein complexes. It is generally accepted that predicting binding affinity from structural and sequence data is nearly impossible as even the most advanced computational methods are at most qualitative and can find significant correlations between predicted and experimental values only for a small subset of the available data sets of protein complexes (44). Despite this, the consensus is that the affinity of protein–protein interactions is governed by the properties of the interacting surface, such as the number of polar, charged, and hydrophobic residues and the size of the interface. More recently the concept of the noninteracting surface (NIS) has emerged as an important modulator of the binding affinity. The NIS is composed of polar and charged residues that exert their influence over the binding affinity by long-range electrostatic contributions and by surface–solvent interactions that propagate to the interacting surface (45). Based on this information, we speculate about the binding affinities observed in this work.
Our computational analysis of the properties of tubulin intradimer contact suggested that these proteins should associate with similar affinities because the interfaces are very conserved (43). However, the values of autologous Kd measured here vary by more than 2 orders of magnitude, indicating that the NIS is playing an important role in regulating the affinity of the interaction. In the specific case of natural tubulin used in this work, NIS should consider not only the aspects listed above but should also include the variability introduced by the presence of multiple isotypes in our preparations and the many post-translational modifications that are known for tubulin (46). For heterologous Kd, the values are very similar to autologous Kd of RBT, which is the protein used for the titrations. We speculate that this is an indication of the strong effect of the NIS over the binding affinity of the tubulin dimer where the NIS of the tubulin used for the titrations (RBT) is somehow governing the affinity of the interaction. We have attempted to quantify the relative energetic contribution of the NISRBT in modulating the affinity of the interaction (Table 2). We compared the free energies estimated for autologous Kd and heterologous Kd, and our calculations indicate that NISRBT works as a destabilizing force when combined with chicken red blood cell tubulin, whereas it works as a stabilizing force when combined with tubulin from human HeLa cells. Although these conclusions are based on speculations about the determinants of the affinity of protein–protein interactions, the system described here offers an attractive experimental system to study the effects of the variability of the properties of natural tubulin, such as PTMs and isotype composition (or NIS), over the affinity of the tubulin dimer. Nonetheless, this is the first systematic demonstration of both different Kd values for dimer dissociation of tubulin from distinct sources and of monomer exchange between tubulins as different as Leishmania and mammals.
Table 2.
Free energies for autologous and heterologous interactions of tubulin
The free energies of autologous and heterologous interactions were calculated with ΔG = −RT ln(Kd), and the differences in free energies were calculated with ΔΔG = ΔGautologous − ΔGheterologous. Numbers in parentheses are the 68% confidence intervals propagated from the Kd estimates.
| Tubulin source | ΔGautologous | ΔGheterologous | ΔΔG |
|---|---|---|---|
| kcal/mol | kcal/mol | kcal/mol | |
| Chicken red blood cells | 12.7 (12.3–13.4) | 11.1 (10.0–13.0) | 1.6 |
| Leishmania cells | 11.7 (11.4–12.2) | 11.0 | 0.7 |
| Rat brain | 11.4 (10.9–11.7) | 11.0 | 0.4 |
| Chicken brain | 10.3 (10.2–10.5) | 11.0 (10.8–11.3) | −0.7 |
| Human HeLa cells | 9.79 (9.30–10.4) | 11.1 | −1.3 |
Experimental procedures
Protein purification
Tubulin from rat brain was purified from microtubule protein as described previously (47). Tubulin from chicken brain and from chicken red blood cells was purified from frozen whole brains and from washed red blood cells (Pel-Freeze Biologicals), respectively, as described previously (48). Tubulin from human HeLa cell cultures (Accurate Chemicals & Scientific Corp.) and from L. tarentolae cell pellets (Jena Biosciences, Jena, Germany) was purified with a previously described protocol (49) using an initial ion-exchange step to purify and concentrate the protein followed by an assembly–disassembly cycle to recover polymerization-competent tubulin. The purified protein was stored in PM buffer (0.1 m Pipes-KOH, pH 7, 1 mm MgCl2) at −80 °C. The estimation of protein concentration was made using the Bradford assay (Bio-Rad) with BSA as the calibration standard (catalog number 23209, Thermo Fisher Scientific).
Fluorescent labeling
Tubulin was stably polymerized using trimethyl-N-oxide and fluorescently labeled with DyLight-488 NHS ester (Thermo Fisher) as described previously (13). After removal of the unreacted dye using gel filtration (Zeba micro-spin columns, Thermo Fisher), the labeling ratio was determined spectrophotometrically using the extinction coefficient of DyLight-488, ϵdye = 70,000 m−1 cm−1 at 493 nm. An ad hoc extinction coefficient was obtained for the purified tubulins used in this study, starting from the protein sequence and by considering 2 mol of GDP bound per tubulin heterodimer. The resulting extinction coefficient for tubulin is ϵtub = 110,000 m−1 cm−1, and the calculated labeling ratios are: chicken red blood cell tubulin, 90%; L. tarentolae cell tubulin, 180%; rat brain tubulin, 40%; chicken brain tubulin, 20%; and human HeLa cells, 30%.
Sedimentation velocity analytical ultracentrifugation experiments
Sedimentation velocity experiments were performed with an Optima XL-A analytical ultracentrifuge (Beckman Coulter, Indianapolis, IN) equipped with a fluorescence detection system (emission at 488 nm; AVIV Biomedical, Lakewood, NJ). 400-μl samples were loaded in standard double-sector Epon centerpieces enclosed with sapphire windows and placed in an An50 Ti eight-hole rotor. Runs were carried out at 50,000 rpm (T = 20 °C) using standard procedures as described in more detail elsewhere (38). Samples were incubated for 2 h prior to starting the run. For dilution experiments, the tubulin stocks were first supplemented with BSA at 0.1 mg/ml (catalog number A7030, Sigma-Aldrich) by directly adding an aliquot of BSA stock to each tube as explained in detail previously (38). Then, tubulin was adjusted to the desired concentrations in PM buffer containing 0.1 mg/ml BSA, which was used as a surface-passivating agent to minimize the adsorption of the protein to the components of the analytical ultracentrifugation cell assembly (Fig. S1). No other compounds were added to the tubulin solutions.
Analysis of sedimentation velocity data
Analysis of sedimentation velocity data was carried out in SEDFIT software (version 15.01) using the built-in continuous sedimentation coefficient distribution model c(s) as described in detail previously (13, 24). The error bars of the sw values are the confidence intervals (68%) determined with F-statistics, optimizing the position of the meniscus for its influence over the root mean square deviation of the sedimentation boundary fits, as described previously (13). Integrated sw values were corrected for contribution of the passivating agent BSA, which carries a small fluorescence signal, as described previously (50). For isotherm analysis of autologous dimerization, the parameters describing tubulin dimer dissociation were determined by nonlinear regression in SEDPHAT software (version 12.1) using the monomer–dimer self-association model as described previously (13). In the fitting routine, for calculation of the confidence intervals, the monomer and dimer species s values were allowed to float in the range 2.8–3.2 and 4.9–5.2 S, respectively. For the heterologous dimerization, the competitive homo- and heterodimerization model of SEDPHAT was used as described previously (51) where the binding constants for autologous dimerization were fixed to the values measured separately. Confidence intervals were calculated using the error projection method and F-statistics (52). The high-resolution plots of sedimentation velocity data were obtained with the software GUSSI 1.1.0 (53).
Author contributions
F. M.-F., S. K. C., and D. L. S. conceptualization; F. M.-F., S. K. C., P. S., and D. L. S. formal analysis; F. M.-F., S. K. C., P. S., and D. L. S. investigation; F. M.-F., S. K. C., and D. L. S. writing-original draft; F. M.-F., S. K. C., P. S., and D. L. S. writing-review and editing; S. K. C., P. S., and D. L. S. methodology; P. S. software.
Supplementary Material
Acknowledgment
We thank Dr. Allen Minton (National Institutes of Health) for helpful discussions about the monomer exchange data.
This work was supported by the intramural research programs of the NIBIB and NICHD, National Institutes of Health. The authors declare that they have no conflicts of interest with the contents of this article. The content is solely the responsibility of the authors and does not necessarily represent the official views of the National Institutes of Health.
This article contains Figs. S1 and S2.
- FtsZ
- filamentous temperature-sensitive protein
- CCT
- chaperonin containing TCP1
- PTM
- post-translational modification
- RBT
- rat brain tubulin
- RBC
- red blood cell
- BtubA/B
- bacterial tubulin A/B
- NIS
- noninteracting surface.
References
- 1. Findeisen P., Mühlhausen S., Dempewolf S., Hertzog J., Zietlow A., Carlomagno T., and Kollmar M. (2014) Six subgroups and extensive recent duplications characterize the evolution of the eukaryotic tubulin protein family. Genome Biol. Evol. 6, 2274–2288 10.1093/gbe/evu187 [DOI] [PMC free article] [PubMed] [Google Scholar]
- 2. Rommelaere H., De Neve M., Neirynck K., Peelaers D., Waterschoot D., Goethals M., Fraeyman N., Vandekerckhove J., and Ampe C. (2001) Prefoldin recognition motifs in the nonhomologous proteins of the actin and tubulin families. J. Biol. Chem. 276, 41023–41028 10.1074/jbc.M106591200 [DOI] [PubMed] [Google Scholar]
- 3. Llorca O., Martín-Benito J., Ritco-Vonsovici M., Grantham J., Hynes G. M., Willison K. R., Carrascosa J. L., and Valpuesta J. M. (2000) Eukaryotic chaperonin CCT stabilizes actin and tubulin folding intermediates in open quasi-native conformations. EMBO J. 19, 5971–5979 10.1093/emboj/19.22.5971 [DOI] [PMC free article] [PubMed] [Google Scholar]
- 4. Joachimiak L. A., Walzthoeni T., Liu C. W., Aebersold R., and Frydman J. (2014) The structural basis of substrate recognition by the eukaryotic chaperonin TRiC/CCT. Cell 159, 1042–1055 10.1016/j.cell.2014.10.042 [DOI] [PMC free article] [PubMed] [Google Scholar]
- 5. Tian G., and Cowan N. J. (2013) Tubulin-specific chaperones: components of a molecular machine that assembles the α/β heterodimer. Methods Cell Biol. 115, 155–171 10.1016/B978-0-12-407757-7.00011-6 [DOI] [PMC free article] [PubMed] [Google Scholar]
- 6. Nithianantham S., Le S., Seto E., Jia W., Leary J., Corbett K. D., Moore J. K., and Al-Bassam J. (2015) Tubulin cofactors and Arl2 are cage-like chaperones that regulate the soluble αβ-tubulin pool for microtubule dynamics. Elife 4, e088114 10.7554/eLife.08811 [DOI] [PMC free article] [PubMed] [Google Scholar]
- 7. Francis J. W., Goswami D., Novick S. J., Pascal B. D., Weikum E. R., Ortlund E. A., Griffin P. R., and Kahn R. A. (2017) Nucleotide binding to ARL2 in the TBCD-ARL2-β-tubulin complex drives conformational changes in β-tubulin. J. Mol. Biol. 429, 3696–3716 10.1016/j.jmb.2017.09.016 [DOI] [PMC free article] [PubMed] [Google Scholar]
- 8. Wang Y., Tian G., Cowan N. J., and Cabral F. (2006) Mutations affecting β-tubulin folding and degradation. J. Biol. Chem. 281, 13628–13635 10.1074/jbc.M513730200 [DOI] [PMC free article] [PubMed] [Google Scholar]
- 9. Gard D. L., and Kirschner M. W. (1987) Microtubule assembly in cytoplasmic extracts of Xenopus oocytes and eggs. J. Cell Biol. 105, 2191–2201 10.1083/jcb.105.5.2191 [DOI] [PMC free article] [PubMed] [Google Scholar]
- 10. Hoyle H. D., Turner F. R., Brunick L., and Raff E. C. (2001) Tubulin sorting during dimerization in vivo. Mol. Biol. Cell 12, 2185–2194 10.1091/mbc.12.7.2185 [DOI] [PMC free article] [PubMed] [Google Scholar]
- 11. Yaffe M. B., Levison B. S., Szasz J., and Sternlicht H. (1988) Expression of a human α-tubulin: properties of the isolated subunit. Biochemistry 27, 1869–1880 10.1021/bi00406a012 [DOI] [PubMed] [Google Scholar]
- 12. Yaffe M. B., Farr G. W., and Sternlicht H. (1988) Translation of β-tubulin mRNA in vitro generates multiple molecular forms. J. Biol. Chem. 263, 16023–16031 [PubMed] [Google Scholar]
- 13. Montecinos-Franjola F., Schuck P., and Sackett D. L. (2016) Tubulin dimer reversible dissociation: affinity, kinetics, and demonstration of a stable monomer. J. Biol. Chem. 291, 9281–9294 10.1074/jbc.M115.699728 [DOI] [PMC free article] [PubMed] [Google Scholar]
- 14. Mejillano M. R., and Himes R. H. (1989) Tubulin dimer dissociation detected by fluorescence anisotropy. Biochemistry 28, 6518–6524 10.1021/bi00441a053 [DOI] [PubMed] [Google Scholar]
- 15. Sackett D. L., and Lippoldt R. E. (1991) Thermodynamics of reversible monomer-dimer association of tubulin. Biochemistry 30, 3511–3517 10.1021/bi00228a023 [DOI] [PubMed] [Google Scholar]
- 16. Panda D., Roy S., and Bhattacharyya B. (1992) Reversible dimer dissociation of tubulin S and tubulin detected by fluorescence anisotropy. Biochemistry 31, 9709–9716 10.1021/bi00155a026 [DOI] [PubMed] [Google Scholar]
- 17. Shearwin K. E., Perez-Ramirez B., and Timasheff S. N. (1994) Linkages between the dissociation of α/β-tubulin into subunits and ligand binding: the ground state of tubulin is the GDP conformation. Biochemistry 33, 885–893 10.1021/bi00170a006 [DOI] [PubMed] [Google Scholar]
- 18. Menéndez M., Rivas G., Díaz J. F., and Andreu J. M. (1998) Control of the structural stability of the tubulin dimer by one high affinity bound magnesium ion at nucleotide N-site. J. Biol. Chem. 273, 167–176 10.1074/jbc.273.1.167 [DOI] [PubMed] [Google Scholar]
- 19. Caplow M., and Fee L. (2002) Dissociation of the tubulin dimer is extremely slow, thermodynamically very unfavorable, and reversible in the absence of an energy source. Mol. Biol. Cell 13, 2120–2131 10.1091/mbc.e01-10-0089 [DOI] [PMC free article] [PubMed] [Google Scholar]
- 20. Lewis S. A., Lee M. G., and Cowan N. J. (1985) Five mouse tubulin isotypes and their regulated expression during development. J. Cell Biol. 101, 852–861 10.1083/jcb.101.3.852 [DOI] [PMC free article] [PubMed] [Google Scholar]
- 21. Miller F. D., Naus C. C., Durand M., Bloom F. E., and Milner R. J. (1987) Isotypes of α-tubulin are differentially regulated during neuronal maturation. J. Cell Biol. 105, 3065–3073 10.1083/jcb.105.6.3065 [DOI] [PMC free article] [PubMed] [Google Scholar]
- 22. Sirajuddin M., Rice L. M., and Vale R. D. (2014) Regulation of microtubule motors by tubulin isotypes and post-translational modifications. Nat. Cell Biol. 16, 335–344 10.1038/ncb2920 [DOI] [PMC free article] [PubMed] [Google Scholar]
- 23. Chakraborti S., Natarajan K., Curiel J., Janke C., and Liu J. (2016) The emerging role of the tubulin code: from the tubulin molecule to neuronal function and disease. Cytoskeleton 73, 521–550 10.1002/cm.21290 [DOI] [PubMed] [Google Scholar]
- 24. Schuck P. (2000) Size-distribution analysis of macromolecules by sedimentation velocity ultracentrifugation and Lamm equation modeling. Biophys. J. 78, 1606–1619 10.1016/S0006-3495(00)76713-0 [DOI] [PMC free article] [PubMed] [Google Scholar]
- 25. Schuck P., and Zhao H. (2017) Sedimentation Velocity Analytical Ultracentrifugation: Interacting Systems, CRC Press, Boca Raton, FL [Google Scholar]
- 26. Ludueña R. F. (2013) A hypothesis on the origin and evolution of tubulin. Int. Rev. Cell Mol. Biol. 302, 41–185 10.1016/B978-0-12-407699-0.00002-9 [DOI] [PubMed] [Google Scholar]
- 27. Sontag C. A., Staley J. T., and Erickson H. P. (2005) In vitro assembly and GTP hydrolysis by bacterial tubulins BtubA and BtubB. J. Cell Biol. 169, 233–238 10.1083/jcb.200410027 [DOI] [PMC free article] [PubMed] [Google Scholar]
- 28. Huecas S., Llorca O., Boskovic J., Martín-Benito J., Valpuesta J. M., and Andreu J. M. (2008) Energetics and geometry of FtsZ polymers: nucleated self-assembly of single protofilaments. Biophys. J. 94, 1796–1806 10.1529/biophysj.107.115493 [DOI] [PMC free article] [PubMed] [Google Scholar]
- 29. Montecinos-Franjola F., Ross J. A., Sánchez S. A., Brunet J. E., Lagos R., Jameson D. M., and Monasterio O. (2012) Studies on the dissociation and urea-induced unfolding of FtsZ support the dimer nucleus polymerization mechanism. Biophys. J. 102, 2176–2185 10.1016/j.bpj.2012.03.064 [DOI] [PMC free article] [PubMed] [Google Scholar]
- 30. Aldaz H., Rice L. M., Stearns T., and Agard D. A. (2005) Insights into microtubule nucleation from the crystal structure of human γ-tubulin. Nature 435, 523–527 10.1038/nature03586 [DOI] [PubMed] [Google Scholar]
- 31. Melki R., Vainberg I. E., Chow R. L., and Cowan N. J. (1993) Chaperonin-mediated folding of vertebrate actin-related protein and γ-tubulin. J. Cell Biol. 122, 1301–1310 10.1083/jcb.122.6.1301 [DOI] [PMC free article] [PubMed] [Google Scholar]
- 32. Serna M., and Zabala J. C. (2016) Tubulin folding and degradation, in eLS, John Wiley & Sons, Ltd., Chichester, UK: 10.1002/9780470015902.a0026333 [DOI] [Google Scholar]
- 33. Weisenberg R. C., Borisy G. G., and Taylor E. W. (1968) The colchicine-binding protein of mammalian brain and its relation to microtubules. Biochemistry 7, 4466–4479 10.1021/bi00852a043 [DOI] [PubMed] [Google Scholar]
- 34. Sontag C. A., Sage H., and Erickson H. P. (2009) BtubA-BtubB heterodimer is an essential intermediate in protofilament assembly. PLoS One 4, e7253 10.1371/journal.pone.0007253 [DOI] [PMC free article] [PubMed] [Google Scholar]
- 35. Monterroso B., Alfonso C., Zorrilla S., and Rivas G. (2013) Combined analytical ultracentrifugation, light scattering and fluorescence spectroscopy studies on the functional associations of the bacterial division FtsZ protein. Methods 59, 349–362 10.1016/j.ymeth.2012.12.014 [DOI] [PubMed] [Google Scholar]
- 36. Verdier-Pinard P., Wang F., Burd B., Angeletti R. H., Horwitz S. B., and Orr G. A. (2003) Direct analysis of tubulin expression in cancer cell lines by electrospray ionization mass spectrometry. Biochemistry 42, 12019–12027 10.1021/bi0350147 [DOI] [PubMed] [Google Scholar]
- 37. Zhao H., Mayer M. L., and Schuck P. (2014) Analysis of protein interactions with picomolar binding affinity by fluorescence-detected sedimentation velocity. Anal. Chem. 86, 3181–3187 10.1021/ac500093m [DOI] [PMC free article] [PubMed] [Google Scholar]
- 38. Chaturvedi S. K., Ma J., Zhao H., and Schuck P. (2017) Use of fluorescence-detected sedimentation velocity to study high-affinity protein interactions. Nat. Protoc. 12, 1777–1791 10.1038/nprot.2017.064 [DOI] [PMC free article] [PubMed] [Google Scholar]
- 39. Baum P., Thorner J., and Honig L. (1978) Identification of tubulin from the yeast Saccharomyces cerevisiae. Proc. Natl. Acad. Sci. U.S.A. 75, 4962–4966 10.1073/pnas.75.10.4962 [DOI] [PMC free article] [PubMed] [Google Scholar]
- 40. Slabas A. R., MacDonald G., and Lloyd C. W. (1980) Selective purification of plant proteins which co-polymerise with mammalian microtubules. FEBS Lett. 110, 77–79 10.1016/0014-5793(80)80027-5 [DOI] [PubMed] [Google Scholar]
- 41. Baker H. N., Rothwell S. W., Grasser W. A., Wallis K. T., and Murphy D. B. (1990) Copolymerization of two distinct tubulin isotypes during microtubule assembly in vitro. J. Cell Biol. 110, 97–104 10.1083/jcb.110.1.97 [DOI] [PMC free article] [PubMed] [Google Scholar]
- 42. Pamula M. C., Ti S.-C., and Kapoor T. M. (2016) The structured core of human β tubulin confers isotype-specific polymerization properties. J. Cell Biol. 213, 425–433 10.1083/jcb.201603050 [DOI] [PMC free article] [PubMed] [Google Scholar]
- 43. Montecinos-Franjola F., Schuck P., and Sackett D. L. (2016) Tubulin monomer-monomer association is less influenced by the solvent than dimer-dimer association: structure and function of tubulin interaction interfaces. Biophys. J. 110, Suppl. 1, 26A–27A 10.1016/j.bpj.2015.11.20726745406 [DOI] [Google Scholar]
- 44. Kastritis P. L., Bonvin A. M. (2013) On the binding affinity of macromolecular interactions: daring to ask why proteins interact. J. R. Soc. Interface 10, 20120835 10.1098/rsif.2012.0835 [DOI] [PMC free article] [PubMed] [Google Scholar]
- 45. Kastritis P. L., Rodrigues J. P., Folkers G. E., Boelens R., Bonvin A. M. (2014) Proteins feel more than they see: fine-tuning of binding affinity by properties of the non-interacting surface. J. Mol. Biol. 426, 2632–2652 10.1016/j.jmb.2014.04.017 [DOI] [PubMed] [Google Scholar]
- 46. Janke C., and Bulinski J. C. (2011) Post-translational regulation of the microtubule cytoskeleton: mechanisms and functions. Nat. Rev. Mol. Cell Biol. 12, 773–786 10.1038/nrm3227 [DOI] [PubMed] [Google Scholar]
- 47. Sackett D. L., Knipling L., and Wolff J. (1991) Isolation of microtubule protein from mammalian brain frozen for extended periods of time. Protein Expr. Purif. 2, 390–393 10.1016/1046-5928(91)90099-5 [DOI] [PubMed] [Google Scholar]
- 48. Sackett D. L. (1995) Rapid purification of tubulin from tissue and tissue culture cells using solid-phase ion exchange. Anal. Biochem. 228, 343–348 10.1006/abio.1995.1361 [DOI] [PubMed] [Google Scholar]
- 49. Sackett D. L., Werbovetz K. A., and Morrissette N. S. (2010) Isolating tubulin from nonneural sources. Methods Cell Biol. 95, 17–32 10.1016/S0091-679X(10)95002-4 [DOI] [PubMed] [Google Scholar]
- 50. Zhao H., Lomash S., Glasser C., Mayer M. L., and Schuck P. (2013) Analysis of high affinity self-association by fluorescence optical sedimentation velocity analytical ultracentrifugation of labeled proteins: opportunities and limitations. PLoS One 8, e83439 10.1371/journal.pone.0083439 [DOI] [PMC free article] [PubMed] [Google Scholar]
- 51. Zhao H., Lomash S., Chittori S., Glasser C., Mayer M. L., and Schuck P. (2017) Preferential assembly of heteromeric kainate and AMPA receptor amino terminal domains. Elife 6, e32056 10.7554/eLife.32056 [DOI] [PMC free article] [PubMed] [Google Scholar]
- 52. Johnson M. L. (1992) Why, when, and how biochemists should use least squares. Anal. Biochem. 206, 215–225 10.1016/0003-2697(92)90356-C [DOI] [PubMed] [Google Scholar]
- 53. Brautigam C. A. (2015) Calculations and publication-quality illustrations for analytical ultracentrifugation data. Methods Enzymol. 562, 109–133 10.1016/bs.mie.2015.05.001 [DOI] [PubMed] [Google Scholar]
Associated Data
This section collects any data citations, data availability statements, or supplementary materials included in this article.