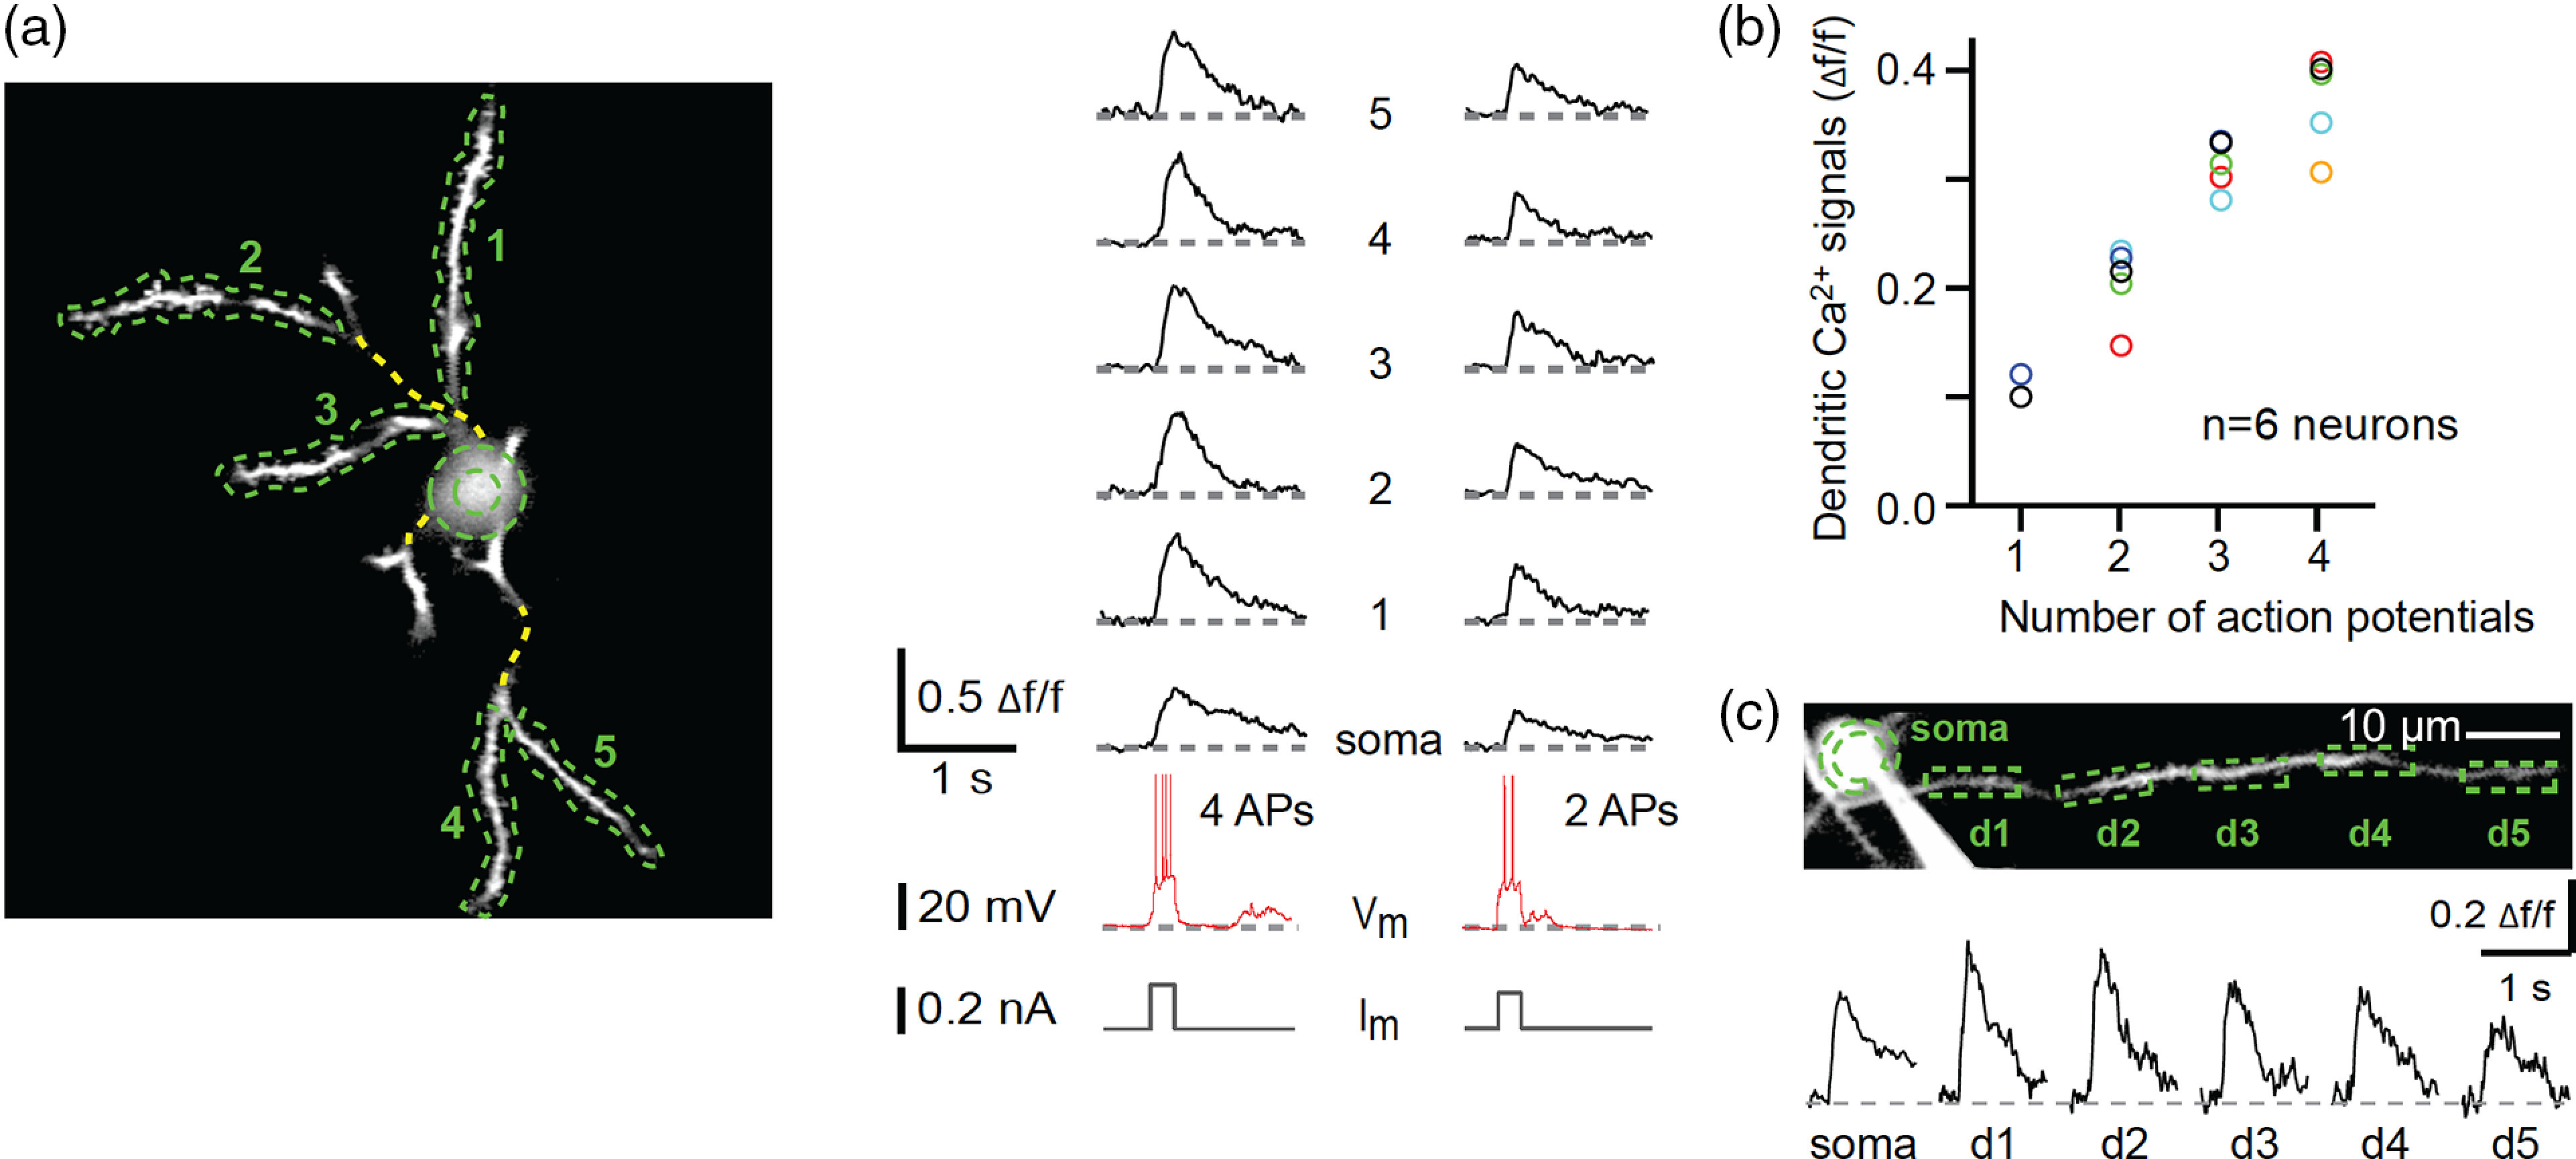
Fig. 6.

Dendritic calcium signals from bAPs. (a) The left panel shows an in vivo two-photon image of a layer 2/3 neuron in the visual cortex loaded with OGB-1. The cell was also targeted for whole-cell recording. Green lines denote the dendritic regions analyzed. The right panel shows fluorescence traces for each of the dendritic region in response to somatic current injection producing either four or two action potentials. (b) The mean amplitude of dendritic calcium signals versus the number of evoked action potentials. Each circle denotes a cell. (c) Fluorescence responses in a dendrite as a function of distance from soma. Figure is adapted from Ref. 77. Reproduced with permission, courtesy of Springer Nature.
