

In Brief
Chromatin reader protein BRD4 is thought to bookmark mitotic chromatin to propagate transcriptional states across mitosis. Behera et al. profiled and perturbed mitotic BRD4 chromatin occupancy to show that BRD4 is dispensable for this process. Instead, BRD4 mitotic chromatin association is likely a mere reflection of mitotically stable histone marks.
SUMMARY
Global changes in chromatin organization and the cessation of transcription during mitosis are thought to challenge the resumption of appropriate transcription patterns after mitosis. The acetyl-lysine binding protein BRD4 has been previously suggested to function as a transcriptional “bookmark” on mitotic chromatin. Here, genome-wide location analysis of BRD4 in erythroid cells, combined with data normalization and peak characterization approaches, reveals that BRD4 widely occupies mitotic chromatin. However, removal of BRD4 from mitotic chromatin does not impair post-mitotic activation of transcription. Additionally, histone mass spectrometry reveals global preservation of most posttranslational modifications (PTMs) during mitosis. In particular, H3K14ac, H3K27ac, H3K122ac, and H4K16ac widely mark mitotic chromatin, especially at lineagespecific genes, and predict BRD4 mitotic binding genome wide. Therefore, BRD4 is likely not a mitotic bookmark but only a “passenger.” Instead, mitotic histone acetylation patterns may constitute the actual bookmarks that restore lineage-specific transcription patterns after mitosis.
Graphical Abstract
INTRODUCTION
Cell identity is underpinned by a robust transcriptional program associated with a particular chromatin landscape of transcription factors (TFs) and histone post-translational modifications (PTMs). Actively dividing cells entering mitosis are thought to face a challenge to the maintenance of cell identity because many transcriptional, regulatory proteins are evicted from condensing chromatin (Gottesfeld and Forbes, 1997; Martínez-Balbás et al., 1995). Recent work has shown, however, that key regulatory regions of DNA remain accessible during mitosis (Hsiung et al., 2015; Martínez-Balbás et al., 1995) and that multiple lineage-specific and general TFs remain bound to chromatin during mitosis (Blobel et al., 2009; Caravaca et al., 2013; Deluz et al., 2016; Festuccia et al., 2016; Kadauke et al., 2012; Liu et al., 2017; Raccaud et al., 2018; Teves et al., 2016). Based primarily on their association with mitotic chromatin, these proteins, which include MLL, GATA1, FoxA1, OCT4, SOX2, ESRRB, and KLF4, have been thought of as “bookmarks” of transcriptional programs across mitosis. Here, we use the term “mitotic bookmark” to require at least two properties: an association with mitotic chromatin, and a regulatory role of transcriptional activation after mitosis.
Early attempts to test bookmarking functions for mitotic chromatin-occupying proteins relied on knockdown or knockout approaches applied across the entire cell cycle (Blobel et al., 2009; Dey et al., 2009; Zhao et al., 2011). These experiments confounded interpretation of phenotypes, such as transcriptional delay after mitotic exit. An advance to address this issue was mitosis-specific TF degradation, which, in some cases, delayed TF target-gene transcription after mitosis (Festuccia et al., 2016; Kadauke et al., 2012; Liu et al., 2017) and impaired cell identity maintenance (Deluz et al., 2016; Liu et al., 2017). However, it remained possible that some of the effects could have resulted from reduced TF protein levels persisting into early G1. Thus, these data provided suggestive but incomplete evidence that mitotic chromatin-associated proteins are required for timely transcriptional activation after mitosis.
BRD4 is among the earliest described candidate bookmarking proteins (Dey et al., 2000). BRD4 is a chromatin-binding protein with multiple roles in regulating transcription that has been recently implicated as a therapeutic target in cancer (Shi and Vakoc, 2014). Immunofluorescence and chromatin immunoprecipitation (ChIP) experiments have shown that, in multiple cell types, BRD4 can bind chromatin at select locations during mitosis (Dey et al., 2000, 2003, 2009; Nishiyama et al., 2006; Yang et al., 2008; Zhao et al., 2011). Furthermore, whole cell-cycle knockdown (Dey et al., 2009; Zhao et al., 2011) and competitive inhibition (Zhao et al., 2011) of BRD4 lead to diminished RNA polymerase II (Pol II) recruitment and transcriptional activity after mitosis, suggesting that BRD4 bookmarks genes during mitosis. However, no genome-wide studies have been done to comprehensively examine the changes in BRD4 chromatin occupancy between interphase and mitosis, and no direct functional role of BRD4 in bookmarking been demonstrated.
BRD4 interacts with chromatin via its bromodomains by binding acetylated TFs and acetylated histones (Shi and Vakoc, 2014). Although at least one of its TF substrates, GATA1 (Lamonica et al., 2011), remains partially bound to mitotic chromatin in erythroid cells (Kadauke et al., 2012), it is unclear whether GATA1 and/or acetylated histones function as tethers for BRD4 during mitosis. At select locations, some histone PTMs, including H3K4me2/3 (Blobel et al., 2009; Liang et al., 2015), H3K9me3 (Hathaway et al., 2012), H4K5ac (Zhao et al., 2011), H3K27ac (Hsiung et al., 2016; Liu et al., 2017), and the histone variant H2AZ (Kelly et al., 2010), were found to be retained on mitotic chromatin. Recently, mass spectrometric and genome-wide approaches found methylation to be mostly stable in mitosis, but that acetylation marks varied widely in their maintenance on mitotic chromatin (Ginno et al., 2018; Javasky et al., 2018; Zhiteneva et al., 2017). However, for a large fraction of his-tone PTMs (Wang and Higgins, 2013), it remains unclear whether they are found on mitotic chromatin, and if so, whether they occupy the same chromatin regions as during interphase. It also remains unclear whether histone PTMs function, either independently or in collaboration with BRD4, as a bookmark of transcriptional states during mitosis.
In this study, we combined ChIP sequencing (ChIP-seq) with mitosis-specific competitive inhibition to evaluate whether BRD4 bookmarks transcription during mitosis in murine erythroid cells. We found that BRD4 mitotic binding is enriched at erythroid-specific genes and at genes that undergo rapid transcriptional activation after mitosis. Surprisingly, despite the widespread assumption that BRD4 functions as a mitotic bookmark, mitotic BRD4 binding is dispensable for transcriptional activation after mitosis. However, by combining chromatin mass spectrometry with ChIP-seq, we identified multiple histone acetylation marks retained on mitotic chromatin that are predicted to function as the primary anchors for BRD4 on mitotic chromatin and may operate as transcriptional bookmarks during mitosis. Importantly, these findings highlight that the mere association of a given factor with mitotic chromatin does not necessarily imply functional significance.
RESULTS
BRD4 Is Partially Retained on Chromatin during Mitosis
We studied BRD4 chromatin occupancy and function in the G1EER4 murine erythroid cell line. G1E-ER4 cells stably express the erythroid transcription factor GATA1 fused to the ligand-binding domain of the estrogen receptor, allowing those cells to undergo terminal differentiation upon treatment with estradiol. BRD4 is required in these cells for proliferation and for GATA1-induced differentiation and gene activation (Stonestrom et al., 2015). We performed BRD4 ChIP-seq on G1E-ER4 cells that were first induced to differentiate and, then, either grown asynchronously (98% interphase, three replicates) or arrested in mitosis and sorted to >95% purity (Campbell et al., 2014). Because nocodazole treatment can impair localization of BRD4 to mitotic chromatin in some cell types (Nishiyama et al., 2006), we used two independent treatments: nocodazole to arrest cells in prometaphase (three replicates), or ro-3306 (Vassilev et al., 2006) to arrest cells at the G2/M checkpoint, followed by a 30-minute release into mitosis (two replicates).
We called 4,679 and 936 BRD4 binding sites during interphase and mitosis, respectively, in which each peak was identified in at least two replicates for that cell-cycle phase. Of those peaks, 458 were called during both interphase and mitosis. Comparison of BRD4 binding intensities (normalized to library size and “input” chromatin) at the combined set of 5,157 peaks, through either principal component analysis (PCA) or Spearman correlation, shows clear separation between interphase and mitosis replicates regardless of whether mitotic arrest was achieved with nocodazole or ro3306 (Figures S1A and S1B), indicating that nocodazole does not impair BRD4 mitotic chromatin localization in these cells.
Initial quantitative analysis of all BRD4 peaks suggested that BRD4 occupies mitotic chromatin with a median of 20% of inter-phase-binding intensity (Figure 1A). However, library-size normalization can be quantitatively inaccurate when global protein levels might not be identical (Guertin et al., 2018; Orlando et al., 2014). Therefore, we tested absolute binding of BRD4 to interphase and mitotic chromatin by ChIP-qPCR, which has the advantage of a signal that is normalized to input chromatin. We compared those ChIP-qPCR intensities (“actual ChIP-qPCR”) with ChIP-seq-derived intensities (“virtual ChIP-qPCR”) at 17 loci suggested by ChIP-seq to have mitotic BRD4 occupancies ranging from <1% to 130% of interphase binding (Figure 1B). To compare ChIP-seq with ChIP-qPCR data, we calculated the amount of binding during mitosis relative to interphase binding for each method. Strikingly, we find that library-normalized ChIP-seq underrepresents the absolute amount of BRD4 bound at all tested loci during mitosis (Figures 1B, S1C, and S1D).
Figure 1. Genome-wide Retention of BRD4 on Mitotic Chromatin.

(A) Significant changes (DESeq2) in BRD4 binding at 5,157 peaks between interphase and mitosis. Binding intensities are scaled by library normalization. Horizontal line is an FDR of 0.1. (B) Mitotic retention of BRD4 binding at 17 interphase BRD4 peaks, measured by ChIP-qPCR versus ChIP-seq (virtual qPCR). Dotted line represents equal interphase and mitotic binding. All peaks are normalized to interphase binding intensity. (C) Schematic describing qPCR-based scaling of ChIP-seq libraries. (D and E) Mean absolute percentage deviation (D) and Pearson correlation coefficient (E) comparing measured ChIP-qPCR intensities with predicted ChIP-qPCR data at out-of-sample BRD4 peaks. Predictions were made with library-normalized ChIP-seq data (red bars) or qPCR-scaled ChIP-seq data (blue bars). (F) Volcano plot displaying significant changes (DESeq2) in BRD4 binding at 5,157 peaks between interphase and mitosis. Binding intensities were scaled by ChIP-qPCR data. Horizontal line is an FDR of 0.1. (G) Percentage of BRD4 peaks, categorized by direction of peak change during mitosis, that are TSS-proximal (−1 kb to +100 bp), intronic, intergenic, or elsewhere. *q < 0.05 by the chi-square test.
To overcome the potential global bias that results from quantification of library-scaled ChIP-seq data, we devised a procedure to use the panel of BRD4 ChIP-qPCR data to retroactively normalize BRD4 ChIP-seq data in a replicate- and cell-cycle stage-specific manner (Figure 1C). We benchmarked the accuracy and consistency of this method by randomly selecting between 2 and 10 BRD4 binding sites to scale the ChIP-seq data and then by assessing the concordance between ChIP-seq data and ChIP-qPCR measurements of five loci outside of that original set. We find that the mean absolute percent deviation (MAPD), which measures scale-independent forecast accuracy, ranges between 123% and 145% when using library-size normalization alone, whereas qPCR-based scaling predicts out-of-sample qPCR data significantly better with an MAPD between 62% and 68% trained on at least six loci (Figure 1D). Similarly, the Pearson correlation coefficient between the ChIP-seq estimates and the actual ChIP-qPCR values for out-of-sample loci falls between 0.35 and 0.37 for library-size normalization alone and between 0.60 and 0.63 when using qPCR-based scaling trained on at least six loci (Figure 1E). These data thus support the use of qPCR-based scaling in addition to library-size normalization to provide more accurate and consistent quantitation of ChIP-seq data.
By applying qPCR-based scaling to all BRD4 ChIP-seq data, we found that BRD4, in fact, occupies mitotic chromatin with a median of 54% of interphase binding intensity (Figure 1F). Using DESeq2 (Love et al., 2014) to examine significant (q < 0.1) changes in binding intensity, we found that 1,546 BRD4 peaks significantly lose BRD4 binding during mitosis, 507 peaks significantly gain binding, and 3,104 peaks show no evidence of altered binding in mitosis. Notably, BRD4 peaks that gain binding during mitosis are significantly more likely to be intergenic and less likely to be intronic or promoter-proximal, whereas peaks that lose binding during mitosis are enriched for the transcription start site (TSS) regions (Figure 1G). Together, these data reflect significant retention of BRD4 interphase binding on mitotic chromatin that would be drastically underestimated by simple peak calling or conventional library-normalized quantification of peak intensities.
During Mitosis, BRD4 Peaks Change in Both Intensity and Shape
Because BRD4 can bind acetylated TFs and histones (Shi and Vakoc, 2014), we reasoned that it would bind chromatin with a variety of peak profiles. BRD4 recruitment by acetylated TFs in nucleosome-depleted regions might account for focal peaks positioned between flanking acetylated nucleosomes (Stone-strom et al., 2015) (Figure 2A), whereas recruitment by acetylated histones might result in broader BRD4 peaks with varied shapes (Figures 2B and 2C). To comprehensively characterize BRD4 binding intensity and shape, we applied PCA to ChIP-seq intensities (input-subtracted, qPCR-scaled) extracted in 10-bp bins across the 5,157 BRD4 peaks (Figure 2D). We found that 75% of the variation in BRD4 chromatin occupancy can be explained by three principal components (PCs) that describe distinct aspects of peak intensity (PC1) or peak shape (skew: PC2, focality: PC3) (Figure 2D). Deconvoluting those peak characteristics revealed that, during interphase, BRD4 binds to sites with co-bound GATA1 in either a focal or broad manner, depending on the density of H3K27ac at the sites (Figure 2E). This is compatible with the view that BRD4 interacts with acetylated GATA1 and histones and provides a framework for detecting the likely mode of BRD4 recruitment at a given site. Moreover, in the absence of GATA1, BRD4 does not bind H3K27ac in a uniform manner but, rather, exhibits markedly more focal binding at promoter regions than at either intronic or intergenic regions (Figure 2F). These distinct shapes by which BRD4 occupies H3K27ac-modified nucleosomes might reflect tight positional constraints specific to promoter regions. Together, this PCA-based approach to dissecting BRD4 chromatin occupancy provides a useful and generalizable framework for examining heterogeneity in both peak intensity and structure.
Figure 2. Changes in BRD4 Peak Intensity and Shape during Mitosis.

(A–C) BRD4 peak calls and interphase ChIP-seq tracks for BRD4, GATA1 (Kadauke et al., 2012), and H3K27ac in G1E-ER4 cells at three example loci displaying either GATA1-predominant BRD4 chromatin association (A) or H3K27ac-predominant BRD4 chromatin association (B and C). Tracks for a given factor are scaled identically. (D) PCA on BRD4-scaled binding intensity across 5,157 peaks collected in 10-bp bins yields three PCs (total 75% of variance explained), whose eigenvectors (contributions of bin locations to each PC) are displayed in the top row. Dotted line shows mean bin-coefficient value for that PC. Bottom row shows BRD4 peak profiles (means ± 95% confidence interval [CI]) for peaks within the top or bottom 10% of peak-projection value onto the top three PCs. Heat map shows peak intensities (peak center ± 500 bp) during interphase in descending order of mean intensity in the central 200 bp. (E and F) BRD4 peak projections onto PC3 (focality) categorized by co-occupancy by GATA1 and/or H3K27ac (E). H3K27ac-bound BRD4 peaks, categorized by peak location (F). Box plot center is the median PC3 value, and hinges are 25% and 75% percentiles, *q < 0.001 by Benjamini-Hochberg (BH)-corrected Wilcoxon test. (G) K-means clustering of all BRD4 peaks based on changes in peak PC1, PC2, and PC3 between interphase and mitosis. Profiles show cluster intensity means ± 95% CI. (H) Brd4 intensity (means ± SEM) at type 1 and type 2 peaks (green) during interphase or mitosis compared with Brd4 intensity at matched control regions located 10-kb 5′ (red) or 10-kb 3′ (blue) to the peak center.
We next applied this peak analysis approach to examining changes in BRD4 chromatin occupancy between interphase and mitosis. Separate PCA of interphase and mitotic BRD4 data results in almost identical PCs (Figure S2A) and distributions of peak projections onto those PCs (Figure S2B), suggesting that BRD4 peaks have very similar defining characteristics in both phases of the cell cycle. Given that, we used the interphase-derived PCs for BRD4 binding to dissect peak characteristics (projection value onto PC) in both interphase and mitosis. K-means clustering of the changes in PC1, PC2, and PC3 projection value that BRD4 peaks undergo between interphase and mitosis uncovered that BRD4 binding during mitosis falls into two major categories.
Type 1 BRD4 peaks (86%) exhibit primarily altered BRD4 peak structure comprising a shift in peak center either in the 3′ (type 1a) or 5′ (type 1b) direction or a shift toward a more anti-focal shape (type 1c) (Figure 2G). These peaks largely maintain their binding intensity during mitosis, retaining on average 67% of their interphase intensity and displaying significantly more binding than neighboring control regions (identical peak size, 10 kb upstream or downstream) (Figure 2H). Surprisingly, peak calling by either HOMER (Figure S2C) or MACS2 (Figure S2D) detected almost all type 1 BRD4 peaks only during interphase (HOMER, 93%; MACS2, 95%), suggesting that even though mitotic chromatin binding does indeed occur, peak calling in those regions seems to be obscured by non-focal peak shapes during mitosis.
Type 2 BRD4 peaks (14%) exhibit a large increase in BRD4 intensity during mitosis (Figure 2G). Although most (61%) type 2 peaks are not called during interphase, 73% of these “mitosis-only” peaks have increased interphase binding relative to both neighboring control regions, suggesting, instead, that most type 2 BRD4 peaks are bound during both interphase and mitosis (Figure 2H). Thus, PCA-based assessment of changes in BRD4 binding during mitosis reveals two major classes of BRD4 peaks that would be otherwise obscured by traditional peak-calling approaches.
BRD4 Chromatin Occupancy Displays Features of Mitotic Bookmarking
In spite of potential changes in the mode by which BRD4 is recruited to chromatin during mitosis, the observation that BRD4 does remain associated with most of its interphase sites led us to ask whether BRD4 fulfills the defining features of a mitotic bookmark. Previous studies suggested that one function of mitotic bookmarking is to enable rapid activation in daughter cells of transcriptional programs that were previously active in the mother cell (Blobel et al., 2009; Dey et al., 2009; Kadauke et al., 2012; Zhao et al., 2011). We asked whether BRD4 binding to mitotic chromatin favors lineage-specific, in this case erythroid-specific, genes. To that end, we compared our classification of BRD4 peaks as type 1 or type 2 with expression changes of the nearest gene (maximum distance, 50 kb) during erythroid differentiation. To identify differentiation-related expression changes, we compared RNA-seq data either during differentiation of primary megakaryocyte-erythroid precursors (MEPs) to proerythroblasts (Di Tullio et al., 2011) (Figure 3A) or during GATA1-induced differentiation of the G1E-ER4 proerythroblast cell line (Jain et al., 2015) (Figure 3B). Both measures of erythroid differentiation show that type 2 peak-associated genes are more activated than either type 1 or non-BRD4-proximal genes for intragenic BRD4 peaks. Intergenic BRD4 mitotic binding, in contrast, is not associated with increased gene activation as measured by either MEP to proerythroblast differentiation (Figure S3A) or G1E-ER4 differentiation (Figure S3B), although this analysis might be limited by the challenge in associating intergenic enhancers with their target genes. These data suggest that BRD4 peaks, especially type 2 peaks, are preferentially found at erythroid-specific genes, thus linking mitotic BRD4 occupancy to lineage-specific transcriptional programs.
Figure 3. BRD4 Mitotic Chromatin Occupancy Reflects Multiple Features of a Transcriptional Bookmark.

(A and B) RNA-seq gene expression changes during (A) primary MEP differentiation to proerythroblasts or (B) GATA1-mediated differentiation of G1E-ER4 proerythroblasts. Genes are categorized by containing an intragenic type 1 or type 2 BRD4 binding peak or having no BRD4 binding. Box plot center is the median, and hinges are 25% and 75% percentile. *Wilcoxon p < 0.05, **Wilcoxon p < 1e−6. (C) Interphase and mitotic RNA Pol II rpkm intensities (Hsiung et al., 2016) at the TSS regions of genes associated with type 1 BRD4 peaks, type 2 BRD4 peaks, or genes with no proximal BRD4 binding. Transcription start site (TSS) regions are 2.5-kb long, centered on gene TSS, means ± SEM. (D and E) ChIP-seq tracks at the Nfe2l1 (D) and Cdk12 (E) genes for BRD4 and Pol II during interphase, arrested during mitosis, or released at 1.5 h or 6 h after mitotic arrest. (F) Mitotic-pausing index, normalized to interphase-pausing index. Genes are categorized by the type of proximal BRD4 binding. Left shows pausing index calculated by TSS rpkm, divided by gene body (GB) rpkm; right shows pausing index calculated by TSS rpkm, divided by transcription termination site (TTS) rpkm. Box plot center is the median-pausing index, and hinges are 25% and 75% percentiles. (G) Pol II rpkm levels after mitosis at type 1 versus type 2 genes (based on proximal BRD4 binding) at either the TSS, GB, or TTS. Genes subsampled to match asynchronous Pol II binding intensity between groups. *q < 0.001 by chi-square test. For (F) and (G), TSS/TTS regions are 2.5-kb long, centered on gene TSS/TTS, and the gene body is between those regions.
To test whether BRD4 mitotic occupancy correlates with rapid transcriptional activation after mitosis, we examined RNA Polymerase II binding during and after mitosis (Hsiung et al., 2016) at different classes of BRD4-bound genes. Surprisingly, although Pol II is evicted from most TSS regions during mitosis (Hsiung et al., 2016), genes containing type 2 BRD4 peaks retain Pol II at their TSS during mitosis (Figure 3C). Notably, those genes have significantly higher rates of TSS-proximal Pol II pausing during mitosis than they do during interphase (Figures 3D and 3F). Although Pol II binding to mitotic chromatin is generally too weak for ChIP-qPCR detection, we were able to use Pol II ChIP-qPCR during interphase and mitosis to confirm TSS-proximal Pol II retention at the type 2 genes Cdk12, Nfe2l1, and Atp5b, as well as increased promoter-proximal pausing during mitosis at Atp5b (Figure S3C). This suggests that these genes are not actively transcribing during mitosis (Liang et al., 2015;Palozola et al., 2017) but may, instead, be primed for rapid activation once mitosis is complete.
Next, we asked whether BRD4 occupancy during mitosis associates with faster transcriptional activation after mitosis. To ensure a fair comparison among genes containing a type 1 peak, a type 2 peak, or no BRD4, we randomly sub-sampled those groups to select genes matched in asynchronous Pol II density. In doing so, we found that type 2 peak-associated genes recruit Pol II after mitosis to their TSS, gene body, and transcription termination site (TTS) significantly faster than do type 1 peak-associated genes (Figure 3G). Type 2 peak-associated genes also exhibit more transcriptional spiking (Hsiung et al., 2016) (Figures 3G and S3D) than do type 1 genes, indicating that these genes are primed for early activation immediately after mitosis. In sum, BRD4 mitotic binding is associated with multiple features suggestive of mitotic bookmarking in erythroid cells.
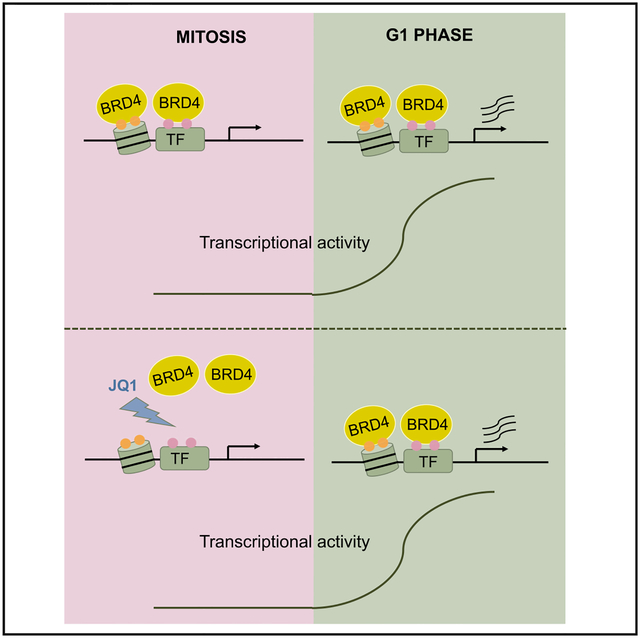
Transient Competitive Inhibition during Mitosis Suggests that BRD4 Is Not Required for Mitotic Bookmarking
Although BRD4 occupies chromatin during mitosis in a pattern suggestive of mitotic bookmarking, it was possible that BRD4 remains passively bound to mitotic chromatin, especially at genes that are bookmarked by alternative mechanisms, without having a functional bookmarking role itself. Previous studies testing this question used either small interfering RNA (siRNA)-(Zhao et al., 2011) or small hairpin RNA (shRNA)- (Dey et al., 2009) based knockdown or treatment with the BET protein competitive inhibitor JQ1 (Zhao et al., 2011) applied beyond just the mitotic phase of the cell cycle. However, such approaches did not definitively test whether BRD4 chromatin occupancy specifically during mitosis is required for post-mitotic gene activation because BRD4 is required for widespread gene activation during interphase (Shi and Vakoc, 2014; Wang and Filippakopoulos, 2015). Given that JQ1 has been shown to inhibit BRD4 rapidly (Delmore et al., 2011) and reversibly (Brown et al., 2018; Kurimchak et al., 2016), we hypothesized that transient JQ1 treatment during mitosis would remove BRD4 from mitotic chromatin without perturbing the availability of BRD4 for transcription after mitosis. We treated cells arrested in mitosis with a 1-h pulse of 250 nM JQ1, followed by immediate cell fixation and BRD4 ChIP-seq. Traditional peak calling identified just 96 BRD4 peaks after transient mitotic JQ1 treatment, of which only 28 overlapped with our consensus set of 5,157 BRD4 peaks. Moreover, transient JQ1 treatment resulted in a dramatic loss of BRD4 binding intensity during mitosis at both types 1 and 2 BRD4 peaks (Figure 4A).
Figure 4. BRD4 Does Not Operate as a Mitotic Bookmark in Erythroid Cells.

(A) Binding intensity at BRD4 peaks, categorized by type 1 versus type 2, during interphase, mitosis, or mitosis treated with 1-h 250 nM JQ1. Means ± 95% CI. (B) Schematic describing how mitotic bookmarking function was tested with rapid competitive inhibition to remove BRD4 from chromatin only during mitosis. (C) Comparison of qRT-PCR quantities for 16 primary transcripts after treatment with 10 μM JQ1 or DMSO during mitosis. Dotted black line is equality; dotted red lines show 2-fold change. Data are normalized to glyceraldehyde 3-phosphate dehydrogenase (GAPDH)-mature transcript and to mean quantity across all time points. (D) Pol II ChIP-qPCR after 1 h of 250-nM JQ1 versus DMSO treatment shows minimal changes in binding. Means ± SEM, n = 3. (E) Pol II TSS rpkm at 385 type-2-associated genes in mitotic cells treated with 250 nM JQ1 versus DMSO. (Left) Mean ± SEM. (Right) Scatterplot of log2 (rpkm). Line is equality, and contours are 2D kernel-density estimations.
To test the requirement of mitotic BRD4 in promoting rapid transcriptional activation after mitosis, we transiently inhibited BRD4 chromatin occupancy in nocodazole-arrested mitotic cells using a 1-h treatment with JQ1. Next, we washed out both nocodazole and JQ1, released cells into G1 for varying durations, and measured nascent transcript production by primary transcript qRT-PCR. We performed these experiments in the context of GATA1-mediated differentiation and studied the activation of 16 key erythroid genes to determine whether red cell maturation requires BRD4 as a mitotic bookmark. In asynchronous cells, these genes are occupied by BRD4, and their expression is sensitive to JQ1 treatment (Stonestrom et al., 2015), raising the possibility that BET proteins might functionally bookmark them during mitosis. All cells were induced to differentiate for a total of 13 h so that differentiation status would not confound transcriptional output (Figure 4B). Surprisingly, although 250 nM JQ1 removes mitotic BRD4 occupancy from promoters of the 16 tested genes (Figure S4A), treatment with even as much as 1 μmM JQ1 (Figure S4B) or 10 μmM JQ1 (Figure 4C) during mitosis did not affect nascent transcription after mitosis for any of these genes. This suggests that, although BRD4 chromatin occupancy during mitosis displays multiple features of mitotic bookmarking, BRD4 is not required for mitotic bookmarking in erythroid cells. Moreover, because JQ1 also targets BRD2 and BRD3 with comparable efficiency (Dawson et al., 2011; Filippakopoulos et al., 2010; Nicodeme et al., 2010) and because both BRD2 and BRD3 are found on mitotic chromatin (Kanno et al., 2004; Shao et al., 2016), it is likely that each of these BET proteins exhibits “passenger”-like binding to mitotic chromatin, rather than functioning as mitotic bookmarks of transcription in these cells.
Given the strong correlation of Pol II TSS mitotic retention with type 2 BRD4 peaks, we hypothesized that removal of BRD4 from mitotic chromatin would affect the presence of Pol II in those TSS regions. However, treatment during mitosis with 1 h of 250 nM of JQ1 did not alter Pol II mitotic occupancy by either ChIP-qPCR (Figure 4D) or ChIP-seq (Figure 4E) at type 2 peak-associated genes. This indicates that Pol II TSS occupancy during mitosis does not require BRD4 chromatin occupancy and may serve as an independent measure related to mitotic bookmarking (Palozola et al., 2017).
Histone Acetylation Is Broadly Retained on Mitotic Chromatin
Although there was no support for a direct bookmarking function for BRD4 in these cells, we suspected that its occupancy on mitotic chromatin might be mediated through a different chromatin factor that does bookmark transcription across mitosis. BRD4 can bind multiple histone acetylation marks in vitro and in vivo, and its retention on mitotic chromatin may also involve histone acetylation (Dey et al., 2009; Kruhlak et al., 2001; Zhao et al., 2011). Recent work examined select histone marks for their presence on mitotic chromatin (Javasky et al., 2018; Liu et al., 2017; Zhiteneva et al., 2017), yet for most of them, including most acetylation marks, it remained unclear whether they are found on mitotic chromatin and function as mitotic bookmarks.
To characterize changes in the histone PTM landscape across the cell cycle, we performed quantitative liquid chromatography coupled with tandem mass spectrometry (LC-MS/MS) on purified histones from either asynchronous or mitotic undifferentiated G1E-ER4 cells. MS is the gold standard for accurate quantification of protein PTMs because antibody-based methods have potential biases related to epitope occlusion caused by nearby PTMs and the impracticality of analyzing co-existing PTMs. We identified 53 distinct histone PTMs and quantified changes in their relative abundance between interphase and mitosis. As expected, we found a large increase in the abundance of multiple mitosis-specific histone phospho-PTMs (Wang and Higgins, 2013). Surprisingly, most histone marks undergo less than a 2-fold change in global abundance between interphase and mitosis (Figures 5A, 5B, and S5A; Table S1).
Figure 5. Histone Methylation and Acetylation Are Broadly Preserved on Mitotic Chromatin.

(A) Changes in abundance of histone PTM categories between interphase and mitosis. (B) Changes in individual histone PTM abundance between interphase and mitosis. (C) Changes in abundance of particular BRD4-binding histone PTMs between interphase and mitosis. (D) Quantitative western blots of BRD4, GAPDH, and multiple histone PTMs during interphase, mitosis, or mitosis after 1 h of 250-nM JQ1 treatment. Non-JQ1 conditions were treated with 1 h of 250-nM DMSO. Results were normalized to within-lane background, GAPDH, and the interphase condition. Conditions with error bars represent n = 2 experiments, means ± SEM; other conditions are n = 1. (E) Changes in abundance of particular histone di-PTM combinations between interphase and mitosis. For (A)–(C) and (E), PTM abundance was normalized to peptide abundance.
Notably, multiple histone acetylation PTMs that co-localize or directly interact with BRD4 (Dey et al., 2003; Filippakopoulos et al., 2012; Stonestrom et al., 2015) are found on mitotic chromatin with either a reduced (H3K27ac), stable (H3K14ac, H3K18ac, H4K5ac, H4K8ac, H4K12ac, and H4K16ac), or increased (H3K122ac) global abundance when compared with interphase chromatin (Figures 5B and 5C). Quantitative western blot of whole-cell lysates from asynchronous and mitotic G1EER4 cells differentiated for 13 h showed histone PTM dynamics similar to those identified by mass spectrometry (Figure 5D). Moreover, di-acetyl H3 and H4 PTM combinations, which have been shown to be preferred substrates over mono-acetylated histones (Dey et al., 2003), are either unchanged or elevated during mitosis (Figure 5E).
It is possible that binding of BRD4 and/or other BET proteins to mitotic chromatin promotes mitotic histone acetylation, either by directly functioning as a histone acetyltransferase (Devaiah et al., 2016) or by protecting acetyl marks from deacetylases. To determine whether the removal of BET proteins from mitotic chromatin de-stabilizes those marks, we performed quantitative western blots for relevant acetyl marks with extracts from mitotic cells exposed to 250 nM JQ1. This treatment had no effect on the abundance of those marks, suggesting that BET proteins are not required for their maintenance or to shield them from removal (Figure 5D; see below). In summary, we find that most histone acetylation and methylation is retained on mitotic chromatin.
Histone Acetylation Undergoes Changes during Mitosis that Reflect Multiple Features of Bookmarking
Because MS and western blots cannot assess potential changes in the genomic distributions of histone modifications during mitosis, we performed ChIP-seq on either interphase or mitotic differentiating G1E-ER4 cells for total H3, for the mitosis-specific PTM H3S10ph, for four histone acetylation PTMs (H3K14ac, H3K27ac, H3K122ac, and H4K16ac), and for the histone variant H2AZ, which undergoes occupancy changes during mitosis (Kelly et al., 2010). These four acetyl PTMs and H2AZ are associated with active transcription (Calo and Wysocka, 2013; Pradeepa et al., 2016), serve as potential anchors for BET proteins (Devaiah et al., 2016; Dey et al., 2003), and can be assessed by highly specific ChIP-grade antibodies (Rothbart et al., 2015). Unfortunately, we could not find commercial ChIP-grade antibodies (Rothbart et al., 2015) specific for H4K5ac (without additional reactivity with separate acetyl marks on histone H4), which was previously suggested to function in mitotic bookmarking (Zhao et al., 2011).
We applied ChIP-qPCR-based scaling, described above, to identify absolute changes in mark abundance at each mark’s respective peaks (Figures 6A and S6A). Strikingly, global changes in the abundance of these histone acetyl marks are highly concordant, when measured by MS versus ChIP-seq, only when the ChIP-seq data are qPCR-scaled (unscaled Pearson, −0.76; qPCR-scaled Pearson, 0.75) (Figure S6B).
Figure 6. Multiple Histone Marks Are Retained on Mitotic Chromatin with Features Characteristic of Mitotic Bookmarking.

(A) Volcano plot displaying significant changes (DESeq2) in histone PTM signal between interphase and mitosis at each PTM’s respective peaks; binding intensities are scaled by ChIP-qPCR data. The horizontal line is an FDR of 0.1. (B) Fraction of peaks for each PTM that were unchanged during mitosis (<2-fold signal change compared with interphase, or a q value > 0.1), gained during mitosis (>2-fold increase, and a q value < 0.1), or lost during mitosis (>2-fold decrease, and a q value < 0.1). (C) RNA-seq gene expression changes during G1E-ER4 differentiation for genes that had unchanged TSS-proximal occupancy of a given PTM versus genes that gained TSS-proximal occupancy for that mark. Box plot center is median expression change, and hinges are 25% and 75% percentiles. *p < 0.05 by Wilcoxon test. (D) Pol II TSS, gene body, or TTS occupancy (rpkm) (Hsiung et al., 2016) after mitosis at genes that gain or lose TSS-proximal occupancy of a histone PTM during mitosis. Genes subsampled to match asynchronous Pol II-binding intensity among groups. TSS/TTS regions are 2.5 kb long, centered on gene TSS/TTS, with the gene body between those regions. *q < 0.05, **q < 0.001 by chi-square test.
Comparing these two methods did not yield a perfect correlation, such as for H3K14ac (MS, 17% mitotic loss; ChIP-seq, 51% loss), perhaps because MS measures global chromatin abundance, whereas ChIP-seq examines intensity changes only at called peak regions. Additionally, it is worth noting that the MS and ChIP-seq experiments were performed in different states of G1E-ER4 differentiation, suggesting that changes in histone mark abundance between interphase and mitosis are mostly robust to differentiation state (Wu et al., 2011). Of note, the substantial increase in H3K122ac and decrease in H3K27ac during mitosis that we observe by MS and by ChIP-qPCR at several loci are only reproduced by ChIP-seq data that are qPCR-scaled, further emphasizing the value of this scaling method for interpreting absolute changes in histone mark abundance.
We applied a threshold of a 2-fold change in peak rpkm (reads per kilobase per million) and a DESeq2 false-discovery rate (FDR) threshold of 0.1 to define peaks as either unchanged, increased in mitosis, or decreased in mitosis (Figure 6B). In total, H3 density changed minimally, and H3S10ph was highly skewed toward increased signal during mitosis, as expected. Additionally, among peaks that changed during mitosis, we found that H2AZ and H3K122ac peaks were mostly increased during mitosis, that H3K14ac and H3K27ac primarily exhibited reduced intensity during mitosis, and that H4K16ac peaks underwent extensive changes in both directions. The maintenance or increase in histone mark intensity during mitosis may serve multiple functions, including one as a bookmark of erythroid lineagespecific genes.
We thus sought to identify whether changes in histone PTM intensity during mitosis might indicate a role in mitotic bookmarking of the erythroid lineage. First, we asked whether histone PTM occupancy during mitosis was particularly enriched at erythroidspecific genes. To that end, at genes with a TSS-proximal peak for H2AZ or a histone acetylation PTM, we compared changes in PTM intensity during mitosis with changes in gene expression during G1E-ER4 proerythroblast differentiation (Jain et al., 2015). Indeed, we found that genes with increased H2AZ, H3K122ac, and H4K16ac signal intensity during mitosis were significantly more specific for erythroid differentiation than were genes with unchanged occupancy of those PTMs (Figure 6C).
We next asked whether histone marks on mitotic chromatin correlated with faster transcriptional activation after mitosis. As a proxy for transcription activation kinetics, we examined the recruitment of RNA polymerase II to TSS, gene body, and TTS regions after near-complete eviction of Pol II from chromatin during mitosis (Hsiung et al., 2016). Because H2AZ, H3K14ac, H3K27ac, H3K122ac, and H4K16ac each associates with active gene transcription, we grouped together, for this analysis, all genes with increased TSS-proximal intensity of any of these marks during mitosis and grouped separately all genes with a decrease in any of these marks during mitosis. Strikingly, despite using subsampling to match asynchronous Pol II intensities across groups, we found that genes with increased intensity of any of these marks during mitosis maintained more TSS-proximal Pol II during mitosis than did genes with decreased PTM intensity (Figure 6D). Genes with increased histone PTM occupancy during mitosis also display faster recruitment kinetics of Pol II to both the TSS, gene body, and TTS regions immediately after mitosis (Figure 6D), suggesting that these genes are primed for early activation. In total, these data suggest that histone marks undergo significant alterations during mitosis and that these histone marks are prime candidates for mediating mitotic bookmarking.
Histone Acetylation Is the Primary Substrate for BRD4 Mitotic Chromatin Occupancy
The continuous retention of BRD4 on mitotic chromatin is dispensable for gene expression in early G1. Hence, BRD4 likely does not function as a mitotic bookmark in erythroid cells but might simply be a passive “passenger” on mitotic chromatin. The actual mitotically stable memory function might instead be rooted in acetylated chromatin. Directly testing this idea is challenging because of a lack of available tools for perturbing histone modifications specifically during mitosis. Therefore, we turned to a predictive modeling approach to identify determinants of BRD4 chromatin occupancy at the set of 5,157 BRD4 binding sites (Figure 2B). At those locations, we first extracted inter- phase or mitotic 10-bp-binned intensities for GATA1, total H3, H2AZ, and multiple histone acetyl PTMs (Figure 7A). For each potential BRD4 binding partner, we used those extracted intensities to construct a sparse generalized linear model with 10× cross-validation and then evaluated model performance based on the ability to predict BRD4 peak intensity (PC1) or shape (PC2/PC3) characteristics during either interphase or mitosis. In total, we expected this modeling approach to incorporate any aspect of GATA1 binding or histone PTM occupancy that might predict BRD4 binding and, further, to quantify the relative contributions of those potential substrates to the BRD4 chromatin landscape.
Figure 7. Histone Acetylation Predicts BRD4 Occupancy on Mitotic Chromatin.

(A) Pipeline for testing the ability of chromatin features to predict BRD4 chromatin occupancy. (B) Pearson correlation coefficient (PCC) between the predictions of BRD4 peak PC1 (intensity) projections and actual BRD4 peak PC1 projections during interphase. Prediction inputs (interphase data only) on the x-axis. Means ± SEM (C) PCC between the predictions of BRD4 peak shape features (PC2 and PC3 projections) and actual BRD4 peak shape features during interphase. Prediction inputs (interphase data only) are GATA1 versus H3K27ac. Means ± SEM, *p < 1e−4. (Left) All BRD4 peaks. (Right) Only peaks co-bound by all of BRD4/GATA1/H3K27ac. (D) PCC between the predictions and of BRD4 peak PC1 (intensity) projections and actual BRD4 peak PC1 projections during mitosis. Prediction inputs (mitosis data only) on the x axis. Means ± SEM. (Left) All BRD4 peaks. (Right) Only type 2 BRD4 peaks. (E) Receiver operating characteristic (ROC) curves for the classification of BRD4 peaks as type 1 versus type 2. Prediction inputs colored in legend, and the curves are means of independent runs.
Because BRD4 binds both acetylated GATA1 and histones (Shi and Vakoc, 2014), we benchmarked that predictive modeling approach by testing whether interphase intensity of either GATA1 or histone acetylation independently predicted BRD4 interphase chromatin occupancy. Indeed, GATA1 and the four tested histone acetylation marks (H3K14ac, H3K27ac, H3K122ac, and H4K16ac) were each individually predictive of BRD4 binding intensity (PC1) (Figure 7B). Notably, the combination of all four histone PTMs (H3K14ac, H3K27ac, H3K122ac, and H4K16ac) outperformed any of those marks individually. Strikingly, we found that BRD4 peak shape features during inter-phase were much better predicted by GATA1 binding than they were by H3K27ac (Figure 7C). That finding persisted even when considering the 2,164 BRD4 peaks at which both GATA1 and H3K27ac are present (Figure 7C), suggesting that GATA1 or its neighboring TFs are more likely than histone acetylation to tether BRD4 to interphase chromatin when both are available. This further illustrates how consideration of peak shape, in addition to peak intensity, allows for mechanistic inferences related to chromatin occupancy of histone reader molecules.
We next examined the role of GATA1 and histone acetylation during mitosis in predicting mitotic BRD4 occupancy. Although GATA1 binds mitotic chromatin at a small fraction of its inter-phase binding sites (Kadauke et al., 2012), multiple histone acetylation marks are retained at a much greater fraction of sites during mitosis (Figure 6A). We thus expected that histone acetylation might become the dominant chromatin tether for BRD4 during mitosis. Indeed, GATA1 is substantially worse at predicting BRD4 binding intensity during mitosis than it is during inter-phase (Figure 7D). Conversely, during mitosis, H3K14ac, H3K27ac, H3K122ac, and H4K16ac are strong predictors of BRD4 chromatin occupancy. Additionally, GATA1 performs worse than even total H3 at classifying BRD4 peaks as type 1 versus type 2 (Figures 7E and S7A). However, H3K14ac, H3K122ac, and H4K16ac are strong classifiers of BRD4 binding type, suggesting that these marks drive the large increase in BRD4 occupancy seen at type 2 peaks during mitosis. Together, these data suggest that, during mitosis, there is a diminished, if not absent, role for GATA1 in the recruitment of BRD4 and that histone acetylation serves as the primary partner for BRD4 binding.
DISCUSSION
Here, we provide a comprehensive assessment of occupancy landscapes in mitosis and interphase of BRD4 and of histone modifications. Even though BRD4’s partitioning on mitotic chromatin is consistent with bookmarking, mitosis-specific eviction of BRD4 from chromatin has no measurable effect on gene expression, suggesting that BRD4 is likely a mitotic passenger protein but not an active bookmark. Predictive modeling suggests instead that mitotically stable histone acetylation serves as an underlying bookmark that affects gene activation kinetics and Pol II recruitment after mitosis.
In prior studies, the evidence that BRD4 remains associated with its transcriptional targets during mitosis was based on either colocalization with mitotic chromosomes by immunofluorescence microscopy (Dey et al., 2000, 2003, 2009; Nishiyama et al., 2006; Yang et al., 2008; Zhao et al., 2011) or ChIP-qPCR at a limited number of locations (Dey et al., 2009). By comparing BRD4 genome-wide binding profiles in asynchronously growing and mitotically synchronized erythroid G1E-ER4 cells, we found that overall median BRD4 occupancy is reduced by ~50% during mitosis but that occupancy is increased at hundreds of locations during mitosis.
To aid in absolute quantification of the ChIP-seq experiments, we employed a scaling method that allows reliable comparison among data sets derived from cells in different phases of the cell cycle. Accurate normalization has been a long-standing challenge in the comparison of ChIP-seq data from distinct cellular states, given that chromatin-associated proteins cannot be assumed to be constant in their overall protein levels or sub-cellular localization (Kadauke et al., 2012). Recently, methods have been developed to spike in chromatin from a different species (Bonhoure et al., 2014; Orlando et al., 2014). Another approach involves conducting a parallel ChIP of a control protein that does not change between conditions (Guertin et al., 2018). Although each of these approaches successfully controls a different source of variability within the ChIP procedure, they can be a source of variability themselves. As a result, although spike-ins for ChIP are an important normalization methodology, the most common practice for the analysis of genome-wide ChIP-seq data has been conventional, library-size normalization, which does not normalize absolute signals across data sets.
To address the need for experimental ChIP-seq normalization that does not rely on external controls, we used the gold standard for ChIP quantitation, ChIP-qPCR normalized to input chromatin, directly to linearly scale entire ChIP-seq data sets (Figure 1). This method outperforms normalization based only on library size when using as few as six qPCR loci. Moreover, for multiple histone modifications, the scaling factors derived from ChIP-qPCR signals were independently validated by MS. Importantly, this method does not require the ChIP-seq and ChIP-qPCR samples to be identical, making it possible to retroactively normalize ChIP-seq data that were generated without an added spike-in, as is the case for most existing public data. One potential caveat of this method is that it employs constant scaling across the entire range of ChIP-seq binding intensities. Because ChIP-qPCR typically has a narrower dynamic range than ChIP-seq, especially for weakly binding antibodies, it remains an open, but important, question whether linear scaling is the most accurate approach at weakly bound sites that are not measurable by ChIP-qPCR.
Most prior studies describing changes in TF occupancy between interphase and mitosis focused only on intensity changes or simply on differences in peak calling. However, because both chromatin accessibility (Hsiung et al., 2015) and nucleosome occupancy (Kelly et al., 2010) are subject to change between interphase and mitosis, it cannot be assumed that chromatin-associated proteins bind interphase and mitotic chromatin in the same way. From visual inspection of ChIP-seq browser tracks, it became apparent that sites enriched for BRD4 were not only dynamic in intensity but also in shape. To comprehensively define changes in both peak intensity and shape, we developed a PCA-based approach that identified the defining features of peaks as intensity (PC1), skew (PC2), and focality (PC3). This revealed that, during mitosis, BRD4 peaks tend to either become less focal with a minor loss in binding intensity (type 1) or to undergo focal gains in intensity (type 2). These patterns suggest that BRD4 may adopt both diffuse and focal modes of association with acetylated histones during mitosis; both of which require BRD4’s bromodomains. Notably, type 1 BRD4 binding during mitosis would have remained largely undetected by traditional peak calling because of the changes in peak shape, suggesting that these methods might be especially helpful for detecting binding of factors that associate with chromatin with varied peak shapes.
To test whether mitotic retention of BRD4 is of functional significance, we used JQ1 to transiently remove BRD4 (as well as BRD2 and BRD3), from mitotic chromatin without affecting overall protein levels. Surprisingly, transcriptional activation kinetics of all tested genes were unperturbed even though these genes are JQ1-sensitive during interphase, indicating that the continued retention of BET proteins on chromatin throughout mitosis is dispensable for gene activation. This calls into question the widely held notion of BRD4 as a bookmarking protein. We cannot, however, rule out a bookmarking function of BRD4 or of other BET proteins at different genes or in different cell types. In addition, it remains possible that mitotically retained BRD4 serves an unknown function during mitosis, distinct from bookmarking. The lack of measurable consequences when transiently displacing BRD4 from mitotic chromatin suggests that BRD4 can rapidly re-associate with its correct targets upon entering G1. The lack of a genuine bookmarking function might extend to any transcription factor with rapid on and off rates in mitotic chromatin. “Memory” function might instead be coded by features such as chromatin accessibility or histone modifications that are preserved during mitosis at transcription factor binding sites. Testing those models will require transient, mitosis-restricted, and site-specific perturbations of mitotic chromatin-associated factors.
Although chromatin undergoes large-scale architectural changes during mitosis (Gibcus et al., 2018; Naumova et al., 2013), several features of interphase chromatin remain, including the retention of transcription factors and chromatin accessibility. To this point, however, it has been largely unclear how much of the rich diversity in histone marks that exist on interphase chromatin is maintained during mitosis. Mass spectrometry and ChIP-seq showed that many histone methylation and acetylation marks are maintained during mitosis at global levels similar to those in interphase. Although some acetyltransferases and deacetylases have been found to disassociate from chromatin (He et al., 2013; Kruhlak et al., 2001; Valls et al., 2005) during mitosis, it remains unclear to what extent that applies to other histone-modifying enzymes and to what extent mitotic histone modifications are being actively regulated. Notably, the dynamics of several histone marks are consistent with features of mitotic bookmarks, including TSS-proximal enrichment at lineage-specific genes and at genes with fast activation kinetics after mitosis. Albeit correlative, these data suggest that histone marks are prime candidates for functioning as mitotic bookmarks.
Because BRD4 has multiple binding partners, including acetylated GATA1 and multiple acetyl histone marks, it was not immediately obvious how BRD4 might bind to chromatin during mitosis. A simple approach, such as intersecting binding peaks, has limited value in answering this question because GATA1 and acetylated histones can co-occupy the same regulatory regions. We employed a predictive modeling approach that considers the complex changes in peak intensity and shape occurring for BRD4 ligands and then compares, in an unbiased way, those changes to the changes in BRD4 occupancy. In doing so, we found that GATA1 binding predicts BRD4 occupancy during interphase but not during mitosis. In contrast, during mitosis, BRD4 primarily localizes with H3K14ac, H3K27ac, H3K122ac, and H4K16ac. Notably, during both interphase and mitosis, a panel consisting of those four acetyl marks outperforms each individual mark in predicting BRD4 occupancy, suggesting that those marks might act as overlapping tethers for BRD4. Alternatively, BRD4 might bind chromatin with higher affinity when interacting with multiple acetyl marks simultaneously, as has been previously observed (Dey et al., 2003). Although we did observe retention of multiple di-acetylated histone peptides during mitosis through bottom-up MS, our ability to identify di-acetylated peptides was limited by typically short peptide lengths after trypsin digestion. Future studies might employ a middle-down proteomics (Sidoli et al., 2017) approach that would allow for the analysis of intact histone N-terminal tails (50–60 aa), thus offering further insight into whether poly-acetylated histones are available on mitotic chromatin to recruit BRD4 binding in a combinatorial fashion.
In sum, our studies, aided by novel experimental and analytical approaches, have shown that, despite its widespread retention on mitotic chromatin, BRD4 does not measurably function as a mitotic bookmark of transcription in erythroid cells. Rather, we found evidence for a rich landscape of mitotically stable histone marks; some of which are predicted to instruct transcriptional activation during mitotic exit.
STAR★METHODS
CONTACT FOR REAGENT AND RESOURCE SHARING
Further information and requests for resources and reagents should be directed to and will be fulfilled by the Lead Contact, Gerd A. Blobel (blobel@email.chop.edu).
Experimental Model and Subject Details
G1E-ER4 cells are derived from a sub-clone of G1E cells, which were directly produced from GATA1 −/− male murine embryonic cells (Weiss et al., 1997). G1E-ER4 cells contain a retrovirally-introduced GATA1 fused to the ligand binding domain of the estrogen receptor (GATA1-ER) (Weiss et al., 1997). GATA1 activation and concomitant erythroid differentiation is induced by the addition of 100 nM estradiol to cell culture media for 13 hours. G1E-ER4 cells were grown in IMDM containing 15% FBS, penicillin/streptomycin, Kit ligand, monothioglycerol, and epoetin alpha at 37C with 5% CO2 in a standard tissue culture incubator.
METHOD DETAILS
Isolation of mitotic G1E-ER4 cells
Culture of G1E-ER4 cells was performed as previously described (Weiss et al., 1997). G1E-ER4 cells were induced by addition of 100 nM estradiol for 13 hours total. At 5 hours post-induction, cells were arrested in pro-metaphase by addition of either 10 uM ro3306 (2 replicates of BRD4 ChIP-seq) or 200 ng/ml nocodazole (3 replicates of BRD4 ChIP-seq, 2 replicates for all other targets). Nocodazole-treated populations were fixed with 1% room temperature formaldehyde for 10 minutes at 13 hours post-induction. Treatment with the CDK1 inhibitor ro3306 (Vassilev et al., 2006) arrested cells at the late G2/mitosis checkpoint, and so at 13 hours post-induction, ro3306 was washed out and cells were grown in media for 30 minutes at 37 degrees before formaldehyde fixation so that mitotic cells could be collected. Following fixation, cells were permeabilized, stained with anti-MPM2 antibody (Campbell et al., 2014), and FACS sorted for MPM2+ cells. Interphase cells (3 replicates) were collected by similar treatment with 13 hours of 100 nM estradiol, followed by fixation, MPM2 staining, and FACS sorting for live singlets.
Chromatin Immunoprecipitation (ChIP) qPCR and sequencing
ChIP was performed as previously described (Letting et al., 2004). qPCR primers are listed in Table S2, antibodies are as follows: Brd4 (Bethyl A301–985A), H2AZ (Abcam Ab4174), total H3 (Abcam ab1791), H3S10ph (Abcam ab5176), H3K14ac (Millipore 07–353), H3K27ac (Active Motif 39685), H3K122ac (Abcam ab33309), H4K16ac (Millipore 07–370), and RNA Polymerase II (Cell Signaling 14958). ChIP-seq samples were prepared by end repair, 3′ adenylation, and adaptor ligation using Illumina’s ChIP-seq Sample Preparation Kit. SPRIselect (Beckman Coulter) beads were used obtain an average library target size of 338 bp (range 302–436 bp), followed by real-time qPCR quantification using the KAPA Library Quant Kit for Illumina (KAPA Biosystems catalog no. KK4835). Single-end sequencing (1×50bp or 1×75 bp) was performed on the Illumina NextSeq 500 in high-output mode using Illumina sequencing reagents according to Illumina instructions, and bclfastq2 v 2.15.04 (default parameters) was used for conversion of reads to fastq. Fastq reads were aligned to the mm9 genome using bowtie 2 (parameters:–end-to-end–very-sensitive) (Langmead and Salzberg, 2012).
RT-qPCR of primary transcripts
We prepared RNA using TRIzol™ (ThermFisher Scientific, Cat # 15596018) and purified using the RNeasy Mini kit with on-column DNase treatment (QIAGEN, Cat # 74106). Reverse transcriptase reactions were performed using iScript (Bio-Rad, Cat #1708841) and qPCR reactions were prepared with Power SYBR Green (ThermoFisher Scientific). All primers flank intron exon-junctions, and primer sets are listed in Table S2. Primary transcript quantities are first normalized to Pabpc1 mature mRNA, similar results were obtained when normalizing to Gapdh mature mRNA (data not shown). Following this, transcript levels at each time point were additionally normalized to the mean transcript quantity across all time points, so that the activation kinetics for different primary transcripts could be compared.
Extraction and purification of histones from intact whole cells
We adapted previously described methods for isolation of histones for MS from purified nuclei (Sidoli et al., 2016) so that we could purify histones from mitotic cells that lack an intact nuclear envelope. We first prepared RIPA lysis buffer with the following inhibitors (final concentrations listed): protease inhibitors (1:250, Sigma, P8340), Sodium Fluoride (5 mM), Sodium Orthovanadate (1 mM), EDTA (5 mM), DTT (1 mM), and Sodium Butyrate (10 mM). Cells were placed on ice, washed three times in cold PBS, and then rotated in the prepared RIPA buffer for 30 minutes at 4C. We then sonicated this material (Qsonica Q800R3) at 4C using 10 s on/10 s off for 2 minutes at 100% amplitude, after which we proceeded with sulfuric acid extraction of histones and subsequent preparatory steps for HPLC-MS/MS as previously described (Sidoli et al., 2016). Briefly, purified histones were dissolved in 30 μL of 50 mM NH4HCO3, pH 8.0. Propionic anhydride was mixed with isopropanol in a ratio of 1:3 (v/v) to prepare a derivatization reagent, which was then mixed with the histone sample in the ratio of 1:4 (v/v) for 20 minutes at room temperature. The reaction was performed twice. Histones were then digested with trypsin (enzyme:sample ratio 1:20 at room temperature overnight) in the same buffer (pH 8.0). After digestion, the derivatization reaction was performed again twice to derivatize peptide N-termini. Samples were desalted by using C18 Stage-tips.
Mass spectrometry analysis and data availability
The histone peptides were analyzed using a nanoLC-MS/MS setup. Briefly, the nanoLC (EASY-nLC, Thermo Scientific, San Jose, CA, USA) was equipped with a 75 μm ID × 25 cm Reprosil-Pur C18-AQ (3 μm; Dr. Maisch GmbH, Germany) in-house packed column, and coupled online with an Orbitrap Elite mass spectrometer (Thermo). The HPLC gradient was as follows: 2% to 28% solvent B (A = 0.1% formic acid; B = 95% MeCN, 0.1% formic acid) over 45 minutes, from 28% to 80% solvent B in 5 minutes, 80% B for 10 minutes at a flow-rate of 300 nL/min. Data were acquired by an Orbitrap Elite mass spectrometer (Thermo Scientific, San Jose, CA, USA) using a data-dependent acquisition (DDA). The Full MS scan was acquired at 60,000 resolution, while fragmentation was performed in the ion trap using collision-induced dissociation (CID) set at 35. Fragment ions were detected in the ion trap. Isobaric peptides (i.e., same mass, different modification position) were targeted for MS/MS fragmentation at every cycle, to ensure accurate extracted ion chromatography of discriminatory fragment ions.
Western blot
Western blotting was performed using standard procedures. Primary antibodies are as follows: Brd4 (Bethyl A301–985A), H2AZ (Active Motif 39113), total H3 (Abcam ab1791), H3S10ph (Abcam ab5176), H3K14ac (Millipore 07–353), H3K18ac (Millipore 07–354), H3K27ac (Active Motif 39134), H3K122ac (Abcam ab33309), H4K16ac (Millipore 07–370), GAPDH (Santa Cruz sc-365062). Secondary antibodies included LI-COR IRDye 800 CW (Donkey anti-mouse, Donkey anti-rabbit) and LI-COR IRDye680 (Donkey anti-mouse, Donkey anti-rabbit). Imaging performed on the LI-COR Odyssey. Quantification performed within ImageStudio by subtracting background signal for each band and subsequently normalizing to GAPDH intensity.
QUANTIFICATION AND STATISTICAL ANALYSIS
Mass spectrometry (MS) quantification
MS raw data were searched using EpiProfile (Yuan et al., 2015). The peptide relative ratio was calculated using the total area under the extracted ion chromatograms of all peptides with the same aa sequence (including all of its modified forms) as 100%. For isobaric peptides, the relative ratio of two isobaric forms was estimated by averaging the ratio for each fragment ion with different mass between the two species.
ChIP-seq peak calling
Peaks were called for all ChIP-seq replicates separately using HOMER findPeaks (Heinz et al., 2010) (v4.9.1, parameters: -style his-tone) using cell-cycle-matched sequenced ChIP input. For Figure S2D, peaks were also called using MACS2 callpeak (Zhang et al., 2008) (v2.1.1, parameters:–broad -g mm–broad-cutoff 0.5). Peaks were required to be called in at least 2 replicates, and peak sets for each factor were merged between interphase and mitosis using BedTools merge (Quinlan and Hall, 2010) (v2.22.0, default parameters). For BRD4, mitosis peaks needed to be present in at least 2 of the 6 combined nocodazole and ro3306 replicates. Peaks were excluded if they contained > 50% overlap with repeat regions and any overlap with blacklist regions. For the majority of analyses, peak intensities were extracted in 100 10-bp bins across a 1 kb-long peak centered on the variable-length peak that was initially called by using HOMER annotatePeaks (Heinz et al., 2010) (v4.9.1, parameters: -size 1000-hist 10 -ghist -norm 1e7). Input ChIP-seq intensities were generated for the same regions in an identical manner and subtracted from each respective 10-bp bin. Finally, binned intensities were scaled by qPCR-derived scaling factors.
Scaling of ChIP-seq datasets by ChIP-qPCR
First, at each location tested by qPCR, the ChIP-seq intensities within that 70–90 bp amplicon region were extracted by using HOMER annotatePeaks (Heinz et al., 2010) (v4.9.1, parameters: -size given -norm 1e7), which will normalize the library to 10e7 reads before determining the intensity. Given the diffuse nature of total H3 and H3S10ph signals genome-wide, we extracted intensities for these data in 1 kb regions centered on the qPCR amplicon. Input ChIP-seq intensities were generated for the same regions and subtracted to yield a “virtual qPCR” signal above input, and any signals less than or equal to zero were excluded from further analysis. We then divided the actual ChIP-qPCR quantity by the virtual qPCR signal to determine the scaling factor for that particular qPCR amplicon and ChIP-seq data. The median of the scaling factors was calculated for each ChIP-seq dataset, and this factor was then multiplied with any subsequently extracted peak or region intensity (input-subtracted and library-normalized) from that dataset. DESeq2 analysis was performed using either unscaled (Figure 1A) or scaled (Figures 1F and 6A) binding intensities by setting the sizeFactor of the DESeqDataSet to 1 for each dataset, and then by using the estimateDispersions (fitType = “local”), nbinomWaldTest (default parameters), and results (default parameters) functions from the DESeq2 Bioconductor library version 3.8.
For benchmarking of this method, we tested its accuracy and consistency by assessing its ability to predict out-of-sample BRD4 ChIP-qPCR intensities using scaled BRD4 ChIP-seq data, evaluated either by mean absolute percentage deviation (MAPD) or Pearson correlation. Here, we selected between 2–10 ChIP-qPCR data for generating a scaling factor and held back the other ChIP-qPCR loci for evaluation. Once a scaling factor was generated for a given ChIP-seq dataset, 5 of the held back loci were randomly selected and their intensities were predicted using either librarynormalization alone or with the additional qPCR-derived scaling factor. For this particular run, the MADP was calculated as 100* Σ(abs(actual - predicted))/Σ (actual)) and a correlation was done between the actual and predicted intensities. For each possible number of training qPCR data (between 2–10), we tested predictions across 1000 runs.
PCA-based approach to studying peak changes
For a given ChIP factor and a set of 1-kb-long binding regions, we used principal component analysis (PCA) to deconvolute its binding characteristics within these regions. This consisted of first extracting ChIP-seq intensities (input-subtracted, qPCR-scaled) in 10-bp bins across all of the regions, and then calculating the mean intensity value for each region/bin pair across all replicates for a given cell cycle phase or experimental condition. We then organized the intensities into a matrix such that each row represents a binding region and each of 100 columns represents the 10-bp bins that make up the 1 kb region. We scaled each column by subtracting the column mean from each value, and then dividing by the column standard deviation. We applied PCA to the scaled interphase data, and then multiplied the matrix corresponding to each condition for this factor by that interphase PCA rotation matrix to determine the projection of each binding region onto the interphase-derived eigenvectors. We used this approach since in all cases, the eigenvectors generated from separate conditions were nearly identical, and projection on to the same eigenvectors allows for more robust comparison of data from different conditions.
We then applied k-means clustering with k = 4 (determined by elbow method, not shown) to the delta PC projection value for PC1, PC2, and PC3 for each BRD4 peak between interphase and mitosis.
Differentiation-related expression analysis
Primary MEP/proerythroblast RNA-seq data were downloaded from GSE14833. RNA-seq data for G1E-ER4 that were either undifferentiated or differentiated for 30h were downloaded from GSE40522, GSE51338, and GSE49487.
RNA Pol II mitotic occupancy analysis
RNA Pol II ChIP-seq data were downloaded from GSE83293. Datasets were scaled by library size, and rpkm intensities were extracted from gene TSS, gene body, or TTS regions using UCSC bigWigAverageOverBed (v2, default parameters) (Kent et al., 2010). TSS and TTS regions were defined as 2.5 kb windows centered on the annotated TSS and TTS, respectively. The gene body was defined as the window between these TSS/TTS regions, and only genes with a gene body window > 500 bp were analyzed.
Predictive modeling of BRD4 chromatin occupancy
To model likely binding partners for BRD4, we compared the ability of different chromatin-associated factors to predict BRD4 binding either during interphase or mitosis. To begin, we identified 1 kb BRD4 binding regions centered on the 5,343 set of joint interphase/mitotic BRD4 peaks (Figure 2D). As input data, for each selected factor, we extracted qPCR-scaled intensities in 10-bp bins spanning the set of BRD4 binding regions. As output data, we used the BRD4 peak characteristics defined by PCA as in Figure 2D, which together describe intensity (PC1), skew (PC2), or focality (PC3). We then used this set of input intensities for a given factor and output BRD4 binding characteristics to build a predictive model for BRD4 binding. To avoid model over-fitting, we split data into training and testing sets using 10x cross-validation. To achieve robust test predictions, we did 100 independent runs, each with scrambled peak ordering, such that each run consisted of 10 cross-validation runs. We then applied PCA to the input data and used the PC projections as independent variables in an initial generalized linear model predicting a set of BRD4 peak characteristics. From this model, we identified those PCs representing input data that significantly contribute to model with p < 0.05 in order to create a sparse model that avoids over-fitting to the training data. We then used only these sparse PCs to build a final model of the input data predicting the BRD4 peak characteristics. Finally, this model was applied to the testing data to evaluate the concordance between predicted BRD4 peak characteristics and actual values, assessed by Pearson correlation. We used GATA1 binding data from GSE36589 (Kadauke et al., 2012) for this analysis.
DATA AND SOFTWARE AVAILABILITY
All raw mass spectrometry files are available on http://chorusproject.org/pages/index.html at the project no. 1523. The accession number for the ChIP-seq raw data and processed peak calls reported in this paper is GEO: GSE128162.
Supplementary Material
KEY RESOURCES TABLE
| REAGENT or RESOURCE | SOURCE | IDENTIFIER |
|---|---|---|
| Antibodies | ||
| Anti-phospho-Ser/Thr-Pro MPM-2 Antibody | Millipore | Cat # 05–368; RRID: AB_309698 |
| MPM2 Secondary antibody: Allophycocyanin (APC) AffiniPure F(ab’)2 Fragment Donkey Anti-Mouse IgG (H+L) | Jackson Immunoresearch | Cat # 715–136–150; RRID: AB_2340802 |
| BRD4, for WB | Bethyl | Cat # Bethyl A301–985A; RRID: AB_1576498 |
| H2AZ, for WB | Active Motif | Cat # 39113; RRID: AB_2615081 |
| Total H3, for WB | Abcam | Cat # ab1791; RRID: AB_302613 |
| H3S10ph, for WB | Abcam | Cat # ab5176; RRID: AB_304763 |
| H3K14ac, for WB | Millipore | Cat # 07–353; RRID: AB_310545 |
| H3K18ac, for WB | Millipore | Cat # 07–354; RRID: AB_441945 |
| H3K27ac, for WB | Active Motif | Cat # 39134; RRID: AB_2722569 |
| H3K122ac, for WB | Abcam | Cat # ab33309; RRID: AB_942262 |
| H4K16ac, for WB | Millipore | Cat # 07–370; RRID: AB_310560 |
| GAPDH, for WB | Santa Cruz | Cat # sc-365062; RRID: AB_10847862 |
| LI-COR IRDye 800 CW Donkey anti-mouse | LI-COR | Cat # 925–32212; RRID: AB_2716622 |
| LI-COR IRDye 800 CW Donkey anti-rabbit) | LI-COR | Cat # 925–32213; RRID: AB_2715510 |
| LI-COR IRDye 680 RD Donkey anti-mouse | LI-COR | Cat # 926–68072; RRID: AB_10953628 |
| LI-COR IRDye 680 RD Donkey anti-rabbit) | LI-COR | Cat # 926–68073; RRID: AB_10954442 |
| BRD4, for ChIP | Bethyl | Cat # A301–985A; RRID: AB_1576498 |
| H2AZ, for ChIP | Abcam | Cat # ab4174; RRID: AB_304345 |
| Total H3, for ChIP | Abcam | Cat # ab1791; RRID: AB_302613 |
| H3S10ph, for ChIP | Abcam | Cat # ab5176; RRID: AB_304763 |
| H3K14ac, for ChIP | Millipore | Cat # 07–353; RRID: AB_310545 |
| H3K27ac, for ChIP | Active Motif | Cat # 39685; RRID: AB_2793373 |
| H3K122ac, for ChIP | Abcam | Cat # ab33309; RRID: AB_942262 |
| H4K16ac, for ChIP | Millipore | Cat # 07–370; RRID: AB_310560 |
| RNA Polymerase II, for ChIP | Cell Signaling | Cat # 14958; RRID: AB_2687876 |
| Chemicals, Peptides, and Recombinant Proteins | ||
| Protein G agarose beads | Thermo Fisher Scientific | Cat#15920010 |
| Power SYBR Green PCR Master Mix | Thermo Fisher Scientific | Cat#4367660 |
| iScript Reverse Transcription Supermix | Bio-Rad | Cat#1708841 |
| Trizol | Thermo Fisher Scientific | Cat#15596026 |
| Ro-3306 | Sigma-Aldrich | Cat # SML0569 |
| Nocodazole | Sigma-Aldrich | Cat # M1404 |
| (+)-JQ1 | Labs of James E. Bradner and Jun Qi (Dana-Farber Cancer Institute) | none |
| Trypsin | Promega | Cat # V5111 |
| Critical Commercial Assays | ||
| TruSeq ChIP Sample Preparation Kit | Illumina | Cat# IP 202–1012 |
| SPRIselect | Beckman Coulter | Cat # B23317 |
| Library Quant Kit for Illumina | Kapa Biosystems | Cat # KK4835 |
| RNeasy Mini kit with on-column DNase treatment | QIAGEN | Cat #74106 |
| QIAGEN PCR Purification Kit | QIAGEN | Cat #28106 |
| Deposited Data | ||
| RNA Pol II ChIP-seq data | Hsiung et al., 2016 | GEO: GSE83293 |
| 3ATA1 ChIP-seq data | Kadauke et al., 2012 | GEO: GSE36589 |
| RNA-seq data, MEP and proerythroblasts | Di Tullioetal., 2011 | GEO: GSE14833 |
| RNA-seq data, G1E-ER4 differentiation | Jain et al., 2015 | GEO: GSE40522, GSE51338, GSE49487 |
| ChIP-seq sequencing files | This paper | GEO: GSE128162 |
| Mouse reference genome NCBI build 37, MGSCv37 | Genome Reference Consortium | https://www.ncbi.nlm.nih.gov/assembly/GCF_000001635.18/ |
| Mass spectrometry data | Chorus, project # 1523 | http://chorusproject.org/pages/index.html |
| Experimental Models: Cell Lines | ||
| G1E-ER4 | Laboratory of Mitchell J. Weiss | Weiss et al., 1997 |
| Oligonucleotides | ||
| ChIP-qPCR primers | This paper | Table S2 |
| qRT-PCR primers | This paper | Table S2 |
| Software and Algorithms | ||
| bclfastq2 | v 2.15.04 | |
| bowtie2 | Langmead and Salzberg, 2012 | http://bowtie-bio.sourceforge.net/bowtie2/index.shtml |
| ImageStudioLite | LI-COR | v5.0 |
| EpiProfile | Yuan et al., 2015 | https://github.com/zfyuan/EpiProfile2.0_Family |
| HOMER | Heinz et al., 2010 | http://homer.ucsd.edu/homer/index.html |
| MACS2 | Zhang et al., 2008 | https://github.com/taoliu/MACS/ |
| BedTools | Quinlan and Hall, 2010 | https://bedtools.readthedocs.io/en/latest/ |
| DESeq2 | Love et al., 2014 | https://bioconductor.org/packages/release/bioc/html/DESeq2.html |
| UCSC genome tools | Kent et al., 2010 | https://github.com/ucscGenomeBrowser/kent |
Highlights.
Widespread mitotic chromatin binding of BRD4 is enriched at lineage-specific genes
Removal of BRD4 from mitotic chromatin does not affect transcriptional reactivation
Histone PTMs are stable on mitotic chromatin, especially at lineage-specific genes
Mitotic histone acetylation predicts post-mitotic transcription activation patterns
ACKNOWLEDGMENTS
This work was supported by NIH grants R01DK054937 and R37DK58044 to G.A.B., R24DK106766 to G.A.B. and R.C.H., DK007780 and F30DK10846902 to V.B., and 5T32DK007780 to A.J.S.; and a Patel Family scholar award to V.B.
Footnotes
SUPPLEMENTAL INFORMATION
Supplemental Information can be found online at https://doi.org/10.1016/j. celrep.2019.03.057.
DECLARATION OF INTERESTS
The authors declare no competing interests.
REFERENCES
- Blobel GA, Kadauke S, Wang E, Lau AW, Zuber J, Chou MM, and Vakoc CR (2009). A reconfigured pattern of MLL occupancy within mitotic chromatin promotes rapid transcriptional reactivation following mitotic exit. Mol. Cell 36, 970–983. [DOI] [PMC free article] [PubMed] [Google Scholar]
- Bonhoure N, Bounova G, Bernasconi D, Praz V, Lammers F, Canella D, Willis IM, Herr W, Hernandez N, Delorenzi M, et al. (2014). Quantifying ChIP-seq data: a spiking method providing an internal reference for sample-to-sample normalization 24, 1157–1168. [DOI] [PMC free article] [PubMed] [Google Scholar]
- Brown JD, Feldman ZB, Doherty SP, Reyes JM, Rahl PB, Lin CY, Sheng Q, Duan Q, Federation AJ, Kung AL, et al. (2018). BET bromodo-main proteins regulate enhancer function during adipogenesis. Proc. Natl. Acad. Sci. USA 115, 2144–2149. [DOI] [PMC free article] [PubMed] [Google Scholar]
- Calo E, and Wysocka J (2013). Modification of enhancer chromatin: what, how, and why? Mol. Cell 49, 825–837. [DOI] [PMC free article] [PubMed] [Google Scholar]
- Campbell AE, Hsiung CC, and Blobel GA (2014). Comparative analysis of mitosis-specific antibodies for bulk purification of mitotic populations by fluorescence-activated cell sorting. Biotechniques 56, 90–94. [DOI] [PMC free article] [PubMed] [Google Scholar]
- Caravaca JM, Donahue G, Becker JS, He X, Vinson C, and Zaret KS (2013). Bookmarking by specific and nonspecific binding of FoxA1 pioneer factor to mitotic chromosomes. Genes Dev. 27, 251–260. [DOI] [PMC free article] [PubMed] [Google Scholar]
- Dawson MA, Prinjha RK, Dittmann A, Giotopoulos G, Bantscheff M, Chan WI, Robson SC, Chung CW, Hopf C, Savitski MM, et al. (2011). Inhibition of BET recruitment to chromatin as an effective treatment for MLL-fusion leukaemia. Nature 478, 529–533. [DOI] [PMC free article] [PubMed] [Google Scholar]
- Delmore JE, Issa GC, Lemieux ME, Rahl PB, Shi J, Jacobs HM, Kastritis E, Gilpatrick T, Paranal RM, Qi J, et al. (2011). BET bromodo-main inhibition as a therapeutic strategy to target c-Myc. Cell 146, 904–917. [DOI] [PMC free article] [PubMed] [Google Scholar]
- Deluz C, Friman ET, Strebinger D, Benke A, Raccaud M, Callegari A, Leleu M, Manley S, and Suter DM (2016). A role for mitotic bookmarking of SOX2 in pluripotency and differentiation. Genes Dev. 30, 2538–2550. [DOI] [PMC free article] [PubMed] [Google Scholar]
- Devaiah BN, Case-Borden C, Gegonne A, Hsu CH, Chen Q, Meerzaman D, Dey A, Ozato K, and Singer DS (2016). BRD4 is a histone acetyltransferase that evicts nucleosomes from chromatin. Nat. Struct. Mol. Biol 23, 540–548. [DOI] [PMC free article] [PubMed] [Google Scholar]
- Dey A, Ellenberg J, Farina A, Coleman AE, Maruyama T, Sciortino S, Lippincott-Schwartz J, and Ozato K (2000). A bromodomain protein, MCAP, associates with mitotic chromosomes and affects G2-to-M transition.Mol. Cell. Biol 20, 6537–6549. [DOI] [PMC free article] [PubMed] [Google Scholar]
- Dey A, Chitsaz F, Abbasi A, Misteli T, and Ozato K (2003). The double bromodomain protein Brd4 binds to acetylated chromatin during interphase and mitosis. Proc. Natl. Acad. Sci. USA 100, 8758–8763. [DOI] [PMC free article] [PubMed] [Google Scholar]
- Dey A, Nishiyama A, Karpova T, McNally J, and Ozato K (2009). Brd4 marks select genes on mitotic chromatin and directs postmitotic transcription. Mol. Biol. Cell 20, 4899–4909. [DOI] [PMC free article] [PubMed] [Google Scholar]
- Di Tullio A, Vu Manh TP, Schubert A, Castellano G, Månsson R, and Graf T (2011). CCAAT/enhancer binding protein a α(C/EBPα)-induced transdifferentiation of pre-B cells into macrophages involves no overt retrodifferentiation. Proc. Natl. Acad. Sci. USA 108, 17016–17021. [DOI] [PMC free article] [PubMed] [Google Scholar]
- Festuccia N, Dubois A, Vandormael-Pournin S, Gallego Tejeda E, Mouren A, Bessonnard S, Mueller F, Proux C, Cohen-Tannoudji M, and Navarro P (2016). Mitotic binding of Esrrb marks key regulatory regions of the pluripotency network. Nat. Cell Biol 18, 1139–1148. [DOI] [PubMed] [Google Scholar]
- Filippakopoulos P, Qi J, Picaud S, Shen Y, Smith WB, Fedorov O, Morse EM, Keates T, Hickman TT, Felletar I, et al. (2010). Selective inhibition of BET bromodomains. Nature 468, 1067–1073. [DOI] [PMC free article] [PubMed] [Google Scholar]
- Filippakopoulos P, Picaud S, Mangos M, Keates T, Lambert J-P, Barsyte-Lovejoy D, Felletar I, Volkmer R, Müller S, Pawson T, et al. (2012). Histone recognition and large-scale structural analysis of the human bromodomain family. Cell 149, 214–231. [DOI] [PMC free article] [PubMed] [Google Scholar]
- Gibcus JH, Samejima K, Goloborodko A, Samejima I, Naumova N, Nuebler J, Kanemaki MT, Xie L, Paulson JR, Earnshaw WC, et al. (2018). A pathway for mitotic chromosome formation. Science 359, eaao6135. [DOI] [PMC free article] [PubMed] [Google Scholar]
- Ginno PA, Burger L, Seebacher J, Iesmantavicius V, and Schübeler D(2018). Cell cycle-resolved chromatin proteomics reveals the extent of mitotic preservation of the genomic regulatory landscape. Nat. Commun 9, 4048. [DOI] [PMC free article] [PubMed] [Google Scholar]
- Gottesfeld JM, and Forbes DJ (1997). Mitotic repression of the transcriptional machinery. Trends Biochem. Sci 22, 197–202. [DOI] [PubMed] [Google Scholar]
- Guertin MJ, Cullen AE, Markowetz F, and Holding AN (2018). Parallel factor ChIP provides essential internal control for quantitative differential ChIP-seq. Nucleic Acids Res. 46, e75. [DOI] [PMC free article] [PubMed] [Google Scholar]
- Hathaway NA, Bell O, Hodges C, Miller EL, Neel DS, and Crabtree GR (2012). Dynamics and memory of heterochromatin in living cells. Cell 149, 1447–1460. [DOI] [PMC free article] [PubMed] [Google Scholar]
- He S, Khan DH, Winter S, Seiser C, and Davie JR (2013). Dynamic distribution of HDAC1 and HDAC2 during mitosis: association with F-actin.J. Cell. Physiol 228, 1525–1535. [DOI] [PubMed] [Google Scholar]
- Heinz S, Benner C, Spann N, Bertolino E, Lin YC, Laslo P, Cheng JX, Murre C, Singh H, and Glass CK (2010). Simple combinations of lineage-determining transcription factors prime cis-regulatory elements required for macrophage and B cell identities. Mol. Cell 38, 576–589. [DOI] [PMC free article] [PubMed] [Google Scholar]
- Hsiung CC, Morrissey CS, Udugama M, Frank CL, Keller CA, Baek S, Giardine B, Crawford GE, Sung M-HH, Hardison RC, and Blobel GA (2015). Genome accessibility is widely preserved and locally modulated during mitosis. Genome Res. 25, 213–225. [DOI] [PMC free article] [PubMed] [Google Scholar]
- Hsiung CC, Bartman CR, Huang P, Ginart P, Stonestrom AJ, Keller CA, Face C, Jahn KS, Evans P, Sankaranarayanan L, et al. (2016). A hyperactive transcriptional state marks genome reactivation at the mitosis-G1 transition. Genes Dev. 30, 1423–1439. [DOI] [PMC free article] [PubMed] [Google Scholar]
- Jain D, Mishra T, Giardine BM, Keller CA, Morrissey CS, Magargee S, Dorman CM, Long M, Weiss MJ, and Hardison RC (2015). Dynamics of GATA1 binding and expression response in a GATA1-induced erythroid differentiation system. Genom. Data 4, 1–7. [DOI] [PMC free article] [PubMed] [Google Scholar]
- Javasky E, Shamir I, Gandhi S, Egri S, Sandler O, Rothbart SB, Kaplan N, Jaffe JD, Goren A, and Simon I (2018). Study of mitotic chromatin supports a model of bookmarking by histone modifications and reveals nucleo-some deposition patterns. Genome Res. 28, 1455–1466. [DOI] [PMC free article] [PubMed] [Google Scholar]
- Kadauke S, Udugama MI, Pawlicki JM, Achtman JC, Jain DP, Cheng Y, Hardison RC, and Blobel GA (2012). Tissue-specific mitotic bookmarking by hematopoietic transcription factor GATA1. Cell 150, 725–737. [DOI] [PMC free article] [PubMed] [Google Scholar]
- Kanno T, Kanno Y, Siegel RM, Jang MK, Lenardo MJ, and Ozato K (2004). Selective recognition of acetylated histones by bromodomain proteins visualized in living cells. Mol. Cell 13, 33–43. [DOI] [PubMed] [Google Scholar]
- Kelly TK, Miranda TB, Liang G, Berman BP, Lin JC, Tanay A, and Jones PA (2010). H2A.Z maintenance during mitosis reveals nucleosome shifting on mitotically silenced genes. Mol. Cell 39, 901–911. [DOI] [PMC free article] [PubMed] [Google Scholar]
- Kent WJ, Zweig AS, Barber G, Hinrichs AS, and Karolchik D (2010). BigWig and BigBed: enabling browsing of large distributed datasets. Bioinformatics 26, 2204–2207. [DOI] [PMC free article] [PubMed] [Google Scholar]
- Kruhlak MJ, Hendzel MJ, Fischle W, Bertos NR, Hameed S, Yang X-J, Verdin E, and Bazett-Jones DP (2001). Regulation of global acetylation in mitosis through loss of histone acetyltransferases and deacetylases from chromatin. J. Biol. Chem 276, 38307–38319. [DOI] [PubMed] [Google Scholar]
- Kurimchak AM, Shelton C, Duncan KE, Johnson KJ, Brown J, O’Brien S, Gabbasov R, Fink LS, Li Y, Lounsbury N, et al. (2016). Resistance to BET bromodomain inhibitors is mediated by kinome reprogramming in ovarian cancer. Cell Rep. 16, 1273–1286. [DOI] [PMC free article] [PubMed] [Google Scholar]
- Lamonica JM, Deng W, Kadauke S, Campbell AE, Gamsjaeger R, Wang H, Cheng Y, Billin AN, Hardison RC, Mackay JP, and Blobel GA (2011). Bromodomain protein Brd3 associates with acetylated GATA1 to promote its chromatin occupancy at erythroid target genes. Proc. Natl. Acad. Sci. USA 108, E159–E168. [DOI] [PMC free article] [PubMed] [Google Scholar]
- Langmead B, and Salzberg SL (2012). Fast gapped-read alignment with Bowtie 2. Nat. Methods 9, 357. [DOI] [PMC free article] [PubMed] [Google Scholar]
- Letting DL, Chen Y-Y, Rakowski C, Reedy S, and Blobel GA (2004). Context-dependent regulation of GATA-1 by friend of GATA-1. Proc. Natl. Acad. Sci. USA 101, 476–481. [DOI] [PMC free article] [PubMed] [Google Scholar]
- Liang K, Woodfin AR, Slaughter BD, Unruh JR, Box AC, Rickels RA, Gao X, Haug JS, Jaspersen SL, and Shilatifard A (2015). Mitotic transcriptional activation: clearance of actively engaged Pol II via transcriptional elongation control in mitosis. Mol. Cell 60, 435–445. [DOI] [PMC free article] [PubMed] [Google Scholar]
- Liu Y, Pelham-Webb B, Di Giammartino DC, Li J, Kim D, Kita K, Saiz N, Garg V, Doane A, Giannakakou P, et al. (2017). Widespread mitotic bookmarking by histone marks and transcription factors in pluripotent stem cells. Cell Rep. 19, 1283–1293. [DOI] [PMC free article] [PubMed] [Google Scholar]
- Love MI, Huber W, and Anders S (2014). Moderated estimation of fold change and dispersion for RNA-seq data with DESeq2. Genome Biol. 15, 550. [DOI] [PMC free article] [PubMed] [Google Scholar]
- Martínez-Balbás MA, Dey A, Rabindran SK, Ozato K, and Wu C (1995). Displacement of sequence-specific transcription factors from mitotic chromatin. Cell 83, 29–38. [DOI] [PubMed] [Google Scholar]
- Naumova N, Imakaev M, Fudenberg G, Zhan Y, Lajoie BR, Mirny LA, and Dekker J (2013). Organization of the mitotic chromosome. Science 342, 948–953. [DOI] [PMC free article] [PubMed] [Google Scholar]
- Nicodeme E, Jeffrey KL, Schaefer U, Beinke S, Dewell S, Chung CW, Chandwani R, Marazzi I, Wilson P, Coste H, et al. (2010). Suppression of inflammation by a synthetic histone mimic. Nature 468, 1119–1123. [DOI] [PMC free article] [PubMed] [Google Scholar]
- Nishiyama A, Dey A, Miyazaki J, and Ozato K (2006). Brd4 is required for recovery from antimicrotubule drug-induced mitotic arrest: preservation of acetylated chromatin. Mol. Biol. Cell 17, 814–823. [DOI] [PMC free article] [PubMed] [Google Scholar]
- Orlando DA, Chen M, Brown VE, Solanki S, Choi YJ, Olson ER, Fritz CC, Bradner JE, and Guenther MG (2014). Quantitative ChIP-Seq normalization reveals global modulation of the epigenome. Cell Rep. 9, 1163–1170. [DOI] [PubMed] [Google Scholar]
- Palozola K, Donahue G, Liu H, Grant G, Becker J, Cote A, Yu H, Raj A, and Zaret K (2017). Mitotic transcription and waves of gene reactivation during mitotic exit. Science 358, 119–122. [DOI] [PMC free article] [PubMed] [Google Scholar]
- Pradeepa MM, Grimes GR, Kumar Y, Olley G, Taylor GCA, Schneider R, and Bickmore WA (2016). Histone H3 globular domain acetylation identifies a new class of enhancers. Nat. Genet 48, 681–686. [DOI] [PMC free article] [PubMed] [Google Scholar]
- Quinlan AR, and Hall IM (2010). BEDTools: a flexible suite of utilities for comparing genomic features. Bioinformatics 26, 841–842. [DOI] [PMC free article] [PubMed] [Google Scholar]
- Raccaud M, Alber AB, Friman ET, Agarwal H, Deluz C, Kuhn T, Gebhardt JCM, and Suter DM (2018). Mitotic chromosome binding predicts transcription factor properties in interphase. Nat. Commun 10, 487. [DOI] [PMC free article] [PubMed] [Google Scholar]
- Rothbart SB, Dickson BM, Raab JR, Grzybowski AT, Krajewski K, Guo AH, Shanle EK, Josefowicz SZ, Fuchs SM, Allis CD, et al. (2015). An interactive database for the assessment of histone antibody spec-ificity. Mol. Cell 59, 502–511. [DOI] [PMC free article] [PubMed] [Google Scholar]
- Shao Z, Zhang R, Khodadadi-Jamayran A, Chen B, Crowley MR, Festok MA, Crossman DK, Townes TM, and Hu K (2016). The acetyllysine reader BRD3R promotes human nuclear reprogramming and regulates mitosis. Nat. Commun 7, 10869. [DOI] [PMC free article] [PubMed] [Google Scholar]
- Shi J, and Vakoc CR (2014). The mechanisms behind the therapeutic activity of BET bromodomain inhibition. Mol. Cell 54, 728–736. [DOI] [PMC free article] [PubMed] [Google Scholar]
- Sidoli S, Bhanu NV, Karch KR, Wang X, and Garcia BA (2016). Complete workflow for analysis of histone post-translational modifications using bottom-up mass spectrometry: from histone extraction to data analysis. J. Vis. Exp (111), 1–11. [DOI] [PMC free article] [PubMed] [Google Scholar]
- Sidoli S, Lu C, Coradin M, Wang X, Karch KR, Ruminowicz C, and Garcia BA (2017). Metabolic labeling in middle-down proteomics allows for investigation of the dynamics of the histone code. Epigenetics Chromatin 10, 34. [DOI] [PMC free article] [PubMed] [Google Scholar]
- Stonestrom AJ, Hsu SC, Jahn KS, Huang P, Keller CA, Giardine BM, Kadauke S, Campbell AE, Evans P, Hardison RC, and Blobel GA (2015). Functions of BET proteins in erythroid gene expression. Blood 125, 2825–2834. [DOI] [PMC free article] [PubMed] [Google Scholar]
- Teves SS, An L, Hansen AS, Xie L, Darzacq X, and Tjian R (2016). A dynamic mode of mitotic bookmarking by transcription factors. eLife 5, e22280. [DOI] [PMC free article] [PubMed] [Google Scholar]
- Valls E, Sánchez-Molina S, and Martínez-Balbás MA (2005). Role of his-tone modifications in marking and activating genes through mitosis. J. Biol. Chem 280, 42592–42600. [DOI] [PubMed] [Google Scholar]
- Vassilev LT, Tovar C, Chen S, Knezevic D, Zhao X, Sun H, Heimbrook DC, and Chen L (2006). Selective small-molecule inhibitor reveals critical mitotic functions of human CDK1. Proc. Natl. Acad. Sci. USA 103, 10660–10665. [DOI] [PMC free article] [PubMed] [Google Scholar]
- Wang CY, and Filippakopoulos P (2015). Beating the odds: BETs in disease. Trends Biochem. Sci 40, 468–479. [DOI] [PubMed] [Google Scholar]
- Wang F, and Higgins JM (2013). Histone modifications and mitosis: countermarks, landmarks, and bookmarks. Trends Cell Biol. 23, 175–184. [DOI] [PubMed] [Google Scholar]
- Weiss MJ, Yu C, and Orkin SH (1997). Erythroid-cell-specific properties of transcription factor GATA-1 revealed by phenotypic rescue of a gene-targeted cell line. Mol. Cell. Biol 17, 1642–1651. [DOI] [PMC free article] [PubMed] [Google Scholar]
- Wu W, Cheng Y, Keller CA, Ernst J, Kumar SA, Mishra T, Morrissey C, Dorman CM, Chen K-B, Drautz D, et al. (2011). Dynamics of the epigenetic landscape during erythroid differentiation after GATA1 restoration. Genome Res. 21, 1659–1671. [DOI] [PMC free article] [PubMed] [Google Scholar]
- Yang Z, He N, and Zhou Q (2008). Brd4 recruits P-TEFb to chromosomes at late mitosis to promote G1 gene expression and cell cycle progression. Mol. Cell. Biol 28, 967–976. [DOI] [PMC free article] [PubMed] [Google Scholar]
- Yuan Z-F, Lin S, Molden RC, Cao X-J, Bhanu NV, Wang X, Sidoli S, Liu S, and Garcia BA (2015). EpiProfile quantifies histone peptides with modifications by extracting retention time and intensity in high-resolution mass spectra. Mol. Cell. Proteomics 14, 1696–1707. [DOI] [PMC free article] [PubMed] [Google Scholar]
- Zhang Y, Liu T, Meyer CA, Eeckhoute J, Johnson DS, Bernstein BE, Nusbaum C, Myers RM, Brown M, Li W, and Liu XS (2008). Model-based analysis of ChIP-Seq (MACS). Genome Biol. 9, R137. [DOI] [PMC free article] [PubMed] [Google Scholar]
- Zhao R, Nakamura T, Fu Y, Lazar Z, and Spector DL (2011). Gene bookmarking accelerates the kinetics of post-mitotic transcriptional re-activation. Nat. Cell Biol 13, 1295–1304. [DOI] [PMC free article] [PubMed] [Google Scholar]
- Zhiteneva A, Bonfiglio JJ, Makarov A, Colby T, Vagnarelli P, Schirmer EC, Matic I, and Earnshaw WC (2017). Mitotic post-translational modifications of histones promote chromatin compaction in vitro. Open Biol. 7, 7. [DOI] [PMC free article] [PubMed] [Google Scholar]
Associated Data
This section collects any data citations, data availability statements, or supplementary materials included in this article.
Supplementary Materials
Data Availability Statement
All raw mass spectrometry files are available on http://chorusproject.org/pages/index.html at the project no. 1523. The accession number for the ChIP-seq raw data and processed peak calls reported in this paper is GEO: GSE128162.