

Summary
Costimulation regulates T cell activation, but it remains unclear whether costimulatory pathways also control T cell differentiation. We used mass cytometry to profile T cells generated in the genetic absence of the negative costimulatory molecules CTLA-4 and PD-1. Our data indicate that negative costimulation constrains the possible cell states that peripheral T cells can acquire. CTLA-4 imposes major boundaries on CD4+ T cell phenotypes, while PD-1 subtly limits CD8+ T cell phenotypes. By computationally reconstructing T cell differentiation paths, we identified protein expression changes that underlied the abnormal phenotypic expansion and pinpointed when lineage choice events occurred during differentiation. Similar alterations in T cell phenotypes were observed following anti-CTLA-4 and anti-PD-1 antibody blockade. These findings implicate negative costimulation as a key regulator and determinant of T cell differentiation, and suggest that checkpoint blockade may work in part by altering the limits of T cell phenotypes.
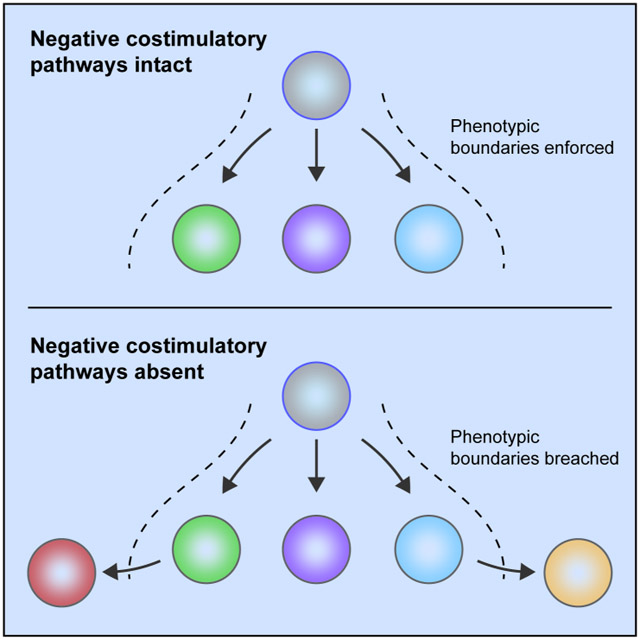
Graphical Abstarct
eTOC blurb
Negative costimulation is a critical regulator of T cell activity. Wei et al. characterize T cells arising in CTLA-4- and PD-1-deficient mice using mass cytometry and computational approaches. They show that these negative costimulatory molecules impose boundaries on T cell phenotypes during peripheral differentiation, suggesting that checkpoint blockade may work in part by altering the limits of T cell phenotypes.
Introduction
Negative costimulation of T cells, mediated by molecules such as CTLA-4 and PD-1, maintains T cell activity within a desired physiological window, enabling effective recognition of foreign antigens while restraining aberrant responses against self-antigens (Chen and Flies, 2013; Pardoll, 2012). In addition, peripheral differentiation generates a wide range of specialized T cell subsets that respond to diverse immunological challenges (O'Shea and Paul, 2010; Zhou et al., 2009). How T cell differentiation is regulated by diverse cellular inputs remains unclear. T cell receptor signal strength and cytokine signaling are recognized as key determinants of T cell differentiation (Zhou et al., 2009), but how other important signals regulate T cell differentiation remains unknown. In particular, the role of T cell costimulation in T cell differentiation remains unclear despite its well-established functional role in T cell activation. Thus, we sought to determine whether negative costimulation has a functional role in both T cell activation as well as differentiation.
CD28 is the primary source of positive costimulation and represents a critical second signal for T cell activation following T cell receptor (TCR) engagement (Chen and Flies, 2013). Upon ligation by B7 ligands (B7-1 or B7-2), CD28 signals through phosphoinositide 3-kinase (PI3K) to reinforce downstream activation pathways. TCR engagement in the absence of CD28 costimulation leads to T cell anergy, a state of unresponsiveness. Ligation of CD28 prevents the induction of anergy in the absence of costimulation (Harding et al., 1992). Thus, effective priming of T cell activation requires cell extrinsic costimulation by B7 ligand expressing antigen presenting cells (APC). CTLA-4 principally acts to regulate T cell activation by competing with CD28 and thus, limiting positive costimulation (Chen and Flies, 2013; Pardoll, 2012). CTLA-4 expression is detected within 1 hour of T cell activation, reaches peak levels within approximately 48 hours, and is trafficked to the immunological synapse to rapidly attenuate T cell activation (Egen and Allison, 2002; Lindsten et al., 1993; Walunas et al., 1994). Because CTLA-4 has higher affinity and avidity for B7 than CD28, CTLA-4 competitively inhibits CD28-mediated positive costimulation (Engelhardt et al., 2006; Pentcheva-Hoang et al., 2004; van der Merwe et al., 1997). It has also been reported that CTLA-4 can act via removal of B7 ligands from APCs (Hou et al., 2015; Qureshi et al., 2011), regulation of T cell motility (Schneider et al., 2006), cell extrinsic suppression by T regulatory (Treg) cells (Wing et al., 2008), and cell intrinsic effects on signaling (Lee et al., 1998). Furthermore, mutant versions of CTLA-4, which ablate cytoplasmic tail domain function, exhibit only partial activity (Carreno et al., 2000; Masteller et al., 2000). Together, these findings demonstrate that CTLA-4 regulates T cell activation via multiple distinct mechanisms but also highlight our incomplete understanding of CTLA-4 biology.
We sought to understand whether in addition to its role in attenuating activation, CTLA-4 also has a related but distinct function in regulating T cell differentiation. As T cell differentiation is tightly linked to TCR signal strength (Constant et al., 1995; Pfeiffer et al., 1995), we hypothesized that attenuation of downstream TCR signaling by CTLA-4 may also regulate differentiation. Ctla4 genetic deficiency has been shown to modulate the expansion and function of known T cell populations such as Th2-skewed CD4+ helper T cells (Bour-Jordan et al., 2003; Khattri et al., 1999), T follicular helper cell (Tfh), T follicular helper regulatory cell (Tfr) (Sage et al., 2014; Wang et al., 2015; Wing et al., 2014), and Treg populations (Wing et al., 2008). Similarly, antibody blockade of CTLA-4 is sufficient to modulate Tfh cell development (Wang et al., 2015) and induce the expansion of a Th1 -like CD4+ effector population in the context of tumor immunity (Wei et al., 2017). As CTLA-4 up-regulation is intrinsically coupled to T cell activation, these observations raise the possibility that CTLA-4 constrains the range of T cell phenotypes. Loss of CTLA-4 negative feedback, either by antibody blockade or by genetic loss, may permit new types of peripheral T cells to emerge through positive costimulation beyond normal biological limits. Conceptually, this possibility represents a completely distinct type of regulation. Whereas there is substantial evidence that modulation of T cell costimulation affects skewing towards specific lineages, it is unknown whether the range of possible cell states is controlled by costimulatory signals. We hypothesized that negative costimulation limits T cell differentiation, and that loss of this key regulatory mechanism enables the acquisition of phenotypes beyond normal boundaries.
Results
Aberrant T cell differentiation in the genetic absence of Ctla4
We profiled lymphocytes derived from Ctla4−/− and littermate control mice using mass cytometry and subsequently used clustering methods to classify T cell populations (See STAR Methods). Because germline loss of Ctla4 leads to a fatal lymphoproliferative disease (Chambers et al., 1997b; Tivol et al., 1995; Waterhouse et al., 1995), young mice were analyzed prior to the manifestation of uncontrolled lymphoproliferation to minimize the possibility that observed differences are due to conditions imposed by autoimmunity. t-SNE visualization illustrated changes in T cell population frequencies and phenotypes in Ctla4−/− mice, but no differences between Ctla4+/+ and Ctla4+/− mice were apparent (Fig. 1A, Fig. S1, Video S1). These qualitative observations were subsequently quantified by clustering and archetypal analyses. Populations that were only observed in Ctla-4−/− mice were entirely contained within the CD4+ compartment (Fig. 1B). These enriched CD4+ T cell populations expressed high levels of CD44 and inducible costimulatory molecule (ICOS), but displayed variable levels of other activation markers and lineage transcription factors. Manual gating also revealed similar effects of CTLA-4 deficiency on CD4+ and CD8+ T cells (Fig. S1A).
Figure 1: Genetic loss of Ctla4 leads to aberrant T cell differentiation.

A) t-SNE plot of CD3ε+ T cells identified in mass cytometry analyses of lymph nodes from 11-day-old Ctla4−/− (red, n = 7), Ctla4+/− (blue, n = 3), and Ctla4+/+ (green, n = 5) mice. Dotted lines highlight expanded populations in Ctla4−/− mice. An equal number of T cells of each genotype are displayed.
B) t-SNE plots overlaid with the expression heat maps of individual markers (red and blue indicate high and low expression, respectively).
C) Frequency of T cell clusters as a percentage of total T cells displayed on a per mouse basis. Mean and standard deviation are shown. Clusters are separated into three groups: CD4 effector T cells, Treg, and CD8 T cells. *, Ctla4+/+ versus Ctla4−/− and Ctla4+/− versus Ctla4−/− mice; p<0.05 2-way ANOVA with Tukey’s multiple testing correction. Clusters detected only in Ctla4−/− mice are shaded red.
D) Expression heat map of select markers in the T cell clusters shown in C. Relative mean intensity expression values, normalized to the maximum and minimum cluster mean value (99.5 and 0.5 percentile, respectively) are displayed.
E) Average increase in IdU incorporation (Log2 fold-change in Ctla4−/− versus controls) plotted against the average increase frequency (Log2 fold-change in Ctla4−/− versus controls) of individual T cell clusters. Each data point represents a T cell cluster. Linear regression line is displayed (R2 = 0.027, slope non-zero p = 0.385).
F) Density t-SNE plots of peripheral CD4 T cell populations derived from Ctla4−/− (blue) and Ctla4+/+ (red) mice. Equal numbers of cells from each genotype are displayed.
Data are representative of three independent experiments.
See also Figure S1.
To quantify our observations, T cell subsets were identified using PhenoGraph (Levine et al., 2015), a well-established algorithm for robust unsupervised cellular classification (Bengsch et al., 2018; Chevrier et al., 2017; Melchiotti et al., 2017; Wei et al., 2017). PhenoGraph identified 30 distinct subsets in Ctla4−/− and littermate control mice including 6 CD8+, 3 Treg and 14 CD4+ effector T cell populations (Fig. 1C-D and Fig. S1D). To enable interpretation of these quantitatively defined high-dimensional phenotypes, we qualitatively annotated clusters by differential expression of key markers based on existing knowledge. Multiple CD8+ and CD4+ T cell clusters were observed at higher frequencies in Ctla4−/− mice compared to controls, while no differences in frequency was observed between Ctla4+/+ and Ctla4+/− mice (Fig. 1C). The expansion in frequency of the same T cell subsets across multiple replicate mice suggested that loss of CTLA-4 affected T cell phenotypes in a non-random manner. For example, the frequency of terminally differentiated (TBET+EOMES+CD44+CD62L+) CD8+ T cells increased in Ctla4−/− mice (Fig. 1C-D, cluster 7). Similarly, an ICOS+ Treg cell population that is very minor in CTLA-4 competent mice (cluster 5) expanded in frequency in Ctla4−/− mice, while other Treg cell populations remained stable (cluster 18) or contracted (cluster 9).
Three CD4+ effector T cell subsets identified were only observed in Ctla4−/− mice (Fig. 1C-D, clusters 10, 12, 14) and were present in all Ctla4−/− mice. These findings contrast effects on CD8+ T cells, in which loss of CTLA-4 modulated expression levels (e.g. EOMES, IRF4, CXCR3), but no CD8+ T cell clusters were detected only in Ctla4−/− mice (Fig. 1B-C). This suggests that CTLA-4 limits CD4+ T cell phenotypes but not those of CD8+ T cells. Similar T cell phenotypes were detected in 4-week versus 11-day old Ctla4−/− mice, suggesting that such effects were not age-dependent or solely induced as a result of lymphoproliferative disease (Fig. S1E-F).
To investigate whether subset expansion is primarily driven by increased proliferation, we concurrently assessed changes in 5-iodo-deoxyuridine (IdU) incorporation and changes in frequency in T cell subsets due to loss of CTLA-4. Briefly, IdU was systemically administered shortly prior to analysis, allowing for assessment of actively proliferating T cells at this time point. No correlation was observed between the change in frequency of each T cell subset due to CTLA-4 loss and the respective changes in IdU incorporation (Fig. 1E). It remains possible that enhanced proliferation occured during an earlier phase, which was not profiled in our experiments. This suggests that CTLA-4 negative costimulation has a specific role in regulating CD4+ T cell differentiation beyond control of proliferation and raises the possibility that proliferation and differentiation limits are decoupled, at least partially, as a result of loss of CTLA-4.
Non-canonical CD4+ T cell subsets arise in the genetic absence of Ctla4
To more precisely distinguish CD4+ T cell subsets that only arise in the absence of CTLA-4 from subsets that simply modulate in frequency due to loss of CTLA-4 regulation, we analyzed the CD4+ T cell compartment (Fig. 1F, Fig. S1B-C). 25 CD4+ T cell clusters were identified, of which seven were present at higher frequencies in Ctla4−/− mice than controls. These seven populations stratified into four subsets only detectable in Ctla4−/− mice (clusters 7, 8, 13, 14) and three that increased in relative frequency due to CTLA-4 loss but were detectable in all control mice (clusters 5, 6, 9). Cluster 6 displayed a Tfh cell phenotype, consistent with observations that loss of CTLA-4 leads to a defect in Tfr cell differentiation and concomitant Tfh cell expansion (Sage et al., 2014; Wang et al., 2015; Wing et al., 2014).
Of particular interest are the phenotypic variables that distinguish these three ‘normal’ populations from the four clusters only detectable in Ctla4−/− mice (Fig. S1B-C). The four populations represented ICOS+ Th1-skewed Treg (cluster 7), ICOS+ Th1-like effector (cluster 8), unskewed ICOS+ (cluster 13), and Th17-like cell subsets (cluster 14). These populations uniformly expressed high levels of ICOS and variable levels of PD-1, markers normally associated with Tfh cells. However, these clusters did not express high levels of BCL6 (the defining transcription factor expressed by Tfh cells) or coexpressed BCL6 with additional lineage transcription factors (e.g. GATA3 and RORγT, cluster 14), suggesting that these populations are not canonical Tfh cells. These subsets also displayed features not normally associated with the canonical T cell populations (e.g. coincident expression of ICOS and TBET, GATA3 and RORγT). This indicates that non-canonical combinations of features define in part the latent differences in high-dimensional phenotypes of T cell subsets that expand in the absence of CTLA-4.
Archetypal analysis identifies phenotypic boundaries and reveals that loss of CTLA-4 expands CD4+ but not CD8+ T cell phenotypic space
These data suggest that loss of CTLA-4 expands the range of possible phenotypes of peripheral T cells in lymph node tissues. We sought to explicitly address this possibility and understand whether loss of CTLA-4 mediated negative feedback allows cells to occupy otherwise unattainable phenotype states. We applied archetypal analysis (Cutler and Breiman, 1994; Mørup and Hansen, 2012), an unsupervised computational approach used to identify optimal phenotypes associated with specific biological phenomena at the organismal and single cell level (Korem et al., 2015; Shoval et al., 2012). In contrast to clustering approaches, which identify the average behavior (i.e. phenotypes) of populations, archetypal analysis elucidates behavior of cells at the boundaries of populations. Here, we systematically define the most extreme T cell phenotypes (i.e. archetypes) present under normal and genetically perturbed conditions (Fig. 2A, see STAR Methods). We then leverage archetypes to assess whether the identified cells at the boundary are condition-dependent, and thus attribute changes in biological capability to experimental perturbations (e.g. loss of CTLA-4).
Figure 2: Archetype analysis reveals an expansion of CD4 T cell phenotypic space upon loss of CTLA-4.

A) Schematic of workflow to identify archetypes, discern relationships between archetypes, and assess their neighborhood cellular occupancy in perturbed biological systems. In parallel with cluster analyses, the single cell data was also analyzed using Archetypal Analysis. Following identification of archetypes, the phenotypic neighborhood of each archetype was characterized. To assess the frequency of cells associated with each archetype, the volume around each archetype within a given radius near the archetype, was determined. The radius was computed using graph distance as opposed to Euclidean distance to accommodate for non-linearity in the data.
B) CD8 and CD4 T cell archetypes are overlaid on a t-SNE plot of total T cells from Ctla4+/+ (green), Ctla4+/− (blue), and Ctla4−/− (red) mice. Archetypes were identified on total CD8 T cell and CD4 T cell data separately.
C) Expression heat map of CD8 (left) and CD4 (right) T cell archetypes, computed as the median expression of thirty nearest neighbors for each archetype. Relative mean intensity expression values are displayed, normalized to maximum and minimum values (99.5 and 0.5 percentile, respectively). Archetypes detected only in Ctla4−/− mice are shaded red.
D) The frequencies of cells from each genotype associated with each CD4 and CD8 archetype are displayed. The number of cells within a volume defined by 2-percentile diffusion distance from each archetype are displayed on a per mouse basis with mean and standard deviation. *, Ctla4+/+ and Ctla4+/− versus Ctla4−/−; p<0.05 2-way ANOVA with Tukey’s multiple testing correction.
See also Figure S2.
Seven CD4+ and eight CD8+ T cell archetypes were identified (Fig. 2B-C). CD4+ effector cell archetypes 5 and 7, and Treg cell archetype 6 appeared to reside in Ctla4−/− specific regions. These CD4+ T cell archetypes displayed ICOS+BCL6+GATA3+ (archetype 5), ICOS+CD44+CD62L+ Treg cell (archetype 6), and ICOS+TBET+ (archetype 7) phenotypes. Archetype phenotypes were highly stable and biological interpretations were robust to the number of archetypes identified (Fig. S2A, S2C-E). Conversely, CD8+ archetypes appeared to reside in regions populated by T cells from all genotypes, suggesting that CTLA-4 constrains CD4+ but not CD8+ phenotypes.
To directly assess whether cells of specific genotypes associated with archetypes, we quantified the number of cells in the neighborhood of each archetype (see STAR Methods). Consistent with clustering results and t-SNE visualization, phenotypic space around CD4+ archetypes 5, 6, and 7 were exclusively occupied by Ctla4−/− T cells (Fig. 2D and Fig. S2E). This indicated that these phenotypes do not exist in the presence of intact CTLA-4 signaling. Thus, loss of CTLA-4 caused an expansion in the phenotypic states that a CD4+ T cell can occupy in otherwise normal T cell development. In contrast, CD4+ archetype 1 (displaying a CD62L+CD44lowCD127+ phenotype) was nearly absent in Ctla4−/− T cells. It stands to reason that resting naïve or memory cells were aberrantly permitted to expand in the absence of CTLA-4 and thus, adopted activated phenotypes. A phenotypically similar CD8+ T cell archetype was nearly absent in Ctla4−/− T cells, consistent with this notion (Fig. 2D, CD8+ archetype 2).
In contrast to observations in the CD4 compartment, no CD8+ T cell archetypes were associated specifically with Ctla4−/− cells. Although CD8+ archetype 6 potentially resides in a knockout specific region based on t-SNE visualization (Fig. 2B), quantitative assessment reveals an association with CTLA-4 competent cells (Fig. 2D). This suggests that loss of CTLA-4 skewed CD8+ T cell populations, as evidenced by changes in the relative proportion of cells associated with each archetype, but did not alter CD8+ T cell phenotypic boundaries. Skewing of differentiation that can change relative frequencies of populations is conceptually distinct from effects on phenotypic boundaries that alter the range of attainable cell states. These data suggest that all observed CD8+ T cell states are achievable under normal conditions and that loss of CTLA-4 may even reduce CD8+ T cell phenotypic space (i.e. loss of naïve or resting memory phenotypes).
ICOS is expressed by non-canonical T cell subsets but is not required for their development
Next, because ICOS was highly expressed by phenotypically expanded T cells (Fig. 1B, 1D) and antibody blockade of ICOS attenuates T cell activity in Ctla4−/− mice (van Berkel et al., 2005), we tested whether ICOS is necessary for the generation of aberrant populations. We generated transgenic mice harboring Icos mutant alleles in cis with the Ctla4 mutant allele using CRISPR gene editing (See STAR Methods). We analyzed two Icos frameshift alleles; both led to complete loss of ICOS expression but only subtly modulated T cell cluster frequencies (Fig. S3A-E). Loss of ICOS decreased Tfh cells, consistent with the established role for ICOS in Tfh cell development (Choi et al., 2011; Nurieva et al., 2008). All T cell populations identified in Ctla4−/−Icos+/− mice were present in Ctla4−/−Icos−/− mice, however, indicating that although ICOS is highly expressed on phenotypically expanded subsets, it is not required for their development.
Non-canonical T cells arise through mechanisms distinct from increased activation
We next sought to rule out the possibility that aberrant populations arise solely due to increased proliferation. We immunized Ctla4−/− and littermate controls with ovalbumin in complete Freund’s adjuvant (CFA) to induce a strong T cell response against a spectrum of antigens. We identified T cell clusters to assess if this perturbation induced similar phenotypes observed in knockout mice. We classified T cell subsets into 3 groups: i) homeostatic subsets detected in all mice, ii) activation-dependent subsets detected in CTLA-4 deficient and competent mice upon immunization, and iii) phenotypically expanded subsets present in Ctla4−/− but not in control mice under any condition (Fig. 3A-B).
Figure 3: Ctla4 deficient non-canonical T cell subsets are distinct from canonical activated T cell populations.

A) Schematic of the experimental approach to distinguish homeostatic, activation dependent, and Ctla-4 knockout specific T cell populations. T cell populations are categorized based on the combined responses to loss of CTLA-4 and OVA-immunization: homeostatic (blue), activated-induced (yellow), and phenotypic expansion (red) populations.
B) Density t-SNE plots of CD3ε+ T cells from Ctla4−/− and control mice (Ctla4+/−and Ctla4+/+). Control (Ctla4+/− and Ctla4+/+, n = 14 mice) and Ctla4−/− (n = 6) mice were randomized to unimmunized and immunized groups. Draining lymph nodes were analyzed six days post-immunization. Arrows indicate activation dependent T cell populations that are enriched in wild-type mice following immunization but are occupied in Ctla4−/− mice (regardless of immunization).
C) Frequency of clusters identified within the CD3ε+ T cell compartment displayed on a per mouse basis with mean and standard deviation. Clusters are separated into three phenotypic groups: CD4 effector T cells, Treg, and CD8 T cells. *, unimmunized versus immunized control; #, unimmunized and immunized control versus unimmunized Ctla4−/−; ^, unimmunized versus immunized Ctla4−/−; and ~, unimmunized control versus unimmunized Ctla4−/− mice; p<0.05 2-way ANOVA with Holm-Sidak multiple testing correction.
Data are representative of two independent cohorts.
See also Figure S3.
We identified eleven CD4+, two Treg, and six CD8+ T cell clusters. The phenotypes were very similar to those in unmanipulated 11-13 day old Ctla4−/− mice, despite analysis of older mice in immunization experiments (Fig. 1D, 3C, S3G). No differences in T cell subset frequencies were observed between unimmunized and immunized Ctla4−/− mice. Multiple CD4+ and CD8+ T cell populations expanded in response to immunization in control mice (Fig. 3B-C and Fig. S3F-H). This indicates that this assay was sufficient to detect polyclonal endogenous T cell responses and enabled us to distinguish phenotypes that can be attained through activation alone. Three activation-dependent CD4+ effector populations significantly expanded in immunized control mice (Fig. 3C, clusters 1, 4, and 6). These subsets were detected in resting control mice, indicating that their increased frequency in Ctla4−/− mice was due to increased proliferation rather than changes in phenotypic limits. Clusters 11 and 14 were detected in resting control mice and were not impacted by immunization. This suggests that their expansion in Ctla4−/− mice was driven by homeostatic processes. In contrast, clusters 12, 15, and 16 increased in Ctla4−/− mice but were not detected in resting or immunized control mice, indicating that their expansion was a direct consequence of CTLA-4 loss. The phenotypes of clusters 12 (ICOS+TBET+ Th1-like) and 16 (PD-1+ICOS+GATA3+ RORγT+) related directly to CD4+ effector archetypes 7 and 5, respectively (Fig. 2 and 3). It remains possible that even more extreme phenotypes relating to the pathogenesis may be observed in older mice, however, T cell clusters identified in 11- and 21-day old mice displayed similar phenotypes. This supports the notion that extension of phenotypic limits is independent of age and derives directly from loss of CTLA-4 rather than indirect effects of its deletion.
Genetic loss of Ctla4 skews the peripheral T cell repertoire
We next analyzed the TCRβ repertoire of thymic and lymph node (LN) tissue from Ctla4−/− and littermate control mice to investigate whether alterations in central or peripheral repertoires underlie aberrant differentiation. Thymic development is normal in Ctla4−/− mice at the cellular level (Chambers et al., 1997a; Waterhouse et al., 1997). Consistent with this, no major molecular defects in thymic T cell repertoire or the frequency of productive rearrangements were detected (Fig. 4A, S4). In contrast, T cell clonality increased in Ctla4−/− LN tissue (Fig. 4A). Increased clonality was accompanied by decreased average CDR3 length, in part resulting from a decreases in N1 and N2 nucleotides inserted at V-D and D-J junctions (Fig. S4A). N insertions are mediated by thymic terminal deoxynucleotidyl transferase (Gilfillan et al., 1993; Komori et al., 1993), and no change in N1 or N2 insertions was observed in Ctla4−/− thymic tissue, which together indicate that TCRβ repertoire skewing occurred in the periphery and was not due to defects in central tolerance. Specific T cell clonotypes were recurrently expanded in LN, but not thymus, from biological replicate Ctla4−/− mice. Although we expected clonality to be increased in Ctla4−/− mice due to oligoclonal expansion, it is surprising that the same clonotypes, and in fact, specific TCRβ variable segments recurrently expanded in Ctla4−/− peripheral tissue (Fig. 4C, S4B). The frequency of 44 clonotypes recurrently expanded in Ctla4−/− LN while 10 contracted (Table S3). This suggested that in absence of CTLA-4, these clonotypes aberrantly activated and proliferated. While proliferation is necessary for phenotypic expansion, our IdU incorporation experiments suggested that the changes in proliferation did not solely cause phenotypic expansion. These data suggest that specific self-reactive T cell clones recurrently arise in the absence of CTLA-4 and that their aberrant expansion, in part, underlies the generation of non-canonical phenotypes.
Figure 4: Deletion of Ctla4 alters the peripheral but not thymic T cell repertoire.

A) Clonality of T cells derived from thymus (n = 4 mice per group) and LN tissue (n = 6 mice per group) from Ctla4−/− and control (Ctla4+/+ and Ctla4+/−) displayed on a per mouse basis with mean and standard deviation. *, p<0.01 Mann-Whitney test.
B) Fraction of productive TCRB gene rearrangements in thymus and lymph node from Ctla4−/− and control mice. Data points represent individual mice with mean and standard deviation displayed.
C) Frequency of the 20 most abundant TCRβ clonotypes in Ctla4−/− and control LN tissue. Frequencies per mouse and median values per group are displayed (n=6 mice per group; data points for clonotypes with 0% frequency in individual mice are not displayed, and 120,129 total clonotypes identified). *, p<0.01, Mann-Whitney test.
See also Figure S4.
Loss of PD-1 subtly expands CD8+ T cell phenotypic space and does not affect CD4+ T cell phenotypic limits
Next, we sought to determine whether the effect of loss of CTLA-4 on T cell differentiation reflects a generalizable function of negative costimulation, or rather a property specific to CTLA-4. To explore this question, we characterized T cell phenotypes in young Pdcd1 (encoding PD-1) deficient mice of similar age as the Ctla4-deficient mice profiled. PD-1 negatively regulates T cell activation through different mechanisms than CTLA-4 (Pardoll, 2012; Parry et al., 2005) and as such may impose distinctive restrictions on phenotypes. Archetypal analysis identified one CD8+ T cell archetype that was enriched in young Pdcd1−/− mice but still present in control mice (Fig. S5A, CD8+ archetype 5). Cells associated with all archetypes were detected in PD-1 competent littermates however, suggesting that phenotypic limits were not altered by the absence of PD-1 in young mice. This is consistent with prior reports that peripheral T cell phenotypes are grossly normal in Pdcd1−/− mice (Keir et al., 2007).
We then profiled adult Pdcd1−/− mice given that autoimmune phenotypes manifest only in older mice (Nishimura et al., 1999; Nishimura et al., 2001). Archetype analysis identified a PD-L1+Sca1+IRF4+ CD8+ T cell archetype that subtly expanded in adult Pdcd1−/− mice and was not detected in control mice (Fig. 5A-D, S5G; archetype 3). This phenotypic expansion was variant, however similar findings and levels of biological variance were observed in multiple independent cohorts of mice (Fig. S5I). In contrast, loss of PD-1 did not affect the phenotypic limits of CD4+ T cells (Fig. 5D, S5G). While changes in the relative frequency of several CD4+ T cell archetypes were observed, cells associated with these archetypes were detected in control mice.
Figure 5: Loss of PD-1 leads to a minor expansion of CD8 T cell phenotypic space.

A) t-SNE plots displaying equal number of T cells derived from adult Pdcd1+/−, Pdcd1+/+ and Pdcd1−/− mice, overlaid with the expression of selected markers. Dotted line highlights phenotypic expansion regions in Pdcd1−/− mice.
B) CD8 and CD4 T cell archetypes overlaid on t-SNE plots as shown in A; Pdcd1+/+ (green), Pdcd1+/− (blue), and Pdcd1−/− (red) mice.
C) The frequencies of cells from each genotype associated with CD8 archetypes are displayed. The number of cells within a volume defined by 2-percentile diffusion distance from each archetype are displayed on a per mouse basis with mean and standard deviation. *, control (Pdcd1+/− and Pdcd1+/+; blue) versus Pdcd1−/− mice (red); p<0.05 2-way ANOVA with Sidak’s multiple testing correction. Archetypes detected only in Pdcd1−/− mice are shaded red.
D) The frequencies of cells associated with CD4 archetypes in Pdcd1−/− and littermate control mice are displayed.
See also Figure S5.
The subtle expansion of CD8+ T cell phenotype limits due to loss of PD-1 appears to be age-dependent and likely relies on the prior induction of an immune response. Consistent with this notion, the enriched archetype in young Pdcd1−/− mice displayed a similar, but less extreme phenotype than archetype 3 in adult mice (Fig. S5B, archetype 5; S5G, archetype 3). Whether the expression of Sca1 by this archetype reflects functional stem-like properties remains unknown. Visualization of the data by t-SNE suggested that extension of phenotypic limits is independent of PD-L1 expression (Fig. S5E). This indicated that compensatory upregulation of PD-L1 is not the primary driver of this effect. In contrast to findings of archetypal analysis, clustering analysis did not detect changes in phenotypic limits, highlighting important differences between these computational approaches (Fig. S5F). This suggested that the changes in phenotypic limits due to loss of PD-1 likely reflect an increase in variance in CD8+ T cell phenotypes (rather than shifts in population centroids), in which only boundary populations are impacted (Fig. S5H). These data suggested that negative costimulation has a generalizable role in defining T cell phenotypic limits but that CTLA-4 and PD-1 impose distinct types of constraints.
Reconstruction of peripheral T cell differentiation paths reveals distinct patterns of ordered and coordinated changes in protein expression
We then sought to identify molecular events normally restricted by CTLA-4, but permitted to occur in its absence. To accomplish this, we used mass cytometry data to reconstruct differentiation trajectories between the naïve CD4+ T cell archetype and each differentiated CD4+ T cell archetype. A trajectory between a start-point (i.e. a naïve T cell) and end-point (i.e. a differentiated T cell) archetype approximates the transition between cell states. To achieve this, we built upon prior works demonstrating that shortest paths through a nearest-neighbor graph faithfully recapitulate cellular differentiation trajectories (Bendall et al., 2014; Haghverdi et al., 2015; Haghverdi et al., 2016; Setty et al., 2016). For example, such approaches can accurately reconstruct thymic differentiation using a static time point sample without a priori knowledge of development paths (Setty et al., 2016). We reasoned that a similar approach could identify biologically relevant differentiation paths that exist in the absence of CTLA-4. We aligned the cells along each trajectory on a pseudo-time axis that approximates the underlying differentiation paths (Fig. 6A, See STAR Methods). This allows for characterization of expression changes as T cells gradually differentiate towards archetypal phenotypes. Importantly, by identifying the point at which CTLA-4 competent T cells are no longer found along these differentiation paths, we can identify the limits of T cell phenotypes imposed by CTLA-4. We can then infer the expression changes that occur leading up to and beyond these boundaries underlying phenotypic expansion observed in Ctla4−/− T cells. While this approach identifies molecular events associated with cell differentiation, complementary approaches are required to determine whether such changes functionally mediate phenotypic expansion.
Figure 6: Pseudo-time reconstruction of CD4 T cell differentiation paths indicates that CTLA-4 imposes maximal expression limits during differentiation.

A) Schematic of the method used to reconstruct T cell differentiation paths from the naïve CD4 T cell archetype to each differentiated archetype. First, a k-nearest neighbor graph (k = 30) was computed. To ensure that the differentiation paths are not impacted by short-circuits (i.e. erroneous connections) in the graph, we randomly subsample l out of k edges. In this subsampled graph we compute the shortest path from naïve archetype to each of the expanded archetypes. This process of subsampling and computing shortest paths is repeated 100 times for robustness. The final output is the smoothed protein expression computed along each of the shortest paths (see STAR Methods).
B) The derivatives of individual marker expression plotted as functions of T cell differentiation paths (i.e. pseudo-time) to CD4 archetypes 5, 6, and 7 identified in the context of Ctla4−/− and control mice. Slope values computed from an ensemble of 100 paths are displayed as a heat map along each trajectory. A dotted vertical line demarcates the boundaries of normal phenotypes.
C) Plot displaying the relative frequencies of CD4 T cells derived from Ctla4+/+ (green), Ctla4+/− (blue), and Ctla4−/− (red) mice along the trajectory plotted as a function of pseudo-time. Volumes were computed using a 2-percentile diffusion distance from the average differentiation paths to CD4 archetypes 5, 6, and 7.
D) Ratios of pairs of lineage transcription factors (TF) along the differentiation pseudo-trajectories to CD4 archetypes 6 and 7 identified in the CTLA-4 dataset. The y-axis shows the arctangent of the ratio, where a value of 90 degrees corresponds to a high expression of the numerator TF compared to the denominator TF, and vice versa for a value of 0 degrees. Average ratio (mean, bolded line) and standard deviation (shaded region) are displayed. Dotted vertical lines demarcate boundaries of normal phenotypes and grey arrows indicate the approximate locations of TF ratio switch-events.
See also Figure S6.
Analysis of Ctla4 and Pdcd1 knockout datasets revealed distinct patterns of gene expression changes along each trajectory in pseudotime (Fig. 6A-C, S6). These regulatory patterns included both co-regulation and sequential regulation of protein expression, and were distinct between archetypes in terms of the markers involved and kinetics. We primarily focused on CD4+ T cell archetypes 5-7 to understand what molecular changes drove the emergence of new cell states. To visualize changes in expression as cells differentiate, the slope of each marker’s expression was plotted along each trajectory as a function of pseudotime (Fig. 6B). This enabled identification of sustained increases or decreases in expression, as defined by positive or negative slope, respectively. To distinguish changes associated with normal versus aberrant differentiation due to loss of CTLA-4, we assessed the genotype of cells along each differentiation path. Only Ctla4−/− T cells were associated with distal regions of the paths close to archetypes 5-7 (Fig. 6C), while cells from all genotypes were present along the entirety of paths to archetypes 1-3. These findings are consistent with our prior analyses and importantly, identify the boundary of normal CD4+ T cell phenotypes imposed by CTLA-4.
We were particularly interested in changes associated with commitment to the Th1-skewed archetype 7, given that potentially analogous Th1-skewed cells arise following therapeutic CTLA-4 blockade (Chaput et al., 2017; Liakou et al., 2008; Wei et al., 2017). A subset of markers (e.g. CD44) displayed sustained increases in expression along the paths towards archetype 7, as visualized by the positive slope beyond the boundary of CTLA-4 sufficient cells (Fig. 6B and Fig. S6C). In contrast, PD-1 expression increased early during differentiation towards archetype 7 but stabilized beyond the boundary. This is in contrast with the trajectory of archetype 5, along which PD-1 expression continued to increase beyond the boundary, suggesting that CTLA-4 imposes a limit on maximum expression of specific markers (e.g. PD-1, CD44, ICOS). This argues against a model in which loss of CTLA-4 leads to aberrant activation of pathways normally dormant in T cells. Rather, these data suggest that a primary mechanism by which CTLA-4 restrains T cell phenotypes is through imposing maximal limits on already active pathways.
To determine when cell fate commitment occured during the course of differentiation and if loss of CTLA-4 influences these events, we investigated ratios of lineage transcription factors, as their interactions are known to play critical roles in cell fate determination (Antebi et al., 2013). We focused on pairs known to have direct functional relationships that control T cell differentiation, namely, T-BET and GATA3 (Hwang et al., 2005), T-BET and BCL6 (Nurieva et al., 2009; Yu et al., 2009), and FoxP3 and RORγT (Zhou et al., 2008). The ratios of FoxP3 and RORγT expression exhibited a switch-like change during differentiation towards archetype 6, suggestive of a fate-choice event (Fig. 6D, see STAR Methods). Likewise, switch-like changes in TBET:GATA3 and TBET:BCL6 expression ratios were observed during differentiation towards archetype 7. These data support the notion that circuits composed of functional relationships between transcription factors control lineage fate decisions, with antagonistic interactions influencing decision points and positive feedback loops stabilizing discrete populations (Antebi et al., 2013; Murphy and Stockinger, 2010). We found that switches in transcription factor ratios occur prior the normal boundary (Fig. 6D), suggesting that loss of CTLA-4 did not alter functional relationships between transcription factors or cell fate decisions. Rather, loss of CTLA-4 removed maximal expression limits on molecules involved in already active pathways (e.g. CXCR3, CD25, FoxP3, ICOS), which mediate the expansion of phenotypes available to a given cell fate. This is an important distinction from the de novo induction of signaling pathways that are normally inactive in these contexts.
Phenotypically expanded T cell subsets are associated with enhanced cytokine profiles
To gain insight into the potential biological consequences of expansions in T cell phenotypic limits, we performed cytokine profiling of lymphocytes derived from Ctla4−/− or control mice. We utilized a conventional gating strategy guided by our mass cytometry findings to approximate phenotypically expanded T cells. In particular, CD44+CD25−ICOS+PD-1+ and CD44+CD25−ICOS+PD-1− gates enriched for expansion of CD4+ effector populations (i.e. archetypes 5 and 7 in Fig. 2, respectively). This enabled only an approximation of phenotypically expanded populations, but facilitated comparison of their cytokine profiles with the most similar cells in control mice. The frequency of cytokine+ cells within these two subsets was dramatically higher in Ctla4−/− versus control mice (Fig. 7A). In contrast, only subtle increases or decreases in the frequency of cytokine+ cells were observed within ICOS−PD-1+ T cells and ICOS−PD-1− cells.
Figure 7. Expanded T cell phenotypes are associated with enhanced cytokine profiles and are analogously observed in anti-tumor immunity following checkpoint blockade.

A) Radar plots displaying the frequency of CD4 T cells positive for the denoted cytokines following a 4-hour restimulation. Frequencies as a percent of total CD4 T cells are displayed for subpopulations of CD44+ CD25− effector CD4 T cells gated based on ICOS and PD-1 expression. Each data ring represents the average frequency from an individual mouse. Control (wild-type and Ctla4+/−; blue; n = 13) and Ctla4 KO (red; n = 5 mice) are displayed. *, P<0.01 T test with Holm-Sidak multiple testing correction. Data are representative of two cohorts.
B) Radar plots displaying the mean fluorescence intensity (MFI) of cytokine positive cells is displayed using a log10 scale. Each data ring represents the average frequency from an individual mouse.
C) Frequency of cell associated with MC38 murine tumor infiltrating CD4 T cell archetypes. *, P<0.05 one-way ANOVA with Tukey’s multiple comparison.
D) Frequency of cells associated with CD8 T cell archetype1 from cohort A of pre- and post-therapy peripheral blood samples from melanoma patients treated with anti-PD-1 therapy. Healthy donor and pre-post matched pairs of samples are displayed on a per patient basis. Responder (R) and non-responder (NR) patients are denoted. *, P<0.05 one-way ANOVA with Tukey’s multiple comparison.
E) Frequency of cells associated with CD8 T cell archetype 5 from cohort B of peripheral blood of melanoma patients being treated with anti-PD-1 immune checkpoint blockade therapies.
See also Figure S7.
Such increases in cytokine+ cell frequency could be due to enhanced activation, thus we sought to investigate whether loss of CTLA-4 regulates the expression levels of cytokines on a per cell basis. We found that the mean expression level of IFNγ, TNFα, and IL-17α in cytokine+ cells dramatically increased in Ctla4−/− cells (Fig. 7B). Increases were particularly observed in ICOS+PD-1+ cells, which resembled expanded effector Th1-like CD4+ T cell (Fig. 2, archetype 5). This suggested that loss of CTLA-4 increased both the frequency of functionally active CD4+ effector cells and the expression level of cytokines they produce. On the other hand, CTLA-4 deficiency also increased the frequency of cytokine+ Treg cells but not cytokine expression levels (Fig. S7A). The frequencies of cytokine+ CD8+ T cells and the maximal cytokine expression levels were mildly affected by CTLA-4 loss (Fig. S7B). Together this suggested that extension of T cell phenotypic limits due to loss of CTLA-4 is associated with superphysiological cytokine output and aligned with the specific expansion of CD4+ T cell phenotypes due to CTLA-4 loss.
These data indicated that CTLA-4 loss increases maximal cytokine expression limits in CD4+ effector but not in regulatory or CD8+ T cells. The extension of CD4+ T cell phenotypes and the associated increases in cytokine output provide a possible cellular explanation for prior findings that depletion of CD4+ but not CD8+ T cells attenuates the lethal lymphoproliferative phenotype of Ctla4−/− mice (Chambers et al., 1997b). The absence of significant changes in cytokine output of Treg cells despite phenotypic extension in the absence of CTLA-4 supports findings that deletion of CTLA-4 in Treg cells decreases suppressive function (Wing et al., 2008).
CD4+ T cell archetypes are enriched following antibody blockade of CTLA-4
We next sought to address whether antibody blockade of CTLA-4 and PD-1 leads to similar dysregulation of T cell differentiation. We performed archetypal analyses on mass cytometry data of MC38 murine tumors treated with anti-CTLA-4 or anti-PD-1 therapies (Wei et al., 2017). Blockade of CTLA-4 specifically enriched cells associated with a T-BET+ TCF1+ CD4+ T cell archetype (Fig. 7C, S7E; archetype 1). Consistent with observations in knockout mice, no enrichment of CD8+ T cell archetypes was observed (i.e. no change in CD8+ T cell boundaries) due to anti-CTLA-4. This supported the notion of dysregulation of differentiation specifically in CD4+ T cells following anti-CTLA-4 therapy. On the other hand, PD-1 blockade led to enrichment of a PD-1+ PD-L1int CD8+ T cell archetype (Fig S7C-D; archetype 4). In contrast to the genetic studies, cells associated with each archetype were detected in both control and treated mice. This less extreme effect on phenotypic limits could be a result of incomplete loss of signaling due to antibody blockade (versus total loss of function in the genetic systems). In addition, immune cell states within the tumor microenvironment are highly diverse and occupy larger phenotypic spaces than in normal contexts (Azizi et al., 2018). Finally, we performed archetypal analyses on two cohorts of matched pre- and post-therapy peripheral blood samples from melanoma patients treated with anti-PD-1 therapies (Krieg et al., 2018). These analyses identified CD8+ T cell archetypes present at low levels prior to therapy, similar to that of normal donors, but enriched following therapy (Fig. 7D-E, S7F-G). These findings supported the notion that absence of CTLA-4 and PD-1 function dysregulates T cell differentiation.
Discussion
T cell differentiation generates a wide range of specialized cell types, however how the range of attainable cell states (i.e. phenotypes) is determined remains an open question. In other words, how do cellular inputs define what specialized T cell populations are generated to mediate immunological responses? Our studies revealed that: 1) T cell negative costimulation regulates the limits of T cell differentiation, a role related to, but distinct from its regulation of T cell activation, 2) CTLA-4 enforces boundaries on CD4+ T cell phenotypes, 3) PD-1 subtly restrains CD8+ T cell phenotypes, and 4) CTLA-4 constrains T cell phenotypes by imposing maximal expression limits during differentiation. Furthermore, the computational approaches applied here may be broadly useful to characterize phenotypic states and understand how molecular determinants of cellular differentiation are impacted by genetic variation and other perturbations.
Our results support the previously proposed ‘nuanced model’ of CD4+ T cell differentiation (O'Shea and Paul, 2010). In this model, T cell subsets represent a continuum of interrelated phenotypic states, defined by ratios of co-expression of lineage transcription factors, rather than discrete lineages. This fits well with the growing appreciation that CD4+ T helper cells are highly plastic (O'Shea and Paul, 2010; Zhou et al., 2009). Our data indicate that negative costimulation constrains the boundaries of the T cell phenotypic continuum. The notion of constraint on phenotypic limits is conceptually distinct from the idea that costimulatory signals skew T cell differentiation decisions (Bour-Jordan et al., 2003; Khattri et al., 1999; Sage et al., 2014; Wang et al., 2015; Wing et al., 2014), which is also supported by our findings. It remains unclear whether the same regulatory mechanisms control cell state boundaries and fate decisions between such cell states. It also remains to be assessed whether the expanded phenotypes represent stable terminally differentiated states, or rather transient intermediate states not normally attainable. Further investigation using complementary approaches such as single cell transcriptomics and epigenomics will shed more light on the complex architecture of T cell states and the variables that control cellular plasticity.
Our studies reveal that CTLA-4 and PD-1-mediated negative costimulation constrain divergent aspects of T cell differentiation. Whereas loss of CTLA-4 led to multiple breaches in CD4+ T cell phenotypic boundaries, loss of PD-1 leads to a subtle age-dependent expansion of CD8+ T cell phenotypes. These distinct effects are consistent with a model in which PD-1-mediated regulation is engaged only following an active immune response, whereas CTLA-4 regulation is induced immediately following T cell priming. Of interest is whether CTLA-4 regulates differentiation limits only at specific developmental times or constitutively through the lifetime of a T cell. Conditional deletion of Ctla4 during adulthood leads to a broad range of autoimmunity, but also paradoxically leads to resistance to experimental autoimmune encephalomyelitis (Klocke et al., 2016; Paterson et al., 2015). This suggests that CTLA-4 loss may lead to different outcomes depending on developmental stage and the properties of specific antigens. In addition, it remains unknown how costimulatory signals are integrated with other inputs. For example, cell extrinsic inputs (e.g. systemic cytokine levels) are likely to play a role in the regulation of phenotypic limits and represent part of the downstream effects of CTLA-4 loss.
It is not clear whether CTLA-4 prevents aberrant activation of low affinity clones in homeostatic conditions or restrains the activation of high-affinity clones within a desired biological range. Our T cell repertoire profiling provide some evidence for a model in which CTLA-4 restricts tonic activation (e.g. of promiscuous clones) by raising the signal threshold for activation. As the absence of N regions can lead to increased T cell promiscuity (Gavin and Bevan, 1995), the decrease in N region insertions in Ctla4−/− LN suggests that CTLA-4 normally constrains self-reactive promiscuous clones. Loss of CTLA-4 affects the TCRα thymic repertoire in the context of a fixed TCRβ (Verhagen et al., 2013). Whether this discrepancy reflects specific properties of the TCRα repertoire or differences in experimental systems remains unclear. Nonetheless, our observations raise the possibility that aberrant costimulation of self-reactive peripheral T cell clones enables their expansion and differentiation beyond normal limits. The antigen specificity of T cells associated with expanded phenotypes remains a key outstanding question.
The effects of CTLA-4 or PD-1 loss on T cell state are relevant to clinical oncology and suggest that alterations in T cell differentiation constraints may contribute to mechanisms of immune checkpoint blockade therapies. For example, we identified a T cell archetype that is analogous to ICOS+ Th1-like CD4+ effector T cells, which expand following anti-CTLA-4 therapy in preclinical and clinical settings (Chaput et al., 2017; Coutzac et al., 2017; Liakou et al., 2008; Wei et al., 2017). Furthermore, analyses on matched pre- and post-anti-PD-1 therapy peripheral blood samples revealed CD8+ T cell archetypes enriched following therapy. Finally, the recurrent skewing of the TCRβ repertoire due to loss of CTLA-4 raises the possibility that the antigen-specific immunogenicity induced by anti-CTLA-4 checkpoint blockade therapy may be predictable. While the therapeutic significance of effects on phenotypic limits remains to be addressed in more detail, these findings substantiate the notion that T cell differentiation is dysregulated due to antibody blockade of CTLA-4 and PD-1. Whether other costimulatory molecules constrain T cell differentiation and whether breaches of phenotypic limits lead to other changes in T cell function remain open questions.
In summary, these studies reveal that negative costimulation regulates T cell differentiation in addition to attenuating activation. Negative costimulation integrates with biological inputs from cytokine signaling and TCR signal strength to regulate peripheral T cell differentiation. Such mechanistic insights from these and future studies will be critical in guiding rational design of next-generation immunotherapeutic approaches and advancing our understanding of what biological cues and regulatory mechanisms allow the immune system to recognize a wide range of threats while simultaneously restraining self-reactivity.
STAR Methods
CONTACT FOR REAGENT AND RESOURCE SHARING
Further information and requests for resources and reagents should be directed to and will be fulfilled by the Lead Contact, James P. Allison (jallison@mdanderson.org)
EXPERIMENTAL MODEL AND SUBJECT DETAILS
Mice
Ctla4tm1All mice were previously generated (Chambers et al., 1997a). A heterozygous by heterozygous breeding scheme was used to generate experimental mice. Both heterozygous and wild-type littermates were analyzed as controls. Pdcd1 knockout mice (Pdcd1tm1.1Shr) were generated previously (Keir et al., 2007) and purchased from The Jackson Laboratory (021157). Mice were backcrossed once to C57BL/6J and then backcrossed to homozygous Pdcd1 mice to generate experimental mice. C57BL/6J mice were purchased from The Jackson Laboratory (000664). Male and female mice were analyzed in all experiments. The ages of mice analyzed in each experiment are denoted in the relevant figures. Experiments involving ‘young’ mice analyze mice ranging from 11-21 days and experiments involving aged adult mice analyze mice ranging from 2-6 months of age.
Icos Ctla4 double knockout mice with mutant alleles in cis were generated as described below. Experimental mice from generated using two breeding crosses. Ctla4+/−Icos+/− mice were intercrossed to generate homozygous double knockout mice (Ctla4−/−Icos−/−) and littermate controls. To generate CTLA-4 knockout mice bearing a single copy of the Icos mutant allele (ICOS competent), Ctla4+/− Icos+/− mice were crossed with the original unedited Ctla4+/−Icos+/+ mice (Ctla4tm1All). Aged matched mice from these crosses were utilized for experiments. These experimental crosses were performed with both the c.310_311insAA (192N) and c.309delG (230LL) mutant alleles. Similar observations were using the two mutant Icos alleles.
Mice were housed in an AAALAC-accredited specific pathogen free animal facility at The University of Texas MD Anderson Cancer Center in accordance with institutional guidelines and all animal experiments were performed in accordance with The University of Texas MD Anderson Cancer Center Institutional Animal Care and Use Committee (IACUC) guidelines.
METHOD DETAILS
Genotyping
Genotyping of Ctla4tm1All mice was performed by PCR as previously described (Chambers et al., 1997a) using primers (5’ AAACAACCCCAAGCTAACTGCGACAAGG 3’, 5’ CCAGAACCATGCCCGGATTCTGACTTC 3’, 5’ CCAAGTGCCCAGCGGGGCTGCTAAA 3’). The expected band sizes for the wild-type and mutant alleles are ~75 and ~150 bp, respectively. The Ctla4 genotyping was also used to type Ctla4 Icos double knockout mice given that the complete genetic linkage observed between the Ctla4 and Icos loci.
Pdcd1 knockout mice were genotyped by PCR using primers PD1 KO common 24743 (5’ CACTATCCCACTGACCCTTCA), PD1 KO WT rev (5’ AGAAGGTGAGGGACCTCCAG), and PD1 KO Mut rev (5’ CACAGGGTAGGCATGTAGCA). The expected band sizes for the wild-type and mutant alleles are 418 and 350 bp, respectively.
In vivo assessment of cellular proliferation
Cellular incorporation of 5’ iododeoxyuridine (IdU) was used to identify actively proliferating cells in vivo. 50ul of 5mg/ml IdU diluted in PBS were administered by intraperitoneal injection (i.p.) 30 minutes prior to sacrifice of animals. For animals older than 8-weeks, 100ul of IdU solution was injected. Samples were stained with antibody cocktails (described in greater detail below) and analyzed on a mass cytometer. IdU+ cells were identified using absolute signal based both the distribution of IdU (bimodal) and prior experimental data that defined an approximate background level of IdU.
Mass cytometry antibodies
Metal conjugated antibodies were purchased from Fluidigm or purified unlabeled antibodies (in BSA and carrier free format) were metal-labeled in house using X8 polymer conjugation according to manufacturer’s protocol (Fluidigm). Antibody conjugations were performed at 100μg or 200μg scale and the resultant conjugated antibodies diluted to a final concentration of 0.5mg/ml in antibody stabilizer supplemented with 0.05% sodium azide (Candor Biosciences). Platinum conjugations were performed using a modified protocol as previously described (Mei et al., 2016). Antibodies were washed thrice in R buffer (Fluidigm) on a 50kDA spin column (EMD Millipore) and then incubated in 4mM TCEP diluted with R buffer for 30 minutes at 37°C. Antibody was then washed twice with C buffer and incubated with 100μM (400μl) of desired monoisotopic cisplatin (Fluidigm) for 90 minutes at 37°C. Antibody was then washed with W buffer fo ur times prior to elution in antibody stabilizer solution. Mass cytometry panels are detailed in Tables S5-7. We designed staining panels with the specific goals of enabling comprehensive classification of peripheral T cell populations and identification of alterations in T cell differentiation. As such these mass cytometry panels included activation markers (e.g. CD44, CD62L, PD-1, CD69, ICOS), surface differentiation markers (e.g. KLRG1, CD127), and importantly, lineage defining transcription factors (e.g. TBET, EOMES, GATA3, BCL6, RORγT) as well as additional transcription factors involved in T cell differentiation (e.g. BATF, HELIOS, IRF4, RUNX3).
Analysis of peripheral lymph nodes by mass cytometry
Single cell suspensions of peripheral lymph nodes were isolated and pooled from each sample. For analyses relating to Figures 1 and 2, inguinal, axillary, and brachial lymph nodes from 13-day old Ctla4 knockout mice were dissected for analysis. For analyses of unimmunized and immunized mice draining (inguinal) lymph nodes were dissected for analysis. For analyses of Pdcd1 knockout mice, inguinal, axillary, and brachial lymph nodes were dissected and pooled for analysis. For analyses of Ctla4 Icos double knockout and associated control mice, inguinal and axillary lymph nodes were dissected for analysis. Lymph nodes were mashed through a 70μm filters into RPMI-1640 supplemented with 10% FBS using the back of a plastic syringe. Once prepared, single cell suspensions were processed for mass cytometry analysis using a protocol similar to that previously described for analyses of tumor infiltrating lymphocytes (Wei et al., 2017).
Briefly, single cell suspensions were washed twice with FACS buffer and total cell concentration determined using a Cellometer (Nexelcom). 2.5×10⁶ cells were incubated at 4°C for 10 minutes with 2% of each bovine, murine, rat, hamster, and rabbit serum PBS supplemented with 25μg/mL 2.4G2 antibody. Cells were then washed and incubated with the surface antibody cocktail at 4°C for 30 minutes in a 50 μL total volume. At the end of the surface staining incubation, cells were incubated with 2.5μM 194Pt monoisotopic cisplatin for 4°C for 1 minute prior to washing by adding 50ul of 5μM 2X solution. 600μl FACS buffer was then immediately added and cells were washed twice more. Sampled were then individually barcoded using palladium metal barcoding reagents according to manufacturer’s protocol (Fluidigm). An entire single use barcode aliquot was used per sample. Following the barcoding and wash step, samples were then combined. The combined sample was then fixed and permeabilized using the FoxP3 fix and permeabilization kit according to manufacturer’s protocol (eBioscience). Following the 30 minute fixation and associated wash steps, the sample was then incubated with the intracellular stain antibody cocktail for 30 minutes at room temperature. Cells were then washed twice with FoxP3 permeabilization buffer, twice with FACS buffer, and incubated overnight in 1.6% PFA PBS with 62.5nM Iridium nucleic acid intercalator (Fluidigm). Cells were then washed twice with 0.5% BSA PBS, filtered, and washed twice with 0.1% BSA water prior to analysis. Samples were diluted to a concentration of approximately 0.75×10⁶/ml in water with 10% EQ4 beads for acquisition. Samples were analyzed using a Helios mass cytometer using the Helios 6.5.358 acquisition software (Fluidigm).
Mass cytometry data processing
Mass cytometry data files were concatenated and normalized to EQ4 bead signal using the Helios 6.5.358 acquisition software (Fluidigm). Normalized data were then debarcoded to deconvolve individual samples using the Helios 6.5.358 acquisition software or stand-alone Debarcoder software (Fluidigm). Data files associated with individual samples were then utilized for downstream analyses. Data were manually gated Live CD45+ Lin− CD3ε+ T cells using FlowJo (TreeStar). Clustering was applied to further remove any non CD4+ or CD8+ T cells for input into archetypal analysis. See Tables S1 and S2 for analyses performed on each respective mass cytometry dataset. Mass cytometry datasets will be made publicly available through FlowRepository (https://flowrepository.org).
Mass cytometry data analysis
The initial steps of data processing and analysis were similar to previously described approaches (Levine et al., 2015; Wei et al., 2017). T cell populations were then exported as separate files for additional analyses including t-SNE dimensionality reduction (van der Maaten and Hinton, 2008) and PhenoGraph clustering (Levine et al., 2015). These algorithms were run in Matlab or using the graphical interface Cyt (Amir el et al., 2013). A standard value of k = 30 was used for clustering. PhenoGraph is a well-validated clustering approach, however we further validated that cluster identification is robust to changes in input parameters (k nearest neighbors) in this data. To establish this, we re-ran PhenoGraph by changing the parameter k, which determines the number of nearest neighbors used in the construction of the k-nearest neighbor graph and measured pairwise cluster similarity using the Rand Index (Rand, 1971) and normalized mutual information (NMI) (Danon et al., 2005). Both the Rand index and NMI scales between 0 and 1, with 1 indicative of perfect similarity. We obtain an average Rand index = 0.8597 and NMI = 0.8839 for the T cell clusters in the context of Ctla4 knockout (Fig. S1D).
PhenoGraph clustering and t-SNE dimensionality reduction analyses were performed agnostic of CTLA-4 expression in all experiments. For analyses involving Icos Ctla4 double knockout mice, clustering and t-SNE analyses were performed agnostic of CTLA-4 and ICOS expression. Similarly, for analyses involving Pdcd1 knockout mice (Fig. S5), clustering and t-SNE were performed agnostic of PD-L1 expression (unless otherwise noted). For immunization experiments, we focused on clusters present at 0.1% or higher frequency
Given that clusters (and archetypes) were identified and defined in an unsupervised manner, the biological relevance of these high-dimensional phenotypes was inferred based on expression patterns of key markers and reference phenotypes of known T cell lineages (e.g. Th1 CD4 effectors, Treg cells). Comparisons of both the absolute expression level and the expression value normalized to the minimal and maximal mean expression values across T cell populations was utilized. Key observed differences between high-dimensional phenotypes were then qualitatively described in the text to facilitate biological interpretation.
Archetype analysis
Archetype analysis is an unsupervised approach to study geometry of high-dimensional data (Cutler and Breiman, 1994). The goal of archetype analysis is to find a convex geometrical object such as a triangle or a tetrahedron (a polytope in general) that best encapsulates the data. The vertices of the resulting polytope, called the archetypes, characterize the extreme states in the data. Recently, archetype analysis has been proposed as a tool to analyze high-dimensional biological data sets (Hart et al., 2015; Korem et al., 2015; Sheftel et al., 2013), in addition to dimensionality reduction and clustering. In the context of single-cell data, the cells typically occupy a high-dimensional geometry, phenotypic space, where each cell is expressed as a vector of features that determine the phenotype of the cell. In archetype analysis, we seek to obtain a convex polytope that best encloses the observed phenotypes, whose vertices are the extreme phenotypes present in the data.
Archetype analysis provides a unique opportunity to investigate changes to the phenotypic space resulting due to perturbation. In normal conditions, regulatory mechanisms such as feedback loops and checkpoints maintain a controlled gene expression profile constraining the structure and boundaries of the phenotype space. However, under perturbations, these regulatory mechanisms could be deregulated giving rise to an expansion or disruption in certain regions of the space. In such circumstances, archetype analysis can be useful to identify and characterize any new extremities. Here we show that, by studying the neighborhood of the archetypes, archetype analysis enables us to quantitatively assess how much of an otherwise normal phenotypic space has been breached. Thus, we reasoned that Archetype Analysis is a suitable approach to study potential aberrant expansion in the context of Ctla4 knockout and Pdcd1 knockout. These analyses aim to identify boundaries of continuous populations and thus complement clustering approaches, which aim to identify the centers of discrete populations (Fig. S5H, S6A). It should be noted that archetype analysis, as with other approaches aiming to classify cellular populations from proteomic data, is necessarily predicated on, and thus limited by, the protein targets analyzed; however, the mass cytometry panel used was designed to be as comprehensive as possible.
To find a polytope that best fits the data, the archetypes should be representatives of the phenotypic space. To achieve this, each archetype is first expressed as a convex combination of the data points. Mathematically, given n cells in d dimensions , where , each archetype , where cij are the convex coefficients, 0 ≤ cij ≤ 1, and j = [ 1,…, p ] denotes p archetypes. In other words, each archetype is a probabilistically weighted sum of the data points. The set of archetypes can be represented as Z = XC, where is the data matrix, is the coefficient matrix and is the matrix of archetypes. On the other hand, since we are interested in characterizing the extreme states in the data, we need the archetypes to be on or near the convex hull of the data. This is achieved by requiring each data point to be expressed as a convex combination of the archetypes. Therefore, given p archetypes , where , each cell , where sji are the convex coefficients, 0 ≤ sji ≤ 1 and . In a compact form, where is the matrix of coordinates sji. Thus, the first condition requires each archetype to be a convex combination of the data points thereby pushing the archetypes in towards the data while the second condition requires each data point to be a convex combination of the archetypes thereby pushing the archetypes towards the boundary to encapsulate the data within their convex hull. The goal in archetype analysis is to optimize both of these criteria. Since we aim to re-approximate the data from the archetypes, the optimality criteria is set to the L2-norm of the difference between original data (X) and the approximated data (), that is, . The optimization can be performed using gradient descent on a constrained space (due to constraints placed on C and S). In particular, we utilize Principal Convex Hull Analysis (PCHA)(Mørup and Hansen, 2012), which has previously been used successfully in single-cell data analysis(Korem et al., 2015). The optimized set of archetypes will comprise the vertices of a polytope that best encapsulates the data.
To determine the optimal number of archetypes, we consider the error normalized by the norm of the original data ∥X∥2 for various number of archetypes and take the knee-point of the curve (Fig. S2B). To compute the knee-point, at each point along the error curve, we fit two straight lines one to the left and one to the right of the point. The knee-point is derived as the bisection point where the root-mean-squared error of the two fitted lines is minimum.
CD4+ and CD8+ T cell compartments were analyzed separately given the bifurcation of CD4+ and CD8+ T cells occurs in the thymus and thus is not captured by these analyses of peripheral lymph nodes. To determine cells belonging to the CD4+ compartment, we use PhenoGraph (Levine et al., 2015) to first cluster the data and consider only those clusters with high mean CD4+ expression and low mean CD8+ expression. Furthermore, this also serves as a filtering step to remove any noisy and outlier cells making our analysis more robust. The removal of such technical noise in the data using this clean up step is particularly important for archetype analysis and path reconstruction given the sensitivity to technical artifacts and short-circuits. Thus, using pre-existing knowledge of the biological system (i.e. mutually exclusive expression of CD4+ and CD8+ co-receptors in peripheral tissues) the robustness of this analysis is significantly increased. We repeat the same filtering procedure for CD8+ compartment, where we consider only clusters with high mean CD8+ expression and low mean CD4+ expression.
We confirmed that archetype identification is highly robust and identifies similar archetypes upon independent runs. To test this, we ran Archetype Analysis 50 times with a random restart every time and correlated the expression of the obtained archetypes between each pair of iterations. The output of each iteration is a matrix of p archetypes and d proteins but the ordering of the archetypes could be altered between iterations. So, given archetype matrices from two different iterations, we first find the closest match of each archetype in one iteration to the other. For this, we compute the distance between each archetype from one iteration to all archetypes from the other iteration. The best match then minimizes the sum of the pairwise distance, which can be obtained using the Kuhn-Munkres algorithm (Kuhn, 1955). Once the archetypes are matched, we compute the correlation per entry between the two archetype matrices and report the average correlation over all possible pairs (among the 50 iterations). In all datasets, we find a Spearman correlation of > 0.96 with a standard deviation of <0.08, indicating robustness of the identified archetypes.
Genotype specific densities around archetypes
Once the archetypes have been computed, we can characterize their neighborhood (of similar cells) to investigate if it is enriched for cells with specific genotype. Since the archetypes characterize extreme phenotypic states, an abundance of cells of a certain genotype would indicate genotype specific expansion towards the archetypal phenotype. In the present context, we are primarily interested in KO-specific expansion. To quantify the genotype specific abundance, we compute cell density around each archetype defined as the percentage of cells per genotype within a fixed distance from the archetype. This can be generalized to study the genotype specific composition as a function of distance from an archetype (Fig. S2E). To do this, we first calculate graph distance from each archetype to all the other cells. Graph distances have been shown to robustly capture the phenotypic distance between cells as opposed to standard Euclidean distance, which is susceptible to representing two phenotypically distinct cells as being similar due to non-linearity present in the data (Bendall et al., 2014; Haghverdi et al., 2015; Haghverdi et al., 2016; Setty et al., 2016). Therefore, we use a graph distance to ensure that only phenotypically similar cells represent the immediate vicinity. Then the cells are binned based on their distance from the archetype (as percentile of the maximum distance) and finally the percentage of cells per genotype is determined at each bin.
In particular, we use diffusion distance (Coifman and Lafon, 2006; Nadler et al., 2006) to measure the phenotypic distance from an archetype to all the other cells. Diffusion distance is a graph-based approach to robustly measure distances between points in a high-dimensional space, derived directly from the structure of the data, which stems from a family of non-linear dimensionality reduction approaches called diffusion maps (Coifman and Lafon, 2006). Briefly, diffusion maps transform original high-dimensional data into a lower dimensional Euclidean space by accounting for any non-linear dependencies between the features. While single-cell measurements are high dimensional, the underlying data is often driven by only a few key variables (latent or observed) rendering the data constrained on a low-dimensional manifold. In this context, diffusion maps have been helpful to unravel the true underlying low-dimensional structure of data (Azizi et al., 2018; Haghverdi et al., 2015; Setty et al., 2016). Diffusion distance is then defined as the distance in the new Euclidean space (Coifman and Lafon, 2006; Nadler et al., 2006), which in our context can be used as the phenotypic distance between cells in the original space.
To calculate the diffusion distances, we begin by computing diffusion maps. First, we construct a k-nearest neighbor graph (G) on the data (k = 30). The distances are first symmetrized, G = G + G′ and then converted into an affinity matrix (A), utilizing an adaptive Gaussian kernel (van Dijk et al., 2018), such that the ijth entry of A is given by , where ∥i – j∥ is the distance between cells i and j and σ is the standard deviation of the Gaussian kernel set to the distance to its (k/3)th neighbor. This allows the kernel to adapt to varying density along the phenotype space (van Dijk et al., 2018). We utilized this adaptive kernel to mitigate any potential effects of differences in cell density along the manifold. The affinity matrix is finally normalized into a Markov matrix (M), where . The Markov matrix M is row-stochastic (each row sums to 1) and each entry (p, q) quantifies the probability of a random walk at the pth state transitioning into the qth state in one step. The eigenvectors of the Markov matrix M are called diffusion components (Fig. S6A). Euclidean distance in this new space, where each axis is specified by a diffusion component, scaled by a power of the corresponding eigenvalue, is defined as the diffusion distance. Mathematically, let ψa denote the ath eigenvector of M and λa denote the corresponding eigenvalue, then the diffusion distance between cells i and j is given by , where we take N = 50, which is sufficiently large to capture all important components of the data.
We use spectral entropy (Moon et al., 2017) as a function of t to obtain its optimal value. Spectral entropy quantifies the variability in the amount of information explained by the eigenvectors. It is defined as the entropy of normalized eigenvalues, since each eigenvalue quantifies the amount of information contained in the corresponding eigenvector. Mathematically, , where , where λa is the ath eigenvalue of M. We note that, since ∣λa∣ ≤ 1 for all a, raising the eigenvalues to higher powers reduces the magnitude of the smaller eigenvalues, which in turn reduces the contribution of the corresponding eigenvectors in the computation for diffusion distances. Typically, smaller eigenvalues are reflective of noise present in the data, hence raising them to higher power amounts to removing noise. Initially, due to noise at t = 1, the variability explained by the eigenvectors could be artificially high. This can be quantified by measuring spectral entropy at t = 1. As we increase t, the noise present in the data is reduced, which is reflected in the decrease in spectral entropy. For small values of t the major structure in the data is still in tact and the loss in spectral entropy is slow since we are only removing unwanted noise from the data. However, as t increases indefinitely, even the informative eigenvalues approach 0. Since this would correspond to a loss of major structure in the data, we reasoned that this would be reflected as a large reduction in the spectral entropy. Thus, we chose the optimal t as the elbow point of the log10(spectral entropy) plot against log10(t). We obtain toptimal = 14 for CD4+ T cells in the Ctla4 knockout dataset, toptimal = 10 for CD8+ T cells in the Ctla4 knockout dataset, toptimal = 13 for CD4+ T cells in the Pdcd1 knockout dataset and toptimal = 13 for CD8+ T cells in the Pdcd1 knockout dataset.
Robustness of diffusion distances to parameters
The volume computation, defined as the number of cells within a certain radius of the archetype, relies on the diffusion distances measured from each archetype to all the cells. Therefore, we assess the robustness of diffusion distances to the parameters. First, we show robustness to t by re-computing diffusion distances for various values of t. In particular, we correlate the diffusion distances from an archetype to all the cells for various values of t (with k = 30). We report the correlation averaged over all archetypes (Fig. S2C). Around the value of t used (t < 20) the average correlation is high (average Pearson correlation > 0.90 for Ctla4-KO CD4+ archetypes, 0.81 for Ctla4-KO CD8+ archetypes, 0.88 for Pdcd1-KO CD4+ archetypes and 0.83 for Pdcd1-KO CD8 archetypes). The average correlation slightly declines for t > 20. Overall, average correlation > 0.77 Ctla4-KO CD4+ archetypes, 0.70 Ctla4 -KO CD8+ archetypes, 0.74 Pdcd1-KO CD4+ archetypes, and 0.64 Pdcd1-KO CD8+ archetypes, indicating that the results are robust around the value of optimal t. Second, to show robustness of our results to the number of nearest neighbors (k), we compute the correlation of the diffusion distances (at t = toptimal) from an archetype to all the cells for various values of k. We then report the correlation averaged over all archetypes (Fig. S2D), average correlation > 0.9 for all cases.
Constructing phenotypic differentiation paths
Using clustering and archetypal analysis, we have shown that in the absence of CTLA-4, there is a substantial expansion in the CD4+ compartment in an otherwise healthy system; and likewise, that there is a subtle expansion in the CD8+ compartment in the absence of PD-1. We found three archetypes in the Ctla4 knockout dataset (data described in Fig. 2) and one archetype in the Pdcd1 knockout dataset (data described in Fig. 5) that were specifically associated with cells derived from Ctla4 and Pdcd1 knockout mice, respectively. To understand the order of molecular events leading to such expanded population(s), we constructed paths along the data manifold that likely reflect the differentiation trajectories cells could potentially follow to reach the aberrant archetypes. For this, we first defined an archetype (Archetype 4 for CD4+ T cells in the Ctla4 knockout dataset and Archetype 1 for CD8+ T cells in the Pdcd1 knockout dataset) as naïve archetype based on their phenotypes. Then we sought to construct possible differentiation paths from the naïve archetype to all other archetypes.
To achieve this, we begin by constructing a k-nearest neighbor graph based on the diffusion distance (k = 30). We note that a major obstacle while constructing graph-based trajectories is short-circuits, which could lead to misleading conclusions if not handled properly (Bendall et al., 2014). This is already largely mitigated by constructing the k-nearest neighbor graph based diffusion distance (Setty et al., 2016). To increase robustness and mitigate this even further, we construct an ensemble of graphs, which has previously been shown to be effective against short-circuits (Bendall et al., 2014). In particular, from the original graph where each cell has 30 neighbors, we randomly subsample m = 6 neighbors. The resulting sparser graph is then symmetrized to obtain an undirected graph. Finally, we compute shortest path (using Dijkstra algorithm) from the naïve archetype to all the other archetypes. We repeat the procedure (of randomly subsampling neighbors and constructing shortest paths) 100 times (Fig. 6A, S6A). At each iteration, we get an expression profile of a protein along the shortest path, which we smooth using a sliding Gaussian window (Bendall et al., 2014; Setty et al., 2016). To do this, the cells along the shortest paths were first linearly mapped to the unit interval [0, 1], which was then partitioned into 100 equal sized bins. Then the weighted average of each marker is computed using a Gaussian filter centered at each bin (Bendall et al., 2014; Setty et al., 2016), given by , gi is the marker expression of cell i, is the mean marker expression value in bin j and σ is the bandwidth of the Gaussian chosen using Silverman’s rule of thumb (Härdle and Müller, 1997). The smoothed average at bin j is then given by . Finally, we compute the derivative of the resulting smoothed expression profile, and average the derivatives over all the iterations (Fig. 6B, S6C-D). To facilitate robust biological interpretations that are not biased by technical noise in protein markers with very low signal, we filtered out proteins whose averaged expression over all the iterations did not exceed an arcsinh transformed value of 0.5.
We demonstrate that our results are robust to the choice of subsample size (m). For this, we repeat the above procedure for various values of m and report the correlation of the mean expression averaged over all the proteins (Fig. S6B). We note that the average correlation is high (e.g. > 0.96 for archetypes 5, 6 and 7). It is important to note that these analyses are predicated on the assumptions that the dataset represents an uninterrupted sampling of cells between archetypes a and b, protein expression changes are continuous in nature, and that cellular differentiation takes the shortest path possible. Similar approaches have been previously used to robustly reconstruct cellular differentiation pathways such as B cell maturation and thymocyte differentiation (Bendall et al., 2014; Setty et al., 2016).
Demarcating the boundary of normal phenotypes
To identify molecular events that are permissible in the expanded states, which would be absent in a normal system, we seek to demarcate the boundary of normal phenotypic manifold (Fig. 6C). For this, we first take the average shortest path from the ensemble of 100 shortest paths. To do this, we computed the average protein expression across the ensemble of paths, and correlated it with protein expression along each of the constituent path. The average shortest path is defined as the one that maximizes this correlation. For each cell along the shortest path we find all the cells in its neighborhood that are within 0.5 percentile diffusion distance (compared to the maximum). We then compute the genotype specific composition at each step along the path. This is then plotted as a function of the trajectory towards each archetype. To approximate the boundary position, we demarcate the position along each trajectory for which the frequency of both wild-type and heterozygous derived cells are less than 0.1%. This boundary is then drawn as a visual guide on each plot.
Transcription factor ratios along differentiation paths
To identify where potential cell fate choice decision events occur along differentiation trajectories to each archetype, we assessed the expression ratios of key pairs of transcription factors. T cell fate decisions are thought to be in large part driven by changes in the balance between lineage transcription factors. For example, the equilibrium between TBET and GATA3 is a critical determinant of Th1 versus Th2 fate choice (Antebi et al., 2013; Hwang et al., 2005; Usui et al., 2006; Zhu et al., 2012). Thus, we calculated the ratios between key pairs of transcription factors to infer where cell fate decisions occur. However, simply computing the ratios of transcription factor expression levels is likely to be problematic given that many events are likely to have 0 values (and thus, ratios may harbor zeros in the denominator). To mitigate this problem, we define the angle between two TF profiles as, . This approach has previously been used successfully to study a continuum of T cell fates (Antebi et al., 2013). In the present context, characterizing α continuously along the differentiation paths can help to identify cell fate choice events. Because we were primarily interested in identifying where lineage specification decisions events take place during differentiation (i.e. pseudo-time) towards archetypes (as opposed to identifying new relationships in de novo fashion), we focused on relationships between lineage transcription factors known to have functional relationships. Specifically, we interrogated the ratios in expression between TBET and GATA3 (Hwang et al., 2005), TBET and BCL6 (Nurieva et al., 2009; Yu et al., 2009), and FoxP3 and RORγT (Zhou et al., 2008). We utilized this approach to analyze differentiation towards CD4+ archetypes 5-7 identified in the context of loss of CTLA-4, with particular interest in understanding where cell fate decisions (as defined by transcription factor ratios) occurs relative to the expansion of normal phenotypic boundaries due to loss of CTLA-4. Because these analyses were guided by prior knowledge, it remains a possibility that we did not investigate the pairs of transcription factors most relevant to differentiation. Nonetheless, we used this approach to identify cell lineage choice decisions points.
To achieve this, we first take the average shortest path (defined as the trajectory along which the sum of the Pearson correlations of each protein expression against the average protein expression is maximum) over the ensemble previously constructed. Then, for each cell along the shortest path we find all the cells in its neighborhood that are within 0.5 percentile diffusion distance (compared to the maximum). In each of thus constructed neighborhoods along the differentiation path, we compute α for each single cell. The result is then smoothed using a sliding Gaussian window (Bendall et al., 2014; Setty et al., 2016). For this, cells along the average shortest path were first linearly mapped to the unit interval [0, 1], which was then partitioned into 100 equal-sized bins. The weighted average of α is computed using a Gaussian filter centered at each bin, given by , αi is the angle for cell i, , is the mean alpha in bin j and σ is the bandwidth of the Gaussian chosen using Silverman’s rule of thumb (Härdle and Müller, 1997). The smoothed average at bin j is then given by , as shown in Fig. 6D.
TCR sequencing and analysis
Whole lymph node, heart, and thymic tissue were harvested from young (between 11 and 21 days old) Ctla4−/−, Ctla4+/−, and Ctla4+/+ littermate mice and snap frozen in liquid nitrogen. Tissue were homogenized using a TissueLyser II (Qiagen) and genomic DNA was isolated using DNeasy Blood and Tissue Kit (Qiagen). Genomic DNA was sequenced at survey level using ImmunoSeq (Adaptive Biotechnologies). Analysis of TCR sequencing data was performed using the Adaptive Biotechnologies Analyzer. A potential limitation of these analyses is the low infiltration of heart tissue in littermate controls. Clonality was defined as the inverse of normalized Shannon entropy. Shannon entropy values range from 0-1, with 1 representing a monoclonal population. Frequencies of individual TCRvβ segments were identified and exported on a per mouse basis for further statistical analysis. Mann-Whitney Test comparisons of TCR clonotypes were performed in MATLAB. ImmunoSeq data will be made publicly available through Adaptive Biotechnologies Analyzer.
Immunization
Young (between 9 and 15 days old) Ctla4−/−, Ctla4+/−, and Ctla4+/+ littermate mice were randomized in a 1:1 ratio to the unimmunized group or immunized with 50ug ovalbumin emulsified in Complete Freund’s Adjuvant (CFA) for a final concentration of 50% CFA (InvivoGen). Immunization was performed by injecting 100μl of OVA-CFA emulsion subcutaneously in the flank. Notably, no overt phenotype is observed in Ctla4−/− mice at this age, which allows for randomization. Unimmunized and immunized mice were co-housed for the duration of the experiment. The draining inguinal lymph node was harvested for analysis 6 days post-immunization (days 15 to 21, depending on age at immunization) and analyzed by mass cytometry.
Generation of an Icos mutant allele in cis with Ctla4 mutant allele
We utilized a CRISPR gene editing approach to generate double knockout mice given that Icos and Ctla4 exhibit complete genetic linkage. Candidate gRNA were produced and cutting efficiency assessed in vitro using the Cel1 assay (Sigma-Aldrich). gRNA (target sequence: CAGAAGTAATAGCTTCCCTGGG; Sigma-Aldrich, MM0000353415) was utilized based on a 7% cutting efficiency. Male Ctla4+/− mice were crossed with female wild-type C57BL/6J mice. Embryos were harvested and injected with gRNA and Cas9 mRNA (Sigma-Aldrich). The MD Anderson Genetically Engineered Mouse Facility (GEMF) performed embryo harvest, injection, and initial animal husbandry. Mice were then backcrossed to wild-type C57BL/6J mice purchased from The Jackson Laboratories in order to identify only genetic editing of Icos that occurred in cis with the Ctla4 mutant allele.
To screen for gene editing events, PCR amplicons containing the Icos target site were analyzed by Sanger sequencing (flanking and sequencing primers; forward 5’CACAATGGAGGTGTACAG, reverse 5’GAGCTGCTGTCAACTACTTC). Candidate founders identified based on mismatched chromatograms at the target site, indicative of a gene editing event. To determine the sequence of the edited Icos allele, PCR amplicons were cloned into the pCR-Blunt II-TOPO vector using the Zero Blunt TOPO PCR cloning kit per manufacturer’s protocol (Invitrogen, Cat#: 45-0245). Plasmid DNA was isolated from six colonies from each candidate founder (Qiagen, Cat#: 27106) and analyzed by Sanger sequencing using Sp6 and T7 primers. Several frameshift alleles at the targeting cut site (exon 2) were identified by this PCR-based targeting sequencing of the Icos locus.
To determine if off-target editing had occurred in these founder lines, we performed whole-exome sequencing (WES). These mice were the result of a backcross to C57BL6/J to ensure that the Icos mutant allele was in cis with the mutant Ctla4 allele, however due to this backcross, the frequency of off-target edits is likely underestimated as some off-target event may have segregated away. Nonetheless, this approach allowed for the confirmation that allelic disruption had only occurred in Icos in the lines to be further analyzed. Of the 5 founder mice analyzed by WES, 3 contained multiple additional frameshift mutations in other genes and were excluded from further analyses (Table S4). Supportive of a sequence-specific off-target effect, multiple off-target events were recurrently observed. We further analyzed two of the transgenic mouse lines, c.310_311insAA (192N) and c.309delG (230LL), which displayed specific editing of only the Icos locus.
Whole exome sequencing and analysis
Genomic DNA was isolated from tails of Ctla4 Icos double knockout mice using the DNeasy Blood and Tissue kit (Qiagen). Libraries and whole exome sequencing (WES) was performed at the MDACC Sequencing and Microarray Facility (SMF). Sequencing was performed using a HiSeq (Illumina). WES data will be made publicly available through Sequence Read Archive (SRA; STUDY Accession SRP128135).
The quality of WES data was assessed using fastQC. The data was aligned using the Burrows-Wheeler Alignment Tool (BWA) using the GRCm38 murine reference genome (Li and Durbin, 2009). Picard was used to convert SAM files to BAM files, sort and mark duplicates. BAM files were then realigned and recalibrated using Genome Analysis Toolkit (GATK) (Van der Auwera et al., 2013). The Mouse Genomes Project SNP and indel Release Version 5 were used as the known indels and SNPs for realignment and recalibration. These VCF files were downloaded from Sanger Institute FTP. VarScan2 was used to call the mutations without matched normal samples (Koboldt et al., 2012). Data were annotated by ANNOVAR using NCBI Reference Sequence Database (Wang et al., 2010). R was then used to process the output file. Heterozygous Icos mutations were detected in all samples and all alleles identically matched the corresponding sequence identified using PCR-based targeted sequencing of the Icos locus.
In vitro restimulation assays
Single cell suspensions of lymph node tissue were obtained from 11-12 day old Ctla4 knockout and littermate control mice. Inguinal, axillary, and brachial lymph nodes were pooled from each mouse. 5 × 10⁵ cells were plated in U-bottom 96-well cell culture plates in 100ul RPMI-1640 supplemented with 10% FBS, L-glutamine, and P/S. Phorbol 12-myristate 13-acetate (PMA)/ionomycin cell stimulation cocktail (ThermoFisher, 00-4970-93) and monesin/Brefeldin A protein transport inhibitor cocktail (ThermoFisher, 00-4980-93) were added to the culture per manufacturer’s recommendation (diluted to 1X from 500X stock concentrations). Unstimulated (no PMA/Ionomycin or protein transport inhibition) samples from both control and KO genotypes were also plated as control samples. Samples from individual mice were plated in technical triplicate. Cells were restimulated for 4 hours at 37 degrees and then transferred to ice for further staining and processing as described below.
Flow cytometry
Single cell suspensions from LN tissue were stained and analyzed on a LSRII (BD) to confirm that the frameshift genetic lesions in Icos resulted in loss of ICOS protein expression. ICOS expression was assessed by flow cytometry using a panel consisting of CD45.2-AlexaFluor700 (clone 104, eBioscience 56-0454-82), CD4-APC-eFluor 780 (clone GK1.5, eBioscience 47-0041-82), CD3ε-PerCP-Cy5.5 (clone 145-2C11, eBioscience 45-0031-82), CD8-e450 (clone 53-6.7, eBioscience 48-0081-82), CD19-BV650 (clone 6D5, Biolegend 115541), Live/Dead fixable blue (ThermoFisher/Life Technologies L23105), and ICOS-PE (clone 7E.17G9, eBioscience 12-9942-82) or Isotype-PE (Rat IgG2b-PE, clone eB149/10H5, eBioscience 12-4031-82). ICOS expression was analyzed in CD4+ and CD8+ T cells based on manual gating in FlowJo, with negative expression defined by an FMO isotype control.
For flow cytometry analysis of restimulated lymphocytes, cells were blocked using PBS with 2% of each fetal bovine, mouse, rabbit, rat, and hamster serum and 25 ug/ml 2.4G2. Cells were washed once with FACS buffer and stained with surface stain cocktail containing live/dead stain fixable blue for 30 minutes at 4 degrees Celsius. Following two FACS buffer washes, cells were fixed using BD cytofix/cytoperm kit for 20 minutes at 4 degree Celsius per manufacturer’s protocol. Following two washes with permeabilization wash buffer, cells were stained with an intracellular stain antibody cocktail for 30 minutes at 4 degrees Celsius. Cells were then washed twice with permeabilization buffer and subsequently FACS buffer. Samples were then analyzed using a LSR II (BD). Surface antibodies included CD3ε BV785 (clone 145-2C11, BD 564379), PD-1 BV421 (clone 29F.1A12, Biolegend 135221), CD19 BV510 (clone 6D5, Biolegend 115545), CD44.2 BV711 (clone 104, BD 563685), ICOS FITC (clone 7E.17G9, eBioscience 11-9942-82), CD4 AF532 (clone RM4-5, Biolegend 100548), CD25 AF700 (clone PC61.5, eBioscience 56-0251-82), and CD8a APC-Cy7 (clone 53-6.7, Biolegend 100714). Intracellular antibodies included IL-2 BV605 (clone JES6-5H4, Biolegend 503829), TNFa PerCP-Cy5.5 (clone MP6-XT22, Biolegend 506322), IFNγ PE (clone XMG1.2, eBioscience 12-7311-82), IL-17A PE-CF594 (clone TC11-18H10, BD 562542), and IL-10 APC (clone JES5-16E3, eBioscience 17-7101-82).
For analysis of restimulation flow cytometry data, a conventional gating strategy was utilized to identify subpopulations of CD4+ T cells that enrich for cells (i.e. phenotypes) that are associated with phenotypically expanded populations identified in mass cytometry experiments. Guided by phenotypes observed in mass cytometry analyses cells were gated as live/dead- CD45+ CD19− CD3ε+ CD8− CD4+ CD44+ CD25− and then subsequently subgated as ICOS+PD-1−, ICOS+PD-1+, ICOS−PD-1+, or ICOS−PD-1−. Subpopulations with ICOS+PD-1−, ICOS+PD-1+ enrich for CD4+ archetypes 7 and 5, respectively (See Figure 2). Cells positive for each cytokine were then identified within each subpopulation. Gating for individual cytokines was guided by the cytokine expression levels observed in unstimulated samples. Similar analyses were employed to interrogate the cytokine profile of regulatory (here defined as CD25+) CD4+ T cells as well as CD8+ T cells. The relative frequency and mean fluorescence intensity (MFI) were calculated using FlowJo. Values were averaged from three technical replicates from each mouse. Mean cytokine expression levels were then displayed on a per mouse basis in a radar plot using Excel.
QUANTIFICATION AND STATISTICAL ANALYSIS
Statistical analyses were performed using Prism 6.0 (GraphPad) or Matlab. Statistical details are included in above methods sections, annotated in figures, and described in figure legends. Unpaired T-tests were applied to assess differences in T cell clonality in TCRseq data. 2-way ANOVA corrected for multiple testing using Tukey’s method was applied is most analyses. Holm-Sidak corrected 2-way ANOVA was applied in the context of ovalbumin immunization experiments in order to increase statistical power to detect increase in relative frequency due to immunization. Comparisons that reached defined statistical cutoffs are denoted in figures and figure legends. Significance was defined as p < 0.05 in most cases. Statistical tests and the relevant values of n and definitions of what n represents are described for each set of experiments. Numbers of mice and cells analyzed there was no predetermined sample size. For analyses of young mice, all pups of litters were analyzed. If combined numbers of pups from litters in a given experimental cohort exceeded 20 mice (the experimental limit for mass cytometry barcoding), mice were randomized to be excluded. In some analyses, mass cytometry data were subsampled to facilitate computational analyses. Methods to determine appropriate assumptions for archetypal analyses are described in above sections.
DATA AND SOFTWARE AVAILABILITY
Mass cytometry and flow cytometry datasets have been deposited in Flow Repository under Repository IDs FR-FCM-ZYFQ, FR-FCM-ZYFR, FR-FCM-ZYFS, FR-FCM-ZYFT, and FR-FCM-ZYFU. TCR sequencing datasets have been deposited in the Adaptive Biotechnologies Analyzer Suite and will be available via Adaptive Biotechnologies immuneACCESS. WES data has been deposited in the SRA under STUDY Accession SRP128135. Custom MATLAB code and scripts for analysis of mass cytometry datasets have been deposited in GitHub (https://github.com/dpeerlab/CTLA4KO). For analyses of publicly available data from prior publications, data were analyzed using methods as described above. Datasets were analyzed on a per cohort basis to reduce the influence of technical batch effects. Mass cytometry datasets include Flow Repository FR-FCM-ZY6C, FR-FCM-ZY69 (Wei et al., 2017), and FR-FCM-ZY34 (Krieg et al., 2018).
Supplementary Material
KEY RESOURCES TABLE
| REAGENT or RESOURCE | SOURCE | IDENTIFIER |
|---|---|---|
| Antibodies | ||
| anti-Aiolos 147Sm | Biolegend | Cat #:653202; Clone:8B2 |
| anti-BATF 154Sm | Fluidigm | Cat #:3154012A; Clone:D7C5 |
| anti-Bcl2 166 Er | Biolegend | Cat #:633502; Clone:BCL/10C4 |
| anti-BCL6 168Er | BD | Cat #:561520; Clone:K112-91 |
| anti-c-maf 171Yb | eBioscience | Cat #:50-9855-82; Clone:sym0F1 |
| anti-CCR4 153Eu | Biolegend | Cat #:131202; Clone:2G12 |
| anti-CD117 169Tm | Biolegend | Cat #:105829; Clone:2B8 |
| anti-CD11c 142 Nd | Biolegend | Cat #:117341; Clone:N418 |
| anti-CD127 170Er | Biolegend | Cat #:135029; Clone:A7R34 |
| anti-CD19 166Er | Fluidigm | Cat #:3166015B; Clone:6D5 |
| anti-CD24 162Dy | Biolegend | Cat #:101829; Clone:M1/69 |
| anti-CD25 150Nd | Fluidigm | Cat #:3150002B; Clone:3C7 |
| anti-CD27 148Nd | Biolegend | Cat #:124202; Clone:LG.3A10 |
| anti-CD3ε 152Sm | Fluidigm | Cat #:3152004B; Clone:145-2C11 |
| anti-CD4 145Nd | Fluidigm | Cat #:3145002B; Clone:RM4-5 |
| anti-CD44 171Yb | Fluidigm | Cat #:3171003B; Clone:IM7 |
| anti-CD45 89Y | Fluidigm | Cat #:3089005B; Clone:30-F11 |
| anti-CD62L 160Gd | Fluidigm | Cat #:3160008B; Clone:MEL-14 |
| anti-CD69 156Gd | Biolegend | Cat #:104533; Clone:H1.2F3 |
| anti-CD8a 146Nd | Fluidigm | Cat #:3146003B; Clone:53-6.7 |
| anti-CTLA-4 163Dy | Biolegend | Cat #:106302; Clone:UC10-4B9 |
| anti-CTLA-4 171Yb | Biolegend | Cat #:106302; Clone:UC10-4B9 |
| anti-CXCR3 161Dy | Biolegend | Cat #:126502; Clone:CXCR3-173 |
| anti-CXCR5 158Gd | BD | Cat #:551961; Clone:2G8 |
| anti-EOMES 176Yb | eBioscience | Cat #:14-4875-82; Clone:Dan11mag |
| anti-FOXP3 165Ho | Fluidigm | Cat #:3165024A; Clone:FJK-16s |
| anti-GATA3 167Er | BD | Cat #:558686; Clone:L50-823 |
| anti-H-2K b/H-2D b 196Pt | Biolegend | Cat #:114602; Clone:28-8-6 |
| anti-Helios 172Yb | Biolegend | Cat #:137202; Clone:22F6 |
| anti-ICOS 155Gd | eBioscience | Cat #:14-9942-85; Clone:7E.17G9 |
| anti-Ikaros 144Nd | Biolegend | Cat #:653302; Clone:2A9/Ikaros |
| anti-IRF4 151Eu | Biolegend | Cat #:646402; Clone:IRF4.3E4 |
| anti-KLRG1 142Nd | BD | Cat #:562190; Clone:2F1 |
| anti-KLRG1 198Pt | BD | Cat #:562190; Clone:2F1 |
| anti-Lag3 198Pt | Biolegend | Cat #:125202; Clone:C9B7W |
| anti-MHC II 139La | Biolegend | Cat #:107637; Clone:M5/114.15.2 |
| anti-NK1.1 141Pr | Biolegend | Cat #:108743; Clone:PK136 |
| anti-PD-1 159Tb | Fluidigm | Cat #:3159024B; Clone:29F.1A12 |
| anti-PD-L1 153Eu | Fluidigm | Cat #:3153016B; Clone:10F.9G2 |
| anti-RORγT 174Yb | BD | Cat #:562663; Clone:Q31-378 |
| anti-Runx3 164Dy | BD | Cat #:564813; Clone:R3-5G4 |
| anti-Sca1 163Dy | Biolegend | Cat #:108135; Clone:D7 |
| anti-TBET 173Yb | Biolegend | Cat #:644825; Clone:4B10 |
| anti-TCF1 175Lu | BD | Cat #:564217; Clone:S33-966 |
| anti-TCRb 143Nd | Fluidigm | Cat #:3143010B; Clone:H57-597 |
| anti-CD45.2-AlexaFluor700 | eBioscience | Cat#56-0454-82; clone: 104, |
| anti-CD4-APC-eFluor 780 | eBioscience | Cat#47-0041-82; clone: GK1.5, |
| anti-CD3ε-PerCP-Cy5.5 | eBioscience | Cat#45-0031-82; clone: 145-2C11, |
| anti-CD8-e450 | eBioscience | Cat#48-0081-82; clone: 53-6.7, |
| anti-CD19-BV650 | Biolegend | Cat#115541; clone: 6D5, |
| anti-ICOS-PE | eBioscience | Cat#12-9942-82; clone: 7E.17G9, |
| anti-Rat IgG2b-PE, | eBioscience | Cat#12-4031-82; clone: eB149/10H5, |
| anti-CD3ε BV785 | BD | Cat#564379; clone 145-2C11, |
| anti-PD-1 BV421 | Biolegend | Cat#135221; clone: 29F.1A12, |
| anti-CD19 BV510 | Biolegend | Cat#115545; clone: 6D5, |
| anti-CD44.2 BV711 | BD | Cat#563685; clone: 104, |
| anti-ICOS FITC | eBioscience | Cat#11-9942-82; clone: 7E.17G9, |
| anti-CD4 AF532 | Biolegend | Cat#100548; clone: RM4-5, |
| anti-CD25 AF700 | eBioscience | Cat#56-0251-82; clone: PC61.5, |
| anti-CD8a APC-Cy7 | Biolegend | Cat#100714; clone: 53-6.7, |
| anti-IL-2 BV605 | Biolegend | Cat#503829; clone: JES6-5H4, |
| anti-TNFa PerCP-Cy5.5 | Biolegend | Cat#506322; clone: MP6-XT22, |
| anti-IFNγ PE | eBioscience | Cat#12-7311-82; clone: XMG1.2, |
| anti-IL-17A PE-CF594 | BD | Cat#562542; clone: TC11-18H10, |
| anti-IL-10 APC | eBioscience | Cat#17-7101-82; clone: JES5-16E3 |
| anti-CD16/32 | BioXCell | Cat#BE0307; clone: 2.4G2 |
| Bacterial and Virus Strains | ||
| None | ||
| Biological Samples | ||
| None | ||
| Chemicals, Peptides, and Recombinant Proteins | ||
| 5’ iododeoxyuridine (IdU) | Sigma-Aldrich | Cat#I7125-5G |
| Complete Freund’s Adjuvant | Invivogen | Cat#vac-cfa-10 |
| Live/Dead fixable blue | ThermoFisher | Cat#: L23105 |
| Cisplatin 194Pt | Fluidigm | Cat#: 201194 |
| Monoisotopic 195Pt cisplatin | Fluidigm | N/A |
| Monoisotopic 196Pt cisplatin | Fluidigm | N/A |
| Monoisotopic 198Pt cisplatin | Fluidigm | Cat# 201198 |
| Iridium | Fluidigm | Cat# 201192A |
| EQ 4-element beads | Fluidigm | Cat# 201078 |
| Lanthanum chloride heptahydrate | Sigma-Aldrich | Cat# 203521 |
| 16% PFA, EM grade | Fisher, EMS | Cat# 50-980-487 |
| Critical Commercial Assays | ||
| X8 polymer conjugation kit | Fluidigm | N/A (metal specific) |
| FoxP3 Transcription Factor Staining Buffer Set | eBioscience | Cat# 00-5523-00 |
| 20-Plex Pd Barcoding Kit | Fluidigm | Cat# 201060 |
| Antibody Stabilizer | Candor Biosciences | Cat# 131 050 |
| Deposited Data | ||
| Mass cytometry data | This paper | Flow Repository: FR-FCM-ZYFQ, FR-FCM-ZYFR, FR-FCM-ZYFS, FR-FCM-ZYFT, and FR-FCM-ZYFU |
| Whole exome sequencing of murine transgenic strains | SRA | SRP128135 |
| TCR sequencing | Adaptive Biotechnologies | immuneACCESS |
| Experimental Models: Cell Lines | ||
| None | ||
| Experimental Models: Organisms/Strains | ||
| Mouse: Ctla4tm1All | Chambers et al., 1997a | N/A |
| Mouse: Pdcd1tm1.1Shr | The Jackson Laboratory | JAX: 021157 |
| Mouse: Icos Ctla4 double knockout c.310_311insAA | This paper | N/A |
| Mouse: Icos Ctla4 double knockout c.309delG | This paper | N/A |
| Mouse: C57BL6/J | The Jackson Laboratory | JAX: 000664 |
| Oligonucleotides | ||
| Cas9 targeting sequence: CAGAAGTAATAGCTTCCCTGGG | Sigma-Aldrich | MM0000353415 |
| Primers for mouse genotyping, see STAR Methods | IDT | n/a |
| Recombinant DNA | ||
| None | ||
| Software and Algorithms | ||
| Matlab version 2017a | Mathworks | https://www.mathworks.com/ |
| Prism | GraphPad | N/A |
| Custom code for mass cytometry analyses including archetype analysis | This paper. | https://github.com/dpeerlab/CTLA4KO. |
| Helios 6.5.358 acquisition software | Fluidigm | https://www.fluidigm.com/software |
| Cyt | Amir el et al., 2013 | N/A |
| FlowJo 10.0.8 | FlowJo LLC | N/A |
| ImmunoSeq Analyzer Suite | Adaptive Biotechnologies | https://clients.adaptivebiotech.com/ |
| Burrows-Wheeler Alignment Tool | Li and Durbin, 2009 | http://bio-bwa.sourceforge.net/ |
| Genome Analysis Toolkit | Van der Auwera et al., 2013 | https://software.broadinstitute.org/gatk/ |
| VarScan2 | Koboldt et al., 2012 | http://varscan.sourceforge.net/ |
| ANNOVAR | Wang et al., 2010 | http://annovar.openbioinformatics.org/en/latest/ |
| Other | ||
Highlights.
Negative costimulation limits T cell differentiation outcomes
Archetypal analysis identifies phenotypic boundaries of cell states
CTLA-4 imposes major boundaries on CD4+ T cell phenotypes
PD-1 subtly restrains CD8+ T cell phenotypes
Acknowledgements
We thank Duncan Mak for providing expert advice in mass cytometry analysis, members of the Allison and Pe’er labs for helpful discussions, and Caitlin Trasande for critical reading. Mass cytometry was performed at the MDACC Flow Cytometry and Cellular Imaging Core Facility, transgenic mouse lines were generated with the MDACC Genetically Engineered Mouse Facility, and sequencing was performed at the MDACC Sequencing and Microarray Facility, all of which are in part funded by NCI Cancer Center Support Grant (CCSG) P30CA16672. This work was supported by a grant from Cancer Prevention and Research in Texas to J.P.A. (R1203), the MDACC CCSG Bioinformatics Shared Resource, NIH grants to D.P. (DP1-HD084071 and R01CA164729), and a MSK Cancer Center Support Grant/Core Grant to D.P. (P30CA008748). S.C.W. was a MD Anderson Cancer Center Odyssey postdoctoral fellow.
Footnotes
Declaration of interests
S.C.W. is an employee of Spotlight Therapeutics. J.P.A. is a Co-Director of the Parker Institute for Cancer Immunotherapy. J.P.A. has ownership interest in Jounce Therapeutics, Neon Therapeutics, Forty Seven, Codiak, ImaginAb, Marker Therapeutics, Tvardi Therapeutics, Constellation Pharmaceuticals, BioAlta, Polaris Pharmaceuticals, Hummingbird Bioscience, Merck, Bristol-Myers Squibb (BMS), Amgen, and Apricity Therapeutics, and, is a scientific advisory board member/consultant for Jounce, BioAtla, Neon, Codiak, Tvardi, Amgen, Forty-Seven, ImaginAb, Marker, Apricity, Polaris, ImaginAB, BMS, Merck, and Hummingbird, and has received royalties from intellectual property licensed to BMS, Merck, and Jounce. P.S. has ownership interest in Jounce, Neon, Constellation, Oncolytics Biotech, Merck, BioMx, BioAtla, Forty-Seven, Apricity, Polaris, Marker, ImaginAB, Hummingbird, Pieris Pharmaceuticals, Amgen, and Codiak, is a scientific advisory board member/consultant for Jounce, Constellation, Neon, BioAtla, Pieris, Oncolytics, Merck, BioMx, Forty-Seven, Apricity, Polaris, Marker Therapeutics, Codiak, Hummingbird, AstraZeneca, Amgen, GlaxoSmithKline (GSK), and BMS and is a co-founder and advisor of Jounce Therapeutics.
Publisher's Disclaimer: This is a PDF file of an unedited manuscript that has been accepted for publication. As a service to our customers we are providing this early version of the manuscript. The manuscript will undergo copyediting, typesetting, and review of the resulting proof before it is published in its final citable form. Please note that during the production process errors may be discovered which could affect the content, and all legal disclaimers that apply to the journal pertain.
References
- Amir el AD, Davis KL, Tadmor MD, Simonds EF, Levine JH, Bendall SC, Shenfeld DK, Krishnaswamy S, Nolan GP, and Pe'er D (2013). viSNE enables visualization of high dimensional single-cell data and reveals phenotypic heterogeneity of leukemia. Nature biotechnology 31, 545–552. [DOI] [PMC free article] [PubMed] [Google Scholar]
- Antebi YE, Reich-Zeliger S, Hart Y, Mayo A, Eizenberg I, Rimer J, Putheti P, Pe'er D, and Friedman N (2013). Mapping differentiation under mixed culture conditions reveals a tunable continuum of T cell fates. PLoS Biol 11, e1001616. [DOI] [PMC free article] [PubMed] [Google Scholar]
- Azizi E, Carr AJ, Plitas G, Cornish AE, Konopacki C, Prabhakaran S, Nainys J, Wu K, Kiseliovas V, Setty M, et al. (2018). Single-Cell Map of Diverse Immune Phenotypes in the Breast Tumor Microenvironment. Cell 174, 1293–1308 e1236. [DOI] [PMC free article] [PubMed] [Google Scholar]
- Bendall SC, Davis KL, Amir el AD, Tadmor MD, Simonds EF, Chen TJ, Shenfeld DK, Nolan GP, and Pe'er D (2014). Single-cell trajectory detection uncovers progression and regulatory coordination in human B cell development. Cell 157, 714–725. [DOI] [PMC free article] [PubMed] [Google Scholar]
- Bengsch B, Ohtani T, Khan O, Setty M, Manne S, O'Brien S, Gherardini PF, Herati RS, Huang AC, Chang KM, et al. (2018). Epigenomic-Guided Mass Cytometry Profiling Reveals Disease-Specific Features of Exhausted CD8 T Cells. Immunity 48, 1029–1045 e1025. [DOI] [PMC free article] [PubMed] [Google Scholar]
- Bour-Jordan H, Grogan JL, Tang Q, Auger JA, Locksley RM, and Bluestone JA (2003). CTLA-4 regulates the requirement for cytokine-induced signals in T(H)2 lineage commitment. Nature immunology 4, 182–188. [DOI] [PubMed] [Google Scholar]
- Carreno BM, Bennett F, Chau TA, Ling V, Luxenberg D, Jussif J, Baroja ML, and Madrenas J (2000). CTLA-4 (CD152) can inhibit T cell activation by two different mechanisms depending on its level of cell surface expression. Journal of immunology 165, 1352–1356. [DOI] [PubMed] [Google Scholar]
- Chambers CA, Cado D, Truong T, and Allison JP (1997a). Thymocyte development is normal in CTLA-4-deficient mice. Proceedings of the National Academy of Sciences of the United States of America 94, 9296–9301. [DOI] [PMC free article] [PubMed] [Google Scholar]
- Chambers CA, Sullivan TJ, and Allison JP (1997b). Lymphoproliferation in CTLA-4-deficient mice is mediated by costimulation-dependent activation of CD4+ T cells. Immunity 7, 885–895. [DOI] [PubMed] [Google Scholar]
- Chaput N, Lepage P, Coutzac C, Soularue E, Le Roux K, Monot C, Boselli L, Routier E, Cassard L, Collins M, et al. (2017). Baseline gut microbiota predicts clinical response and colitis in metastatic melanoma patients treated with ipilimumab. Annals of oncology : official journal of the European Society for Medical Oncology / ESMO 28, 1368–1379. [DOI] [PubMed] [Google Scholar]
- Chen L, and Flies DB (2013). Molecular mechanisms of T cell co-stimulation and co-inhibition. Nature reviews. Immunology 13, 227–242. [DOI] [PMC free article] [PubMed] [Google Scholar]
- Chevrier S, Levine JH, Zanotelli VRT, Silina K, Schulz D, Bacac M, Ries CH, Ailles L, Jewett MAS, Moch H, et al. (2017). An Immune Atlas of Clear Cell Renal Cell Carcinoma. Cell 169, 736–749 e718. [DOI] [PMC free article] [PubMed] [Google Scholar]
- Choi YS, Kageyama R, Eto D, Escobar TC, Johnston RJ, Monticelli L, Lao C, and Crotty S (2011). ICOS receptor instructs T follicular helper cell versus effector cell differentiation via induction of the transcriptional repressor Bcl6. Immunity 34, 932–946. [DOI] [PMC free article] [PubMed] [Google Scholar]
- Coifman RR, and Lafon S (2006). Diffusion maps. Applied and Computational Harmonic Analysis 21, 5–30. [Google Scholar]
- Constant S, Pfeiffer C, Woodard A, Pasqualini T, and Bottomly K (1995). Extent of T cell receptor ligation can determine the functional differentiation of naive CD4+ T cells. The Journal of experimental medicine 182, 1591–1596. [DOI] [PMC free article] [PubMed] [Google Scholar]
- Coutzac C, Adam J, Soularue E, Collins M, Racine A, Mussini C, Boselli L, Kamsukom N, Mateus C, Charrier M, et al. (2017). Colon Immune-Related Adverse Events: Anti-CTLA-4 and Anti-PD-1 Blockade Induce Distinct Immunopathological Entities. J Crohns Colitis 11, 1238–1246. [DOI] [PubMed] [Google Scholar]
- Cutler A, and Breiman L (1994). Archetypal Analysis. Technometrics 36, 338–347. [Google Scholar]
- Danon L, Diaz-Guilera A, Duch J, and Arenas A (2005). Comparing community structure identification. Journal of Statistical Mechanics: Theory and Experiment 9, P09008. [Google Scholar]
- Egen JG, and Allison JP (2002). Cytotoxic T lymphocyte antigen-4 accumulation in the immunological synapse is regulated by TCR signal strength. Immunity 16, 23–35. [DOI] [PubMed] [Google Scholar]
- Engelhardt JJ, Sullivan TJ, and Allison JP (2006). CTLA-4 overexpression inhibits T cell responses through a CD28-B7-dependent mechanism. Journal of immunology 177, 1052–1061. [DOI] [PubMed] [Google Scholar]
- Gavin MA, and Bevan MJ (1995). Increased peptide promiscuity provides a rationale for the lack of N regions in the neonatal T cell repertoire. Immunity 3, 793–800. [DOI] [PubMed] [Google Scholar]
- Gilfillan S, Dierich A, Lemeur M, Benoist C, and Mathis D (1993). Mice lacking TdT: mature animals with an immature lymphocyte repertoire. Science 261, 1175–1178. [DOI] [PubMed] [Google Scholar]
- Haghverdi L, Buettner F, and Theis FJ (2015). Diffusion maps for high-dimensional single-cell analysis of differentiation data. Bioinformatics 31, 2989–2998. [DOI] [PubMed] [Google Scholar]
- Haghverdi L, Buttner M, Wolf FA, Buettner F, and Theis FJ (2016). Diffusion pseudotime robustly reconstructs lineage branching. Nat Methods 13, 845–848. [DOI] [PubMed] [Google Scholar]
- Harding FA, McArthur JG, Gross JA, Raulet DH, and Allison JP (1992). CD28-mediated signalling co-stimulates murine T cells and prevents induction of anergy in T-cell clones. Nature 356, 607–609. [DOI] [PubMed] [Google Scholar]
- Härdle W, and Müller M (1997). Multivariate and semiparametric kernel regression (Humboldt: University of Berlin, Interdisciplinary Research Project 373: Quantification and Simulation of Economic Processes). [Google Scholar]
- Hart Y, Sheftel H, Hausser J, Szekely P, Ben-Moshe NB, Korem Y, Tendler A, Mayo AE, and Alon U (2015). Inferring biological tasks using Pareto analysis of high-dimensional data. Nat Methods 12, 233–235, 233 p following 235. [DOI] [PubMed] [Google Scholar]
- Hou TZ, Qureshi OS, Wang CJ, Baker J, Young SP, Walker LS, and Sansom DM (2015). A transendocytosis model of CTLA-4 function predicts its suppressive behavior on regulatory T cells. Journal of immunology 194, 2148–2159. [DOI] [PMC free article] [PubMed] [Google Scholar]
- Hwang ES, Szabo SJ, Schwartzberg PL, and Glimcher LH (2005). T helper cell fate specified by kinase-mediated interaction of T-bet with GATA-3. Science 307, 430–433. [DOI] [PubMed] [Google Scholar]
- Keir ME, Freeman GJ, and Sharpe AH (2007). PD-1 regulates self-reactive CD8+ T cell responses to antigen in lymph nodes and tissues. Journal of immunology 179, 5064–5070. [DOI] [PubMed] [Google Scholar]
- Khattri R, Auger JA, Griffin MD, Sharpe AH, and Bluestone JA (1999). Lymphoproliferative disorder in CTLA-4 knockout mice is characterized by CD28-regulated activation of Th2 responses. Journal of immunology 162, 5784–5791. [PubMed] [Google Scholar]
- Klocke K, Sakaguchi S, Holmdahl R, and Wing K (2016). Induction of autoimmune disease by deletion of CTLA-4 in mice in adulthood. Proceedings of the National Academy of Sciences of the United States of America 113, E2383–E2392. [DOI] [PMC free article] [PubMed] [Google Scholar]
- Koboldt DC, Zhang Q, Larson DE, Shen D, McLellan MD, Lin L, Miller CA, Mardis ER, Ding L, and Wilson RK (2012). VarScan 2: somatic mutation and copy number alteration discovery in cancer by exome sequencing. Genome research 22, 568–576. [DOI] [PMC free article] [PubMed] [Google Scholar]
- Komori T, Okada A, Stewart V, and Alt FW (1993). Lack of N regions in antigen receptor variable region genes of TdT-deficient lymphocytes. Science 261, 1171–1175. [DOI] [PubMed] [Google Scholar]
- Korem Y, Szekely P, Hart Y, Sheftel H, Hausser J, Mayo A, Rothenberg ME, Kalisky T, and Alon U (2015). Geometry of the Gene Expression Space of Individual Cells. PLoS Comput Biol 11, e1004224. [DOI] [PMC free article] [PubMed] [Google Scholar]
- Krieg C, Nowicka M, Guglietta S, Schindler S, Hartmann FJ, Weber LM, Dummer R, Robinson MD, Levesque MP, and Becher B (2018). High-dimensional single-cell analysis predicts response to anti-PD-1 immunotherapy. Nature medicine 24, 144–153. [DOI] [PubMed] [Google Scholar]
- Kuhn HW (1955). The Hungarian Method for the assignment problem. Naval Research Logistics Quarterly 2, 83–97. [Google Scholar]
- Lee KM, Chuang E, Griffin M, Khattri R, Hong DK, Zhang W, Straus D, Samelson LE, Thompson CB, and Bluestone JA (1998). Molecular basis of T cell inactivation by CTLA-4. Science 282, 2263–2266. [DOI] [PubMed] [Google Scholar]
- Levine JH, Simonds EF, Bendall SC, Davis KL, Amir el AD, Tadmor MD, Litvin O, Fienberg HG, Jager A, Zunder ER, et al. (2015). Data-Driven Phenotypic Dissection of AML Reveals Progenitor-like Cells that Correlate with Prognosis. Cell 162, 184–197. [DOI] [PMC free article] [PubMed] [Google Scholar]
- Li H, and Durbin R (2009). Fast and accurate short read alignment with Burrows-Wheeler transform. Bioinformatics 25, 1754–1760. [DOI] [PMC free article] [PubMed] [Google Scholar]
- Liakou CI, Kamat A, Tang DN, Chen H, Sun J, Troncoso P, Logothetis C, and Sharma P (2008). CTLA-4 blockade increases IFNgamma-producing CD4+ICOShi cells to shift the ratio of effector to regulatory T cells in cancer patients. Proceedings of the National Academy of Sciences of the United States of America 105, 14987–14992. [DOI] [PMC free article] [PubMed] [Google Scholar]
- Lindsten T, Lee KP, Harris ES, Petryniak B, Craighead N, Reynolds PJ, Lombard DB, Freeman GJ, Nadler LM, Gray GS, et al. (1993). Characterization of CTLA-4 structure and expression on human T cells. Journal of immunology 151, 3489–3499. [PubMed] [Google Scholar]
- Masteller EL, Chuang E, Mullen AC, Reiner SL, and Thompson CB (2000). Structural analysis of CTLA-4 function in vivo. Journal of immunology 164, 5319–5327. [DOI] [PubMed] [Google Scholar]
- Mei HE, Leipold MD, and Maecker HT (2016). Platinum-conjugated antibodies for application in mass cytometry. Cytometry A 89, 292–300. [DOI] [PubMed] [Google Scholar]
- Melchiotti R, Gracio F, Kordasti S, Todd AK, and de Rinaldis E (2017). Cluster stability in the analysis of mass cytometry data. Cytometry A 91, 73–84. [DOI] [PubMed] [Google Scholar]
- Moon KR, van Dijk D, Wang Z, Burkhardt D, Chen W, van den Elzen A, Hirn MJ, Coifman RR, Ivanova NB, Wolf G, and Krishnaswamy S (2017). Visualizing Transitions and Structure for High Dimensional Data Exploration. bioRxiv. [Google Scholar]
- Mørup M, and Hansen LK (2012). Archetypal analysis for machine learning and data mining. Neurocomputing 80, 54–63. [Google Scholar]
- Murphy KM, and Stockinger B (2010). Effector T cell plasticity: flexibility in the face of changing circumstances. Nature immunology 11, 674–680. [DOI] [PMC free article] [PubMed] [Google Scholar]
- Nadler B, Lafon S, Coifman RR, and Kevrekidis IG (2006). Diffusion maps, spectral clustering and eigenfunctions of Fokker-Flanck operators. Advances in neural information processing systems. [Google Scholar]
- Nishimura H, Nose M, Hiai H, Minato N, and Honjo T (1999). Development of lupus-like autoimmune diseases by disruption of the PD-1 gene encoding an ITIM motif-carrying immunoreceptor. Immunity 11, 141–151. [DOI] [PubMed] [Google Scholar]
- Nishimura H, Okazaki T, Tanaka Y, Nakatani K, Hara M, Matsumori A, Sasayama S, Mizoguchi A, Hiai H, Minato N, and Honjo T (2001). Autoimmune dilated cardiomyopathy in PD- 1 receptor-deficient mice. Science 291, 319–322. [DOI] [PubMed] [Google Scholar]
- Nurieva RI, Chung Y, Hwang D, Yang XO, Kang HS, Ma L, Wang YH, Watowich SS, Jetten AM, Tian Q, and Dong C (2008). Generation of T follicular helper cells is mediated by interleukin-21 but independent of T helper 1, 2, or 17 cell lineages. Immunity 29, 138–149. [DOI] [PMC free article] [PubMed] [Google Scholar]
- Nurieva RI, Chung Y, Martinez GJ, Yang XO, Tanaka S, Matskevitch TD, Wang YH, and Dong C (2009). Bcl6 mediates the development of T follicular helper cells. Science 325, 1001–1005. [DOI] [PMC free article] [PubMed] [Google Scholar]
- O'Shea JJ, and Paul WE (2010). Mechanisms underlying lineage commitment and plasticity of helper CD4+ T cells. Science 327, 1098–1102. [DOI] [PMC free article] [PubMed] [Google Scholar]
- Pardoll DM (2012). The blockade of immune checkpoints in cancer immunotherapy. Nature reviews. Cancer 12, 252–264. [DOI] [PMC free article] [PubMed] [Google Scholar]
- Parry RV, Chemnitz JM, Frauwirth KA, Lanfranco AR, Braunstein I, Kobayashi SV, Linsley PS, Thompson CB, and Riley JL (2005). CTLA-4 and PD-1 receptors inhibit T-cell activation by distinct mechanisms. Molecular and cellular biology 25, 9543–9553. [DOI] [PMC free article] [PubMed] [Google Scholar]
- Paterson AM, Lovitch SB, Sage PT, Juneja VR, Lee Y, Trombley JD, Arancibia-Carcamo CV, Sobel RA, Rudensky AY, Kuchroo VK, et al. (2015). Deletion of CTLA-4 on regulatory T cells during adulthood leads to resistance to autoimmunity. The Journal of experimental medicine 212, 1603–1621. [DOI] [PMC free article] [PubMed] [Google Scholar]
- Pentcheva-Hoang T, Egen JG, Wojnoonski K, and Allison JP (2004). B7–1 and B7–2 selectively recruit CTLA-4 and CD28 to the immunological synapse. Immunity 21, 401–413. [DOI] [PubMed] [Google Scholar]
- Pfeiffer C, Stein J, Southwood S, Ketelaar H, Sette A, and Bottomly K (1995). Altered peptide ligands can control CD4 T lymphocyte differentiation in vivo. The Journal of experimental medicine 181, 1569–1574. [DOI] [PMC free article] [PubMed] [Google Scholar]
- Qureshi OS, Zheng Y, Nakamura K, Attridge K, Manzotti C, Schmidt EM, Baker J, Jeffery LE, Kaur S, Briggs Z, et al. (2011). Trans-endocytosis of CD80 and CD86: a molecular basis for the cell-extrinsic function of CTLA-4. Science 332, 600–603. [DOI] [PMC free article] [PubMed] [Google Scholar]
- Rand WM (1971). Objective criteria for the evaluation of clustering methods. Journal of the American Statistical Association 66, 846–850. [Google Scholar]
- Sage PT, Paterson AM, Lovitch SB, and Sharpe AH (2014). The coinhibitory receptor CTLA-4 controls B cell responses by modulating T follicular helper, T follicular regulatory, and T regulatory cells. Immunity 41, 1026–1039. [DOI] [PMC free article] [PubMed] [Google Scholar]
- Schneider H, Downey J, Smith A, Zinselmeyer BH, Rush C, Brewer JM, Wei B, Hogg N, Garside P, and Rudd CE (2006). Reversal of the TCR stop signal by CTLA-4. Science 313, 1972–1975. [DOI] [PubMed] [Google Scholar]
- Setty M, Tadmor MD, Reich-Zeliger S, Angel O, Salame TM, Kathail P, Choi K, Bendall S, Friedman N, and Pe'er D (2016). Wishbone identifies bifurcating developmental trajectories from single-cell data. Nature biotechnology 34, 637–645. [DOI] [PMC free article] [PubMed] [Google Scholar]
- Sheftel H, Shoval O, Mayo A, and Alon U (2013). The geometry of the Pareto front in biological phenotype space. Ecol Evol 3, 1471–1483. [DOI] [PMC free article] [PubMed] [Google Scholar]
- Shoval O, Sheftel H, Shinar G, Hart Y, Ramote O, Mayo A, Dekel E, Kavanagh K, and Alon U (2012). Evolutionary trade-offs, Pareto optimality, and the geometry of phenotype space. Science 336, 1157–1160. [DOI] [PubMed] [Google Scholar]
- Tivol EA, Borriello F, Schweitzer AN, Lynch WP, Bluestone JA, and Sharpe AH (1995). Loss of CTLA-4 leads to massive lymphoproliferation and fatal multiorgan tissue destruction, revealing a critical negative regulatory role of CTLA-4. Immunity 3, 541–547. [DOI] [PubMed] [Google Scholar]
- Usui T, Preiss JC, Kanno Y, Yao ZJ, Bream JH, O'Shea JJ, and Strober W (2006). T-bet regulates Th1 responses through essential effects on GATA-3 function rather than on IFNG gene acetylation and transcription. The Journal of experimental medicine 203, 755–766. [DOI] [PMC free article] [PubMed] [Google Scholar]
- van Berkel ME, Schrijver EH, Hofhuis FM, Sharpe AH, Coyle AJ, Broeren CP, Tesselaar K, and Oosterwegel MA (2005). ICOS contributes to T cell expansion in CTLA-4 deficient mice. Journal of immunology 175, 182–188. [DOI] [PubMed] [Google Scholar]
- Van der Auwera GA, Carneiro MO, Hartl C, Poplin R, Del Angel G, Levy-Moonshine A, Jordan T, Shakir K, Roazen D, Thibault J, et al. (2013). From FastQ data to high confidence variant calls: the Genome Analysis Toolkit best practices pipeline. Curr Protoc Bioinformatics 43, 11 10 11–33. [DOI] [PMC free article] [PubMed] [Google Scholar]
- van der Maaten L, and Hinton GE (2008). Visualizing High-Dimensional Data Using t-SNE. J of Machine Learning Res 9, 2579–2605. [Google Scholar]
- van der Merwe PA, Bodian DL, Daenke S, Linsley P, and Davis SJ (1997). CD80 (B7–1) binds both CD28 and CTLA-4 with a low affinity and very fast kinetics. The Journal of experimental medicine 185, 393–403. [DOI] [PMC free article] [PubMed] [Google Scholar]
- van Dijk D, Sharma R, Nainys J, Yim K, Kathail P, Carr AJ, Burdziak C, Moon KR, Chaffer CL, Pattabiraman D, et al. (2018). Recovering Gene Interactions from Single-Cell Data Using Data Diffusion. Cell. [DOI] [PMC free article] [PubMed] [Google Scholar]
- Verhagen J, Genolet R, Britton GJ, Stevenson BJ, Sabatos-Peyton CA, Dyson J, Luescher IF, and Wraith DC (2013). CTLA-4 controls the thymic development of both conventional and regulatory T cells through modulation of the TCR repertoire. Proceedings of the National Academy of Sciences of the United States of America 110, E221–230. [DOI] [PMC free article] [PubMed] [Google Scholar]
- Wagner DH Jr., Hagman J, Linsley PS, Hodsdon W, Freed JH, and Newell MK (1996). Rescue of thymocytes from glucocorticoid-induced cell death mediated by CD28/CTLA-4 costimulatory interactions with B7–1/B7–2. The Journal of experimental medicine 184, 1631–1638. [DOI] [PMC free article] [PubMed] [Google Scholar]
- Walunas TL, Lenschow DJ, Bakker CY, Linsley PS, Freeman GJ, Green JM, Thompson CB, and Bluestone JA (1994). CTLA-4 can function as a negative regulator of T cell activation. Immunity 1, 405–413. [DOI] [PubMed] [Google Scholar]
- Wang CJ, Heuts F, Ovcinnikovs V, Wardzinski L, Bowers C, Schmidt EM, Kogimtzis A, Kenefeck R, Sansom DM, and Walker LS (2015). CTLA-4 controls follicular helper T-cell differentiation by regulating the strength of CD28 engagement. Proceedings of the National Academy of Sciences of the United States of America 112, 524–529. [DOI] [PMC free article] [PubMed] [Google Scholar]
- Wang K, Li M, and Hakonarson H (2010). ANNOVAR: functional annotation of genetic variants from high-throughput sequencing data. Nucleic Acids Res 38, e164. [DOI] [PMC free article] [PubMed] [Google Scholar]
- Waterhouse P, Bachmann MF, Penninger JM, Ohashi PS, and Mak TW (1997). Normal thymic selection, normal viability and decreased lymphoproliferation in T cell receptor-transgenic CTLA-4-deficient mice. European journal of immunology 27, 1887–1892. [DOI] [PubMed] [Google Scholar]
- Waterhouse P, Penninger JM, Timms E, Wakeham A, Shahinian A, Lee KP, Thompson CB, Griesser H, and Mak TW (1995). Lymphoproliferative disorders with early lethality in mice deficient in Ctla-4. Science 270, 985–988. [DOI] [PubMed] [Google Scholar]
- Wei SC, Levine JH, Cogdill AP, Zhao Y, Anang NAS, Andrews MC, Sharma P, Wang J, Wargo JA, Pe'er D, and Allison JP (2017). Distinct Cellular Mechanisms Underlie Anti-CTLA-4 and Anti-PD-1 Checkpoint Blockade. Cell 170, 1120–1133 e1117. [DOI] [PMC free article] [PubMed] [Google Scholar]
- Wing JB, Ise W, Kurosaki T, and Sakaguchi S (2014). Regulatory T cells control antigen-specific expansion of Tfh cell number and humoral immune responses via the coreceptor CTLA-4. Immunity 41, 1013–1025. [DOI] [PubMed] [Google Scholar]
- Wing K, Onishi Y, Prieto-Martin P, Yamaguchi T, Miyara M, Fehervari Z, Nomura T, and Sakaguchi S (2008). CTLA-4 control over Foxp3+ regulatory T cell function. Science 322, 271–275. [DOI] [PubMed] [Google Scholar]
- Yu D, Rao S, Tsai LM, Lee SK, He Y, Sutcliffe EL, Srivastava M, Linterman M, Zheng L, Simpson N, et al. (2009). The transcriptional repressor Bcl-6 directs T follicular helper cell lineage commitment. Immunity 31, 457–468. [DOI] [PubMed] [Google Scholar]
- Zhou L, Chong MM, and Littman DR (2009). Plasticity of CD4+ T cell lineage differentiation. Immunity 30, 646–655. [DOI] [PubMed] [Google Scholar]
- Zhou L, Lopes JE, Chong MM, Ivanov II, Min R, Victora GD, Shen Y, Du J, Rubtsov YP, Rudensky AY, et al. (2008). TGF-beta-induced Foxp3 inhibits T(H)17 cell differentiation by antagonizing RORgammat function. Nature 453, 236–240. [DOI] [PMC free article] [PubMed] [Google Scholar]
- Zhu J, Jankovic D, Oler AJ, Wei G, Sharma S, Hu G, Guo L, Yagi R, Yamane H, Punkosdy G, et al. (2012). The transcription factor T-bet is induced by multiple pathways and prevents an endogenous Th2 cell program during Th1 cell responses. Immunity 37, 660–673. [DOI] [PMC free article] [PubMed] [Google Scholar]
Associated Data
This section collects any data citations, data availability statements, or supplementary materials included in this article.
Supplementary Materials
Data Availability Statement
Mass cytometry and flow cytometry datasets have been deposited in Flow Repository under Repository IDs FR-FCM-ZYFQ, FR-FCM-ZYFR, FR-FCM-ZYFS, FR-FCM-ZYFT, and FR-FCM-ZYFU. TCR sequencing datasets have been deposited in the Adaptive Biotechnologies Analyzer Suite and will be available via Adaptive Biotechnologies immuneACCESS. WES data has been deposited in the SRA under STUDY Accession SRP128135. Custom MATLAB code and scripts for analysis of mass cytometry datasets have been deposited in GitHub (https://github.com/dpeerlab/CTLA4KO). For analyses of publicly available data from prior publications, data were analyzed using methods as described above. Datasets were analyzed on a per cohort basis to reduce the influence of technical batch effects. Mass cytometry datasets include Flow Repository FR-FCM-ZY6C, FR-FCM-ZY69 (Wei et al., 2017), and FR-FCM-ZY34 (Krieg et al., 2018).