

Abstract
Gene silencing by chromatin compaction is integral to establishing and maintaining cell fates. Trimethylated histone 3 lysine 9 (H3K9me3)-marked heterochromatin is reduced in embryonic stem cells compared to differentiated cells. However, the establishment and dynamics of closed regions of chromatin at protein-coding genes, in embryologic development, remain elusive. We developed an antibody-independent method to isolate and map compacted heterochromatin from low-cell number samples. We discovered high levels of compacted heterochromatin, H3K9me3-decorated, at protein-coding genes in early, uncommitted cells at the germ-layer stage, undergoing profound rearrangements and reduction upon differentiation, concomitant with cell type-specific gene expression. Perturbation of the three H3K9me3-related methyltransferases revealed a pivotal role for H3K9me3 heterochromatin during lineage commitment at the onset of organogenesis and for lineage fidelity maintenance.
The phylotypic period of embryologic development occurs at the onset of organogenesis, when morphological development is most conserved between different species (1–3). The “hourglass” model suggests that cell fate decisions are restricted during the phylotypic period by evolutionarily conserved transcription factor and signaling activities (1–3). Limited assay sensitivity and small numbers of cells have made it difficult to investigate chromatin dynamics during the phylotypic period, when cell differentiation initiates extensively in embryos. Current thinking from the embryonic stem (ES) cell model (4) suggests that compacted heterochromatic domains expand as cells mature, helping to establish cell identity (5–11). However, these studies did not examine the dynamic events occurring during natural lineage commitment at organogenesis.
Regions of trimethylated histone 3 lysine 9 (H3K9me3)-marked heterochromatin can have a physically condensed structure (12–14) that serves to repress repeat-rich regions of the genome (7,15–17), including centromeric and telomeric regions (18,19), and silence protein-coding genes at facultative heterochromatin (20, 21). The early lethal in vivo developmental phenotypes associated with the depletion of H3K9me3-related histone methyltransferases (HMTases) (15, 22, 23) support the idea that H3K9me3 controls genome stability and differentiation. Recently, H3K9me3 dynamics at repetitive elements and promoters have been characterized at pregastrula stages (24). The global heterochromatin reorganization at germ-layer stages and during lineage commitment in vivo has not been addressed, and prior studies did not distinguish H3K9me3-decorated regions that are euchromatic from those that are heterochromatic (25). H3K9me3-enriched domains also impede cell reprogramming and somatic cell nuclear transfer (17, 25–27), underscoring the importance of understanding the natural dynamics by which heterochromatic domains restrict cell fates during normal development.
We globally assessed the dynamics of compacted, sonication-resistant heterochromatin (srHC) (25) and H3K9me3 deposition at critical developmental time points in the murine endoderm germ layer and in cells along the descendent hepatic and pancreatic lineages (Fig. 1A and figs. S1, A and B; S2, A to H; and S3, A to F). Because the embryonic starting material has low cell numbers, we developed a sonication-resistant heterochromatin sequencing (srHC-seq) method that is sucrose gradientindependent (25) to detect regions of srHC (fig. S4, A to E). We performed srHC-seq in definitive endodermal cells, hepatocytes, and mature beta cells and found similar fractions of the genome in srHC in the three cell types (fig. S4, F and G). In all stages, gene expression was anticorrelated with sonication resistance (fig. S4H). Analysis of Hi-C-identified closed compartments revealed a 40% overlap with srHC in adult hepatocytes and mature beta cells (fig. S4I), whereas no significant correlation with open compartments was detected. We observed extensive dynamics of srHC upon definitive endoderm differentiation (Fig. 1B and table S7), including 5979 and 4879 genes that lose compaction, whereas 1630 and 5632 genes gain srHC, during hepatocyte and mature beta cell development, respectively. Gene Ontology (GO) analysis revealed that srHC is removed in adult function genes (table S7).
Fig. 1. Chromatin compaction and H3K9me3 landscape upon germ-layer differentiation.

(A) Schematic of the cell types and embryonic developmental stages considered in this study. Purple, orange, and green asterisks next to the represented cell types indicate samples processed for H3K9me3 ChIP-seq, RNA-seq, and srHC-seq, respectively. (B) Alluvial plot showing dynamics in definitive endoderm srHC (dark gray) and open chromatin (light gray) patches upon differentiation into adult hepatocytes and insulin-producing cells; a to h indicate distinct categories or alluvia, characterized by a specific dynamic in srHC and open chromatin; the number of genes in each alluvium is indicated. (C)Number of genes marked by H3K9me3 in each indicated stage, along the hepatic and pancreatic lineages. Inner cell mass (ICM), e6.5, and e7.5 data from (25). (D)Number of genes gaining (purple) or losing (white) H3K9me3 upon stepwise transition in successive developmental stages. Each transition is indicated above the corresponding gene number bar.
We mapped H3K9me3 in cells sorted from embryos at different developmental stages (fig. S5, A to D). Unsupervised hierarchical clustering revealed a high correlation between individual replicates, with definitive endoderm cells clustering separately from the hepatic and pancreatic lineages (fig. S5E). To compare H3K9me3 landscapes across the three germ layers, we included mesoderm progenitors and ectoderm-derived, already specified midbrain neuroepithelial cells isolated at embryonic day 8.25 (e8.25) (fig. S6, A to H) and compared their H3K9me3 profiles to those of definitive endodermal cells, as well as to postnatal day 0 (P0) heart and adult nucleus accumbens (Fig. 1A). Concordant with the heterochromatin analysis, H3K9me3 marked more gene bodies, promoters, and termination transcription sites (TTSs) in endoderm and mesoderm germ layer than in pregastrula stages or differentiating cells (Fig. 1C; fig. S7, A to E; and tables S8 and S9). A stepwise developmental transition analysis of H3K9me3 revealed a substantial loss of H3K9me3 when definitive endodermal cells differentiate into hepatic and pancreatic progenitors (Fig. 1D and tables S10 and S11). A similar process is detected in the mesoderm lineage, but not upon differentiation of midbrain neuroepithelium, which is already past the ectoderm stage, into neurons (fig. S7F and tables S10 and S11).
H3K9me3 and H3K27me3 reside both in srHC and open chromatin, where they decorate regions independently or in combination (25) (fig. S8, A to C). However, unlike H3K9me3, heterochromatin marked by H3K27me3 was similarly distributed over genes and intergenic regions in definitive endoderm, hepatocytes, and mature beta cells (fig. S9, A to E).
We assessed the acquisition of stage-specific transcriptional signatures along the hepatic and pancreatic lineages (fig. S10, A to C, and table S12). Combined analysis of srHC, H3K9me3, and transcriptional profiles revealed that gene bodies, transcription start sites (TSSs), or TTSs marked by H3K9me3 are more repressed when present in srHC than in open chromatin (fig. S11, A and B). K-means cluster analysis of six developmental stages (fig. S12A and table S13) identified 15 patterns of gene expression. Notably, cell type-specific genes that acquire expression in terminally differentiated cells showed a net loss of srHC and H3K9me3 along both the hepatic and pancreatic lineages (Fig. 2, A and C to E; figs. S13A and S14, A to D; and table S14), whereas constitutively expressed or repressed genes were depleted or decorated by the mark, respectively (Fig. 2B and fig. S13, B and C). H3K27me3 dynamics at both hepatic and pancreatic-specific genes were also detected, showing loss in development (fig. S14E). Of the 1008 and 1249 genes in adult hepatocytes and mature beta cells that fail to be expressed at a higher level in differentiated versus uncommitted cells, but lose H3K9me3, 71% and 74%, respectively, showed increased H3K27me3 levels compared to definitive endoderm (fig S15A), indicating a compensatory mechanism for maintaining heterochromatin at a subset of genes that remain developmentally silent. Overall, the results show that H3K9me3-marked heterochromatin is transiently deployed in germ-layer cells to repress genes associated with mature cell function and is removed at many sites during differentiation to allow tissue-specific gene expression.
Fig. 2. Loss of srHC and H3K9me3 correlates with gene expression of hepatic-specific markers upon differentiation.

(A) Representative UCSC genome browser tracks of srHC-seq (gray), input-divided H3K9me3 (purple), and RNA-seq profiles (orange) upon definitive endoderm differentiation into adult hepatocytes. srHC and H3K9me3 patches are shown as gray and purple bars above each profile, respectively. Cytochrome P450 (Cyp) genes on chromosome 5 (A) are shown. The constitutive H3K9me3-undecorated and active Actin b (Actb) and the permanently H3K9me3-enriched and silenced zinc finger protein (Zfp) 936 (B) have been included as examples of genes whose expression inversely correlates to H3K9me3 presence. Magenta arrows indicate presence of srHC and H3K9me3 and absence of expression. Green arrows indicate absence of srHC, H3K9me3, and gene expression. (C) Z-score cluster representations for genes expressed in adult hepatocytes. (D and E) Heatmaps showing levels of srHC (D) and H3K9me3 (E) in the indicated stages. For both srHC and H3K9me3 heatmaps, definitive endodermal cell values have been ordered in a descendent manner.
H3K9me3 is established by three main HMTases: Setdb1, Suv39h1, and Suv39h2 (15,22,23). Setdb1 single and Suv39h1/h2 double germline knockouts are associated with early lethal phenotypes (15, 17, 22). We used FoxA3-Cre to generate endoderm-specific (28,29), conditional knockout (KO) mice for Setdb1(30) (fig. S16A) and analyzed e11.5 livers. H3K9me3 was modestly reduced in mutant embryos (fig. S16B), which showed bleeding in different body regions but no gross morphological differences in the liver structure and cell composition (fig. S16C). Single-cell RNA-seq on wild-type (wt) e11.5 hepatoblasts revealed three clusters of cell types (clusters 1 to 3, table S15), whose differentially expressed genes were associated with developmental processes, hepatic metabolism, and hematopoiesis, respectively (Fig. 3A and fig. S17, A to E). Expressed genes in Setdb1 mutant cells more than doubled in cluster 1 compared to wt cells but were reduced in cluster 2 (Fig. 3A). Setdb1 mutant albuminpositive (Alb+) cells from cluster 2 fail to induce hepatic markers and separate into a distinct subcluster from that of wt Alb+ cells (Fig. 3B and table S15). Adult, conditional Setdb1 mutant livers show occasional hypertrophic hepatocytes (fig. S16, D and E) that maintain nuclear Setdb1 and H3K9me3 levels, as well as expression of major urinary proteins (MUPs) (fig. S16D). However, the bulk of Setdb1-negative cells show lower levels of H3K9me3 and no expression of MUPs, in stark contrast to wt livers that uniformly express pericentral MUPs (fig. S16D). Thus, Setdb1 modulates hepatocyte differentiation.
Fig. 3. Setdb1 mutant hepatoblasts up-regulate lineage-nonspecific genes.
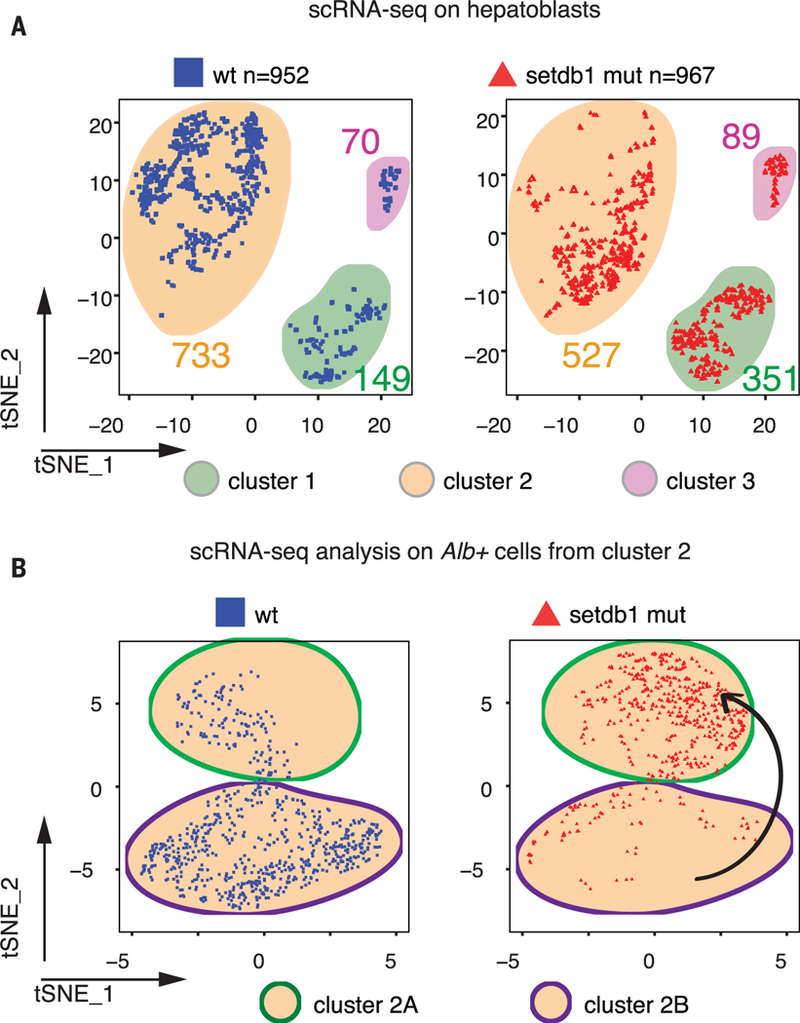
(A) t-Distributed stochastic neighbor embedding (tSNE) plots of single-cell RNA-seq data showing wt (cells from n = 7 embryos; left, blue squares) and Setdb1 mutant (cells from n = 3 embryos; right, red triangles) cells in the three identified clusters. (B) tSNE plots of single cell RNA-seq data showing wt (top, blue squares) and Setdb1 mutant (bottom, red triangles) Albumin-positive cells from cluster 2. The black arrow indicates transition of Setdb1 mutant cells (red triangles) to a different cluster from that of the wt cells (blue squares).
The persistence of low-level H3K9me3 in the conditional Setdb1 mutants and Suv39h1 and Suv39h2 double mutants (fig. S16B and S18A), the appearance of escaper cells (fig. S16D, arrows), and the expression of H3K9me3-related HMTases being higher in definitive endoderm, compared to more specified cells (fig. S18B), prompted us to generate an endoderm-specific conditional triple-knockout mutant (TKO) murine strain of all three H3K9me3-related HMTases (fig. S19, A to F). Protein analysis showed a clear reduction in Setdb1, Suv39h1 (fig. S20A), and Suv39h2 (fig. S20B), leading to a marked decrease in H3K9me3, but not in H3K27me3 and H3K9me2 (fig. S20, A and C). Single-cell RNA-seq on e11.5 Liv2+ cells revealed that TKO hepatoblasts clustered into a separate group compared to wt and Setdb1 mutant cells (Fig. 4A), with an overlap of only 43 genes, of nonliver types, up-regulated in common between TKO and Setdb1 mutant cells (table S15). Indeed, despite expressing albumin (fig. S20D), TKO cells did not gain a clear hepatic transcriptional profile (fig. S20E and table S15). One-month-old triple-mutant animals (n = 5) appeared smaller in size compared to control littermates (Fig. 4B), showing up to a threefold reduction in body weight (fig. S21A). TKO livers display inflammatory phenotypes, characterized by a ductular reaction (Fig. 4C). Genomic analysis (fig. S21, B and C) confirmed a substantial loss in srHC and H3K9me3 (Fig. 4D), which was validated by a global loss of condensed chromatin as seen by electron microscopy (Fig. 4E). RNA-seq data on 1-month-old livers (fig. S21, D and E) revealed a marked derepression of nonhepatic genes in TKO livers and a failure to induce mature hepatocyte genes such as MUPs (fig. S22, A and B, and table S16). The latter phenotype, seen also in adult Setdb1 KO livers (fig. S16D), indicates secondary effects upon depletion of H3K9me3-related HMTases. Notably, markers associated with chromosomal instability were mostly unaffected (fig. S22, C to E). Thus, failure to establish H3K9me3-marked heterochromatin during early development leads to a failure of hepatocyte maturation, even 1 month after birth, and results in expression of inappropriate lineage genes.
Fig. 4. TKO mutant cells lose hepatic identity and show developmental phenotypes associated with decreased H3K9me3 and srHC levels.

(A) tSNE plots of e11.5 single-cell RNA-seq data showing wt, Setdb1 mutant (same as in Fig. 3), and TKO (cells from n = 7 embryos; right, dark green circles) cells in the four identified clusters. (B) Representative morphological phenotype of 1-month-old control (ctrl) (n = 3) and FoxA3-cre; Setdb1 fl/fl; Suv39h1 fl/fl, Suv39h2 KO KO triple-knockout (TKO) mutants (n = 5). (C) Hematoxylin and eosin (H&E) staining and cytokeratin 7 immunohistochemistry in 1-month-old ctrl and TKO livers. Scale bar: 50 mm. (D) Percentage of genome covered by H3K9me3 and srHC domains in ctrl and TKO livers. (E) Representative electron microscopy images for ctrl and TKO 1-month-old hepatocytes. Scale bar: 600 nm. The number of cells recorded in the two groups is indicated at the bottom.
Heterochromatin has been defined by biophysical properties more than by repressive histone modifications (25). We employed an approach whereby srHC is isolated and characterized independently and in correlation with H3K9me3. We found higher levels of heterochromatin at gene bodies in early, uncommitted endodermal and mesodermal cells and observed a developmental loss of H3K9me3 and srHC during cell differentiation in vivo (fig. S23A). Genetics of H3K9me3-related HMTase mutant mice highlighted the importance of proper heterochromatin establishment to promote cell differentiation. These findings underscore how epigenetic regulation of chromatin structure controls cell identity in embryogenesis. We propose a role for H3K9me3-marked heterochromatin as an epigenetic contributor to the hourglass model (1–3), working in concert with homeobox proteins (1) and signaling (2) influences, to constrain gene activity during the phylotypic period of embryonic development and guarantee establishment of cell identity.
Supplementary Material
ACKNOWLEDGMENTS
We thank K. Kaeding and R. McCarthy for comments on the manuscript; Y. Shinkai (RIKEN) for the Setdbl floxed/floxed strain; the Molecular Pathology and Imaging Core at The University of Pennsylvania (UPenn); T. D. Raabe, J. Henao-Mejia, and J. Richa and the Transgenic and Chimeric Mouse Core (NIH/NIDDK Digestive Diseases Research Center; NIH-P30-DK050306); and the Flow Cytometry and Cell Sorting Facility and the Electron Microscopy Biomedical Research Core Facilities at UPenn.
Funding: DFG grant NI-1536 to D.N.; NIH grant GM036477 to K.S.Z.; NIH grant GM110174 to B.A.G; NIH grant DP2MH107055 and the Charles E. Kaufman Foundation (KA2016–85223) to R.B.
Footnotes
Competing interests: The authors declare no competing interests.
Data and materials availability: All genomic data are being made accessible at the Gene Expression Omnibus (GEO) database repository GSE114198.
SUPPLEMENTARY MATERIALS
REFERENCES AND NOTES
- 1.Duboule D, Dev. Suppl, 135–142 (1994). [PubMed] [Google Scholar]
- 2.Raff RA, The Shape of Life: Genes, Development, and the Evolution of Animal Form (University of Chicago Press, IL, 1996). [Google Scholar]
- 3.Irie N, Kuratani S, Development 141, 4649–4655 (2014). [DOI] [PubMed] [Google Scholar]
- 4.Meshorer E, Misteli T, Nat. Rev. Mol. Cell Biol. 7, 540–546 (2006). [DOI] [PubMed] [Google Scholar]
- 5.Wen B, Wu H, Shinkai Y, Irizarry RA, Feinberg AP, Nat. Genet. 41, 246–250 (2009). [DOI] [PMC free article] [PubMed] [Google Scholar]
- 6.Ahmed K et al. , PLOS ONE 5, e10531 (2010). [DOI] [PMC free article] [PubMed] [Google Scholar]
- 7.Hawkins RD et al. , Cell Stem Cell 6, 479–491 (2010). [DOI] [PMC free article] [PubMed] [Google Scholar]
- 8.Zhu J et al. , Cell 152, 642–654 (2013). [DOI] [PMC free article] [PubMed] [Google Scholar]
- 9.Ugarte F et al. , Stem Cell Reports 5, 728–740 (2015). [DOI] [PMC free article] [PubMed] [Google Scholar]
- 10.Vogel MJ et al. , Genome Res. 16, 1493–1504 (2006). [DOI] [PMC free article] [PubMed] [Google Scholar]
- 11.Chen T, Dent SYR, Nat. Rev. Genet 15, 93–106 (2014). [DOI] [PMC free article] [PubMed] [Google Scholar]
- 12.Wallrath LL, Elgin SC, Genes Dev 9, 1263–1277 (1995). [DOI] [PubMed] [Google Scholar]
- 13.Gilbert N et al. , Cell 118, 555–566 (2004). [DOI] [PubMed] [Google Scholar]
- 14.Fussner E et al. , EMBO J. 30, 1778–1789 (2011). [DOI] [PMC free article] [PubMed] [Google Scholar]
- 15.Peters AH et al. , Cell 107, 323–337 (2001). [DOI] [PubMed] [Google Scholar]
- 16.Beisel C, Paro R, Nat. Rev. Genet. 12, 123–135 (2011). [DOI] [PubMed] [Google Scholar]
- 17.Becker JS, Nicetto D, Zaret KS, Trends Genet. 32, 29–41 (2016). [DOI] [PMC free article] [PubMed] [Google Scholar]
- 18.Almouzni G, Probst AV, Nucleus 2, 332–338 (2011). [DOI] [PubMed] [Google Scholar]
- 19.Martínez P, Blasco MA, Nat. Rev. Cancer 11, 161–176 (2011). [DOI] [PubMed] [Google Scholar]
- 20.Nielsen SJ et al. , Nature 412, 561–565 (2001). [DOI] [PubMed] [Google Scholar]
- 21.Peters AHFM et al. , Nat. Genet. 30, 77–80 (2002). [DOI] [PubMed] [Google Scholar]
- 22.Dodge JE, Kang Y-K, Beppu H, Lei H, Li E, Mol. Cell. Biol. 24, 2478–2486 (2004). [DOI] [PMC free article] [PubMed] [Google Scholar]
- 23.Tachibana M, Nozaki M, Takeda N, Shinkai Y, EMBO J. 26, 3346–3359 (2007). [DOI] [PMC free article] [PubMed] [Google Scholar]
- 24.Wang C et al. , Nat. Cell Biol. 20, 620–631 (2018). [DOI] [PubMed] [Google Scholar]
- 25.Becker JS et al. , Mol. Cell 68, 1023–1037.e15 (2017). [DOI] [PMC free article] [PubMed] [Google Scholar]
- 26.Soufi A, Donahue G, Zaret KS, Cell 151, 994–1004 (2012). [DOI] [PMC free article] [PubMed] [Google Scholar]
- 27.Matoba S et al. , Cell 159, 884–895 (2014). [DOI] [PMC free article] [PubMed] [Google Scholar]
- 28.Lee CS, Friedman JR, Fulmer JT, Kaestner KH, Nature 435, 944–947 (2005). [DOI] [PubMed] [Google Scholar]
- 29.Calmont A et al. , Dev. Cell 11, 339–348 (2006). [DOI] [PubMed] [Google Scholar]
- 30.Matsui T et al. , Nature 464, 927–931 (2010). [DOI] [PubMed] [Google Scholar]
Associated Data
This section collects any data citations, data availability statements, or supplementary materials included in this article.