Abstract
The anatomical organization of the granular layer of the cerebellum suggests an important function for Golgi cells (GC) in the pathway conveying mossy fiber (MF) afferents to Purkinje cells. Based on such anatomic observations, early proposals have attributed a role in “gain control” for GCs, a function disputed by recent investigations, which assert that GCs instead contribute to oscillatory mechanisms. However, conclusive physiological evidence based on studies of cerebellum-dependent behavior supporting/dismissing the gain control proposition has been lacking as of yet. We addressed the possible function of this interneuron by recording the activity of a large number of both MFs and GCs during saccadic eye movements from the same cortical area of the monkey cerebellum, namely the oculomotor vermis (OMV). Our cellular identification conformed to previously established criteria, mainly to juxtacellular labeling studies correlating physiological parameters with cell morphology. Response patterns of both MFs and GCs were highly heterogeneous. MF discharges correlated linearly with eye saccade metrics and timing, showing directional preference and precise direction tuning. In contrast, GC discharges did not correlate strongly with the metrics or direction of movement. Their discharge properties were also unaffected by motor learning during saccadic adaptation. The OMV therefore receives a barrage of information about eye movements from different oculomotor areas over the MF pathway, which is not reflected in GCs. The unspecificity of GCs has important implications for the intricacies of neuronal processing in the granular layer, clearly discrediting their involvement in gain control and instead suggesting a more secluded role for these interneurons.
Keywords: Golgi cells, mossy fibers, cerebellum, saccades, saccadic adaptation, oculomotor
Introduction
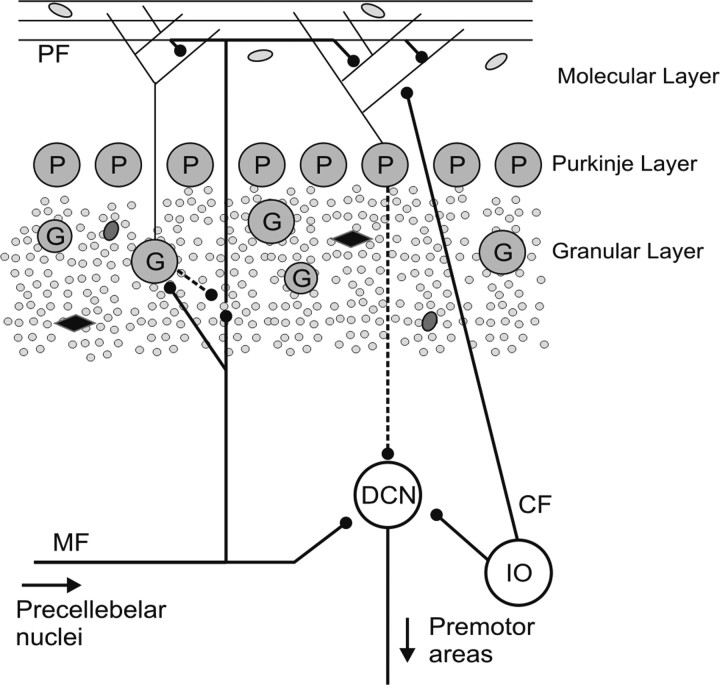
The cerebellar cortex is anatomically organized in three distinct layers: the molecular layer, the Purkinje cell (PC) layer and the granular layer (see Fig. 1). The pathways carrying the two known inputs to the cerebellum [climbing fibers and mossy fibers (MFs)] converge at the level of Purkinje cells, which in turn provide the only output of the cerebellar cortex, with their axons terminating in the deep cerebellar and vestibular nuclei.
Figure 1.
Schematic of the cerebellar cortex organization. Excitatory and inhibitory synapses are distinguished with solid and dotted lines respectively. PF, Parallel fibers; DCN, deep cerebellar nuclei; IO, inferior olive; CF, climbing fibers; G, Golgi cells; P, Purkinje cells. Small gray circles represent granule cells and the other undefined symbols represent other interneurons found in the granular and molecular layers.
Whereas the climbing fibers excite the PCs and possibly some interneurons directly, the MF pathway to PC dendrites is indirect. The MF afferents first synapse with cellular elements in the granular layer before the information is transmitted to the PCs via parallel fibers (for a review, see Ito, 2006). Golgi cells (GCs) process the information carried by MFs to the cerebellum before this signal reaches the PC layer. They are the most numerous interneurons in the granular layer [apart from granule cells (GrC)] (Simat et al., 2007), have comparatively larger somata than other interneurons (Barmack and Yakhnitsa, 2008), receive direct excitation from both parallel and mossy fibers (Palay and Chan-Palay, 1974), and in turn exhibit an exclusive inhibition of thousands of GrCs (Hámori and Szentágothai, 1966). The GCs could also potentially modulate the MF signals directly, namely by spillover of GABA through GABAB receptors found on MF rosettes (Mitchell and Silver, 2000).
Early studies on the cerebellum (Eccles et al., 1967; Marr, 1969; Albus, 1971; Ito, 1984) postulated a number of concepts purely based on anatomical and theoretical considerations that greatly influenced subsequent investigations. One such concept was that cerebellar GCs perform gain control over the MF transmission to PCs [for a detailed discussion, see the study by De Schutter et al. (2000)]. In short, a greater excitation of GrCs by the MFs would lead to an increased inhibition of the same GrCs by the activated GCs, resulting, overall, in limiting the amount of excitation that is transmitted to the PCs. However, more recent physiological findings about cerebellar GCs (Dieudonne, 1998; Vos et al., 1999a, 1999b; Holtzman et al. 2006) have proven to be inconsistent with this classical view. Instead, they led to alternative concepts about their functional role, such as their implication in launching oscillatory mechanisms in the granular layer (Maex and De Schutter, 1998; De Schutter et al., 2000). Still, such propositions remain speculative. Very little is in fact known about the specific properties of or the role GCs might have, mainly because in vivo recordings from animals involved in well controlled behaviors are lacking.
Consequently, with the intention to shed more light on their properties and eventual function they might have in the cerebellar processing of information, we recorded from a substantial number of both GCs and MF terminals in the oculomotor vermis (OMV) (the narrow strip along the midline of lobules VIc and VIIa of the cerebellum), while monkeys executed visually guided saccades. Eye saccades, a model of cerebellum-dependent motor behavior, provide a comparative advantage over other types of motor behavior resulting from the small number of degrees of freedom and simpler kinematics-to-dynamics transformations.
Materials and Methods
Animals
Two rhesus monkeys (Macaca mulatta) A and N were prepared for eye position recording using the magnetic scleral search coil technique (Judge et al. 1980). To painlessly immobilize the monkeys' heads, a titanium pole was attached to the skull with titanium bone screws. Titanium was used for its high biocompatibility and for compatibility in magnetic resonance imaging (MRI) settings. Recording chambers (also titanium) were implanted over the posterior part of the skull to gain access to the posterior cerebellum for extra-cellular recordings. The middle of the cylinder axis was aimed to the interaural position (0, 0, 0 in stereotaxic coordinates) and inclined by 40° in the posterior direction about the axis perpendicular to the interaural plane. All surgical procedures were conducted under general anesthesia (introduced with ketamine and maintained by inhalation of isoflurane and nitrous oxide, supplemented by intravenous remifentanil) with control of vital parameters (body temperature, CO2, O2, blood pressure, electrocardiogram), followed the guidelines set by the National Institutes of Health and national law and were approved by the local committee supervising the handling of experimental animals. After the surgery, monkeys were supplied with analgetics until full recovery.
Behavioral tasks
During all behavioral tasks, the monkeys sat head-fixed in a primate chair in total darkness. They were trained to make saccadic eye movements to a white target dot (0.2° diameter) displayed on a monitor screen positioned 42 cm in front of the animals. The eye position signal measured by the scleral search coil method was calibrated and sampled at 1 kHz. The monkey received an automatic liquid reward each time he successfully executed the eye saccade; i.e., maintained gaze inside an eye position window (±1.5°) during initial fixation until the target jump, and displaced the eyes back inside the window and maintained fixation no later than 300 ms after the jump.
Directional selectivity paradigm
To test for the directional preference of the recorded units, the monkeys executed visually guided saccades from an initial central fixation point toward targets located at 10° eccentricity in eight different directions in the frontoparallel plane. We designated each direction by their angular polar coordinate. Directions included two horizontal (rightward: 0° and leftward: 180°), two vertical (upward: 90° and downward: 270°), and four diagonal (right-up: 45°, left-up: 135°, left-down: 225°, and right-down: 315°) directions. The monkeys initially fixated a central fixation point for 1000 ms, after which the peripheral target appeared with the simultaneous disappearance of the fixation target. After the saccadic eye movement, the monkeys had to fixate the peripheral target for 300–500 ms. Target directions were randomly chosen from trial to trial.
Amplitude tuning paradigm
To test for the tuning of cells to saccades of different amplitudes, the animals executed visually guided saccades from a central fixation point toward targets at eight different peripheral eccentricities (from 2.5° to 20° in 2.5° steps) in the single radial direction for which the neuron had preferentially responded. The central and peripheral fixation times were as in the directional selectivity paradigm. The target amplitude was randomly chosen for each trial.
Saccadic adaptation paradigm
Saccades were adapted using the standard “McLaughlin” paradigm (McLaughlin, 1967). The monkeys were asked to make saccades from a central fixation point toward a peripheral target in the preferred direction of the neuron and at a fixed eccentricity. During the execution of the saccade, the target spot was shifted either back toward the fixation point (inward adaptation) or in the direction away from it (outward adaptation). The monkey shifted its gaze to the initial target location and then produced a corrective saccade toward the shifted target. This procedure was repeated up to 1000 trials during which the monkey progressively learned to either decrease or increase the amplitude of the initial saccades [see the study by Catz et al. (2005) for examples illustrating saccadic adaptation]. The initial target amplitudes, as well as the sizes of target shifts, were varied between different adaptation sessions. The percentage of gain change was calculated as ±|1-saccade_amplitude/initial_target_amplitude| × 100. Gain change percentiles were defined as positive for outward and negative for inward adaptation.
Electrophysiology
Postsurgical MRI was used to facilitate the anatomic localization of cerebellar lobules VI and VIIa. The identification of this area was confirmed by extra-cellular recordings characterized by frequent saccade-related multiunit background bursts and a large number of saccade-related single units. All extra-cellular action potentials were recorded with commercially available glass-coated tungsten microelectrodes (Alpha Omega Engineering) with 1–2 MΩ impedances that were driven to the cerebellum by means of a high precision motor (1 μm movement steps). Single units were isolated on-line with the Multi Spikes Detector software (Alpha Omega Engineering) by detecting and sorting waveforms according to shape. We did not attempt to discern what side of the OMV we were recording from.
Data analysis
Processing of eye position and neuronal activity data.
All analyses were performed off-line with custom programs compiled in Matlab (Mathworks). The recorded horizontal and vertical eye position traces were smoothed with a Savitzky-Golay filter (window = 10 points, polynomial degree = 4), which replaces the data points in the specified window by a polynomial regression fit of the chosen degree. With a window of 10 points and a fourth degree polynomial, the eye position data are low-pass filtered with a bandwidth of ∼100 Hz, which is appropriate for frequencies of natural eye movements (20–30 Hz). Two-dimensional velocity vectors were computed and we used the 20 °/s velocity criterion for detecting saccade onset and end. Saccades with maximal velocity <100 °/s or with durations longer than 100 ms were discarded (this comprised <1% of saccades).
We estimated the instantaneous firing rate of the recorded neurons with a continuous spike density function, generated by convoluting the spike train with a Gaussian function of width σ = 20 ms. A Poisson spike train analysis (Hanes et al., 1995) was applied to detect the time stamps of onset and end of bursts for the relevant neurons. This analysis relies on a surprise index (SI) defined as SI=−log(P), where P is given in Equation 1 and is the probability that, given a mean discharge rate r of the entire spike train being analyzed, a spike train of a time interval T contains n or more spikes. Burst peaks were then calculated as the maximum value of the estimated spike density function between these two time stamps.
 |
The sample average of the dependence of burst peaks on saccade amplitude (see Fig. 8A,C) was computed by first dividing the range of amplitudes for saccades in the preferred direction of the unit into 10 equally sized bins of 2°. Mean burst peaks were then calculated for each bin for each neuron. The average amplitude tuning data were then computed as the average of all the mean values in each bin across all neurons that had been tested at the amplitude represented by that particular bin. The population activity of all neurons (see Fig. 8B,D) was computed by dividing the range of saccade durations into 21 equally sized bins of 2 ms. Recorded spike trains were then assigned to their corresponding bins, and the population mean was computed so as to have each neuron contribute equally to the population response. The spike density function was estimated for the averaged spike trains in each bin as described above. The end of the population response in each bin was determined as the time when the burst decreased below a subjectively chosen value of five SDs above the mean of activity during the first 750 ms of fixation. Calculating population averages this way is not intended to have any anatomic significance, it is instead used as a pertinent method in capturing the temporal information conveyed by a particular group of neurons.
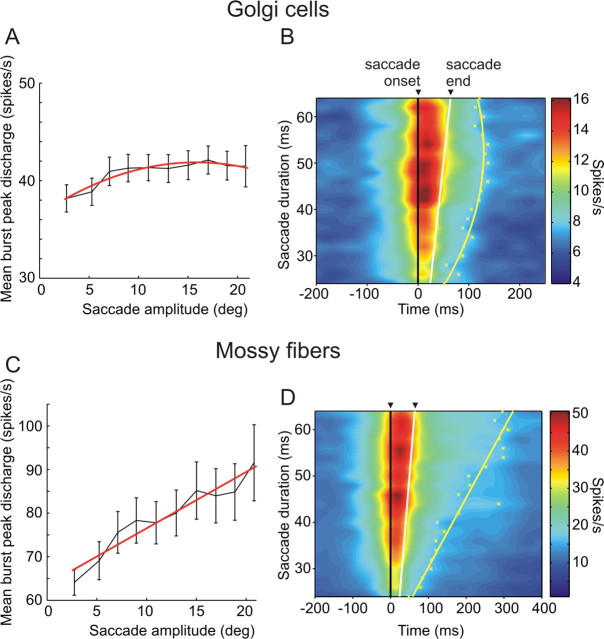
Figure 8.
Amplitude tuning properties of the average peak discharge of Golgi cell and mossy fiber bursting units (A, C) and timing properties of the mossy fiber and Golgi cell population responses. A, Mean burst peak discharge as a function of saccade amplitude calculated for 105 Golgi cells. The delimiters indicate SEs, and the red line is a quadratic least squares fit to the data points. B, Population response of 177 Golgi cells. Yellow crosses indicate the estimation of the burst end for each duration bin, and the yellow line is a least squares quadratic fit to those points. C, Same data as in A but for 86 mossy fibers fitted with a linear function. D, Same data as in B but for 103 mossy fibers with the yellow line being a linear least squares fit.
Statistical analysis and data fitting.
We performed a Student's (when the two samples had equal variances) or Welch's (when the two samples had unequal variances) t test whenever we wished to evaluate whether two data samples come from the same distribution with equal means. Normality of data were tested with the Kolmogorov–Smirnov test. We deemed the difference to be statistically significant when the probability (p value) of having distributions with equal means did not surpass the 5% level. Where appropriate, the computed p value was multiplied by the number of performed tests to correct for multiple comparisons (Bonferroni correction).
Linear and quadratic fits to data points were computed using the method of least squares. The coefficient of determination r2 was used to evaluate how well the model fitted the data and the F-statistic was calculated to evaluate the probability (p value) that all parameters in the model fit were equal to zero. Furthermore, the F test with v1 and v2 degrees of freedom was performed to evaluate whether fitting the data with a quadratic rather than a linear model was justified. The F test gives the probability (p value) that the model with added parameters yields the same noise variance as the initial linear one. We deemed the quadratic model as being justified when the probability of having the same noise variance was <5%.
The directional tuning curves shown in Figure 5 were intended for a qualitative description only and were least squares fits to the data points using Equation 2 with N = 4 (β are the free parameters, τ the angle in radians is the independent variable). This polar equation produces a periodic smooth curve that passes through the eight data points in a polar plot, as follows:
 |
for
 |
Nonlinear regression was used to fit Gaussian curves to the directional data (see Figs. 5, 6B). Perisaccadic activity was computed as the average spike density from 50 ms before saccade onset until 200 ms after saccade onset, and activity during central fixation was computed as average spike density from 500 to 200 ms before saccade onset. The perisaccadic data were first normalized by subtracting the mean activity during central fixation and then by dividing all the points by the maximum (or minimum for pausing units) value. Accordingly, in the normalized perisaccadic activity ratios (see Figs. 5, 6B), a value of one indicates maximum (or minimum for pausing units) activity, and the zero level corresponds to the baseline activity (during central fixation). The goodness of fit was evaluated uniquely by the coefficient of determination r2, and a Gaussian fit was deemed to be inappropriate when 95% confidence intervals on the estimated parameters were unreasonable. The preferred direction of each tested neuron was defined to be the angular value corresponding to the peak of the fitted Gaussian curve; only where a Gaussian fit was judged appropriate.
Figure 5.
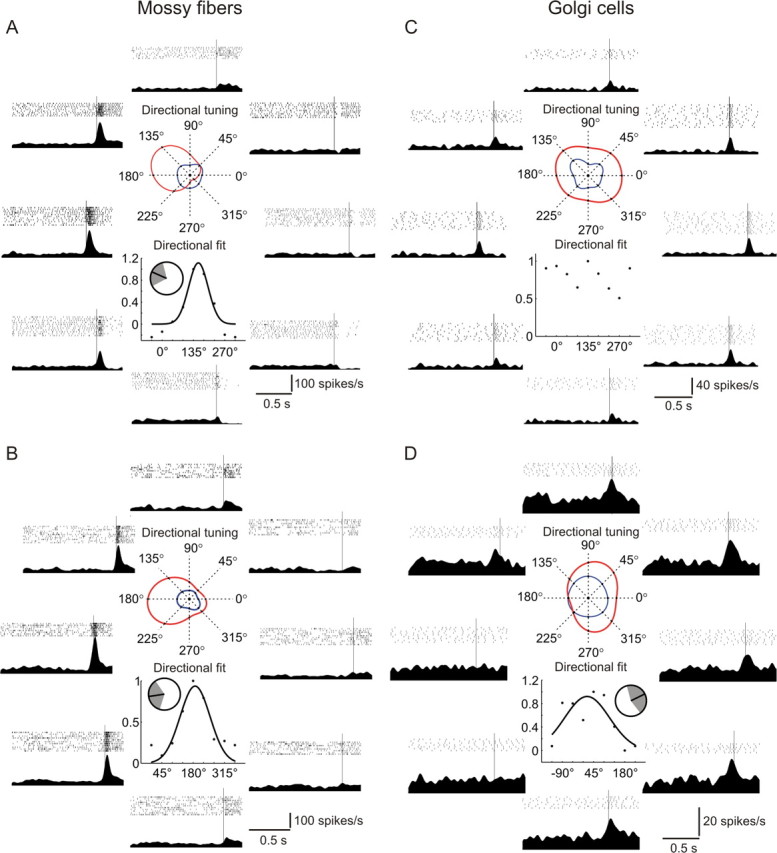
A–D, Directional tuning properties of two exemplary mossy fibers (A, B) and Golgi cells (C, D). In each figure, the top central panel shows the directional tuning of the perisaccadic activity (in red) and activity during fixation (in blue) to the eight directions of movement. The bottom central panel shows a Gaussian fit to the normalized perisaccadic activity ratio points (see Materials and Methods) for the eight directions, and the inset depicts the preferred direction of movement of the cell (angle corresponding to the peak of the Gaussian fit), with the shaded area corresponding to the SD of the Gaussian curve. Each exterior panel is aligned with one of the eight movement directions and shows the raster plot and the mean spike density for that direction. All trials are aligned on saccade onset represented by the thin vertical line. The absence of a curve fit in C indicates that a Gaussian function was inappropriate to describe the data.
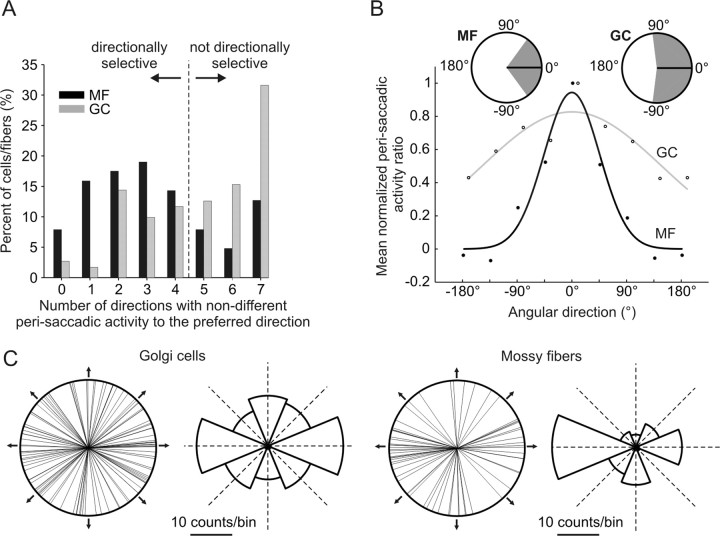
Figure 6.
Directional selectivity properties of GC and MF. A, Histogram showing the percentage of cells/fibers considered to be directionally selective. Only units in which mean perisaccadic activities in the preferred direction of movement were not significantly different from the mean in four or less neighboring directions were considered to be directionally selective. B, Gaussian fits to the mean normalized perisaccadic activity ratio points (see Materials and Methods) of the eight tested directions of 111 and 63 Golgi cells (empty circles) and mossy fibers (filled circles) respectively, aligned to the direction where their mean perisaccadic activity is maximal. Insets, The SD (shaded area) around the preferred direction of the average cell/fiber. C, Circular plots showing the preferred directions of 97 Golgi cells and 61 mossy fibers (only units with appropriate Gaussian fits to the directional data points were included, see Materials and Methods), together with histograms in which these directions were binned into octants. The arrows and dotted lines designate movement directions.
Results
Identification of Golgi cells and mossy fibers
Before any attempt in trying to record action potentials from specific neuronal types, we made sure that the recording electrode was situated in the granular layer. The PC layer was used as a landmark for this purpose (Fig. 1). PCs were readily identified by the simultaneous presence of simple and complex spikes (Eccles et al. 1967; Thach 1968) (Fig. 2A). Further advancing the electrode past the PC layer, depending on the orientation of the cerebellar folia, either the molecular or the granular layer could be encountered. The molecular layer was characterized by prominent complex spikes with any other action potentials being highly infrequent (Fig. 2B). Otherwise, if the electrode was advanced into the granular layer, complex spikes disappeared completely and action potentials from other cellular elements could be encountered and clearly isolated, albeit less frequently than in the PC layer, where the large-sized neurons are more densely distributed (Fig. 2C). Another important criterion which permitted the distinction between granular and molecular layers was the beehive-like saccade-related background activity. Whereas the molecular layer remained relatively silent, saccade-related multiunit activity often dominated the background of the granular layer. These criteria are in line with previous electrophysiological identification of cerebellar layers confirmed by histological verification of electrolytic lesion sites in monkeys (Miles et al., 1980; van Kan et al. 1993).
Figure 2.
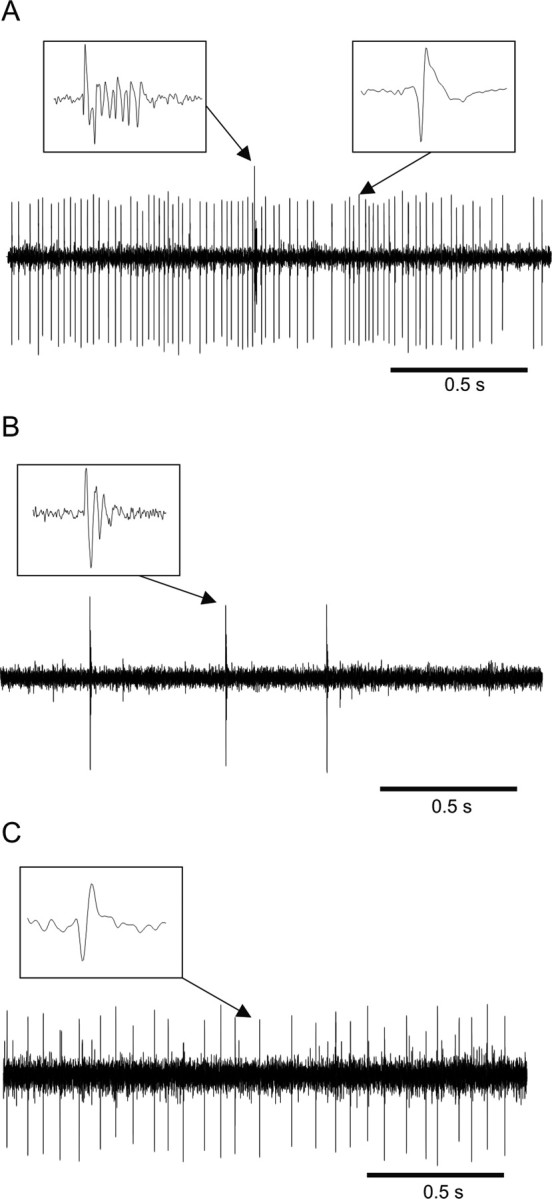
Electrophysiological identification of different layers of the cerebellar cortex. A–C, Typical signals recorded from electrodes located in the Purkinje cell (A), molecular (B), and granular (C) layers. Insets, Enlarged waveforms of spikes pointed to by the arrows.
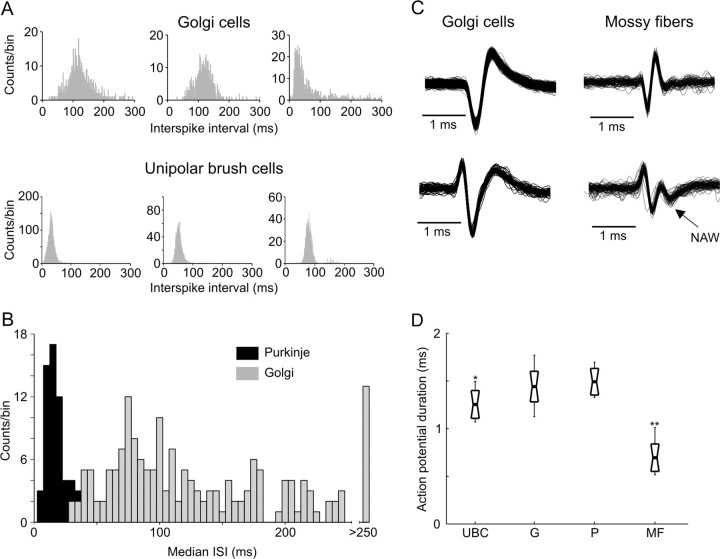
With the recording electrode located in the granular layer of the OMV, GCs were recognized mainly on the basis of a unique electrophysiological signature established by Barmack and Yakhnitsa (2008) (in the mouse cerebellum), and Holtzman et al. (2006) and Simpson et al. (2005) (in the rat cerebellum) who compared a number of electrophysiological parameters based on extracellular recordings with the morphology of cells as revealed by subsequent juxtacellular labeling. In accordance with these studies, units we identified as GCs were characterized by the absence of complex spikes and by action potentials that all showed tonic activity at rest with low mean firing frequencies (2–30 Hz), distinctive interspike interval (ISI) histogram shapes lacking high frequency components (Fig. 3A) and well pronounced, long (> 1 ms) and di/tri-phasic action potential wave shapes (Fig. 3C). In accordance with previous work (Holtzman et al., 2006), a comparison of the ISI distributions of individual cells we identified as either Golgi or Purkinje revealed that the two types of units possessed different discharge properties at rest (Fig. 3B). Whereas median ISI values of GCs covered a wide range of intervals, those of PCs fell into a much narrower range of 5 to 40 ms with very little overlap between the distributions of median ISIs of the two populations of neurons. This comparison provides an additional guideline for distinguishing GCs from the PC simple spike discharges when the latter is not necessarily accompanied by complex spikes.
Figure 3.
A, Exemplary ISI histograms characterizing individual Golgi cells and unipolar brush cells. B, Comparison between median ISI values of Golgi and Purkinje cells. C, Comparison between typical action potential wave shapes recorded from Golgi cells and mossy fibers. D, Distribution of action potential durations calculated from 10 randomly chosen UBCs, Golgi cells (G), Purkinje cells (P), and MF. Durations were measured from the beginning of the wave, up to the last moment the wave again crossed the initial level (the long negative rebound period was not included). The thick black line indicates mean values, short delimiters the SD, and long delimiters the full data range. The distribution of action potential durations of all units are compared with that of Golgi cells; *p < 0.03, **p < 10−7.
Other cellular elements that could give rise to action potentials in the granular layer include GrCs, unipolar brush cells (UBC), Lugaro cells, and MF terminals. More often than the putative GCs, we encountered very short and faint action potentials rather randomly in the granular layer (Fig. 3C). They were often followed by a negative after-wave (NAW) and were difficult to keep isolated for longer times. Based on previous similar descriptions from awake monkey recordings (Kase et al., 1980; Miles et al. 1980; Ohtsuka and Noda, 1992; van Kan et al. 1993), we assigned these action potentials to be emanating from MF terminals. The ISI histograms computed for these units were, however, highly diverse and unlike for GCs, typical histograms exemplifying the putative MFs could not be provided. The main criteria for identifying MFs (with the electrode in the granular layer) were either the presence of the NAW, or action potential durations significantly shorter than those of units thought to reflect cellular elements (Fig. 3D). van Kan et al. (1993) furthermore confirmed this identification by asynaptic activation of such units from electrical stimuli of the peduncle. We excluded GrCs as the possible origin of such potentials because the size of their somata (4–6 μm) seems to be much smaller than that of MF rosettes, which makes their recording possible only if high impedance electrodes (>15 MΩ) are used (Barmack and Yakhnitsa, 2008). Climbing fibers that branch through the granular layer are also excluded as possible sources because, in addition to being ∼50 times less frequent than MFs (Ito, 1984), they fire at very low rates (0.5–2 Hz) (Thach, 1968), unlike the high frequency bursts we recorded.
The units we identified as GCs could potentially also be mistaken for UBCs or Lugaro cells, the other two large-sized interneurons of the granular layer. Luckily, UBCs have been identified and characterized in juxtacellular labeling studies of Barmack and Yakhnitsa (2008) and Simpson et al. (2005). They discharge at highly regular firing rates and hence show narrow ISI histograms, with a wide range of possible median values. We have indeed encountered cells in the granular layer corresponding to this description (Fig. 3A) and have excluded them from our GC population, although recorded spike trains with similar properties have also been attributed to Golgi units after juxtacellular labeling (Holtzman et al., 2006). We also found that the presumed UBCs we recorded have action potential durations significantly shorter than GCs (Fig. 3D), which would be consistent with their comparatively smaller somata sizes (Barmack and Yakhnitsa, 2008). Unfortunately, we cannot exclude the possibility that some Lugaro cells were erroneously included in our GC group, simply because, to our knowledge, Lugaro cells have never been physiologically characterized in vivo; only in slice preparations of the rat cerebellum (Dieudonné and Dumoulin, 2000). It should however be noted that GCs largely outnumber the Lugaro cells in the granular layer [the ratio of Golgi to Lugaro cells is ∼67/15 in the mouse cerebellum according to Simat et al. (2007)]. Finally, unlike previously reported (Edgley and Lidierth, 1987), we did not find that PC action potentials were shorter than those of GCs (Fig. 3D) were. The GC action potential durations were, however, more variable, which would be in agreement with their morphological heterogeneity (Geurts et al., 2003).
As a final point, it is important to state that we did not confirm the identity of Golgi cells or mossy fiber terminals morphologically, nor did we perform electrolytic lesions at recording sites. Our identification therefore remains putative.
Heterogeneity of response patterns evoked by eye saccades
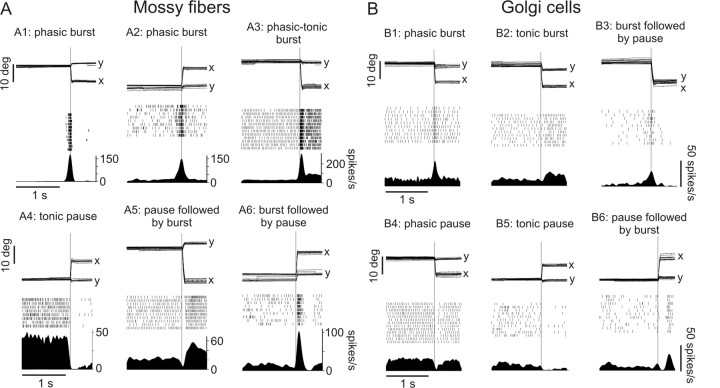
We recorded eye saccade responses of 177 putative GCs and 103 putative MFs. Both types of units exhibited a variety of response patterns including burst only [69% for MFs (Fig. 4A1–3); 65% for GCs (Fig. 4B1)] and pause only [14% for MFs (Fig. 4A4); 25% for GCs (Fig. 4B4–5)], while other cells/fibers exhibited a burst-followed-by-a-pause or pause-followed-by-a-burst pattern [17% for MFs (Fig. 4A5–6); 10% for GCs (Fig. 4B3,6)]. Both saccade-related (phasic) and position-related (tonic) increases (bursts) and decreases (pauses) in firing rate levels were observed.
Figure 4.
A, B, Diversity of response patterns recorded from six exemplary mossy fibers (A) and Golgi cells (B). In each panel, the upper trace represents horizontal (x) and vertical (y) eye movements, the middle trace shows the spike raster plot, and the lower trace is the estimated mean spike density function for all trials. All trials are aligned on saccade onset represented by the thin vertical line.
High unit-to-unit variability in start timings of the bursting responses (as detected by a Poisson spike train analysis; see Materials and Methods) relative to saccade onset [median (lower quartile, upper quartile): −14 (−64, 10) ms, n = 87 for MFs; −11 (−58, 7) ms, n = 126 for GCs] and end timings relative to saccade end [median (lower quartile, upper quartile): 10 (−27, 74) ms, n = 87 for MFs; 24 (−20, 81) ms, n = 126 for GCs], as well as highly variable durations of the related bursts [median (lower quartile, upper quartile): 94 (56, 145) ms, n = 87 for MFs; 104 (67, 155) ms, n = 126 for GCs] and pauses (subjectively evaluated), was observed without any obvious relationship to their classification as GCs or MFs. Where the GCs strikingly differed from MFs however, was in the peak frequency of the burst responses. GCs only rarely displayed saccade-evoked bursts >100 spk/s [median (lower quartile, upper quartile): 40.6 (32.8, 53.45) spk/s, n = 126], whereas MFs exhibited very strong bursts of activity often in the range of 100–200 spikes/s [median (lower quartile, upper quartile): 67.9 (49.2, 97.7) spikes/s, n = 87]. Further qualitative differences could be observed between the responses of MFs and GCs, namely in the pause and position-related burst patterns. The position-related bursts recorded from GCs had wavering firing rate levels and often decreased to baseline during prolonged eccentric fixation. Although most position-related responses of MFs approximately resembled those of GCs, many also showed distinct constant tonic levels maintained during prolonged peripheral fixation. These were often accompanied by phasic components and resemble the discharge of motor units in the abducens nucleus (Fig. 4A3). Whereas the pause responses of GCs could either be very precise and short (Fig. 4B4) or long and position-related (Fig. 4B5), those of MFs all persisted for longer durations, often throughout peripheral fixation (Fig. 4A4).
Golgi cells and mossy fibers have differing directional selectivity properties
The identified GCs and MFs were tested for directional selectivity while the monkeys executed saccades in eight different directions in the frontoparallel plane (see the directional selectivity paradigm in Materials and Methods). For each tested unit, the perisaccadic activity (see Materials and Methods) was computed on a trial by trial basis and mean values were obtained for each of the eight directions of movement. The maximum (or minimum for pausing units) mean value was compared with the means of the other seven directions; when the difference was not statistically significant in more than four neighboring directions (meaning that directions >90° apart have similar activities), the unit was labeled as not directionally selective (see Fig. 6A). If, on the contrary, the unit showed directional selectivity, the preferred direction was evaluated as the angular value at which a Gaussian fit to the data points reached its peak.
From the 63 MFs (26 from monkey A and 37 from monkey N) tested using this paradigm, most (47, i.e., 74.6%) showed a clear directional tuning as illustrated by two typical examples in Figure 5A,B. Furthermore, the directionally selective MFs differed in the amount of suppression of their discharge relative to baseline for the direction opposite to the preferred one; some held their activity close to baseline (Fig. 5B), while others ceased firing (Fig. 5A). The 111 GCs (52 from monkey A and 59 from monkey N) tested for directional selectivity were found to exhibit a remarkably different behavior than the MFs. A minority of GCs (45, i.e., 40.5%) were directionally selective while the majority showed no clear directional preference as depicted in two typical examples in Figure 5C,D. Moreover, as many as 35 GCs (31.6%) showed no significant difference in their perisaccadic activity, when compared with the “optimal” direction, for all other seven neighboring directions (Fig. 6A), while this was true in the case of only eight MFs (12.7%).
To ascertain a categorical description of the directional selectivity behavior of the MF and GC populations, it was first of interest to establish to what extent the eight different directions of movement tested were represented in the perisaccadic discharge of the GCs and MFs respectively. To address this question, circular data of preferred directions of individual units was compiled (Fig. 6C; see figure legend for details). Both Rao's spacing test and Rayleigh's uniformity test (both evaluate the probability of the null hypothesis that circular data are uniformly distributed along the 360° range) yielded lower p values for MFs (Rao: p = 0.05, Rayleigh: p = 0.07) than for GCs (Rao: p = 0.17, Rayleigh: p = 0.81). The circular histograms provided in Figure 6C furthermore show that for both GCs and MFs, the two bins with maximum number of counts correspond to the two horizontal directions. These horizontal-preferring units constitute 51% of our MF sample but only 36% of our GC sample (25% would be expected for uniformly distributed data). It is therefore apparent that the octants corresponding to the other six nonhorizontal directions contain a proportionately larger number of counts for GCs than for MFs. Together, these findings suggest that MFs in the OMV are biased toward encoding horizontal movements, confirming previous findings of Ohtsuka and Noda (1992), but, in the same cortical area, all directions of movement seem to be more equally represented in the population response of GCs.
To directly compare the amount of direction selectivity of the two groups of units, we calculated the average normalized perisaccadic discharge of the two groups. For this purpose, the perisaccadic activity means of all individual cells/fibers were normalized in a way to always have the same direction (0°) as the preferred one (i.e., the tuning data were rotated so as the maximal perisaccadic activity value is pointing in the 0° direction). Least squares Gaussian fits to the population averages of such normalized data points (Fig. 6B) (see Materials and Methods for details) reveal that the MFs have a much narrower tuning than the GCs [variance parameter of the Gaussian curve with 95% confidence bounds: 64.35° (49.95°, 78.75°) for MFs and 208.35° (144.45°, 272.7°) for GCs]. Because the 95% confidence bounds on the variance estimates do not overlap for the two groups, the difference in direction tuning affinity is judged to be statistically significant.
Mossy fibers carry information about saccade metrics, Golgi cells do not
After having established the directional preference of the recorded GCs and MFs, the monkeys executed saccades toward targets at eight different eccentricities in the preferred direction of the cell/fiber (see amplitude tuning paradigm in Materials and Methods). Because saccades toward increasing target eccentricities are associated with increasing saccade amplitude, velocity and duration, this paradigm allows us to establish if and how movement metrics are encoded by the activity of the recorded cells/fibers.
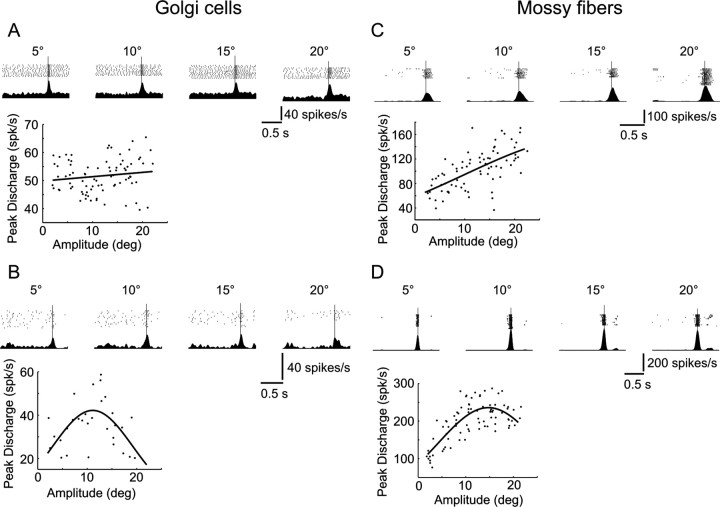
We first examined the GCs/MFs with burst responses using a Poisson spike train analysis (Hanes et al. 1995). Bursts were detected with this method in 105 (60 from monkey A and 45 from monkey N) and 86 (55 from monkey A and 31 from monkey N) of the recorded GCs and MFs, respectively, in the amplitude tuning paradigm. The peak discharge rate of the detected bursts was plotted as a function of increasing saccade amplitude for all the individual cells/fibers. Among the highly diverse tuning profiles that could be observed for all of the 105 GCs, two leading trends stand out and are illustrated by typical examples in Figure 7. As shown in these figures, the peak burst discharge of most GCs either increased weakly or not at all with increasing saccade amplitude (Fig. 7A), or showed clear preference for intermediate saccade sizes (Fig. 7B). Also, the bursts of individual MFs could be characterized by two predominant tuning profiles that were most often observed. However, unlike the GCs, burst peaks of many MFs correlated positively and distinctly with saccade size (Fig. 7C), while others reached their maximum at intermediate amplitudes (Fig. 7D). To obtain a statistical description of the GC and MF mean population burst responses, increasing saccade amplitudes were divided into bins and all of the detected bursts were averaged for each bin (see Materials and Methods for details), regardless of what the preferred direction of the cell/fiber was. The resulting population data (Fig. 8A,C) reveal that the MF peak burst discharge increases linearly with increasing amplitude (linear fit: r2 = 0.92, p < 10−4), whereas the relationship between saccade sizes and burst maxima for the GCs is best described with a comparatively flat inverse parabola (quadratic fit: r2 = 0.9, p = 0.0003; F test for quadratic vs linear fits: F = 18.13, v1 = 1, v2 = 8, p = 0.0028).
Figure 7.
A–D, Amplitude tuning characteristics of two exemplary Golgi cells (A, B) and mossy fibers (C, D). In each figure, the top panels each show the spike raster plot and the mean spike density for the indicated saccade amplitude (5°, 10°, 15° or 20°). All trials are aligned on saccade onset (vertical line). The bottom panels shows the peak discharge data points as a function of saccade amplitude and a corresponding least squares fit of a linear or Gaussian function.
Second, we sought to analyze how the timing properties of GC and MF activities modulate with saccades of increasing duration. To this end we ordered all the recorded saccades and the associated cell/fiber spike trains by increasing saccade duration, divided the record into equally sized bins, and computed the average spike activity for each bin (see Materials and Methods for details). In this manner, the mean population activity of 177 GCs (112 from monkey A and 65 from monkey N) (Fig. 8B) and 103 MFs (66 from monkey A and 37 from monkey N) (Fig. 8D), tested with the amplitude tuning paradigm regardless of their response patterns and preferred directions, could be evaluated. The onset of the MF population response relative to saccade onset (mean ± SD: −83.71 ± 21.17 ms) was found to precede that of the GC population (mean ± SD: −74 ± 15.7 ms) in a statistically significant manner (t test: p = 0.017). Both population bursts thereafter persisted beyond the end of the saccadic eye movement, but differed greatly in the timing properties of their cessation. On the one hand, the ending of the MF response correlated linearly with increasing saccade duration (linear fit: r2 = 0.89, p < 10−9) and on the other, the end of the GC population burst was best fitted with an inverse parabola as a function of saccade duration (quadratic fit: r2 = 0.86, p < 10−7; F test for quadratic vs linear fits: F = 31.18, v1 = 1, v2 = 19, p < 10−4). Moreover, the MF population response lasted far beyond that of the GCs [response end relative to saccade end, median (lower quartile, upper quartile): 138 (80, 231) ms, for MFs; 65 (54, 79.5) ms, for GCs], suspected to be caused by the strong position-related response patterns characterizing some of these units (Fig. 4A3).
Golgi cells do not seem to display plasticity during saccadic adaptation
Overall, 40 GCs could be kept isolated long enough to be tested during saccadic adaptation in the preferred direction of the cell/fiber [19 cells (13 from monkey A and 6 from monkey N) for inward and 21 cells (15 from monkey A and 6 from monkey N) for outward adaptation]. This form of short-term learning (see saccadic adaptation paradigm in Materials and Methods) allowed us to examine how GCs behave, compared with what is already known about the plasticity of PCs, during a recalibration of the saccadic system.
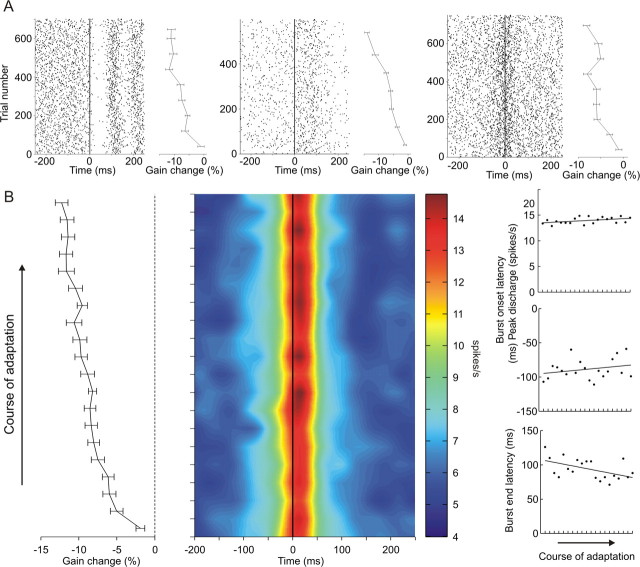
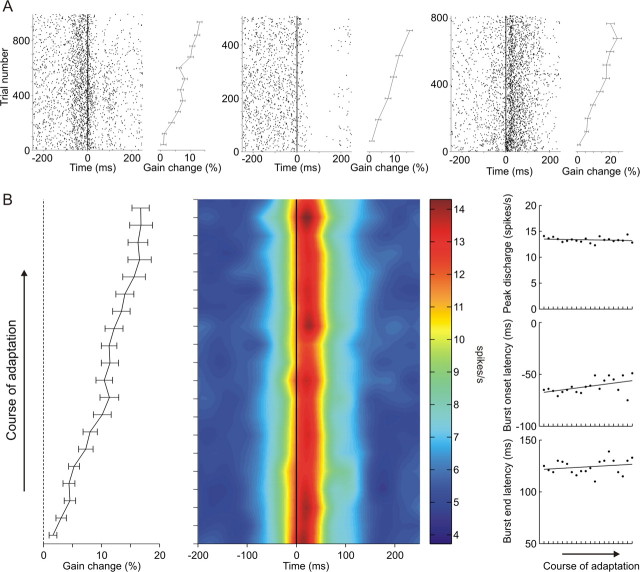
On an individual cell basis, we never observed obvious changes in the firing profiles of the recorded neurons. Despite progressively increasing or decreasing saccade amplitudes associated with a recalibrated saccadic command, individual GCs generally maintained their initial pattern of activity throughout the course of adaptation (Figs. 9A, 10A). Furthermore, the population mean activity was computed for the GCs tested for inward (Fig. 9B) and outward (Fig. 10B) adaptation. It was of interest to see whether and how peak activity, onset latency, and end latency estimates of the population average changed with increasing/decreasing saccade amplitude gains (see figure legends and Materials and Methods for details). Peak activity and onset latency showed no significant linear changes (linear fits: r2 = 0.19, p = 0.053 and r2 = 0.06, p = 0.28, respectively) during the course of inward adaptation, whereas the end latency of the burst showed a marginally significant decrease (linear fit: r2 = 0.26, p = 0.02). In the case of outward adaptation, the onset latency of the population burst exhibited a barely significant increase (linear fit: r2 = 0.23, p = 0.032), and peak discharge and end latency remain unchanged (linear fits: r2 = 0.03, p = 0.48 and r2 = 0.04, p = 0.38, respectively), while the amplitude of saccades increased.
Figure 9.
A, Spiking activity of three exemplary Golgi cells during the course of inward adaptation. Left panels in each example show spike raster plots for all trials aligned on saccade onset (vertical line). Right panels indicate mean (± SE) percentage gain changes during the course of adaptation. The mean percentage gain change was evaluated for each 80 consecutive trials. B, Population response of 19 Golgi cells during the course of inward adaptation. Middle panel, Mean population activity aligned at saccade onset (vertical line); left panel, mean (± SE) percentage gain change during the course of adaptation. Data from individual cells were all divided in increasing trial order into 20 equally sized bins, and population means were computed for each bin. Right panel, Peak discharge, burst onset latency, and burst end latency evaluated for the population activity for each of the 20 bins during the course of adaptation. Lines indicate linear least squares fits to the data points.
Figure 10.
A, Spiking activity of three exemplary Golgi cells during the course of outward adaptation. B, Population response of 21 Golgi cells during the course of outward adaptation. The panels are as in Figure 9.
Unfortunately, we could not test the MFs during the adaptation paradigms, mainly because the recording stability of MFs was often poor, making it difficult to keep their action potentials well isolated for longer times.
Discussion
What does the diversity of observed response patterns of MFs and GCs imply?
Previous recordings from the OMV and the flocculus during eye movements in monkeys are in accordance with our results about the different patterns of activity recorded from MFs (Kase et al., 1980; Miles et al., 1980; Ohtsuka and Noda, 1992). Similarly, recordings from monkeys in the intermediate cerebellar cortex during forelimb manipulations (van Kan et al., 1993) describe various combinations of tonic and phasic discharges of MFs. In the case of the OMV, the MF afferents have been shown to arise mainly in the pontine nuclei, the nucleus reticularis tegmentis pontis (NRTP), and the paramedian pontine reticular formation (PPRF), suggesting that the cerebellum is provided by both cortical and subcortical information about visually guided eye movements (Thielert and Thier, 1993). Based on their recordings, Ohtsuka and Noda (1992) have, however, concluded that the MFs destined for the OMV are restricted to the PPRF and superior colliculus (via NRTP), because the end of their MF bursting responses always precluded the completion of the saccade. Our own data show a much higher variability of MF burst timings, and such heterogeneity indeed conforms to the fact that the MF input to the cerebellum originates from various movement-related sources in the brainstem.
The cell-to-cell variability of movement-related discharges in GCs was also observed for various eye and head movements (Miles et al., 1980) and forelimb manipulations (van Kan et al., 1993) in the monkey, as well as during cat locomotion (Edgley and Lidierth, 1987). This was vexingly not the case for electrical and somatosensory stimuli of vibrissal pads and limbs in rats (Vos et al., 1999b; Holtzman et al., 2006), in which the evoked GC responses were more stereotypical. This variability observed in GCs could simply reflect excitations, direct or indirect, from the heterogeneous MFs. However, the Golgi group included substantially more pause units, often phasic, which we never observed in MFs. The additional modulation of GCs by inhibitory interneurons seems pertinent in this context. The axonal plexus of individual GCs are known to branch within generally non-overlapping parasagittal planes (Barmack and Yakhnitsa, 2008). Combined with the heterogeneity of their discharge patterns, this suggests, as previously speculated by Edgley and Lidierth (1987), that subpopulations of thousands of GrCs organized in sagittal zones are under different patterns of inhibitory control.
The disparity of directional selectivity between MFs and GCs has functional implications
van Kan et al. (1993) reported that most MFs responded reciprocally to extension and flexion movements and exhibited strong device specificity (showed preference for shoulder, elbow, wrist, or finger manipulation), whereas GCs fired identically for both flexion and extension, and lacked device specificity. Similarly, Edgley and Lidierth (1987) stated that the majority of GCs were responsive to stimuli of both forelimbs of the cat, and the eye saccade-related responses of MFs recorded in the flocculus (Miles et al., 1980) or the OMV (Kase et al., 1980; Ohtsuka and Noda, 1992) generally showed strong directional preference. Finally, electrical and tactile stimuli of the rat face or limbs (Vos et al., 1999b; Holtzman et al., 2006) revealed that responses in GCs could be elicited from widespread areas. All these findings are in accordance with our own results about the disparity of directional selectivity between MF and GC populations (Fig. 5, 6).
The strong directional selectivity of MFs entails that restricted groups of GrCs [400–600 per MF according to Ito (2006)] are excited preferentially for movements in a particular direction. The broad directional tuning of GCs then suggests that these neurons are well suited to individually inhibit large groups [thousands according to Hámori and Szentágothai (1966)] of GrCs regardless of movement direction. In principle, the excitation of a GC by numerous parallel fibers originating from GrCs, each tuned to a particular direction, could account for the broad directional field of that neuron. However, the efficacy of the parallel fiber input to GCs has been demonstrated to be too weak to modulate their firing (Dieudonne, 1998), leading to assertions that the activity of GCs is determined mainly by direct MF excitation. Because MFs fire preferentially for eye saccades in a single direction, the absence of directional preference in GCs would require a substantial convergence of direct MF excitatory inputs onto single neurons. Still, compared with the vast majority of GC dendrites that ascend toward the molecular layer, only few are thought to branch within the granule layer (Pellionisz and Szentágothai, 1973). This observation would alternatively lend credit to the assumption that GCs are modulated by a climbing fiber-dependent signal and other cerebellar interneurons (Barmack and Yakhnitsa, 2008). If the GC modulation were, however, climbing fiber-dependent, it would be expected to show changes during saccadic adaptation, which we found not to be the case.
The nonspecificity of GC activity to saccade metrics is inconsistent with the gain control theory
The population activity of MFs showed distinct linear relationships with saccade metrics (Fig. 8C,D). Therefore, the abundance of information carried by MFs to the cerebellum is movement specific. Ohtsuka and Noda (1992) reported tuning curves to saccade amplitude of MFs similar to ours, and van Kan et al. (1993) further confirmed that several properties of MF firing correlated with joint angle, movement velocity, and duration. Conversely, the GC population did not reflect any features specific to the metrics or timing of eye saccades (Fig. 8A,B). The study by Edgley and Lidierth (1987) is the only other one to our knowledge to examine the specificity of GCs to movement metrics. In line with our own results, they reported that different speeds of locomotion and platform inclination angles resulted in unaltered timing patterns and discharge rates of most GCs. Therefore, the observation that MFs convey movement-specific data to the cerebellum and that GCs are oblivious to this information, suggests that these neurons are not well suited to perform gain control over PC discharge. In contradiction with the gain control theory, our results suggest that larger and/or longer eye saccades will result in a higher/longer excitation of GrCs by MFs, but the same GrCs will not receive a proportionately larger inhibition from GCs that would be needed to limit the amount of MF transmission to PCs.
Comparison with saccade-related properties of Purkinje cells
The population response of PCs has been shown to be characterized by an intriguingly precise reflection of saccade timing (Thier et al., 2000), while our present results show that GCs fail to provide any alike information. It is clear that any influence GCs might have on PCs via their inhibition of GrCs cannot be responsible for this feature of the PC population. Our other finding is that MFs, the input to the cerebellar cortex, encode an abundance of movement-specific information, which contrasts the much more restricted information found on the output side at the level of PCs. Unlike PCs, the MF population response does not end simultaneously with saccade end but lasts much beyond (Fig. 8D), and furthermore, bursting MFs fire on average more for larger saccades (Fig. 8C), which is not characteristic of PCs (Thier et al., 2000). A confinement of the input information seems thus to be necessary on its pathway toward the PC layer, in which the inhibitory GCs, although anatomically in an ideal position, are hardly involved. More generally, if one assumes that the firing properties of a major interneuron are indicative of the saccade-related properties of the granular layer at large, than the saccade-related timing of the PC population is not a mere reflection of a previous processing in the granular layer of the movement-specific MF input. Alternatively, climbing fibers and molecular layer interneurons may be more important in modulating this unique activity of PCs, which might also be an emerging property of the circuitry rather than reflective of input.
Another distinctive feature of GCs is that they fail to exhibit the kind of plasticity observed in PC simple spikes (Catz et al., 2008) during saccadic adaptation. Our results do not suggest any strong correlation between changes in GC firing and changes in the adapting amplitude of saccades (Fig. 9, 10). Therefore, the PC simple spike activity modulation of saccade dynamics during adaptation [see the study by Catz et al. (2008) for details] seems not to be caused by a previous processing of the MF input in the granular layer, but is instead a consequence of adjusting the complex spike activity (Catz et al., 2005). Our results thus show that behaviorally relevant cerebellar plasticity emerges only at the level of PCs, where the climbing fiber input seems to play the major role.
Footnotes
This work was supported by Deutsche Forschungsgemeinschaft Sonderforschungsbereich 550 A7.
References
- Albus JS. A theory of cerebellar function. Math Biosci. 1971;10:25–61. [Google Scholar]
- Barmack NH, Yakhnitsa V. Functions of interneurons in mouse cerebellum. J Neurosci. 2008;28:1140–1152. doi: 10.1523/JNEUROSCI.3942-07.2008. [DOI] [PMC free article] [PubMed] [Google Scholar]
- Catz N, Dicke PW, Thier P. Cerebellar complex spike firing is suitable to induce as well as to stabilize motor learning. Curr Biol. 2005;15:2179–2189. doi: 10.1016/j.cub.2005.11.037. [DOI] [PubMed] [Google Scholar]
- Catz N, Dicke PW, Thier P. Cerebellar-dependent motor learning is based on pruning a purkinje cell population response. Proc Natl Acad Sci U S A. 2008;105:7309–7314. doi: 10.1073/pnas.0706032105. [DOI] [PMC free article] [PubMed] [Google Scholar]
- De Schutter E, Vos B, Maex R. The function of cerebellar Golgi cells revisited. Prog Brain Res. 2000;124:81–93. doi: 10.1016/s0079-6123(00)24009-0. [DOI] [PubMed] [Google Scholar]
- Dieudonne S. Submillisecond kinetics and low efficacy of parallel fibre-Golgi cell synaptic currents in the rat cerebellum. J Physiol. 1998;510:845–866. doi: 10.1111/j.1469-7793.1998.845bj.x. [DOI] [PMC free article] [PubMed] [Google Scholar]
- Dieudonné S, Dumoulin A. Serotonin-driven long-range inhibitory connections in the cerebellar cortex. J Neurosci. 2000;20:1837–1848. doi: 10.1523/JNEUROSCI.20-05-01837.2000. [DOI] [PMC free article] [PubMed] [Google Scholar]
- Eccles JC, Ito M, Szentagothai J. The cerebellum as a neuronal machine. Berlin: Springer; 1967. [Google Scholar]
- Edgley SA, Lidierth M. The discharges of cerebellar Golgi cells during locomotion in the cat. J Physiol. 1987;392:315–332. doi: 10.1113/jphysiol.1987.sp016782. [DOI] [PMC free article] [PubMed] [Google Scholar]
- Geurts FJ, De Schutter E, Dieudonné S. Unraveling the cerebellar cortex: cytology and cellular physiology of large-sized interneurons in the granular layer. Cerebellum. 2003;2:290–299. doi: 10.1080/14734220310011948. [DOI] [PubMed] [Google Scholar]
- Hámori J, Szentágothai J. Participation of Golgi neuron processes in the cerebellar glomeruli: an electron microscope study. Exp Brain Res. 1966;2:35–48. doi: 10.1007/BF00234359. [DOI] [PubMed] [Google Scholar]
- Hanes DP, Thompson KG, Schall JD. Relationship of presaccadic activity in frontal eye field and supplementary eye field to saccade initiation in macaque: poisson spike train analysis. Exp Brain Res. 1995;103:85–96. doi: 10.1007/BF00241967. [DOI] [PubMed] [Google Scholar]
- Holtzman T, Rajapaksa T, Mostofi A, Edgley SA. Different responses of rat cerebellar purkinje cells and Golgi cells evoked by widespread convergent sensory inputs. J Physiol. 2006;574:491–507. doi: 10.1113/jphysiol.2006.108282. [DOI] [PMC free article] [PubMed] [Google Scholar]
- Ito M. The cerebellum and neural control. New York: Raven; 1984. [Google Scholar]
- Ito M. Cerebellar circuitry as a neuronal machine. Prog Neurobiol. 2006;78:272–303. doi: 10.1016/j.pneurobio.2006.02.006. [DOI] [PubMed] [Google Scholar]
- Judge SJ, Richmond BJ, Chu FC. Implantation of magnetic search coils for measurement of eye position: an improved method. Vision Res. 1980;20:535–538. doi: 10.1016/0042-6989(80)90128-5. [DOI] [PubMed] [Google Scholar]
- Kase M, Miller DC, Noda H. Discharges of purkinje cells and mossy fibres in the cerebellar vermis of the monkey during saccadic eye movements and fixation. J Physiol. 1980;300:539–555. doi: 10.1113/jphysiol.1980.sp013178. [DOI] [PMC free article] [PubMed] [Google Scholar]
- Maex R, De Schutter E. Synchronization of Golgi and granule cell firing in a detailed network model of the cerebellar granule cell layer. J Neurophysiol. 1998;80:2521–2537. doi: 10.1152/jn.1998.80.5.2521. [DOI] [PubMed] [Google Scholar]
- Marr D. A theory of cerebellar cortex. J Physiol. 1969;202:437–470. doi: 10.1113/jphysiol.1969.sp008820. [DOI] [PMC free article] [PubMed] [Google Scholar]
- McLaughlin SC. Parametric adjustment in saccadic eye movements. Percept Psychophys. 1967;2:359–362. [Google Scholar]
- Miles FA, Fuller JH, Braitman DJ, Dow BM. Long-term adaptive changes in primate vestibuloocular reflex. III. Electrophysiological observations in flocculus of normal monkeys. J Neurophysiol. 1980;43:1437–1476. doi: 10.1152/jn.1980.43.5.1437. [DOI] [PubMed] [Google Scholar]
- Mitchell SJ, Silver RA. Gaba spillover from single inhibitory axons suppresses low-frequency excitatory transmission at the cerebellar glomerulus. J Neurosci. 2000;20:8651–8658. doi: 10.1523/JNEUROSCI.20-23-08651.2000. [DOI] [PMC free article] [PubMed] [Google Scholar]
- Ohtsuka K, Noda H. Burst discharges of mossy fibers in the oculomotor vermis of macaque monkeys during saccadic eye movements. Neurosci Res. 1992;15:102–114. doi: 10.1016/0168-0102(92)90023-6. [DOI] [PubMed] [Google Scholar]
- Palay SL, Chan-Palay V. Cerebellar cortex: cytology and organization. New York: Springer; 1974. [Google Scholar]
- Pellionisz A, Szentágothai J. Dynamic single unit simulation of a realistic cerebellar network model. Brain Res. 1973;49:83–99. doi: 10.1016/0006-8993(73)90403-4. [DOI] [PubMed] [Google Scholar]
- Simat M, Parpan F, Fritschy JM. Heterogeneity of glycinergic and gabaergic interneurons in the granule cell layer of mouse cerebellum. J Comp Neurol. 2007;500:71–83. doi: 10.1002/cne.21142. [DOI] [PubMed] [Google Scholar]
- Simpson JI, Hulscher HC, Sabel-Goedknegt E, Ruigrok TJH. Between in and out: linking morphology and physiology of cerebellar cortical interneurons. Prog Brain Res. 2005;148:329–340. doi: 10.1016/S0079-6123(04)48026-1. [DOI] [PubMed] [Google Scholar]
- Thach WT. Discharge of purkinje and cerebellar nuclear neurons during rapidly alternating arm movements in the monkey. J Neurophysiol. 1968;31:785–797. doi: 10.1152/jn.1968.31.5.785. [DOI] [PubMed] [Google Scholar]
- Thielert CD, Thier P. Patterns of projections from the pontine nuclei and the nucleus reticularis tegmenti pontis to the posterior vermis in the rhesus monkey: a study using retrograde tracers. J Comp Neurol. 1993;337:113–126. doi: 10.1002/cne.903370108. [DOI] [PubMed] [Google Scholar]
- Thier P, Dicke PW, Haas R, Barash S. Encoding of movement time by populations of cerebellar purkinje cells. Nature. 2000;405:72–76. doi: 10.1038/35011062. [DOI] [PubMed] [Google Scholar]
- van Kan PL, Gibson AR, Houk JC. Movement-related inputs to intermediate cerebellum of the monkey. J Neurophysiol. 1993;69:74–94. doi: 10.1152/jn.1993.69.1.74. [DOI] [PubMed] [Google Scholar]
- Vos BP, Maex R, Volny-Luraghi A, De Schutter E. Parallel fibers synchronize spontaneous activity in cerebellar Golgi cells. J Neurosci. 1999a;19:RC6. doi: 10.1523/JNEUROSCI.19-11-j0003.1999. [DOI] [PMC free article] [PubMed] [Google Scholar]
- Vos BP, Volny-Luraghi A, De Schutter E. Cerebellar Golgi cells in the rat: receptive fields and timing of responses to facial stimulation. Eur J Neurosci. 1999b;11:2621–2634. doi: 10.1046/j.1460-9568.1999.00678.x. [DOI] [PubMed] [Google Scholar]


