

Abstract
In human patients, cortical dysplasia produced by Doublecortin (DCX) mutations lead to mental retardation and intractable infantile epilepsies, but the underlying mechanisms are not known. DCX−/− mice have been generated to investigate this issue. However, they display no neocortical abnormality, lessening their impact on the field. In contrast, in utero knockdown of DCX RNA produces a morphologically relevant cortical band heterotopia in rodents. On this preparation we have now compared the neuronal and network properties of ectopic, overlying, and control neurons in an effort to identify how ectopic neurons generate adverse patterns that will impact cortical activity. We combined dynamic calcium imaging and anatomical and electrophysiological techniques and report now that DCX−/−EGFP+-labeled ectopic neurons that fail to migrate develop extensive axonal subcortical projections and retain immature properties, and most of them display a delayed maturation of GABA-mediated signaling. Cortical neurons overlying the heterotopia, in contrast, exhibit a massive increase of ongoing glutamatergic synaptic currents reflecting a strong reactive plasticity. Neurons in both experimental fields are more frequently coactive in coherent synchronized oscillations than control cortical neurons. In addition, both fields displayed network-driven oscillations during evoked epileptiform burst. These results show that migration disorders produce major alterations not only in neurons that fail to migrate but also in their programmed target areas. We suggest that this duality play a major role in cortical dysfunction of DCX brains.
Keywords: cortical dysplasia, heterotopia, doublecortin, in utero RNAi, neuronal excitability, rat neocortex
Introduction
Cortical malformations represent a broad spectrum of developmental disorders resulting from genetic mutations or environmental perturbations that affect cellular proliferation, migration, or differentiation during development (Schwartzkroin and Walsh, 2000; Mochida and Walsh, 2004; Guerrini et al., 2008). They are often associated with patients having severe epilepsies or cognitive defects (Mischel et al., 1995; Porter et al., 2003). Thus, cortical malformations are present in <24% of all epilepsy patients but are found in 40% of cases that are refractory to treatment (Hardiman et al., 1988; Farrell et al., 1992). Anatomical and functional studies in rodents with cortical malformations suggest that ectopic neurons form afferent and efferent connections with adjacent cortex (for review, see Chevassus-Au-Louis and Represa, 1999), indicating that heterotopias are integrated within cortical networks. However, it is still not clear how malformed networks of neurons may contribute to pathophysiological development in an otherwise normal brain.
Mutations of doublecortin (DCX) and LIS-1, two microtubule-stabilizing proteins expressed in immature neurons that are important for migration (Francis et al., 1999; Bai et al., 2003; Tanaka et al., 2004), are among the best characterized genetic disruptions leading to lissencephaly and subcortical band heterotopia in humans (Dobyns et al., 1993; Reiner et al., 1993; des Portes et al., 1998; Gleeson et al., 1998; Pilz et al., 1999). Although functional knock-out models have been generated for these two genetic disorders, progress has been hindered by the fact that these animals displayed embryonic lethality (Hirotsune et al., 1998; Cahana et al., 2001) and little or no dysgenesis in the neocortex (Corbo et al., 2002). Because these models do display discrete hippocampal dysplasias (Hirotsune et al., 1998; Fleck et al., 2000; Nosten-Bertrand et al., 2008), detailed physiological analyses thus far have concerned only the hippocampal pyramidal layer (Fleck et al., 2000; Jones and Baraban, 2007; Nosten-Bertrand et al., 2008).
More relevant models of these disorders have been achieved by using the techniques of gene silencing. Thus, reduction of DCX expression in rats using RNA interference (RNAi) via in utero electroporation results in formation of heterotopias beneath the neocortical layers similar to those seen in human patients (Bai et al., 2003), thus providing a unique opportunity to determine the properties of misplaced neurons and characterize cortical networks in a well designed genetic model of a human developmental disorder. For the first time we investigate here neuronal and networks activities in the DCX RNAi model for subcortical band heterotopia by combining network-level calcium imaging with electrophysiological and anatomical approaches. We found that ectopic (double cortex) neurons display a delayed maturation of functional GABAergic synaptic inputs, whereas cortical L2/3 neurons overlying the heterotopia (experimental cortex) displayed an increased glutamatergic drive. In addition, we show that experimental fields (heterotopia and experimental cortex) were integrated within the same network and exhibited synchronized activity during epileptiform burst. Ectopic neurons also develop extensive subcortical axonal arborizations that might contribute to integrate the heterotopia in cortical–subcortical loops. Together these alterations could have important consequences for cortical function and may be involved in the neurological manifestations linked to this type of disorder, such as infantile and childhood epilepsy.
Materials and Methods
In utero electroporation.
Wistar rats (Janvier) were mated, cared for, and used in our animal facilities in agreement with European Union and French legislation. Timed pregnant rats [embryonic day 15 (E15)–E16] were anesthetized with a mixture ketamine/xylazine (at 100 and 10 mg/kg, respectively). The uterine horns were exposed, and a lateral ventricle of each embryo was injected via pulled glass capillaries and a microinjector (Picospritzer II; General Valve Corporation) with Fast Green (2 mg/ml; Sigma) combined with the following DNA constructs: 1.5 mg/ml pCAGGS-enhanced green fluorescent protein (EGFP) alone or 1.5 mg/ml short hairpin RNA (shRNA) targeting the 3′-untranslated region (UTR) of DCX or a mismatch DCX described previously (Bai et al., 2003) and 0.5 mg/ml pCAG-EGFP construct. This step was followed by in utero electroporation by discharging a 500 F capacitor charged to 70 V with a BTX exponential decay wave electroporator (BTX Harvard Apparatus). The voltage was discharged across copper alloy oval plates placed on the uterine wall across the head of the embryo. All recordings were performed from slices having heterotopia located directly under parietal cortex as defined by the rat atlas of Paxinos and Watson (1997) and were located between +2.1 and −3.7 mm with respect to bregma according to the postnatal rat atlas of Sherwood (mean: −0.23 mm, SD: 1.7 mm). Control slices were chosen to match the rostrocaudal distribution of experimental slices.
Electrophysiology.
Experiments were performed on neocortical slices from Wistar rats (control rats or transfected with either EGFP alone or combined with DCX RNAi or DCX mismatch; ages ranged from postnatal day 9 (P9) to P15. In addition, few recordings have been performed at P30. Rats were decapitated under deep isoflurane anesthesia (20–40 mg/kg). Brains were rapidly removed and placed in oxygenated ice-cooled artificial CSF (ACSF) with the following composition (in mm): 126 NaCl, 3.5 KCl, 2 CaCl2, 1.3 MgCl2, 25 NaHCO3, 1.2 NaHPO4, and 10 d-glucose (95% O2 and 5% CO2, pH 7.4). Coronal neocortical slices (350–400 μm) were obtained with a vibratome and kept in oxygenated ACSF at room temperature at least 1 h before use. Individual slices were then transferred to the recording chamber, where they were fully submerged and superfused with ACSF at ∼36°C at a rate of 2–3 ml/min. EGFP-positive neuron were visualized with a fluorescent upright microscope (Axioscope; Zeiss) equipped with an appropriate filter and recorded using the patch-clamp technique in the whole-cell configuration. Microelectrodes had a resistance of 5–10 MΩ and were filled with a solution containing the following (in mm): 130 KM2SO4, 10 KCl, 0.1 CaCl2, 1.1 EGTA, 10 HEPES, 4 Mg2+ATP, and 0.3 Na+GTP, pH 7.25; 270–280 mOsm. Biocytin (0.5%) was also added to the pipette solution for post hoc reconstruction of the recorded cells (see below). Some experiments have been performed with a Cs gluconate (CsGlu)-based pipette solution (in mm): 130 CsGlu, 10 CsCl, 0.1 CaCl2, 1.1 EGTA, 10 HEPES, 4 Mg2+ATP, and 0.3 Na+GTP. Whole-cell measurements in voltage-clamp or current-clamp mode were filtered at 3 kHz using an EPC-9 amplifier (HEKA). All electrophysiological data were digitized (1–2 kHz) with a Digidata (Molecular Devices) interface card to a personal computer and analyzed with MiniAnalysis (Synaptosoft). Each single event in each recorded cell was fully characterized by the following parameters: rise time (10–90%), amplitude, and decay time constants were calculated using MiniAnalysis 5.1. The baseline noise ranged between 3 and 5 pA, and an amplitude threshold of 3 pA more than the baseline noise was used for event detection. All voltage reported were corrected values for liquid junction potential (LJP) with V m = V pipette − LJP. The LJP for KM2SO4- and CsGlu-based pipette solutions were 3.2 and 18 mV, respectively. In some experiments, isoguvacine (30 μm) was applied by pressure during 1 s with a patch pipette connected to a Picospritzer (General Valve Corporation) and positioned close to the soma. Extracellular recordings were performed with a glass pipette (<1 MΩ) filled with ACSF to record the field, and the signal was recorded with a DAM80 amplifier (WPI). Slices were stimulated by a bipolar twisted nichrome electrode connected to a stimulator (Grass Instruments). The stimulus intensity ranged between 10 and 100 V of amplitude, and the duration was 30 μs.
Ectopic neurons (either in the white matter or deep cortical layers) were selected using epifluorescence microscopy; post hoc analysis demonstrated that all ectopic neurons recorded (biocytin injected) were EGFP positive. Experimental L2/3 (expL2/3) recorded neurons were all EGFP negative.
All values are given as means ± SEM. Statistical analysis was performed using SigmaStat 3.1 (Systat Software). For comparison between two groups, the unpaired Student's t test was used if the data passed the normality and the equal variance test; otherwise, the Mann–Whitney rank-sum test was used. The level of significance was set at p < 0.05. n refers to the number of cells, except when otherwise stated.
Two-photon imaging.
Coronal slices (380 μm) were prepared from postnatal rats as described above. For calcium indicator loading, slices were incubated in a small chamber containing 2 ml of oxygenated ACSF with 25 μl of 1 mm fura-2 AM solution (Invitrogen; in 100% DMSO) for 25 min at 35°C.
Two-photon imaging was performed as described previously (Crépel et al., 2007). Briefly experiments were performed at 32°C in oxygenated ACSF using a multibeam two-photon laser-scanning system (Chameleon Ti:Sapphire laser, Coherent; and TriM scanhead, LaVision BioTec) coupled to an Olympus BX51W1 microscope. Excitation wavelengths were 780 μm for fura-2 imaging and 910 μm for EGFP imaging. Imaging was performed using a 20× 0.95 numerical aperture objective (XLUMPLFL, Olympus) and a CCD camera (LaVision Imager Intense) with an acquisition rate of ∼140 ms/frame and a field of view of 413 × 312 μm. Each recording consisted of a single, continuously acquired movie during a period of 90–180 s.
Antagonists for GABAA receptors (bicuculline, 10 μm; Sigma) or glutamate receptors [2,3-dihydroxy-6-nitro-7-sulfonyl-benzo[f]quinoxaline (NBQX) and APV, both 10 μm; Sigma] were perfused onto slices for 12–15 min before optical recording. After calcium imaging experiments, slices were fixed with 4% paraformaldehyde and imaged using a laser-scanning confocal microscope (Olympus Fluoview).
Image processing was performed using ImageJ 1.37 (NIH) and custom software in MATLAB (The MathWorks) described previously (Crépel et al., 2007). Cell contours were identified using a combination of automatic and visual detection routines. Calcium signals of each cell were the average fluorescence intensity inside each cell soma region of interest, measured as a function of time (dF/F). Calcium events were manually identified, with automatic detection routines confirming events as local minima (typically <−2 SD of the derivative of the signal). Data were analyzed using custom routines written in MATLAB (The MathWorks) and in R (The R Project for Statistical Computing). Event offsets were set as the half-amplitude decay time for each event. Event onset times were quantified as the half-amplitude rise time of each calcium transient. Active cells were neurons exhibiting at least one calcium event during a recording period. The power spectral density (PSD) estimate for each cell's dF/F time series was calculated using Welch's method (“pwelch” function, MATLAB). Spontaneously active neurons displaying rhythmic calcium transients exhibit PSD estimates that are shifted toward higher signal power per frequency (supplemental Fig. 1A, available at www.jneurosci.org as supplemental material). Average power was computed as the approximate integral of the PSD on the intervals [0–Nyquist frequency (∼3.5 Hz)], [0.005–0.1 Hz], or [0.1–1 Hz]. Peak coactive network activity was quantified as the maximum percentage of cells exhibiting a calcium event at one time during a recording period. To quantify temporally correlated calcium events across cells in a network, event onset times were represented by a Gaussian (σ = 1 frame) for each cell. Interval reshuffling was then performed for each movie as described previously (Mao et al., 2001; Cossart et al., 2003). The significance of cross-correlation values for real datasets was determined through comparison with distributions calculated from the randomized datasets using a threshold significance level of p < 0.05. Event frequencies are reported as the mean or median frequency value from active cells across all recordings. Datasets that followed a lognormal distribution were log-transformed before comparison (calcium event onset, duration, and frequency datasets). Distribution means for cell-based or event-based datasets were compared using ANOVA (p < 0.05 set as significance) followed by pairwise t tests with Holm correction. Distributions of movie-based datasets were compared using the nonparametric Kruskal–Wallis and Wilcoxon rank sum tests. Measurements are reported as mean ± SEM, unless otherwise noted.
Histology.
Brains from postnatal rats (P12) were fixed with paraformaldehyde (4% in PBS). Brain sections (50 μm) were obtained with a vibratome (Leica) and permeabilized for 10 min at room temperature (RT) in PBS–Triton X-100 (0.1%)–goat serum (5%). After permeabilization, slices were incubated overnight at RT with rabbit anti-GAD65/67 (1:400, Millipore Bioscience Research Reagents), vGlut1 (1:1000; Synaptic Systems), or NeuN (1:1000, Millipore Bioscience Research Reagents) combined with mouse anti-GFP antibodies (1:2000; Invitrogen). The slices were rinsed three times in PBS and incubated for 2 h at RT in Cy3-conjugated goat anti-rabbit antibodies and then Alexa-488-conjugated goat anti-mouse antibodies (both diluted 1:200; Jackson ImmunoResearch). Experiments were repeated three times with sections from four different brains per developmental stage.
Revelation of biocytin-injected neurons was obtained with Cy3-conjugated streptavidin (1:500; Millipore Bioscience Research Reagents) combined with anti-GFP antibodies (see before) for staining of transfected cells.
Sections were examined under a Zeiss LSM510 confocal microscope using 10×, 20×, and 65× objectives; images were digitized using the built-in software and exported in tiff format for quantitative analysis with the analysis software ImageJ 1.33d (Wayne Rasband, NIH). Optical fluorescence density was measured in the hippocampus, neocortex, and corpus callosum as described previously (Epsztein et al., 2006).
Results
Morphological features of heterotopic neurons in DCX RNAi-injected rats
We used in utero electroporation to deliver RNAi constructs into neural progenitors at the ventricular zone surface allowing for spatiotemporally restricted transfection in a population of neuronal precursors. Expression of an RNAi construct targeting the 3′-UTR of DCX (Bai et al., 2003) in a cohort of immature neurons results in arrested migration through the intermediate zone and the formation of ectopic clusters of neurons in the white matter. Because the electroporations were performed at E15 (Fig. 1 A), a cohort of cells destined to be primarily layer 2/3 (L2/3) pyramids (Fig. 1 C,F) were affected. Transfected cells (EGFP+) that received DCX RNAi formed heterotopic (het) masses in the white matter or remained within deeper cortical layers, in contrast to the L2/3 pyramidal fate of control neurons transfected with either EGFP (Fig. 1; supplemental Fig. 2H, available at www.jneurosci.org as supplemental material) or mismatch constructs (data not shown). The ectopic EGFP-positive cells expressed the neuronal marker NeuN (Fig. 1 B) but not GABAergic (GAD65/67) or glial (GFAP) cell markers (also see Ramos et al., 2006). Ectopic neurons exhibited multipolar or bipolar tangential morphologies (Fig. 1 B,G; supplemental Fig. 2B–E, available at www.jneurosci.org as supplemental material). Ectopic neurons originate axonal arbors that reached the corpus callosum and can be followed for long distances, this including the contralateral hemisphere; collateral branches reached upper cortical layers. In addition many axonal branches were observed to invade the striatum (caudate–putamen) (supplemental Fig. 2C, available at www.jneurosci.org as supplemental material).
Figure 1.

Heterotopia formation by DCX RNAi. A, RNAi of DCX protein expression by in utero electroporation of a plasmid encoding a DCXshRNA. Electroporation of the ventricular zone with EGFP + DCXshRNA plasmids (EGFP + DCX RNAi) at E16 inhibits neuronal migration and results in formation of a band of EGFP+ ectopic neurons in the white matter, whereas electroporation of EGFP plasmid alone results in EGFP+ layer 2/3 pyramidal neurons. B, NeuN labeling within an EGFP+ heterotopia. Notice the presence of colabeling of EGFP+ ectopic neurons with NeuN in a single confocal z-section. Also notice the presence of NeuN-positive EGFP-negative (untransfected) neurons, which are likely retained within the heterotopia by a cell-population effect as described previously (Ramos et al., 2006). Scale bar, 50 μm. C, D, F, G, Confocal images of rat cerebral cortex after either control (EGFP only) electroporation (C, F) or EGFP + DCXshRNA electroporation (D, G). A subcortical band heterotopia has formed in the corpus callosum (c.c.). In contrast to the radial orientation and pyramidal morphology of EGFP+ neurons in layer 2/3, ectopic neurons in the white matter are tangentially oriented with elongated bipolar or multipolar morphologies. Scale bars: C, D, 100 μm; F, G, 50 μm. E, The staining of biocytin-filled ectopic neurons (red) from whole-cell recordings reveals the colabeling of EGFP (green) for both of the patched cells. Scale bar, 25 μm. H, I, Pattern of discharge of two different EGFP+ ectopic neurons representative of 72% (H) and 28% (I) of ectopic recorded neurons recorded with a KM2SO4-based pipette solution. The discharge was evoked either by depolarizing steps (left) or by progressive injection of currents (right).
Electrophysiological recording of ectopic cells were performed to further assess their neuronal features and evaluate their main intrinsic properties. Patch clamp recordings of these cells revealed that they have a mean resting membrane potential of −58 ± 1.3 mV (range between −50 mV and −73 mV; measured in whole cell with a KM2SO4-based pipette solution) and a mean input resistance of 635 ± 65 mΩ and generate action potentials when they were depolarized either by depolarizing steps or by progressive injection of currents (Fig. 1 H,I) with a threshold of −40 ± 0.9 mV. This confirmed their neuronal phenotype. Interestingly, most of the ectopic cells (68%, 17 of 25 cells) (Fig. 1 H) generated only few spikes (1–4) when they were sufficiently depolarized (transient firing pattern), whereas the others (32%, 8 of 25 cells) (Fig. 1 I) had regular spiking activity at a rate ranging between 5 and 26 Hz. As shown in Table 1, the spike properties [threshold, amplitude, overshoot, half-width, and fast afterhyperpolarization (AHP) amplitude] are significantly different between these two groups of cells. More specifically, the low-firing-pattern group generates spikes at a more depolarized membrane potential than the sustained-firing-pattern group. In addition, the amplitude of the spikes and of the fast AHP are smaller, the half-width is larger, and there is only a small spike overshoot in the low-firing-pattern group, showing that the spikes are less mature in this group. In contrast to the spike properties, the resting membrane potentials, input resistance, cell capacitance, and synaptic properties were not significantly different between the two groups of cells. Together these results indicate that heterotopias are composed of a heterogenous population of neurons at least in term of their firing properties. Post hoc reconstruction of recorded neurons injected with biocytin revealed that the majority of transfected ectopic neurons displayed a bipolar or multipolar shape with the majority of their dendrites acquiring a tangential orientation (Figs. 1 E, 2). Axonal branches left the heterotopia and traveled along the corpus callosum (Fig. 2; supplemental Movie S1, available at www.jneurosci.org as supplemental material). All recorded neurons displayed axon collaterals that reached upper L4–5 (Fig. 2). In addition, we were able to detect in 18% (4 of 22 cells) of reconstructed neurons the presence of axonal collaterals coursing through the external capsule and into the striatum (Fig. 2 B; supplemental Fig. 2C, available at www.jneurosci.org as supplemental material). Biocytin filling of ectopic neurons also resulted in a 53% increase in numbers of extra neurons labeled in the white matter or within L6 (1.5 extra neurons per slice; n = 11 slices). Labeling of clusters of neurons after single fills has been reported previously for neocortical neurons at this age and has been attributed to biocytin diffusion through gap junctions (Peinado et al., 1993), which provide a mechanism for electrotonic coupling and transmission of immature intrinsic activities within networks. In addition, we found extra callosally projecting axons labeled in our slices that were assessed via confocal optical sectioning to have not stemmed from biocytin-labeled somas (Fig. 2 B; supplemental Movie S1, available at www.jneurosci.org as supplemental material). The presence of multiple points of juxtaposition with axons stemming from patched neurons suggests that these extra axons could have been labeled via axon–axon gap junctions as has been found between axons in the normal hippocampus (Hamzei-Sichani et al., 2007).
Table 1.
Physiological properties of GFP+ ectopic neurons
| V m (mV) | C m (pF) | R m (mΩ) | Spike properties |
Synaptic properties |
||||||
|---|---|---|---|---|---|---|---|---|---|---|
| Threshold (mV) | Amplitude (mV) | Overshoot (mV) | Half-width (ms) | Fast AHP (mV) | Glu (Hz) | GABA (Hz) | ||||
| Sustained firing pattern (n = 8) | −58 ± 2.7 | 32 ± 7.4 | 776 ± 88 | −35 ± 2.4 | 61 ± 5.6 | 30.2 ± 4.5 | 1.2 ± 0.08 | 17.5 ± 2.4 | 0.1 ± 0.03 | 0.02 ± 0.02 |
| Transient firing pattern (n = 17) | −54 ± 3 | 37 ± 4.8 | 513 ± 81 | −29 ± 1.2* | 33 ± 2.6* | 6.2 ± 2.3* | 1.8 ± 0.16* | 11.3 ± 1.2* | 0.2 ± 0.05 | 0.04 ± 0.03 |
Glu, Glutamate.
Figure 2.

Axonal arborizations of ectopic cortical neurons. A, Reconstructions of biocytin-filled ectopic neurons. EGFP+ ectopic neurons were targeted for whole-cell recordings with biocytin-containing patch pipettes. Axonal arbors emanating from different neurons are colored (orange, blue, and magenta). Notice axons from ectopic neurons coursing callosally and ventrally within the white matter. Scale bar, 200 μm. B, Additional examples of ectopic neurons. Axonal arbors from the two patched neurons in this slice are colored (blue and magenta). Notice axonal collaterals coursing within the white matter, cortex, and striatum/internal capsule. Also notice two biocytin-filled axons in the callosum (black, arrows 3, 4) that did not emanate from the patched neurons (also see supplemental Movie S1, available at www.jneurosci.org as supplemental material). C, Enlargement of drawings shown in B; inset displays the corresponding confocal picture. Arrows depict patched neurons double stained with EGFP and Cy3; arrowheads point to nonpatched but biocytin-positive neurons: they are transfected or nontransfected cells, the latter likely retained within the heterotopia by a cell-population effect as described previously (Ramos et al., 2006). Scale bars: 200 μm; (inset) 50 μm. c.c., Corpus callosum; e.c., external capsule; i.c., internal capsule; str, striatum.
In experimental L2/3 overlying the heterotopia, biocytin-filled neurons had a normal pyramidal morphology with apical radially oriented dendrites (supplemental Fig. 2, available at www.jneurosci.org as supplemental material). Their axon emerged from the basal part of the cell body or basal dendrites and reached the corpus callosum at the level of the heterotopia. In 8 of 12 reconstructed neurons, axonal collateral branches were observed to distribute within the heterotopia. None of reconstructed neurons from experimental L2/3 neurons displayed axons reaching the striatum. Extra neurons were also labeled within L2/3 in 4 of 9 experimental slices (supplemental Fig. 2F,G, available at www.jneurosci.org as supplemental material).
In control L2/3 [contL2/3; EGFP (n = 3 animals)]- or mismatch (n = 2 animals)-transfected animals, EGFP-positive neurons localized mainly on L2/3 as expected (Fig. 1 C,F; supplemental Fig. 2H, available at www.jneurosci.org as supplemental material). All transfected or nontransfected neurons, as well as biocytin-filled cells, displayed typical pyramidal cell morphology.
Distribution of glutamatergic and GABAergic terminals in DCX RNAi neocortex
To evaluate the presence and distribution of glutamatergic and GABAergic terminals, we labeled cortical sections from control and DCX RNAi-injected rats with antibodies against vGlut1 and GAD 65/67, respectively. Both control (Fig. 3 A,C) and DCX RNAi L2/3 (Fig. 3 B,D) displayed typical GAD- and vGlut1-stained puncta, which were virtually absent from the corpus callosum (Fig. 3 E,G). The heterotopias themselves also displayed positive staining for both antibodies (Fig. 3 F,H); puncta staining was observed surrounding EGFP ectopic neurons (Fig. 3 I–N). Semiquantitative analysis of stained sections did not reveal major differences on the density of puncta in experimental compared with control L2/3 (Fig. 3 O,P): the heterotopia contained a similar density of GAD-positive puncta but a significantly lower density of vGlut1-immunoreactive terminals than control L2/3. Therefore, neurons in the heterotopia were in close contact with glutamatergic and GABAergic terminals and can be integrated within cortical networks.
Figure 3.

Distribution of GABAergic and glutamatergic terminals in DCX animals. A–N, Immunostaining with GAD65/67 (left panels) and vGlut1 (right panels) antibodies of cortical sections. Pictures were taken from representative control L2/3 (A, C), experimental L2/3 (B, D), control corpus callosum (E, G), and white matter heterotopia (F, H–N). Color pictures (I–N) illustrate the presence of GABA (I–K) and glutamate (L–N) terminals (in red) around cell bodies and dendrites (in green) of ectopic neurons. Insets in I and L are enlarged in J–K and M–N, respectively; the contours of somatodendritic elements of green cells were delineated in J and K for a better appreciation of the distribution of immunopositive elements. O, Bar graphs depict GAD immunoreactivity levels on the different fields. P, Bar graphs depict vGlut1 immunoreactivity levels on the different fields. Notice that vGlut1 immunoreactivity in heterotopia is significantly lower than in control L2/3 and DCX L2/3 (mean values of 4–6 animals ± SEM; *p = 0.005, t test). Scale bars, 10 μm.
Increased spontaneous activity in experimental L2/3 networks
Calcium imaging of neuronal networks enables quantitative estimates of the activity of a large number of neurons within a cortical field and assessment of specific activity patterns in neuronal assemblies (Crépel et al., 2007). This approach allows the investigation of neuronal firing dependent on sodium action potentials (sensitive to TTX; see below) (Crépel et al., 2007; Goldin et al., 2007). We applied this approach to animals displaying band heterotopia after DCX RNAi (Fig. 4; supplemental Movie S2, available at www.jneurosci.org as supplemental material). Neurons recorded from heterotopic (2272 cells, 28 movies, 16 slices), experimental L2/3 (4070 cells, 20 movies, 14 slices), and control L2/3 (4847 cells, 26 movies, 17 slices) fields were spontaneously active (Table 2; supplemental Movie S1, available at www.jneurosci.org as supplemental material). Recorded calcium transients had the following mean half-rise times: heterotopia, 0.62 ± 0.03 s, n = 1464 events; expL2/3, 0.40 ± 0.02 s, n = 4862 events; contL2/3, 0.56 ± 0.02 s, n = 2060 events. Interestingly, we observed that heterotopic and experimental L2/3 networks exhibited significantly higher percentages of active cells than control L2/3 (mean percentage active were as follows: het, 19.3 ± 2.8%; expL2/3, 16.2 ± 3.2%; contL2/3, 9.7 ± 1.5%; p = 0.0389, Kruskal–Wallis test) (Table 2, Fig. 4 D).
Figure 4.
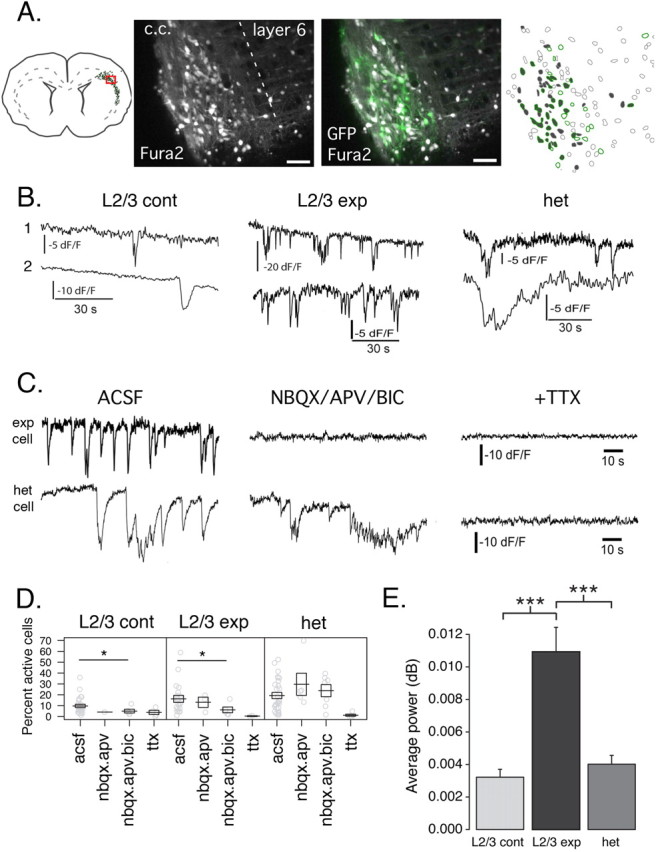
Spontaneous activity in heterotopic networks during postnatal development. A, Identification and calcium indicator loading of the heterotopic network. An EGFP+ heterotopia was identified in a coronal slice from a P3 rat and loaded with the calcium indicator fura-2 AM. Shown are single z-sections of the EGFP and fura-2 signals under two-photon excitation (middle). Contour outlines of the fura-2-loaded somas are shown in the right panel. Filled contours (gray) indicate neurons displaying spontaneous calcium transients during a 100 s optical recording. EGFP+ neurons are indicated with green outlines. Scale bars, 50 μm. c.c., Corpus callosum. B, Examples of calcium fluorescence traces from neurons in the control L2/3, experimental cortex L2/3, and heterotopia. Top and bottom traces are examples of two different cells from recordings in each network. C, Synaptic (top)- and nonsynaptic (bottom)-mediated activity in L2/3 experimental and heterotopic networks, respectively. The example recordings of L2/3 experimental and ectopic neurons are from the same slice of a P10 animal. Traces represent the same cells monitored before and after drug application. Longer-duration nonsynaptic-type calcium events persist in the presence of glutamatergic and GABAergic antagonists (NBQX/APV/BIC) but are sensitive to TTX (top traces) in the heterotopia in contrast to shorter-duration synaptically driven transients (bottom traces) recorded in experimental L2/3. D, Strip plots of the percentage of active cells in control L2/3, experimental L2/3, and heterotopic networks in control conditions (ACSF) or in the presence of glutamate receptor antagonists NBQX and APV or glutamate receptor antagonists plus GABAA receptor antagonist bicuculline (nbqx.apv.bic) or TTX. Gray circles represent the percentage of active cells per slice. Means and ±1 SEM are represented by black boxes. *p < 0.05, Wilcoxon rank sum. E, Bar plot summarizing the average signal power (integrated spectral power) for all active cells on the interval [0, 3.5 Hz]. ***p < 0.0001, pairwise t test. contL2/3, n = 222 cells; expL2/3, n = 521; het, n = 441.
Table 2.
Network activities of control L2/3, experimental L2/3, and heterotopia measured by population calcium imaging
| Control L2/3 |
Experimental L2/3 |
Heterotopia |
||||
|---|---|---|---|---|---|---|
| ACSF | NBQX, APV, Bicu | ACSF | NBQX, APV, Bicu | ACSF | NBQX, APV, Bicu | |
| Active cells (%) | 9.7 ± 1.5 (26) | 5.0 ± 1.8** (5) | 16.2 ± 3.2* (20) | 6.1 ± 2.6** (5) | 19.3 ± 2.8* (28) | 23.8 ± 5.6 (7) |
| Events/min (#) | 1.84 ± 0.16 (222) | 0.35 ± 0.07** (175) | 3.57 ± 0.24* (521) | 0.39 ± 0.12** (136) | 1.41 ± 0.15* (441) | 0.76 ± 0.16** (112) |
| Population coactivity (%) | 5.3 ± 1.4 (26) | 2.5 ± 1.1 (5) | 8.8 ± 2.7 (20) | 2.4 ± 0.8** (5) | 12.5 ± 2.3* (28) | 13.0 ± 3.9 (7) |
| Correlated cells (%) | 7.3 ± 1.6 (26) | 3.1 ± 1.7 (5) | 13.9 ± 3.3* (20) | 1.9 ± 1.1** (5) | 14.7 ± 2.8* (28) | 18.5 ± 4.9 (7) |
| Pairs correlated (%) | 0.74 ± 0.39 (26) | 0.08 ± 0.07 (5) | 2.60 ± 2.00* (20) | 0.02 ± 0.01** (5) | 3.31 ± 1.38* (28) | 2.23 ± 1.29 (7) |
n values are given in parentheses. Bicu, Bicuculline.
*Statistically significantly different from control L2/3
**compared with ACSF.
We next used spectral analysis to determine power of oscillatory signals in our raw time series data from active cells. We found increased total average power at detectable signal frequencies (0–3.5 Hz) in experimental L2/3 with respect to the heterotopic or control L2/3 networks (het, 0.0040 ± 0.0005 dB, n = 441 cells; exp L2/3, 0.0109 ± 0.0015 dB, n = 521 cells; contL2/3, 0.0032 ± 0.0005 dB, n = 222 cells; p < 0.0001, ANOVA) (Fig. 4 E; supplemental Fig. 1B–D, available at www.jneurosci.org as supplemental material). Manual detection of individual calcium transients in active cells confirmed that experimental L2/3 neurons exhibited higher spontaneous event frequencies than control L2/3 networks (expL2/3, 0.06 ± 0.004 Hz, n = 521 cells; contL2/3, 0.030 ± 0.003 Hz, n = 222 cells; p < 0.0001) (Table 2). In addition, the frequency of spontaneous events exhibited by active heterotopic neurons was lower than that exhibited by control neurons (het, 0.02 ± 0.002 Hz, n = 441 cells; p < 0.0001).
Next we looked at the contribution of glutamatergic and GABAergic receptor-mediated activities to the spontaneous activity (percentage of active cells and average event frequency of individual active cells). We found that experimental L2/3 and control L2/3 networks exhibited reduced spontaneous activity in the presence of the ionotropic glutamate receptor antagonists (NBQX and APV) and the GABAA receptor antagonist bicuculline (Table 2, Fig. 4 D). Thus, in experimental L2/3, combined application of glutamatergic and GABAergic antagonists reduced the number of active neurons by 62% (p = 0.0212, Wilcoxon rank sum test) and the frequency of recorded events by 89% (p < 0.0001, pairwise t test); these drugs reduced in control L2/3 the number of active neurons by 48% (p = 0.0360) and the number of recorded events by 81% (p < 0.0001). In contrast, receptor antagonists failed to reduce the number of active heterotopic neurons (p = 0.7969, Wilcoxon rank sum) that maintained a positive median event frequency under glutamatergic and GABAergic antagonists (0.0054 Hz), whereas in experimental and control L2/3, the median frequency under antagonists was zero (supplemental Fig. 3, available at www.jneurosci.org as supplemental material). The presence of TTX greatly diminished spontaneous event frequencies in cells from all networks: 87.58% reduction in control L2/3 (p < 0.0001, pairwise t test), 99.26% reduction in experimental L2/3 (p < 0.0001), and 95.89% reduction in heterotopic neurons (p < 0.0001) (Fig. 4 C,D).
Together these observations support the notion that ectopic neurons display relatively low levels of spontaneous synaptic receptor-mediated activity with a predominance of intrinsic voltage-gated TTX-sensitive currents. This pattern is reminiscent of that observed in immature neurons (Crépel et al., 2007). These results support a less mature, nonsynaptic network activity for heterotopic networks at ages when adjacent neocortical layers are displaying more mature, synaptically driven activity. Conversely, these data reveal that experimental L2/3 neurons overlying the heterotopia display increased frequencies of synaptically mediated activities compared with control L2/3 cells.
Correlated calcium events are increased within the heterotopic and experimental L2/3 networks
We next looked at the dynamics of population activity in heterotopic and experimental L2/3 networks in the second postnatal week. The analysis of the percentage of coactive cells (the highest percentage of cells active at a time in a movie) (Table 2, Fig. 5 A) indicates that heterotopic and experimental L2/3 networks present a twofold increase in population coactivity with respect to control L2/3 networks (p = 0.01003, Kruskal–Wallis). Next we randomized the event onset timings for each recording to find significantly correlated population events. Experimental L2/3 and heterotopic networks exhibited significantly higher percentages of cells involved in correlations than control (expL2/3, 13.9 ± 3.3%; het, 14.7 ± 2.8%; contL2/3, 7.3 ± 1.6%; p = 0.0305 and p = 0.0479, Wilcoxon rank sum) (Table 2). Representing significant correlations as a percentage of all possible pair combinations in each network affirmed an increased population coherence in experimental cortex and heterotopia with respect to control L2/3 (expL2/3, 2.60 ± 2.00%; het, 3.31 ± 1.38%; contL2/3, 0.74 ± 0.39%; p = 0.0409 and p = 0.0235, Wilcoxon rank sum) (Table 2).
Figure 5.

Correlated population events within the heterotopic and experimental L2/3 networks. A, Event duration histogram (top) and raster plot (bottom) from optical recordings of control L2/3 (left), experimental L2/3 (middle), and heterotopia from the same experimental slice (right). Histograms depict the percentage of imaged cells that are detected as being active at each movie frame, and raster plots indicate for each recorded neuron the times at which it displays calcium transients and their durations (horizontal lines). Experimental L2/3 and heterotopic networks have a significant increase in cells participating in correlated spontaneous calcium events with respect to the control L2/3 network. B, Population coherence in heterotopic and experimental L2/3 networks. Each circle represents the percentage of correlated cells within and during an optical recording. Means and ±1 SEM are represented by black boxes. Although the application of receptor antagonists significantly reduced the neuronal correlation in experimental L2/3, it failed to induce any significant change in the heterotopia. **p < 0.0078, Wilcoxon rank sum.
These results indicate that experimental L2/3 networks overlying heterotopia exhibit increased amounts of spontaneous and correlated network activities with respect to control L2/3. Individual ectopic neurons displayed decreased spontaneous event frequencies compared with control L2/3 (Table 2; supplemental Fig. 3, available at www.jneurosci.org as supplemental material), but a greater percentage of cells within the heterotopic network are apt to exhibit spontaneous correlated events in a given period of time (Table 2, Fig. 5).
Glutamate and GABA receptor antagonists significantly reduced (Table 2, Fig. 5 B) coherent network activities in experimental L2/3; they decreased the peak percentage of coactive network activity by 73% and the percentage of correlated cells by 86% (p = 0.0094, Wilcoxon rank sum). In contrast, the presence of glutamate and GABA receptor antagonists did not significantly reduce correlated events in the heterotopia (p = 0.7912, Wilcoxon rank sum).
Together these results suggest that in DCX cortex, experimental L2/3 displays a higher number of active neurons, higher frequencies of synaptic events, and higher incidence of synaptic synchronization than control L2/3. In contrast, ectopic neurons display decreased levels of synaptic activity, although they display increased amounts of correlated, nonsynaptic network activities.
Enhanced glutamatergic synaptic drive in experimental L2/3 neurons and delayed functional GABAergic signaling in ectopic cells
To gain more insights at the cellular level into the synaptic properties of dysplastic cortex, we performed patch-clamp recordings of spontaneous GABAergic IPSCs (sIPSCs) and glutamatergic EPSCs (sEPSCs) in the three neuronal populations: ectopic, experimental L2/3, and control L2/3 neurons (untransfected or DCX mismatch RNAi- and EGFP-transfected neurons). Glutamate-mediated postsynaptic currents were measured either at approximately −70 mV (E Cl −; only glutamatergic PSCs can be recorded) or at −40 mV (GABA PSCs are outward, whereas glutamate events are inward) (Fig. 6). These events were respectively abolished by bicuculline (20 μm) and NBQX/d-APV (10/40 μm) (data not shown).
Figure 6.

Spontaneous synaptic activity in heterotopia is dominated by glutamate. A, Example traces of ongoing spontaneous activity recorded at −70 mV (ECl−) and −40 mV in a pyramidal cell of control L2/3 (left traces), experimental L2/3 (middle traces), and white matter heterotopia (right traces). Note the large increase of glutamate PSCs in the pyramidal cell from experimental L2/3 compared with control. Note in the ectopic cell the low level of activity and the absence of GABA PSCs. B, Mean GABA (Ba) and glutamate (Glu; Bb) PSC frequencies in L2/3 pyramidal neurons from control, mismatch (Mism), and DCX slices, and in ectopic cells. The numbers of recorded cells are given in parentheses. Bc, Glutamate/GABA PSC frequency ratio in the first three populations of cells. Values indicated in the histogram correspond to the mean of the ratio of Glu to GABA PSC frequency of each individual cell (the number of cells is given in parentheses). Note that the ongoing spontaneous activity in pyramidal cell from experimental L2/3 is largely dominated by glutamate. Most of the ectopic neurons (73%) lack GABA events, but the 15 displaying both GABA and glutamate PSC presented a mean Glu/GABA PSC frequency ratio of 1.8 ± 0.6. C, Histogram representing the EPSC size distribution in pyramidal cells recorded in control layer 2/3 (837 events, n = 3), experimental layer 2/3 (837 events, n = 4), and heterotopia (817 events, n = 7). Nb, Number. *Significantly different as compared to Cont.L2/3 or Mism.L2/3.
Experimental L2/3 neurons exhibited an approximately fourfold increase in sEPSC frequencies with respect to control L2/3 neurons (expL2/3, 7.94 ± 1.9 Hz, n = 14 cells; contL2/3, 2.02 ± 0.8 Hz, n = 10 cells; p = 0.0215) (Fig. 6 A,B) without significant change of their kinetics properties and amplitudes (Table 3, Fig. 6 C). In experimental L2/3, there was no significant change in sIPSC frequency (Table 3), but the ratio of glutamatergic/GABAergic events was ∼11 times higher than in control L2/3 (Fig. 6 Bc). Cortical L2/3 neurons from animals injected with mismatch constructs (see Materials and Methods) displayed a frequency of EPSCs and IPSCs similar to that of control L2/3 neurons (Table 3). In addition, the glutamatergic/GABAergic events ratio (∼1) was unaffected (Fig. 6 C). Therefore, we propose that the development of white matter heterotopia in DCX animals results in a dramatic alteration in overlying cortex toward increased glutamatergic drive.
Table 3.
Synaptic properties of recorded neurons from control (untransfected or mismatch transfected) and DCX cortex (experimental L2/3 or heterotopia)
| Control L2/3 (n = 8) | Mismatch L2/3 (n = 7) | Experimental L2/3 (n = 14) | Heterotopia (n = 46) | |
|---|---|---|---|---|
| GABA PSCs | ||||
| Frequency (Hz) | 2.1 ± 1.4 | 1.1 ± 0.6 | 0.74 ± 0.1 | 0.03 ± 0.001* † |
| Rise time (ms) | 7.2 ± 1.9 | 6.1 ± 1.0 | 4.3 ± 1.0 | 2.9 ± 1.2 |
| Decay time (ms) | 25.1 ± 8.5 | 27 ± 8.2 | 20 ± 5.8 | 11.8 ± 4.5 |
| Amplitude (pA) | 7.9 ± 0.9 | 10.1 ± 1.1 | 13.5 ± 1.4* | 12.9 ± 2.4 |
| Glu PSCs | ||||
| Frequency (Hz) | 2.0 ± 0.7 | 1.3 ± 0.5 | 8.0 ± 1.9* † | 0.23 ± 0.04* † |
| Rise time (ms) | 1.1 ± 0.1 | 2 ± 0.2 | 1.4 ± 0.2 | 1.0 ± 0.1 |
| Decay time (ms) | 6.9 ± 1.4 | 7.6 ± 1.4 | 7.2 ± 1.7 | 7.7 ± 2.3 |
| Amplitude (pA) | 11.4 ± 1.9 | 8.2 ± 1.1 | 9.4 ± 0.9 | 12.8 ± 0.8 |
*p < 0.05 compared with control layer 2/3;
† p < 0.05 compared with mismatch layer 2/3.
EGFP ectopic neurons located in the white matter or in layer 6 exhibited a drastic decrease in the frequency of spontaneous synaptic activities with respect to control L2/3 cells and experimental L2/3 (Fig. 6 B): mean frequencies of IPSCs and EPSCs in the heterotopia were 0.03 ± 0.001 and 0.23 ± 0.04 (p < 0.0001), respectively, without significant changes of both amplitudes and kinetics of the events (Table 3, Fig. 6 C). Furthermore the events in the heterotopia were mostly mediated by glutamate. Thus, glutamate PSCs were observed in 85% of the recorded cells (46/54 cells), but GABA PSCs were observed in only 27% of them (15/54). Up to 15% of recorded neurons (8/54) displayed no synaptic activities. To further stress the absence of IPSCs, we analyzed the effects of electrical stimulations of different cortical areas and white matter, which consistently evoked a response in ectopic neurons that was mediated by glutamate (n = 7/8): the response was always inward at membrane potentials more positive than −70 mV, reversed polarity around 0 mV, and was fully blocked by ionotropic glutamate receptor antagonists (10 μm NBQX and 40 μm d-APV). In one cell, the stimulation failed to evoke any response. Electrical stimulation of the deep layers also evoked a response in 7 of 9 ectopic cells, a response that was mediated by glutamate. No response were evoked in 2 of 9 cells. Finally, the stimulation of layer 2/3 evoked a response mediated by glutamate in 15 of 32 ectopic cells, a response mediated by both GABA and glutamate in 1 cell and no response at all in 16 cells.
Together these data suggest that most neurons in the heterotopia display a reduced synaptic activity and lack functional GABAA synapses. To determine whether this also applied to deep cortical neurons close to the heterotopia, we simultaneously recorded EGFP-positive cells within the heterotopia or layer 6 and EGFP-negative layer 6 neurons (Fig. 7 A). Whereas the fluorescent ectopic neurons displayed spontaneous PSCs and PSCs evoked by electrical stimulation mediated only by glutamate (Fig. 7 C), the non-EGFP cells had PSCs mediated by both glutamate and GABAA receptors (Fig. 7 B). Similar results were obtained in 12 EGFP-negative L6 cells; i.e., spontaneous PSCs and PSCs evoked by stimulation of either superficial layer (n = 3/3) or deep cortical layer (n = 7/7) consisted of GABA and glutamate events. To determine whether ectopic cells have functional GABAA receptors, isoguvacine (30 μm), a specific agonist of GABAA receptor, was pressure ejected for 1 s (Fig. 7 B–D). In all recorded neurons, this evoked a current reversing at E Cl −, thus indicating the presence of GABAA receptors in ectopic and nonectopic neurons. However, in ectopic neurons the amplitude of the evoked currents (expressed in picoamperes per picofarad) was significantly lower than in EGFP-negative neighbor L6 neurons (0.99 ± 0.27 pA/pF and 4.3 ± 0.8 pA/pF in heterotopic neurons and EGFP-negative neighbor L6 neurons, respectively; p < 10−5). A significantly reduced current was also observed when ectopic cells were compared with experimental layer 2/3 cells (3.1 ± 0.6 pA/pF; p < 0.004). Therefore, ectopic neurons display in 2-week-old animals a reduced glutamatergic synaptic drive and a drastic deficit in postsynaptic GABAergic signaling. We wonder whether the lack of functional GABAergic synapses in ectopic cells might be caused by retardation in their establishment. We thus recorded ectopic cells in older animals (1 month old) and found in 7 of 9 cells the presence of spontaneous GABAergic events in addition to glutamatergic events and in two cells the presence of glutamatergic events only. The mean frequencies of GABAergic and glutamatergic PSCs were 1.5 ± 0.7 Hz and 0.83 ± 0.24 Hz, respectively (n = 9); glutamatergic/GABAergic events ratio was 1.13 ± 0.5 (n = 7). Interestingly, kinetic properties of GABAergic and glutamate PSCs were not significantly different from those measured in 2-week-old animals; for GABAergic PSCs, the mean rise time, decay time constant, and amplitude were 1.5 ± 0.2 ms, 15.2 ± 2.5 ms, and 13.4 ± 0.8 pA, respectively (n = 7); for glutamatergic PSCs, the mean rise time, decay time constant, and amplitude were 1.1 ± 0.12 ms, 5.4 ± 0.6 ms, and 10 ± 0.8 pA, respectively (n = 9).
Figure 7.

Lack of functional GABA synapses in ectopic cells. A, Confocal image of two biocytin-injected (red) patch-clamp-recorded neurons from experimental L6. One of them is a transfected (green) ectopic neuron, and the other is not. Scale bar, 50 μm. Ba, Spontaneous synaptic activity of the EGFP-negative layer VI neuron (calibration bar same as in Ca). Bb, Synaptic responses evoked in the same cell by electrical stimulation of deep cortical layers (50 V, 30 μs duration; the artifact of stimulation is indicated by an arrow) at different membrane potentials. Note that both spontaneous and evoked responses are composed of inward and outward currents at membrane potentials more positive than −70 mV, indicating that synaptic responses are mediated by GABA and glutamate receptors. Bc, Currents evoked in the same cell by pressure ejection of isoguvacine (Isog; 30 μm, 1 s, 1 psi) at different membrane potentials. Ca–Cc, Same types of recordings as in B of an EGFP+ ectopic neuron. Ca, Note the presence of fast transient inward currents and the absence of any fast transient outward currents, indicating that the spontaneous activity is mediated only by glutamate receptors. Cb, Synaptic responses evoked in the same cell by electrical stimulation of deep cortical layers (same conditions as described in B). Note that the responses are always inward at potentials more positive than −70 mV, indicating that they are mediated only by glutamate (even higher stimulus intensity, up to 100 V, failed to evoke any outward current at these membrane potentials). Cc, Currents evoked in the same cell by pressure ejection of isoguvacine (30 μm, 1 s, 1 psi) at different membrane potentials. Note that these currents are lower than in a normotopic cell. D, Mean current amplitude evoked by pressure ejection of isoguvacine (30 μm, 1 s) at −40 mV expressed in picoamperes per picofarad in ectopic L6 neurons (mean capacitance: 33 ± 2 pF), nonectopic L6 neurons (experimental L6, mean capacitance: 59 ± 10 pF), and experimental L2/3 neurons (mean capacitance: 35 ± 6 pF). Note that ectopic cells display 3–4 times less currents than nonectopic cells, which display functional GABA synapses. Whole-cell pipettes were filled with a CsGlu internal solution. *p < 0.004.
All in all, these data clearly show that experimental L2/3 neurons exhibit a strong enhancement of synaptic glutamatergic drive with no change in GABAergic synaptic transmission, whereas ectopic neurons display retardation in the establishment of functional GABAergic signaling.
Ectopic and experimental L2/3 neurons are integrated on cortical networks
Patch-clamp recordings have revealed that L2/3 cells overlying the heterotopia display an enhanced glutamatergic synaptic drive that leads to a drastic increase of neuronal activity. Therefore, we reasoned that this hyperexcitability could favor the generation of spontaneous network synchronized activities; accordingly, increased percentage of neurotransmitter-mediated correlated calcium events have been observed using calcium imaging (Fig. 5). To test this hypothesis, extracellular field recordings were performed in experimental L2/3 cells overlying the heterotopia and compared with control L2/3 neurons (Fig. 8).
Figure 8.

Ectopic neurons participate in cortical network activity. A, Concomitant field potential (F.P.) recording of experimental L2/3 and patch-clamp recording of an ectopic cell at −40 mV holding potential. A single electrical stimulation of L2/3 (40 V, 30 μs) evokes responses that are blocked by ionotropic glutamate receptor antagonists (NBQX, 10 μm; d-APV, 40 μm). The remaining population spike in the field is blocked by TTX (1 μm). B, Coincident spontaneous recurrent activities recorded in experimental L2/3 (field potential) and an ectopic neuron (patch clamp at a holding potential of −40 mV). Each of these recurrent network events is shown at an expanded time scale below the continuous trace. C, Mg2+-free ACSF solution generates epileptiform activities in the population of experimental L2/3 neurons associated with a barrage of glutamatergic PSCs in an ectopic cell recorded at −40 mV. One burst is shown at a higher time scale below the continuous trace, and one of the events in the burst (marked with an asterisk) is shown at an expanded time scale on the right. Note that the onset of the field potential in L2/3 (labeled with a dashed line) starts before the onset of the ectopic cell. D, Histogram representing the difference in the latency of the onset of the field and of the PSCs of each event within the burst. Note that for almost half of the events, the onset of the field starts at the same time as the PSCs, whereas in the majority of events, L2/3 is active before the ectopic cell. The ectopic cell is active before the field (negative latency) in only a few cases. Nb, Number.
We observed that in normal ACSF (3.5 mm K+) (Fig. 8 B) or in ACSF containing 5 mm K+, 40% (4 of 10 slices) and 75% of experimental L2/3 (6 of 8 slices), respectively, displayed spontaneous network events that were fully abolished by glutamatergic receptor antagonist (10 μm NBQX, 40 μm d-APV, data not shown). In contrast, control L2/3 neurons did not display spontaneous activities in normal ACSF or in ACSF containing 5 mm K+. Therefore, L2/3 dysplastic cortex is more susceptible to generate glutamatergic spontaneous network-driven activities. A simultaneous patch-clamp recording of ectopic cells and L2/3 field (performed in normal ACSF) revealed the presence of coincident glutamatergic spontaneous network-driven activities (Fig. 8 B). In addition, the stimulation of cortical L2/3 or white matter (n = 10) (Fig. 8 A) evoked synaptic responses in ectopic cells, and this was always coincident with a field response in the layer 2/3, both responses being blocked by glutamate receptors antagonists. These data indicate that heterotopic and L2/3 networks may work together via glutamate pathway to generate coherent activities.
Next we assessed whether the dysplastic cortex is capable of supporting the generation of epileptiform activities. To this aim, slices were superfused with a Mg2+-free ACSF solution, and ectopic neurons (patch clamp) and L2/3 overlying the heterotopia (field recordings) were simultaneously recorded. This condition elicited synchronous epileptiform discharges in experimental L2/3 (Fig. 8 C) in five slices tested. In three slices, bursts were also observed in the heterotopia, which were concomitant with those recorded in L2/3, but experimental L2/3 exhibited more interburst activity than ectopic neurons. These activities were mediated by glutamate, because they were blocked by 10 μm NBQX and 40 μm APV (data not shown). Interestingly, experimental cortex was activated either at the same time or before ectopic neurons (in 33 of 82 bursts and 43 of 82 bursts, respectively) (Fig. 8 D). In a minority of cases (6 of 82 bursts), ectopic neurons were activated before the experimental layer. This strongly suggests that the epileptiform discharges do not start from the heterotopia, and transit preferentially through experimental L2/3 neurons. Moreover, these data also show that ectopic neurons are integrated in the cortical network and may participate in the development of pathological activity together with L2/3 neurons.
Discussion
The presence of cortical malformations in many patients with intractable childhood epilepsy underscores the importance of understanding the basis of aberrant communication in dysplastic networks. Here, using fast calcium imaging and targeted cell recordings, we provide the first report of the development network properties in a modeled human genetic neocortical malformation. We show that ectopic neurons display a delayed maturation of functional GABAergic synapses though they generate voltage-gated synchronized oscillatory currents. Neocortex overlying the heterotopia exhibits a synaptic remodeling/plasticity leading to increased excitability through enhanced glutamatergic synaptic drive. The convergence of these features may facilitate the generation of coherent pathologic oscillations. Ectopic neurons are integrated within the same network as overlying cortex and are coactivated during epileptiform bursts in low-magnesium media. These results suggest that migration disorders produce major alterations not only in neurons that fail to migrate but also in their programmed target areas.
Delayed maturation of GABAergic signaling in ectopic neurons
During the second postnatal week, neurons in the heterotopia, unlike control or experimental L2/3 neurons, display in calcium imaging analysis coherent calcium events insensitive to glutamate and GABA receptor antagonists and blocked by TTX. This type of activity is reminiscent of previous observations depicting in maturing hippocampus, around birth, small cell assemblies that generate synchronous nonsynaptic calcium oscillations via gap junctions; this type of activity being progressively shut down during maturation by the emergence of synapse-driven activity (Crépel et al., 2007). Accordingly, we found additional biocytin-filled axons in our reconstruction experiments of ectopic neurons that could not have come from other filled neurons in the slices and (Fig. 2; supplemental Movie S1, available at www.jneurosci.org as supplemental material); these data indicate that ectopic neurons presumably form gap junctions with other callosally projecting neurons. Interestingly, previous theoretical and experimental work has indicated a role for axo-axonic gap junctions in the generation of high frequency oscillations (Schmitz et al., 2001; Traub et al., 2001). Future studies may clarify the prevalence of axo-axonic gap junctions in malformed neocortical neurons. These observations lead us to propose that neurons in an unfavorable ectopic location retain functional immature status compared with normally positioned neurons. In keeping with this, patch-clamp recordings show that the majority of ectopic neurons generate spikes with immature properties (half-width and amplitude) and exhibit a reduced number of glutamatergic synaptic events and a dramatic loss of GABAergic synaptic drive compared with control L2/3 neurons during the second postnatal week. A reduction of sIPSC frequencies was previously shown in intrahippocampal heterotopia in rats treated with methylazoxymethanol acetate (MAM rats) (Calcagnotto et al., 2002, 2005) or in white matter heterotopia in rats that have been exposed to in utero gamma irradiation (Zhu and Roper, 2000; Chen and Roper, 2003). However, at the second postnatal week, DCX heterotopias display a more severe phenotype: most neurons did not display any GABA synaptic event. This severe lack of GABAergic signaling in DCX heterotopia is not a consequence of presynaptic deficiencies, because the heterotopia contains different types of GABA interneurons (Ramos et al., 2006) and ectopic neurons are surrounded by numerous GAD65/67-positive terminals. Recordings of older animals reveal that the lack of GABAergic activity during the second postnatal week in ectopic cells results from a delay in the establishment of functional synapses. Indeed, ectopic cells from 1-month-old animals exhibit a well developed GABAergic synaptic transmission reaching the level of the glutamatergic one. Preliminary experiments on cultured cortical neurons also show that DCX knockdown neurons acquire functional GABA synapses in a way similar to neurons transfected with mismatch constructs used as control (L. Aniksztejn, E. Becq, and A. Represa, unpublished observations). Therefore, there is an important delay in the maturation of GABAergic signaling that is most likely the consequence of the abnormal position/environment of ectopic neurons (white matter/deep cortical layers instead of L2/3). Previous experiments performed in the neonatal hippocampus and neocortex have provided evidence that GABAergic synapses are established before glutamatergic synapses (Tyzio et al., 1999; Hennou et al., 2002; Owens and Kriegstein, 2002; Ge et al., 2006; Wang and Kriegstein, 2008). Furthermore, a recent study has demonstrated that GABAergic activity is necessary for the formation of functional glutamatergic synapses (Wang and Kriegstein, 2008). Interestingly, our results show that ectopic cells display glutamatergic activity before GABAergic activity, indicating that this rule may not apply for misplaced neurons, although we cannot exclude that, once established, GABAergic activity accelerates the formation of glutamatergic synapses.
Abnormal synaptic properties of experimental L2/3 neurons
Calcium imaging in experimental L2/3 cortex revealed a significant increase in the number of synaptically active neurons and the number and frequency of events recorded. In agreement with this, patch-clamp recordings indicate a clear increase in the number of glutamate-mediated synaptic events with no apparent change on the GABAergic drive in experimental L2/3 compared with untransfected or mismatch-transfected L2/3 pyramids. This leads to a dramatic shift of the glutamate/GABA ratio toward excitation. Our data show that the density of vGlut1-immunoreactive terminals is not modified compared with controls and that the kinetics and amplitude of the synaptic events recorded were similar to control slices. Therefore we propose that the increased frequency of glutamate-mediated synaptic events on experimental L2/3 neurons might result from an increased probability of glutamate release or firing of glutamatergic cells innervating L2/3 neurons. Interestingly, our calcium imaging analysis indicates that compared with control, higher numbers of experimental L2/3 neurons are active at higher frequency rates, suggesting that a corticocortical loop is involved in this alteration.
Previous investigations in telencephalic internal structural heterotopia (TISH) rats also concluded in an increased excitability of “experimental” cortex overlying the heterotopia but linked to a decrease in the GABAergic drive (Trotter et al., 2006). In fact, in TISH as in irradiated rats (Xiang et al., 2006), the population of GABAergic neurons is directly affected. In contrast, DCX RNAi rats present a quite normal upper layer organization. In this apparently “normal” cortex, the density of GABA neurons (Ramos et al., 2006) and GABA synaptic terminals (Fig. 3) and the features of recorded GABA synaptic events were similar to that of controls. On the other hand, it has been proposed that synaptic remodeling induced by different types of insults can lead to the emergence of epilepsy (e.g., Li and Prince, 2002; Jin et al., 2006). For example, layer V pyramidal cells in isolated cortex receive an excitatory synaptic input that is increased in spatial extent and intensity and is derived principally from presynaptic neurons (Jin et al., 2006). Our present results depicting an increased excitatory input to layer 2/3 pyramidal neurons may therefore result from a similar mechanism. The increased excitability in DCX experimental cortex resulting from a heightened glutamatergic drive to pyramidal neurons would be the combined product of heterotopia formation and deep layer circuit alterations and the subsequent remodeling of cortical networks.
Subcortical connections of ectopic neurons in DCX rats
Previous work has demonstrated that the majority of corticostriatal fibers originate from L5 (Levesque et al., 1996). Analyses of MAM, x-ray-irradiated, and TISH rats have revealed that misplaced layer 5 neurons develop subcortical efferent connections, such as callosal (Yurkewicz et al., 1984) and corticospinal (Jensen and Killackey, 1984), and that they may possibly contact thalamic nuclei and striatum (Schottler et al., 1998), thus suggesting that ectopic neurons are able to extend long-range projections and reach the target they would have contacted in a normotopic position. Our analyses indicate that in control pups callosally projecting L2/3 neurons did not send collateral fibers to the striatum. However, a number of ectopic neurons from our experimental pups, initially destined to colonize L2/3, not only exhibit callosal efferents, but also send collaterals that course through the external capsule and into the striatum/internal capsule. Thus, our results suggest that the axonal connectivity of immature neurons is also influenced by positional information, perhaps through transcriptional expression changes such as in satB2 and ctip2, which are associated with neuronal fate respecification and subcortical rewiring (Alcamo et al., 2008; Britanova et al., 2008).
Experimental L2/3–heterotopic neuronal network
We demonstrated using calcium imaging techniques that neurons within the heterotopia and experimental cortex displayed a high level of activity correlation, higher than that observed in control cortex. Interestingly, combined field and patch-clamp recordings of experimental and ectopic neurons demonstrate that activity correlation was also observed between the two fields. Stimulations of cortical afferents evoked synchronous responses in both heterotopia and experimental cortex. In addition, spontaneous coherent network-driven events were recorded both in normal ACSF and low-magnesium conditions. Post hoc reconstruction of recorded neurons revealed that axon collaterals from ectopic neurons reach layers 4–5 and that L2/3 experimental neurons send collateral branches that course within the heterotopia. Similar to these observations, previous studies on MAM, x-ray-irradiated, and TISH rats depicted the presence of functional cortical–heterotopia connections (for review, see Chevassus-Au-Louis et al., 1999), even when ectopic cortical neurons localize within the hippocampus (Chevassus-Au-Louis et al., 1998); these connections provide a morphological substrate to integrate heterotopia and experimental cortex within the same network. One of the more interesting observations reported here is the activation of experimental cortex earlier than ectopic neurons, indicating that heterotopias are followers rather than initiation centers, in agreement with earlier studies on intrahippocampal heterotopia in MAM rats (Chevassus-Au-Louis et al., 1998) or the band heterotopia of TISH rats (Chen et al., 2000). The band heterotopia may rather act as a relay-projection center to subcortical structures so that activity patterns generated in the experimental L2/3–heterotopic loop would easily be propagated to other brain areas and contribute to neurologic manifestations such as epilepsy and mental retardation.
In conclusion, we describe the properties of the cortical network in a relevant experimental model of human subcortical band heterotopia induced by the RNAi of DCX. Our data, obtained during the first postnatal weeks, indicate that upper layer cortical neurons maturing in an ectopic position (the white matter) display abnormal long-lasting immature properties, including a severe delay in the establishment of GABAergic signaling. In addition, we show that the experimental cortex overlying the heterotopia displays reactive-type changes by increasing glutamatergic inputs and the number of synaptically active neurons. Our data also depict that both areas are integrated within the same network. These changes combined with the development of projections from heterotopia to subcortical regions, mainly striatum, will affect the operation and integrative capacities of cortical networks, leading to seizures and alteration of cognitive functions, which are the primary neurological deficits observed in patients with developmental disorders. In a wider context, the analysis of the electrical activity of neuronal ensembles and their programmed target areas in other disorders may provide a better understanding of the relation between genotype and phenotype and how developmental disorders alter cortical operation.
Footnotes
This work was supported by Agence nationale de la recherche Grant RPV06055ASA, European Commission contract LSH-CT-2006-037315 (EPICURE) FP6—Thematic priority LIFESCIHEALTH and INSERM. We thank Drs. J. Lo Turco and J. Bai for kindly providing DCX constructs and their help for developing the in utero injection/electroporation technique in our laboratory. We thank Adriano Cattani for his help on preliminary patch-clamp experiments and Isabel Jorquera for help with histology.
References
- Alcamo EA, Chirivella L, Dautzenberg M, Dobreva G, Fariñas I, Grosschedl R, McConnell SK. Satb2 regulates callosal projection neuron identity in the developing cerebral cortex. Neuron. 2008;57:364–377. doi: 10.1016/j.neuron.2007.12.012. [DOI] [PubMed] [Google Scholar]
- Bai J, Ramos RL, Ackman JB, Thomas AM, Lee RV, LoTurco JJ. RNAi reveals doublecortin is required for radial migration in rat neocortex. Nat Neurosci. 2003;6:1277–1283. doi: 10.1038/nn1153. [DOI] [PubMed] [Google Scholar]
- Britanova O, de Juan Romero C, Cheung A, Kwan KY, Schwark M, Gyorgy A, Vogel T, Akopov S, Mitkovski M, Agoston D, Sestan N, Molnár Z, Tarabykin V. Satb2 is a postmitotic determinant for upper-layer neuron specification in the neocortex. Neuron. 2008;57:378–392. doi: 10.1016/j.neuron.2007.12.028. [DOI] [PubMed] [Google Scholar]
- Cahana A, Escamez T, Nowakowski RS, Hayes NL, Giacobini M, von Holst A, Shmueli O, Sapir T, McConnell SK, Wurst W, Martinez S, Reiner O. Targeted mutagenesis of Lis1 disrupts cortical development and LIS1 homodimerization. Proc Natl Acad Sci U S A. 2001;98:6429–6434. doi: 10.1073/pnas.101122598. [DOI] [PMC free article] [PubMed] [Google Scholar]
- Calcagnotto ME, Paredes MF, Baraban SC. Heterotopic neurons with altered inhibitory synaptic function in an animal model of malformation-associated epilepsy. J Neurosci. 2002;22:7596–7605. doi: 10.1523/JNEUROSCI.22-17-07596.2002. [DOI] [PMC free article] [PubMed] [Google Scholar]
- Calcagnotto ME, Paredes MF, Tihan T, Barbaro NM, Baraban SC. Dysfunction of synaptic inhibition in epilepsy associated with focal cortical dysplasia. J Neurosci. 2005;25:9649–9657. doi: 10.1523/JNEUROSCI.2687-05.2005. [DOI] [PMC free article] [PubMed] [Google Scholar]
- Chen HX, Roper SN. Reduction of spontaneous inhibitory synaptic activity in experimental heterotopic gray matter. J Neurophysiol. 2003;89:150–158. doi: 10.1152/jn.00325.2002. [DOI] [PubMed] [Google Scholar]
- Chen ZF, Schottler F, Bertram E, Gall CM, Anzivino MJ, Lee KS. Distribution and initiation of seizure activity in a rat brain with subcortical band heterotopia. Epilepsia. 2000;41:493–501. doi: 10.1111/j.1528-1157.2000.tb00201.x. [DOI] [PubMed] [Google Scholar]
- Chevassus-Au-Louis N, Represa A. The right neuron at the wrong place: biology of heterotopic neurons in cortical neuronal migration disorders, with special reference to associated pathologies. Cell Mol Life Sci. 1999;55:1206–1215. doi: 10.1007/s000180050367. [DOI] [PMC free article] [PubMed] [Google Scholar]
- Chevassus-Au-Louis N, Congar P, Represa A, Ben-Ari Y, Gaïarsa JL. Neuronal migration disorders: heterotopic neocortical neurons in CA1 provide a bridge between the hippocampus and the neocortex. Proc Natl Acad Sci U S A. 1998;95:10263–10268. doi: 10.1073/pnas.95.17.10263. [DOI] [PMC free article] [PubMed] [Google Scholar]
- Chevassus-Au-Louis N, Jorquera I, Ben-Ari Y, Represa A. Abnormal connections in the malformed cortex of rats with prenatal treatment with methylazoxymethanol may support hyperexcitability. Dev Neurosci. 1999;21:385–392. doi: 10.1159/000017388. [DOI] [PubMed] [Google Scholar]
- Corbo JC, Deuel TA, Long JM, LaPorte P, Tsai E, Wynshaw-Boris A, Walsh CA. Doublecortin is required in mice for lamination of the hippocampus but not the neocortex. J Neurosci. 2002;22:7548–7557. doi: 10.1523/JNEUROSCI.22-17-07548.2002. [DOI] [PMC free article] [PubMed] [Google Scholar]
- Cossart R, Aronov D, Yuste R. Attractor dynamics of network UP states in the neocortex. Nature. 2003;423:283–288. doi: 10.1038/nature01614. [DOI] [PubMed] [Google Scholar]
- Crépel V, Aronov D, Jorquera I, Represa A, Ben-Ari Y, Cossart R. A parturition-associated nonsynaptic coherent activity pattern in the developing hippocampus. Neuron. 2007;54:105–120. doi: 10.1016/j.neuron.2007.03.007. [DOI] [PubMed] [Google Scholar]
- des Portes V, Pinard JM, Billuart P, Vinet MC, Koulakoff A, Carrié A, Gelot A, Dupuis E, Motte J, Berwald-Netter Y, Catala M, Kahn A, Beldjord C, Chelly J. A novel CNS gene required for neuronal migration and involved in X-linked subcortical laminar heterotopia and lissencephaly syndrome. Cell. 1998;92:51–61. doi: 10.1016/s0092-8674(00)80898-3. [DOI] [PubMed] [Google Scholar]
- Dobyns WB, Reiner O, Carrozzo R, Ledbetter DH. Lissencephaly. A human brain malformation associated with deletion of the LIS1 gene located at chromosome 17p13. JAMA. 1993;270:2838–2842. doi: 10.1001/jama.270.23.2838. [DOI] [PubMed] [Google Scholar]
- Epsztein J, Milh M, Bihi RI, Jorquera I, Ben-Ari Y, Represa A, Crépel V. Ongoing epileptiform activity in the post-ischemic hippocampus is associated with a permanent shift of the excitatory-inhibitory synaptic balance in CA3 pyramidal neurons. J Neurosci. 2006;26:7082–7092. doi: 10.1523/JNEUROSCI.1666-06.2006. [DOI] [PMC free article] [PubMed] [Google Scholar]
- Farrell MA, DeRosa MJ, Curran JG, Secor DL, Cornford ME, Comair YG, Peacock WJ, Shields WD, Vinters HV. Neuropathologic findings in cortical resections (including hemispherectomies) performed for the treatment of intractable childhood epilepsy. Acta Neuropathol. 1992;83:246–259. doi: 10.1007/BF00296786. [DOI] [PubMed] [Google Scholar]
- Fleck MW, Hirotsune S, Gambello MJ, Phillips-Tansey E, Suares G, Mervis RF, Wynshaw-Boris A, McBain CJ. Hippocampal abnormalities and enhanced excitability in a murine model of human lissencephaly. J Neurosci. 2000;20:2439–2450. doi: 10.1523/JNEUROSCI.20-07-02439.2000. [DOI] [PMC free article] [PubMed] [Google Scholar]
- Francis F, Koulakoff A, Boucher D, Chafey P, Schaar B, Vinet MC, Friocourt G, McDonnell N, Reiner O, Kahn A, McConnell SK, Berwald-Netter Y, Denoulet P, Chelly J. Doublecortin is a developmentally regulated, microtubule-associated protein expressed in migrating and differentiating neurons. Neuron. 1999;23:247–256. doi: 10.1016/s0896-6273(00)80777-1. [DOI] [PubMed] [Google Scholar]
- Ge S, Goh EL, Sailor KA, Kitabatake Y, Ming GL, Song H. GABA regulates synaptic integration of newly generated neurons in the adult brain. Nature. 2006;439:589–593. doi: 10.1038/nature04404. [DOI] [PMC free article] [PubMed] [Google Scholar]
- Gleeson JG, Allen KM, Fox JW, Lamperti ED, Berkovic S, Scheffer I, Cooper EC, Dobyns WB, Minnerath SR, Ross ME, Walsh CA. Doublecortin, a brain-specific gene mutated in human X-linked lissencephaly and double cortex syndrome, encodes a putative signaling protein. Cell. 1998;92:63–72. doi: 10.1016/s0092-8674(00)80899-5. [DOI] [PubMed] [Google Scholar]
- Goldin M, Epsztein J, Jorquera I, Represa A, Ben-Ari Y, Crépel V, Cossart R. Synaptic kainate receptors tune oriens-lacunosum moleculare interneurons to operate at theta frequency. J Neurosci. 2007;27:9560–9572. doi: 10.1523/JNEUROSCI.1237-07.2007. [DOI] [PMC free article] [PubMed] [Google Scholar]
- Guerrini R, Dobyns WB, Barkovich AJ. Abnormal development of the human cerebral cortex: genetics, functional consequences and treatment options. Trends Neurosci. 2008;31:154–162. doi: 10.1016/j.tins.2007.12.004. [DOI] [PubMed] [Google Scholar]
- Hamzei-Sichani F, Kamasawa N, Janssen WG, Yasumura T, Davidson KG, Hof PR, Wearne SL, Stewart MG, Young SR, Whittington MA, Rash JE, Traub RD. Gap junctions on hippocampal mossy fiber axons demonstrated by thin-section electron microscopy and freeze fracture replica immunogold labeling. Proc Natl Acad Sci U S A. 2007;104:12548–12553. doi: 10.1073/pnas.0705281104. [DOI] [PMC free article] [PubMed] [Google Scholar]
- Hardiman O, Burke T, Phillips J, Murphy S, O'Moore B, Staunton H, Farrell MA. Microdysgenesis in resected temporal neocortex: incidence and clinical significance in focal epilepsy. Neurology. 1988;38:1041–1047. doi: 10.1212/wnl.38.7.1041. [DOI] [PubMed] [Google Scholar]
- Hennou S, Khalilov I, Diabira D, Ben-Ari Y, Gozlan H. Early sequential formation of functional GABA(A) and glutamatergic synapses on CA1 interneurons of the rat foetal hippocampus. Eur J Neurosci. 2002;16:197–208. doi: 10.1046/j.1460-9568.2002.02073.x. [DOI] [PubMed] [Google Scholar]
- Hirotsune S, Fleck MW, Gambello MJ, Bix GJ, Chen A, Clark GD, Ledbetter DH, McBain CJ, Wynshaw-Boris A. Graded reduction of Pafah1b1 (Lis1) activity results in neuronal migration defects and early embryonic lethality. Nat Genet. 1998;19:333–339. doi: 10.1038/1221. [DOI] [PubMed] [Google Scholar]
- Jensen KF, Killackey HP. Subcortical projections from ectopic neocortical neurons. Proc Natl Acad Sci U S A. 1984;81:964–968. doi: 10.1073/pnas.81.3.964. [DOI] [PMC free article] [PubMed] [Google Scholar]
- Jin X, Prince DA, Huguenard JR. Enhanced excitatory synaptic connectivity in layer V pyramidal neurons of chronically injured epileptogenic neocortex in rats. J Neurosci. 2006;26:4891–4900. doi: 10.1523/JNEUROSCI.4361-05.2006. [DOI] [PMC free article] [PubMed] [Google Scholar]
- Jones DL, Baraban SC. Characterization of inhibitory circuits in the malformed hippocampus of Lis1 mutant mice. J Neurophysiol. 2007;98:2737–2746. doi: 10.1152/jn.00938.2007. [DOI] [PubMed] [Google Scholar]
- Levesque M, Charara A, Gagnon S, Parent A, Deschenes M. Corticostriatal projections from layer V cells in rat are collaterals of long-range corticofugal axons. Brain Res. 1996;709:311–315. doi: 10.1016/0006-8993(95)01333-4. [DOI] [PubMed] [Google Scholar]
- Li H, Prince DA. Synaptic activity in chronically injured, epileptogenic sensory-motor neocortex. J Neurophysiol. 2002;88:2–12. doi: 10.1152/jn.00507.2001. [DOI] [PubMed] [Google Scholar]
- Mao BQ, Hamzei-Sichani F, Aronov D, Froemke RC, Yuste R. Dynamics of spontaneous activity in neocortical slices. Neuron. 2001;32:883–898. doi: 10.1016/s0896-6273(01)00518-9. [DOI] [PubMed] [Google Scholar]
- Mischel PS, Nguyen LP, Vinters HV. Cerebral cortical dysplasia associated with pediatric epilepsy. Review of neuropathologic features and proposal for a grading system. J Neuropathol Exp Neurol. 1995;54:137–153. doi: 10.1097/00005072-199503000-00001. [DOI] [PubMed] [Google Scholar]
- Mochida GH, Walsh CA. Genetic basis of developmental malformations of the cerebral cortex. Arch Neurol. 2004;61:637–640. doi: 10.1001/archneur.61.5.637. [DOI] [PubMed] [Google Scholar]
- Nosten-Bertrand M, Kappeler C, Dinocourt C, Denis C, Germain J, Phan Dinh Tuy F, Verstraeten S, Alvarez C, Métin C, Chelly J, Giros B, Miles R, Depaulis A, Francis F. Epilepsy in Dcx knockout mice associated with discrete lamination defects and enhanced excitability in the hippocampus. PLoS ONE. 2008;3:e2473. doi: 10.1371/journal.pone.0002473. [DOI] [PMC free article] [PubMed] [Google Scholar]
- Owens DF, Kriegstein AR. Is there more to GABA than synaptic inhibition? Nat Rev Neurosci. 2002;3:715–727. doi: 10.1038/nrn919. [DOI] [PubMed] [Google Scholar]
- Paxinos G, Watson C. The rat brain in stereotaxic coordinates. San Diego: Academic; 1997. [DOI] [PubMed] [Google Scholar]
- Peinado A, Yuste R, Katz LC. Gap junctional communication and the development of local circuits in neocortex. Cereb Cortex. 1993;3:488–498. doi: 10.1093/cercor/3.5.488. [DOI] [PubMed] [Google Scholar]
- Pilz DT, Kuc J, Matsumoto N, Bodurtha J, Bernadi B, Tassinari CA, Dobyns WB, Ledbetter DH. Subcortical band heterotopia in rare affected males can be caused by missense mutations in DCX (XLIS) or LIS1. Hum Mol Genet. 1999;8:1757–1760. doi: 10.1093/hmg/8.9.1757. [DOI] [PubMed] [Google Scholar]
- Porter BE, Judkins AR, Clancy RR, Duhaime A, Dlugos DJ, Golden JA. Dysplasia: a common finding in intractable pediatric temporal lobe epilepsy. Neurology. 2003;61:365–368. doi: 10.1212/01.wnl.0000076487.28227.6e. [DOI] [PubMed] [Google Scholar]
- Ramos RL, Bai J, LoTurco JJ. Heterotopia formation in rat but not mouse neocortex after RNA interference knockdown of DCX. Cereb Cortex. 2006;16:1323–1331. doi: 10.1093/cercor/bhj074. [DOI] [PubMed] [Google Scholar]
- Reiner O, Carrozzo R, Shen Y, Wehnert M, Faustinella F, Dobyns WB, Caskey CT, Ledbetter DH. Isolation of a Miller-Dieker lissencephaly gene containing G protein beta-subunit-like repeats. Nature. 1993;364:717–721. doi: 10.1038/364717a0. [DOI] [PubMed] [Google Scholar]
- Schmitz D, Schuchmann S, Fisahn A, Draguhn A, Buhl EH, Petrasch-Parwez E, Dermietzel R, Heinemann U, Traub RD. Axo-axonal coupling. a novel mechanism for ultrafast neuronal communication. Neuron. 2001;31:831–840. doi: 10.1016/s0896-6273(01)00410-x. [DOI] [PubMed] [Google Scholar]
- Schottler F, Couture D, Rao A, Kahn H, Lee KS. Subcortical connections of normotopic and heterotopic neurons in sensory and motor cortices of the tish mutant rat. J Comp Neurol. 1998;395:29–42. [PubMed] [Google Scholar]
- Schwartzkroin PA, Walsh CA. Cortical malformations and epilepsy. Ment Retard Dev Disabil Res Rev. 2000;6:268–280. doi: 10.1002/1098-2779(2000)6:4<268::AID-MRDD6>3.0.CO;2-B. [DOI] [PubMed] [Google Scholar]
- Tanaka T, Serneo FF, Higgins C, Gambello MJ, Wynshaw-Boris A, Gleeson JG. Lis1 and doublecortin function with dynein to mediate coupling of the nucleus to the centrosome in neuronal migration. J Cell Biol. 2004;165:709–721. doi: 10.1083/jcb.200309025. [DOI] [PMC free article] [PubMed] [Google Scholar]
- Traub RD, Whittington MA, Buhl EH, LeBeau FE, Bibbig A, Boyd S, Cross H, Baldeweg T. A possible role for gap junctions in generation of very fast EEG oscillations preceding the onset of, and perhaps initiating, seizures. Epilepsia. 2001;42:153–170. doi: 10.1046/j.1528-1157.2001.26900.x. [DOI] [PubMed] [Google Scholar]
- Trotter SA, Kapur J, Anzivino MJ, Lee KS. GABAergic synaptic inhibition is reduced before seizure onset in a genetic model of cortical malformation. J Neurosci. 2006;26:10756–10767. doi: 10.1523/JNEUROSCI.2323-06.2006. [DOI] [PMC free article] [PubMed] [Google Scholar]
- Tyzio R, Represa A, Jorquera I, Ben-Ari Y, Gozlan H, Aniksztejn L. The establishment of GABAergic and glutamatergic synapses on CA1 pyramidal neurons is sequential and correlates with the development of the apical dendrite. J Neurosci. 1999;19:10372–10382. doi: 10.1523/JNEUROSCI.19-23-10372.1999. [DOI] [PMC free article] [PubMed] [Google Scholar]
- Wang DD, Kriegstein AR. GABA regulates excitatory synapse formation in the neocortex via NMDA receptor activation. J Neurosci. 2008;28:5547–5558. doi: 10.1523/JNEUROSCI.5599-07.2008. [DOI] [PMC free article] [PubMed] [Google Scholar]
- Xiang H, Chen HX, Yu XX, King MA, Roper SN. Reduced excitatory drive in interneurons in an animal model of cortical dysplasia. J Neurophysiol. 2006;96:569–578. doi: 10.1152/jn.01133.2005. [DOI] [PubMed] [Google Scholar]
- Yurkewicz L, Valentino KL, Floeter MK, Fleshman JW, Jr, Jones EG. Effects of cytotoxic deletions of somatic sensory cortex in fetal rats. Somatosens Res. 1984;1:303–327. doi: 10.3109/07367228409144553. [DOI] [PubMed] [Google Scholar]
- Zhu WJ, Roper SN. Reduced inhibition in an animal model of cortical dysplasia. J Neurosci. 2000;20:8925–8931. doi: 10.1523/JNEUROSCI.20-23-08925.2000. [DOI] [PMC free article] [PubMed] [Google Scholar]