

Abstract
Microglial activation is an integral part of neuroinflammation associated with many neurodegenerative conditions. Interestingly, a number of neurodegenerative conditions exhibit enhanced P2X7 receptor (P2X7R) expression in the neuroinflammatory foci where activated microglia are a coexisting feature. Whether P2X7R overexpression is driving microglial activation or, conversely, P2X7R overexpression is a consequence of microglial activation is not known. We report that overexpression alone of a purinergic P2X7R, in the absence of pathological insults, is sufficient to drive the activation and proliferation of microglia in rat primary hippocampal cultures. The trophic responses observed in microglia were found to be P2X7R specific as the P2X7R antagonist, oxidized ATP (oxATP), was effective in markedly attenuating microgliosis. oxATP treatment of primary hippocampal cultures expressing exogenous P2X7Rs resulted in a significant decrease in the number of activated microglia. P2X7R is unusual in exhibiting two conductance states, a cation channel and a plasma membrane pore, and there are no pharmacological agents capable of cleanly discriminating between these two states. We used a point mutant of P2X7R (P2X7RG345Y) with intact channel function but ablated pore-forming capacity to establish that the trophic effects of increased P2X7R expression are exclusively mediated by the pore conductance. Collectively, and contrary to previous reports describing P2X7R as a “death receptor,” we provide evidence for a novel trophic role for P2X7R pore in microglia.
Introduction
Microglia are the immunocompetent cells of the CNS (Pessac et al., 2001). At rest microglia display characteristically ramified morphology with numerous branching processes (Soltys et al., 2001), continually used to survey their microenvironment. In response to injury, microglia become activated (Nimmerjahn et al., 2005), assuming markedly different morphological, biochemical, and immunological states (Banati et al., 1993; Bal-Price and Brown, 2001; Nimmerjahn et al., 2005). They retract their ramified processes, develop enlarged somata and numerous lamellipodia (Ralevic and Burnstock, 1998; Streit et al., 1999), and migrate to the site of injury and proliferate (Gehrmann et al., 1995).
The P2X7R is an ATP-gated, nonselective cation channel allowing Ca2+ and Na+ influx and K+ efflux. This receptor is abundant in cells of immunological origin or function, in particular macrophages (Steinberg et al., 1987), mast cells (Cockcroft and Gomperts, 1979), and microglia (Visentin et al., 1999). Contributions of P2X7R to proinflammatory events such as release of cytokines interleukin-1β (Ferrari et al., 1997) and tumor necrosis factor-α (TNF-α) (Suzuki et al., 2004b) are well documented. An enigmatic feature of P2X7R is that upon prolonged stimulation, it displays the characteristics of a reversible plasma membrane pore permeable to hydrophilic moieties of up to 900 Da (Surprenant et al., 1996), including DNA-binding dyes (Smart et al., 2003; Locovei et al., 2007). In an exogenous setting, with sustained agonist stimulation, pore function leads to excessive Ca2+ influx, depletion of intracellular ions and metabolites, and, ultimately, cell death. This has driven dogma that pore formation is cytolytic, with description of P2X7R as a “death” receptor (Hogquist et al., 1991; Surprenant et al., 1996; Di Virgilio et al., 1998; Le Feuvre et al., 2002). However, the physiological significance of this “highly stimulated” state of P2X7R is unclear. Two documented findings support the link between microglial activation and P2X7R expression level. First, neuroinflammatory settings such as Alzheimer's disease, Parkinson's disease, and multiple sclerosis display enhanced levels of microglial activation (Benveniste, 1997; McGeer and McGeer, 1998; Streit et al., 2004; McLarnon et al., 2006). Second, these conditions may also exhibit intense P2X7R expression in the neuroinflammatory foci (Collo et al., 1997; Parvathenani et al., 2003; McLarnon et al., 2006). Whether increased P2X7R numbers are driving microglial activation or, conversely, microglial activation results in enhanced P2X7R expression is not known.
To investigate links between P2X7R expression and microglial activation, we modeled these pathological states and expressed exogenous P2X7R in primary hippocampal cultures. Changes in microglial activation and proliferation were then quantified. While microglia are present, and P2X7R is expressed, throughout the CNS (Deuchars et al., 2001; Armstrong et al., 2002; Lundy et al., 2002; Sperlágh et al., 2002; Atkinson et al., 2004; Wang et al., 2004; Yu et al., 2008), we focused on the hippocampus because it is one of the first brain regions to be affected in neuroinflammatory conditions (Kaye et al., 1997; Haroutunian et al., 1998; Frisoni et al., 1999; Haroutunian et al., 1999; Juottonen et al., 1999). We report that overexpression of P2X7R alone is sufficient to drive both microglial activation and proliferation. These responses required stimulation of the receptor as they were significantly attenuated by prior incubation with the P2X7R-specific antagonist oxATP, which inhibits both pore and ion channel functions of P2X7R.
Studies of the physiological roles of ion channel and pore conductance states of P2X7R are confounded by lack of pharmacological agents able to selectively inhibit either conductance without undue side effects. However, a mutant of P2X7R (P2X7RG345Y), which exhibits normal ion channel function but ablated pore-forming capacity, has enabled us to determine the relative importance of ion channel and pore conductance. When P2X7RG345Y was expressed, the enhanced activation and proliferation of microglia initiated by exogenous P2X7R were not evident. Our data identify a novel trophic role for P2X7R pore in microglia.
Materials and Methods
DNA constructs and site-directed mutagenesis.
Three DNA constructs used in this study for transfection of primary hippocampal neuron–glia mixed cultures and microglia-enriched cultures were untagged enhanced green fluorescent protein (EGFP) and two EGFP fusion constructs, P2X7R-EGFP, in which the wild-type rat P2X7R (accession number: X95882) was fused to N terminus of EGFP, and P2X7RG345Y-EGFP, in which a point mutant of P2X7R was fused to N terminus of EGFP. This mutant, P2X7RG345Y-EGFP, was produced by targeting the glycine at position 345 in the rat P2X7R for substitution with tyrosine using a QuikChange Site-Directed Mutagenesis Kit (Stratagene) with the following primers: forward: 5′-C ACC CTG TCC TAT TTC TAT TTG GCC ACC GTG TG; reverse: 5′-CA CAC GGT GGC CAA ATA GAA ATA GGA CAG GGT G. Base changes introducing the G 345 to T mutation are in bold type and underlined. Expression for all constructs was driven by the CMV promoter.
Primary hippocampal neuron–glia mixed cultures.
Protocols for handling animals were reviewed and approved by the Animal Ethics Committee at The University of Melbourne, Australia. Primary hippocampal neuron–glia mixed cultures were prepared from postnatal day 2 (P2)–P5 Sprague Dawley rats as described previously (Reid et al., 1997). Briefly, the animals were anesthetized by halothane inhalation, the brains were removed, and the hippocampi were dissected out and finely chopped. The hippocampal pieces were placed in an enzyme solution containing papain (200 U; Sigma Aldrich) for 35 min at 37°C. The hippocampal tissue was washed three times to remove all traces of papain, and the mixture was triturated to obtain a single-cell suspension. The cells were plated into 12-well plates containing 18 mm poly-d-lysine (Sigma-Aldrich)-coated coverslips (SDR Clinical Technology) at a density of 1.8 × 10⁵ cells/well. Cultures were maintained in minimum essential medium (Invitrogen) with the following supplements: 1 mm glucose, penicillin–streptomycin (5000 U/ml), 10% heat-inactivated fetal bovine serum (Invitrogen), MITO+ Serum Extender (Becton Dickinson), and 2 mm l-glutamine (Invitrogen). Cells were cultured at 37°C in a humidified incubator of 5% CO2/95% O2. Untransfected cultures contained ∼48% astrocytes and ∼50% microglia as assessed by immunohistochemistry using antibodies against glial fibrillary acidic protein (GFAP) and isolectin GS-IB4, respectively.
Microglia-enriched cultures.
After 14 d, flasks of mixed neuron–glia cultures were shaken at 150 rpm for 2 h at 37°C, to dislodge microglia loosely attached to underlying astrocytes. The medium containing microglia was then aspirated and centrifuged at 1000 rpm for 5 min. The pellet of microglia was resuspended in supplemented culture medium and placed in 12-well plates containing poly-d-lysine-coated coverslips. There were 3.1 × 10⁴ microglia/coverslip at the time of transfection. Purity was assessed by labeling with the microglial maker, isolectin GS-IB4, which identified 92% of cells as microglia.
Transfection.
The exogenous plasmid DNA constructs, EGFP, P2X7R-EGFP, or P2X7RG345Y-EGFP, were individually introduced into cultured cells using a modified calcium phosphate transfection technique (Jiang et al., 2004), with the aid of a CalPhos mammalian transfection kit (Becton Dickinson Biosciences) according to the manufacturer's protocols. The DNA concentration used was 2 μg/well of a 12-well culture plate (1.8 × 10⁵ cells/well). At 72 h after transfection the expression of the exogenous constructs was monitored with a Zeiss LSM 510-Meta multiphoton/confocal microscope. The 72 h time point was chosen as it allowed sufficient time for folding, trafficking, and downstream effects of exogenous P2X7R to become evident.
Immunohistochemistry.
At 72 h after transfection, neuron–glia mixed cultures or microglia-enriched cultures were fixed for 15 min in a solution of acetone and methanol (1:1), at −20°C. After fixation, the cells were washed once with PBS, and nonspecific protein binding sites were blocked with 2% bovine serum albumin (Sigma-Aldrich) for 45 min at 37°C. The following primary antibodies were used: mouse anti GFP (final dilution: 1:200; Invitrogen), rabbit anti-GFAP primary antibody (final dilution: 1:400; a kind gift from Associate Professor Jennifer Berka (Department of Immunology, Monash University, Melbourne, Australia), isolectin GS-IB4 from Griffonia simplicifolia, Alexa Fluor 594 conjugate (final dilution: 1:100; Invitrogen), and ED-1 (CD68; final dilution: 1:200; Srotec), a kind gift from Dr. Yona Goldschmidt (Medicine, Dentistry, and Health Sciences, The University of Melbourne, Australia). Primary antibodies were made up in PBS, with 1% Triton X-100 for permeabilization, and were incubated overnight at 4°C. After three 5 min washes in PBS, the sections were incubated with the relevant secondary antibodies: Alexa Fluor 488 (final dilution: 1:200; Invitrogen) or Texas Red X (final dilution: 1:200; Invitrogen). All secondary antibodies were incubated overnight at 4°C. After three 5 min washes in PBS, the samples were mounted with DAKO Fluorescent Mounting Medium. No staining was detected in the absence of primary or secondary antibodies. Some preparations were counter labeled with DAPI nuclear stain (5 μm; Invitrogen).
Confocal microscopy.
Seventy-two hours after transfection, primary mixed (or enriched) cultures were viewed with a Zeiss LSM 510 META multiphoton/confocal microscope equipped with 488 nm argon, 543 and 633 nm green and red helium/neon, and 800 nm Chameleon lasers. Images were acquired with a 40× IR-Achromat (NA 0.80) water-immersion objective. For most experiments samples were simultaneously stained with two or three fluorescent probes, with dual or triple emission achieved through appropriately selected emission filters, or by defining emission ranges following prior acquisition of lambda emission profiles for each probe individually. Images were analyzed using MetaMorph (Universal Imaging Corporation) software for assessment of proliferation. All comparisons of cell numbers were made in randomly selected imaging fields (230 μm × 230 μm; n = number of fields) with data presented as the mean ± SEM cells per field. For live cell imaging, the cells were bathed in HEPES buffer (in mm: NaCl 135, KCl 5, HEPES 10, glucose 10, CaCl2 1, and MgCl2, pH 7.4) at room temperature (∼25°C).
Assessment of microglial activation.
Microglial activation was assessed using morphological and immunohistochemical criteria. Before analysis of activation, microglia were classified into two groups. Cells with an oval cell body containing a small volume of cytoplasm and long, thin, delicate, and radially branched processes were classified as ramified microglia (Soltys et al., 2001). Activated microglia were defined as having an enlarged soma (width greater or equal to 30 μm) (Dalmau et al., 1998; Rogove et al., 2002), and a broad-flattened appearance with common presence of several lamellipodia (Ayoub and Salm, 2003). This morphological classification was confirmed immunohistochemically by use of microglial-specific markers isolectin GS-IB4 and CD68. For assessment of microglial activation in real time, the “Timeseries” component of the Zeiss LSM software was used to monitor process retraction (and hence activation) upon application of the P2X7R-specific agonist 2′3′-O-(4-benzoylbenzoyl)-ATP (BzATP; 100 μm) to microglia expressing the exogenous constructs. Where indicated, some cells were also pretreated with the P2X7R antagonist oxATP (Murgia et al., 1993).
Assessment of microglial proliferation.
We used isolectin GS-IB4 as previously described (Mander and Brown, 2005), to quantify microglial proliferation. Transfected cells were identified with anti-GFP and secondary Alexa Fluor 488 antibodies. Microglia were selectively identified with isolectin GS-IB4 staining, and all nuclei were stained with DAPI (Invitrogen). Images were analyzed using MetaMorph (Universal Imaging Corporation) software for assessment of proliferation. In addition, we quantified the incidence of nuclear splitting in P2X7R-EGFP and P2X7RG345Y-EGFP-expressing activated microglia as an index of proliferation.
Lactate dehydrogenase cytotoxicity assay.
The supernatants from cultures expressing P2X7R-EGFP, P2X7RG345Y-EGFP, and EGFP were assayed for cell damage or cell lysis using lactate dehydrogenase (LDH) cytotoxicity assay (Cayman Chemical) according to the manufacturer's protocols. No differences in LDH release were noted in the supernatants of cultures expressing the above constructs (n = 12, p > 0.05, one-way ANOVA) (supplemental Fig. 1, available at www.jneurosci.org as supplemental material).
P2X7R channel function.
The channel properties of P2X7R were determined by measuring Ca2+ influx with the synthetic Ca2+ indicator fluo-4 (Invitrogen) as previously described (Parvathenani et al., 2003). Briefly, neuron–glia mixed cultures expressing P2X7R-EGFP or P2X7RG345Y-EGFP bathed in HEPES buffer were viewed with a Zeiss LSM 510 META multiphoton/confocal microscope. A field of microglia expressing the exogenous construct was selected, and control images were taken to locate transfected cells. The cells were loaded with 1 μm fluo-4 for 20 min, at room temperature. Fluorescence intensities of fluo-4-loaded cells were sampled every 15 s for 10–15 min, using “Timeseries' software macros. Agonists including ATP (1 mm) or BzATP (100 μm) were applied ∼2 min after commencement of data collection. Background corrected fluo-4 fluorescence intensity values (F) were determined for defined regions of interest and converted to relative fluorescence intensities (F − F0/F0), where F0 represents the average initial (preagonist) fluorescence level. P2X7R is reported to show two conductance states, a rapid current associated with channel activity and a delayed current associated with pore opening (Khakh and Lester, 1999). Hence, for this study, the initial peak in Ca2+ response observed within ∼10 min was recorded as a measure of channel function, with the data from multiple experiments combined and statistically analyzed to give an index of channel activity.
TNF-α ELISA.
The amount of TNF-α produced in microglia-enriched cultures expressing P2X7R-EGFP or P2X7RG345Y-EGFP or not transfected with any exogenous construct was quantified with the aid of a Quantikine TNF-α ELISA kit (R&D Systems), as previously described (Le et al., 2001).
P2X7 pore assay.
Agonist (BzATP or ATP)-induced P2X7R pore formation was examined in neuron–glia mixed cultures transfected with P2X7R-EGFP or P2X7RG345Y-EGFP by measuring the cellular uptake of ethidium+ with confocal imaging. We also measured the degree of pore formation inherent in the culture environment in the absence of any pharmacological interference (designated as a pore “snap-shot” experiment). At 72 h after transfection, mixed cultures transfected with P2X7R-EGFP or P2X7RG345Y-EGFP or left untransfected were exposed to 12.5 μm ethidium+ for 30 min. The cultures were then immediately fixed and mounted for confocal imaging to assess the presence of pores by measuring ethidium+ intensity of cell nuclei.
Induction of neuroinflammation independent of P2X7R transfection.
To induce neuroinflammation independent of P2X7R transfection, 7-d-old untransfected mixed cultures were exposed to LPS (200 ng/ml) for 24 h. Thereafter the cells were exposed to the nuclear dye YOPRO1 (Invitrogen; 1 μg/ml) for 30 min, and after immediate fixation (acetone:methanol, 1:1) the cultures were stained for microglia using isolectin GS-IB4. To provide a measure of P2X7R pore activity, YOPRO1 nuclear intensity was assessed with a confocal microscope. Where indicated the cultures were treated with oxATP (250 μm, 3 h) before staining with YOPRO1.
Results
Morphological characterization of glia expressing P2X7R-EGFP
Glia from mixed (neurons and glia) cultures expressing P2X7R-enhanced green fluorescent protein (EGFP) (Fig. 1A–C) had distinctly different morphology from those expressing EGFP alone (Fig. 1D). Cells expressing P2X7R-EGFP were large (diameters >30 μm) with large distinct nuclei, and exhibited fluorescent “hotspots” from which emanated multiple lamellipodia (Fig. 1B). The majority of these cells aggregated in discrete “islands” (Fig. 1C) containing many fluorescently labeled cells and lacked other primary processes. Based on these morphological characteristics, P2X7R-EGFP-expressing glia were visually identical to activated microglia (Dalmau et al., 1998; Rogove et al., 2002; Ayoub and Salm, 2003). In contrast, the majority of glia expressing EGFP alone had an inactivated (ramified) morphology with smaller cell bodies (diameter: ∼10 μm) and 6–7 primary processes (Fig. 1D, inset). The nucleus occupied the majority of the relatively small cytoplasmic volumes of these ramified cells. The same morphological distinctions were evident in the bulk of transfected cells from microglia-enriched cultures (Fig. 1E,F). To confirm that P2X7R-EGFP-expressing cells were microglia, we corroborated the morphological findings with immunohistochemical identification.
Figure 1.

Comparative morphology of glia expressing P2X7R-EGFP and EGFP. A, B, Individual glia from hippocampal neuronal–glia mixed cultures expressing P2X7R-EGFP. Cells have the characteristic morphology of activated microglia, with large soma and lamellipodia (arrowheads). Arrow on image B highlights P2X7R-EGFP hotspots from which lamellipodia appear to originate. C, D, Representative fields of glia from hippocampal mixed cultures expressing P2X7R-EGFP (C) or EGFP (D). P2X7R-EGFP-expressing glia (C) often occurred in discrete “islands.” Inset in image D (scale bar, 10 μm) shows ramified morphology of microglia expressing EGFP. E, Individual microglia expressing P2X7R-EGFP in microglia-enriched culture displayed similar morphology to glia from the neuronal–glia mixed cultures. Arrow highlights lamellipodia. F, Microglia expressing EGFP (enriched culture) displayed ramified morphology with 6–7 primary processes and small cell body. Images are representative of at least 20 fields, each from separate experiments. Scale bars, 20 μm.
Immunohistochemical characterization of glia expressing P2X7R-EGFP
The majority of glia expressing P2X7R-EGFP in mixed cultures, and morphologically characterized to be activated, were GFAP negative (Fig. 2A,C) (94%; n = 176) and isolectin GS-IB4 positive (Fig. 2B,C) (90%; n = 192, χ2 test, p < 0.001), confirming that these cells were microglia. Colocalization with ED-1 (CD68) (supplemental Fig. 2, available at www.jneurosci.org as supplemental material) further established that these microglia were activated (Graeber et al., 1990; Kingham et al., 1999).
Figure 2.

Imunohistochemical confirmation of morphological microglial identification. A, Fluorescence in glia expressing P2X7R-EGFP is not colocalized with that of astrocytes stained with astrocytic marker GFAP. Green, P2X7R-EGFP; red, GFAP. B, P2X7R-EGFP fluorescence colocalizes with that of the microglial marker isolectin GS-IB4. Green, P2X7R-EGFP; red, isolectin GS-IB4. Scale bars, 20 μm. C, The majority of glia expressing P2X7R-EGFP in mixed cultures, and morphologically characterized to be activated, were isolectin GS-IB4 positive (90%; n = 192) and GFAP negative (94%; n = 176; χ2 test, p < 0.001). D, P2X7R overexpression in primary hippocampal cultures drives microglial activation. There was a significantly larger number of activated microglia in mixed cultures transfected with P2X7R-EGFP than with EGFP alone. Cell numbers were determined from 291 and 249 randomly selected fields (x, y dimensions: 230 × 230 μm), respectively, from at least five independent experiments, 72 h post-transfection. Data are mean ± SEM. ***p < 0.001 (Student's t test).
P2X7R overexpression drives microglial activation
We quantified activated microglia in mixed cultures and found a higher average number in cultures expressing P2X7R-EGFP (1.45 ± 0.17/randomly selected 230 × 230 μm imaging field, n = 291 fields) than those expressing EGFP alone (0.31 ± 0.05/imaging field, n = 249; p < 0.001, Student's t test) (Fig. 2D). Data are mean ± SEM from at least five independent experiments, 72 h after transfection. Hence, these data suggested that the phenotypic transformation that accompanies activation of microglia can be attributed to overexpression of P2X7R in these cells.
P2X7R-driven morphological transformation of microglia is oxATP sensitive
To assess whether phenotypic transformation of microglia required stimulation of P2X7Rs, we pharmacologically blocked both endogenous and exogenous P2X7Rs with oxATP, a specific and irreversible antagonist of P2X7R (Murgia et al., 1993). Twenty-one hours after transfection (allowing time for expression, folding, and trafficking of exogenous P2X7Rs), mixed cultures were treated with oxATP (250 μm) for 3 h and then imaged 72 h after transfection. A total of 100 and 99 randomly selected fields (from multiple experiments), with and without oxATP pretreatment, respectively, were examined and the number of activated microglia quantified. The number of P2X7R-EGFP-expressing activated microglia was reduced in cultures treated with oxATP (0.38 ± 0.08 vs 0.86 ± 0.14 cells/imaging field; p < 0.01 Student's t test) (Fig. 3A). This indicated that receptor stimulation (agonist binding and receptor function) is essential for microglial activation.
Figure 3.
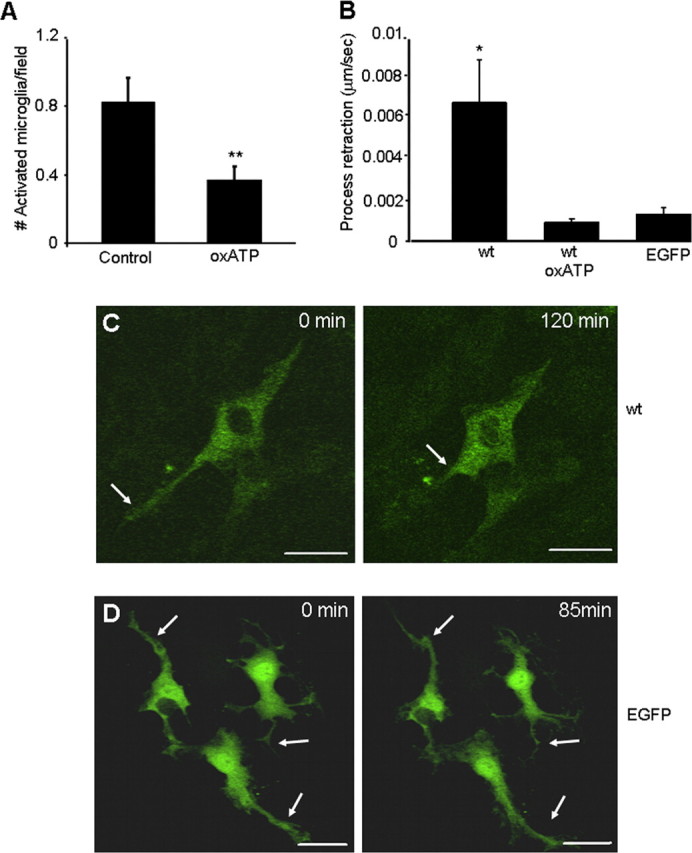
Microglial activation was attenuated with oxATP. A, The number of P2X7R-EGFP-expressing activated microglia was reduced at 72 h post-transfection in mixed cultures treated with oxATP (250 μm, 3 h) at 21 h post-transfection. A total of 100 and 99 randomly selected fields (from multiple experiments), with and without oxATP pretreatment, respectively, were examined and the number of activated microglia was quantified. Data are mean ± SEM. **p < 0.01 (Student's t test). B, Process retraction and microglial activation viewed dynamically with time-lapse microscopy. After BzATP stimulation, process retraction was significantly faster (μm/s) for microglia expressing the wild-type (wt) construct P2X7R-EGFP (n = 5) than for those expressing the wt construct but pretreated with oxATP (n = 5) or expressing EGFP alone (n = 6). C, Images show a P2X7R-EGFP-expressing microglia (enriched culture) 72 h post-transfection. Application of 100 μm BzATP caused the cell to retract its primary process (arrow), assuming a more activated phenotype. D, EGFP-expressing microglia (enriched culture) 72 h post-transfection. Application of 100 μm BzATP caused few morphological changes (arrows). Each panel is representative of at least five independent experiments. Time from the onset of experiment is indicated on the top right corner of each image. Scale bar, 20 μm.
Treatment of mixed cultures expressing P2X7R-EGFP with the P2X7R-specific agonist BzATP (100 μm) resulted in the dynamic retraction of microglial primary processes within 2 h of stimulation (Fig. 3B,C). Process retraction was inhibited when cultures were acutely treated with a higher acute dose of oxATP (500 μm) for 3 h immediately before BzATP stimulation (Fig. 3B). Process retraction was not evident in microglia expressing EGFP alone (Fig. 3B,D), even though ramified processes of these cells were continually motile.
While it is clear that P2X7R stimulation is required to drive microglial activation, this receptor is known to exhibit two different conductance states, a cation channel and a nonselective plasma membrane pore. As oxATP blocks the nucleotide binding site, it does not allow us to distinguish the relative importance for microglial activation of these functionally distinct states. There are no known pharmacological agents that specifically antagonize or block either P2X7R channel or P2X7R pore activity without affecting numerous other cellular processes. However, we have taken advantage of a unique P2X7R point mutant, P2X7RG345Y (glycine 345 substituted for tyrosine), with unaltered channel function but ablated pore-forming capacity, which enables this distinction.
Characteristics of P2X7RG345Y: a mutant with unaltered expression and distribution pattern
Cells expressing P2X7RG345Y-EGFP exhibited a similar intracellular receptor distribution pattern to that of the wild-type construct, P2X7R-EGFP, confirming normal folding and trafficking of mutant receptor. Interestingly, microglia expressing mutant receptor had an elongated (nonactivated) morphology (Fig. 4A), distinctly different from the activated morphology seen in cells expressing wild-type receptor.
Figure 4.
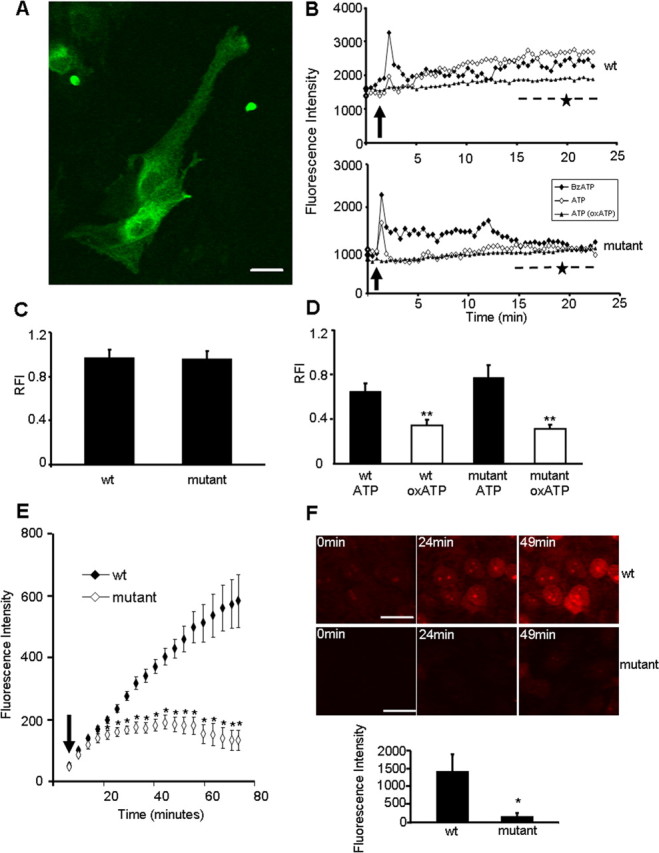
P2X7RG345-EGFP, a receptor with unaltered channel, but abolished pore function. A, Microglia from mixed cultures expressing P2X7RG345Y-EGFP had a nonactivated morphology. Scale bar, 20 μm. B, Representative graphs showing Ca2+ channel characteristics of P2X7R-EGFP (wt; top) and P2X7RG345Y-EGFP (mutant; bottom). Microglia expressing the exogenous constructs were loaded with fluo-4 and treated with either BzATP (100 μm) or ATP (1 mm), with or without pretreatment with oxATP (500 μm, 3 h before experiment). Ca2+ signals were sampled every 15 s for 25 min. Data are absolute fluorescence intensity as a function of time (in minutes). Arrows indicate time of application of 1 mm ATP or 100 μm BzATP. Stars (--★--) indicate the nominal region of pore conductance (see Materials and Methods) evident for the wt construct but absent for response of mutant P2X7R. C, Collated RFI data following BzATP (100 μm) application in multiple experiments for wild-type (wt) (n = 76) and mutant (n = 42) expressing microglia. Data are represented as mean ± SEM (p > 0.05, no significant difference; Student's t test). D, Collated RFI data, comparing the channel property of wt (n = 17) and mutant (n = 13) receptors following ATP (1 mm) application (p > 0.05, no significant difference; Student's t test). The ATP-induced Ca2+ channel response of both mutant (n = 11) and wt (n = 11) was significantly reduced (**p < 0.01, Student's t test) when cells were pretreated with oxATP (500 μm, 3 h before experiment). Data are mean ± SEM. E, An assay for pore formation using ethidium+ uptake into activated microglia expressing the wild-type receptor, P2X7R-EGFP (n = 5 cells), or the mutant receptor, P2X7RG345Y-EGFP (n = 7 cells). The increase in ethidium+ fluorescence intensity was measured for 80 min after application of 12.5 μm ethidium+ bromide and 100 μm BzATP simultaneously (arrow indicates time of application). F, Representative images of nuclear ethidium+ incorporation by microglia expressing P2X7R-EGFP (wt; top) or P2X7RG345Y-EGFP (mutant; bottom) after application of 25 μm ethidium+ bromide and 1 mm ATP. Graph shows collated data (n = 3) of nuclear ethidium+ intensity after exposure (49 min) to 25 μm ethidium bromide and 1 mm ATP. Data are mean ± SEM, *p <0.05, Student's t test.
Characteristics of P2X7RG345Y: a mutant with unaltered Ca2+ channel function
The channel characteristics of wild-type and mutant receptors were compared in mixed cultures with a Ca2+ indicator, fluo-4 (Fig. 4B–D). Upon application of BzATP (100 μm) or ATP (1 mm), glia expressing the wild-type exogenous receptor exhibited a sharp, transient rise in intracellular Ca2+ lasting ∼4 min (Fig. 4B) with a secondary component (indicated by --★--) after ∼15 min, consistent with the time course of appearance of pore activity (Fig. 4E). This pore conductance is not evident for the mutant receptor (Fig. 4B, bottom; --★--). However, the channel characteristics of mutant receptors in response to BzATP (100 μm) and ATP (1 mm) were similar to those of wild-type P2X7R (Fig. 4B–D). All Ca2+ changes elicited upon ATP (1 mm) application were abolished when cells (wild type or mutant) were acutely pretreated with 500 μm oxATP for 3 h (Fig. 4B,D). Collated relative fluorescence intensity (RFI) data in response to BzATP (100 μm) application in multiple experiments for wild-type (n = 76)- and mutant (n = 42)-expressing microglia also showed no differences in channel function (p > 0.05; Student's t test) (Fig. 4C). Similar responses were obtained in response to ATP stimulation (Fig. 4D), illustrating that the channel responses are clearly indistinguishable. The results clearly demonstrate that the G345Y mutation does not alter channel function of the receptor.
Characteristics of P2X7RG345Y: mutant receptor does not form pores
Pore-forming capacity of wild-type and mutant receptors was compared by assessing the uptake of ethidium+ in identified microglia (from mixed cultures).The responses of the wild type and mutant to BzATP application (100 μm) (Fig. 4E) are markedly (and statistically significantly) different at all time points after ∼15 min, consistent with the time of onset of the P2X7R pore activity in wild-type but not mutant cells (i.e., see second phase of the responses of cells in Fig. 4B above). Similarly, ATP (1 mm with 25 μm ethidium+) (Fig. 4F) caused significantly higher levels of ethidium+ incorporation in microglia expressing the wild-type receptor (n = 3) than the mutant receptor (n = 3), where ethidium+ intensity remained at baseline levels over the course of the experiments (1433 ± 422 nuclear ethidium+ intensity vs 172 ± 80, p < 0.05, Student's t test). Our results revealed that the P2X7RG345Y-EGFP is incapable of forming pores in microglia in the culture environment.
Importantly, there were no differences (p > 0.05, one-way ANOVA) between the levels of cytolysis (determined by LDH release; supplemental Fig. 1, available at www.jneurosci.org as supplemental material) of microglia transfected with any of the constructs, indicating that pore activity is not active in a “cell killing” mode.
Microglial activation is reduced in cultures expressing the mutant receptor
Expression of wild-type receptor caused significantly more microglial activation [per imaging field; 230 μm × 230 μm; 1.45 ± 0.17/field, n = 291 fields; p < 0.01, one way ANOVA, followed by Tukey's honestly significant difference (HSD) post hoc test] than the mutant receptor (0.51 ± 0.11 activated microglia/field; n = 221), which was indistinguishable from EGFP expression alone (0.51 ± 0.11 vs 0.31 ± 0.05, respectively, n = 249; p > 0.05). Therefore, subsequent experiments focused only on comparisons between the wild-type and mutant receptors. In addition, due to lack of pharmacological agents that could specifically distinguish between P2X7R channel and P2X7R pore, most of our subsequent studies were focused on transfected cultures where we could specifically express the pore-forming or the non-pore-forming receptor to study their effects. We found that as a proportion of the total microglial pool (identified by isolectin GS-IB4 labeling), more activated microglia were evident in mixed cultures expressing wild-type (7.34 ± 1.02/field; n = 70 imaging fields from multiple experiments) than mutant receptor (2.43 ± 0.75/field, n = 70; p < 0.0001 Student's t test). Collectively, these results identify the activity of the pore as the critical functional component of P2X7R-driven microglial activation.
Microglial proliferation is reduced in cultures expressing the mutant receptor
We used several measures to quantify the cell proliferation that inevitably follows microglial activation. In mixed cultures a decrease in total cell number (51.71 ± 3.51 vs 64.11 ± 4.29/field, n = 70 imaging fields; p < 0.05, Student's t test), number of microglia (31.27 ± 1.48 vs 41.37 ± 2.26/field, n = 70; p < 0.001, Student's t test), percentage of cells expressing exogenous construct (4.33 ± 1.02 vs 12.05 ± 1.44/field, n = 70; p < 0.0001, Student's t test) and percentage of microglia expressing exogenous construct (2.94 ± 0.78 vs 9.29 ± 1.19/field, n = 70; p < 0.0001, Student's t test) was evident following transfection with mutant receptor compared with wild-type receptor. Counts of fluorescent cells within 24 h of transfection indicate no difference in the calcium phosphate transfection efficiency of the two almost identical constructs (P2X7R-EGFP and P2X7RG345Y-EGFP; 7.9 kb). As such, subsequent differences in cell number are almost certain to reflect differences in cell proliferation following activation. This was verified by our observation of a lower prevalence of nuclear splitting in microglia expressing mutant (0.03 ± 0.01/field, n = 220 randomly selected imaging fields) than wild-type receptor (0.14 ± 0.04/field, n = 220; p < 0.01, Student's t test). Time-lapse microscopy confirmed that nuclear fission rather than nuclear fusion processes were responsible for this phenomenon (supplemental Fig. 3, available at www.jneurosci.org as supplemental material). This chronology supports the premise that once activated microglia migrate to sites of injury then undergo proliferation (Gehrmann et al., 1995). Hence, P2X7R pore activity is also critical in inducing subsequent microglial proliferation.
Pore activity is inherent in transfected microglia without exogenous pharmacological intervention
In the absence of exogenous application of purinergic agonists, activated microglia expressing wild-type exogenous P2X7R showed a higher level of ethidium+ incorporation in their nuclei (Fig. 5B) than those expressing mutant receptor or untransfected (Fig. 5A), indicating sufficient levels of purines exist in the culture environment to stimulate pore formation.
Figure 5.

Microglia expressing wild-type receptor release more TNF-α and show a larger degree of intrinsic pore capacity than microglia expressing mutant receptors. A, Microglia expressing P2X7R-EGFP (n = 99 cells examined from multiple experiments) and P2X7RG345Y-GFP (n = 95), at 72 h after transfection, or left untransfected (n = 71) were exposed to 12.5 μm ethidium bromide for 30 min, to get an indication of the degree of P2X7R pores inherent in the culture environment. Ethidium+ intensity in the nucleus of activated microglia was measured as an indicator pore capacity in these cells. Results are shown as mean ± SEM. ***p < 0.001 (one-way ANOVA followed by Tukey's HSD post hoc test). B, A representative fluorescent image of a field of glia expressing P2X7R-EGFP and stained with ethidium bromide. Ethidium+ intensity in the nucleus (arrowheads) was quantified with a confocal fluorescence microscope. Scale bar, 10 μm. C, An ELISA for TNF-α showing significantly higher levels of the proinflammatory cytokine release in microglia-enriched cultures expressing P2X7R-EGFP (n = 8 independent experiments, each being measured in duplicate) than in those expressing P2X7RG345Y-EGFP (n = 8) or left untransfected (n = 6). Results show mean ± SEM. *p < 0.05 (Student's t test).
Enhanced cytokine release is evident in microglia exhibiting pore function
Once activated, microglia are reported to release the proinflammatory cytokine TNF-α (Takeuchi et al., 2006). Increased levels of TNF-α release were evident in the supernatant from enriched microglial cultures expressing wild-type receptor (124 ± 28.2 ng/ml) compared with those expressing mutant receptor (35.3 ± 14.7 ng/ml) or left untransfected (30.5 ± 22.9 ng/ml) (Fig. 5C).
Enhanced P2X7R pore activity is evident in LPS-treated microglia, independent of P2X7R transfection
To demonstrate that P2X7R pore activity was increased in microglia as part of the endogenous activation processes, and not due to the transfection process per se, we activated microglia using an independent method that did not involve P2X7R transfection. When untransfected mixed cultures were treated with LPS, microglia showed greater incorporation of YOPRO1 dye in their nuclei compared with untreated controls (Fig. 6A,B). This enhanced pore activity was attenuated with oxATP pretreatment (Fig. 6B), indicating that the response was indeed P2X7R specific and involved only endogenous receptors.
Figure 6.

LPS-activated untransfected microglia show an enhanced level of P2X7R pore activity. A, LPS-stimulated untransfected microglia identified with isolectin GS IB4 (red) show nuclear incorporation of YOPRO1 (green). Scale bar, 10 μm. B, Untransfected microglia exposed to LPS (200 ng/ml, n = 69) showed an enhanced level of P2X7R pore activity as measured by YOPRO1 nuclear intensity, compared with cultures not treated with LPS (n = 65) or those treated with LPS (200 ng/ml) but subsequently exposed to oxATP (250 μm; n = 55) before YOPRO1 staining. Results are shown as mean ± SEM of YOPRO1 nuclear intensity. **p < 0.01 (one-way ANOVA followed by Tukey's HSD post hoc test).
Discussion
Activated microglia may contribute to the pathogenesis and progression of neuroinflammatory conditions including Alzheimer's disease and ischemic brain injury. This study examined the impact of introducing exogenous P2X7Rs into primary hippocampal glia. In the absence of exogenous proinflammatory stimuli, overexpression of P2X7R is sufficient to drive both microglial activation and subsequent proliferation. Pore, not channel, conductance was important in both responses, with microglial activation and proliferation significantly reduced when a non-pore-forming mutant, P2X7RG345Y, was used. Importantly, elevated pore activity did not increase cytolysis, further accentuating the trophic role of P2X7R pore in microglia. Our results highlight P2X7R as a “sensor of danger” possibly responding to the “danger signal” ATP, driving resting microglial cells into activated form. These results challenge the traditional cytolytic role attributed to P2X7R pore and provide novel evidence to the contrary, revealing a trophic role for P2X7R pore in microglia.
P2X7R overexpression is sufficient to drive microglial activation
P2X7R is upregulated in neuroinflammatory foci of Alzheimer's disease (Parvathenani et al., 2003; McLarnon et al., 2006) and cerebral ischemia (Collo et al., 1997), where activated microglia are characteristic, revealing a correlation between P2X7R expression and microglial activation. As such, overexpression is a useful model to evaluate the significance of the activity of P2X7R. Our quantification of activated microglia, and monitoring of activation with time-lapse microscopy, revealed significantly increased microglial activation following exogenous P2X7R expression. In contrast, expression of EGFP did not induce microglial activation, indicating that trophic responses were P2X7R specific and not due to culturing or transfection processes. These findings significantly enhance associative evidence (Choi et al., 2007) by showing causality between P2X7R expression and microglial activation. Our results indicate P2X7R is a mediator of trophism for microglia with potential downstream consequences such as release of bioactive substances. In agreement, others have reported that P2X7R-deficient mice have significantly attenuated inflammatory responses (Solle et al., 2001), while P2X7R stimulation has been linked to release of several proinflammatory substances following LPS injection of rat striatum (Choi et al., 2007).
ATP stimulation of P2X7R is required for microglial activation
When the P2X7R nucleotide binding site was blocked with oxATP, microglial activation was significantly attenuated, indicating that receptor occupancy is essential for activation cascades induced by P2X7R overexpression. Endogenous sources of ATP for receptor stimulation may be astrocytes, neurons, or microglia themselves. Mechanical or bradykinin stimulation causes astrocytes to release sufficient ATP to stimulate P2X7Rs on adjacent microglial cells (Verderio and Matteoli, 2001). Neurons possess ATP-containing vesicles (von Kügelgen et al., 1994), and organelle sediments from cultured astrocytes contain relatively high amounts of ATP (Maienschein et al., 1999). Additionally, microglial P2X7Rs may amplify ATP signals, as P2X7R stimulation can trigger release of ATP from microglia through autocrine processes (Pellegatti et al., 2005).
Since oxATP specifically blocks P2X7Rs, our results confirmed involvement of functional P2X7Rs in microglial activation. However, current pharmacological agents do not allow distinction between P2X7R channel and pore activities. oxATP inhibits both conductance states, while agents such as carbenoxolone, a gap junction (connexin hemichannel) blocker (Davidson et al., 1986; Spray et al., 2002) with antagonistic potential for P2X7R (Iglesias et al., 2008), has a myriad of confounding anti-inflammatory (Suzuki et al., 2004a; Cherian et al., 2005; Rana and Dringen, 2007; Véliz et al., 2008; Yawata et al., 2008) and nonselective actions (Rana and Dringen, 2007; Yawata et al., 2008). To distinguish whether P2X7R channel or pore was predominantly responsible for driving microglial activation and proliferation, we used a P2X7R point mutant, P2X7RG345Y.
P2X7RG345Y-EGFP: a valuable tool for separating ion channel and pore function
Our previous work revealed P2X7RG345Y as a suitable candidate for functional distinction between the two conductance states of P2X7R. This point mutation in the receptor selectivity filter does not alter folding, trafficking, or ion channel conductance of the receptor, but abolishes pore conductance. The mechanism of P2X7R channel-to-pore transition is currently unknown with both intramolecular and intermolecular models documented. Intermolecular models argue that pore formation occurs by successive acquisition of subunits to existing oligomeric structures (Cockcroft and Gomperts, 1979). While recent studies suggest that pannexin1 is required for P2X7R pore formation (Locovei et al., 2007), there are also reports that injection of P2X7R mRNA alone is sufficient to allow generation of pores in oocytes (Paukert et al., 2002). Intramolecular models propose that subtle structural changes, possibly in the selectivity filter, contribute to channel–pore transition (Lester and Karschin, 2000). Our results support the latter. The glycine-to-tyrosine substitution at position 345 of P2X7R may alter electrostatic interactions in the selectivity filter governing transition of P2X7R channel to pore. Regardless of exact molecular details, our results reveal that the G345Y mutant can be used to identify the conductance responsible for P2X7R induction of microglial activation and proliferation.
Pore formation is responsible for driving both microglial activation and subsequent proliferation
Microglia expressing P2X7RG345Y showed no evidence of induced activation or proliferation. Although some trophic responses are attributed to P2X7R channels, the overall presumption in literature is that P2X7R pore formation leads to cell death. However, no difference in cytolysis was found between cells expressing wild-type, mutant, and EGFP constructs. Our results highlight a predominantly trophic role for P2X7R but with the key functional mediator of the mitogenic effect being pore rather than channel activity. While this is in marked contrast to current dogma, the ability of P2X7R pore to induce cell death in endogenous settings has not been firmly established. This capacity is usually evident in exogenous settings with continued stimulation and ultimate collapse of homeostatic mechanisms.
If pore activity is instead a physiologically relevant trophic event for microglia, then enhanced levels of intrinsic pore function would be expected in microglia expressing the wild-type but not the mutant receptor. This was confirmed by observations that activated microglia, expressing P2X7R-EGFP, in normal culture conditions (i.e., no exogenous agonists) showed enhanced ethidium+ uptake. Enhanced pore activity could lead to activation of numerous intracellular signaling cascades (e.g., p38 MAP kinase, NFκB (Choi et al., 2007) controlling trophic behaviors such as activation and proliferation. Further work is needed to elucidate the most important intracellular cascades.
The morphological changes in microglia are accompanied by biochemical markers of activation
The morphological transformation of microglia following wild-type P2X7R overexpression was accompanied by biochemical responses, including release of TNF-α, commonly exhibited by microglia undergoing activation. In agreement, others have demonstrated that “loss-of-function” mutations in human P2X7R (e.g., E496A substitution) result in reduced cytokine release by human monocytes (Sluyter et al., 2004). TNF-α released from microglia is thought to act in autocrine manner promoting further microglial activation (Takeuchi et al., 2006). Thus, downstream extracellular signaling cascades, involving P2X7R pore, may act synergistically with intracellular cascade(s) to orchestrate the degree of microglial activation and proliferation. Of particular relevance was an examination of microglial primary cultures that found basal proliferation to be stimulated by proinflammatory cytokines interleukin-1β or TNF-α (Mander and Brown, 2005). We observed that microglia expressing P2X7R-EGFP frequently grew in large clusters of closely apposing cells, an observation rare with microglia expressing EGFP alone. These isolated cells may serve as focal sites undergoing enhanced proliferation, or sites of aggregation releasing chemoattractants causing cells to migrate and cluster. Our results provide evidence for both processes. The common occurrence of nuclear splitting (with subsequent cell division) supports the latter possibility, while the prevalence of lamellipodia in activated microglia is consistent with other studies reporting microglial migration in response to chemokines and cytokines (Cross and Woodroofe, 1999).
Enhanced P2X7R pore activity is evident in LPS-treated microglia, independent of P2X7R transfection
Untransfected microglia stimulated with LPS showed enhanced P2X7R pore activity, which was attenuated with oxATP treatment. LPS, as well as inducing microglial activation, causes time-dependent upregulation of P2X7R, maximally evident 12 h after LPS injection in rat striatum (Choi et al., 2007). Our results functionally extend these reports by showing specific increases in P2X7R pore activity in LPS-treated microglia. These data indicate that observed responses were both P2X7R specific and independent of transfection.
A model explaining our findings
Our data support a model in which ATP released by neurons, astrocytes, or microglia themselves relays information to ramified microglia, the surveillance cells of the CNS. Microglia sense this via their abundantly expressed P2X7Rs. Stimulation of P2X7R activates ramified microglia and concomitant proliferation. Once activated, and through mechanisms involving P2X7R pore, microglia release various proinflammatory substances (e.g., TNF-α), which, in autocrine manner, promote further microglial activation. In continued presence of ATP, with increasing proinflammatory cytokines (e.g., TNF-α) and other bioactive substances, a self-propagating cycle of neuroinflammation and neurodegeneration ensues. P2X7R acts as the sensory checkpoint, where downstream options are to halt inflammatory processes if the receptor is antagonized or to cause fulminant inflammation in the absence of counteractive homeostatic mechanisms.
This study leaves us with two crucial questions regarding the human condition: is the neuroinflammation observed in conditions such as Alzheimer's disease reduced if microglial activation is reduced? Is inhibition of P2X7R pore a therapeutic avenue for doing this? In vivo studies documenting the physiological significance of this P2X7R pore-induced microglial activation and proliferation on neurons are needed.
Footnotes
This work was supported by the Australian Research Council and Ian Potter Foundation (Australia). M.M. was supported by an Australian Postgraduate Award (APA scholarship) and a May Stewart Alzheimer's Award (University of Melbourne, Faculty of Medicine, Dentistry, and Health Sciences). We are grateful to Prof. Geoff Burnstock, Associate Professors Ann Turnley and Andrew Allen, and Dr. Yona Goldschmidt for helpful discussions.
References
- Armstrong JN, Brust TB, Lewis RG, MacVicar BA. Activation of presynaptic P2X7-like receptors depresses mossy fiber-CA3 synaptic transmission through p38 mitogen-activated protein kinase. J Neurosci. 2002;22:5938–5945. doi: 10.1523/JNEUROSCI.22-14-05938.2002. [DOI] [PMC free article] [PubMed] [Google Scholar]
- Atkinson L, Batten TF, Moores TS, Varoqui H, Erickson JD, Deuchars J. Differential co-localisation of the P2X7 receptor subunit with vesicular glutamate transporters VGLUT1 and VGLUT2 in rat CNS. Neuroscience. 2004;123:761–768. doi: 10.1016/j.neuroscience.2003.08.065. [DOI] [PubMed] [Google Scholar]
- Ayoub AE, Salm AK. Increased morphological diversity of microglia in the activated hypothalamic supraoptic nucleus. J Neurosci. 2003;23:7759–7766. doi: 10.1523/JNEUROSCI.23-21-07759.2003. [DOI] [PMC free article] [PubMed] [Google Scholar]
- Bal-Price A, Brown GC. Inflammatory neurodegeneration mediated by nitric oxide from activated glia-inhibiting neuronal respiration, causing glutamate release and excitotoxicity. J Neurosci. 2001;21:6480–6491. doi: 10.1523/JNEUROSCI.21-17-06480.2001. [DOI] [PMC free article] [PubMed] [Google Scholar]
- Banati RB, Gehrmann J, Schubert P, Kreutzberg GW. Cytotoxicity of microglia. Glia. 1993;7:111–118. doi: 10.1002/glia.440070117. [DOI] [PubMed] [Google Scholar]
- Benveniste EN. Role of macrophages/microglia in multiple sclerosis and experimental allergic encephalomyelitis. J Mol Med. 1997;75:165–173. doi: 10.1007/s001090050101. [DOI] [PubMed] [Google Scholar]
- Cherian PP, Siller-Jackson AJ, Gu S, Wang X, Bonewald LF, Sprague E, Jiang JX. Mechanical strain opens connexin 43 hemichannels in osteocytes: a novel mechanism for the release of prostaglandin. Mol Biol Cell. 2005;16:3100–3106. doi: 10.1091/mbc.E04-10-0912. [DOI] [PMC free article] [PubMed] [Google Scholar]
- Choi HB, Ryu JK, Kim SU, McLarnon JG. Modulation of the purinergic P2X7 receptor attenuates lipopolysaccharide-mediated microglial activation and neuronal damage in inflamed brain. J Neurosci. 2007;27:4957–4968. doi: 10.1523/JNEUROSCI.5417-06.2007. [DOI] [PMC free article] [PubMed] [Google Scholar]
- Cockcroft S, Gomperts BD. ATP induces nucleotide permeability in rat mast cells. Nature. 1979;279:541–542. doi: 10.1038/279541a0. [DOI] [PubMed] [Google Scholar]
- Collo G, Neidhart S, Kawashima E, Kosco-Vilbois M, North RA, Buell G. Tissue distribution of the P2X7 receptor. Neuropharmacology. 1997;36:1277–1283. doi: 10.1016/s0028-3908(97)00140-8. [DOI] [PubMed] [Google Scholar]
- Cross AK, Woodroofe MN. Chemokines induce migration and changes in actin polymerization in adult rat brain microglia and a human fetal microglial cell line in vitro. J Neurosci Res. 1999;55:17–23. doi: 10.1002/(SICI)1097-4547(19990101)55:1<17::AID-JNR3>3.0.CO;2-J. [DOI] [PubMed] [Google Scholar]
- Dalmau I, Finsen B, Zimmer J, González B, Castellano B. Development of microglia in the postnatal rat hippocampus. Hippocampus. 1998;8:458–474. doi: 10.1002/(SICI)1098-1063(1998)8:5<458::AID-HIPO6>3.0.CO;2-N. [DOI] [PubMed] [Google Scholar]
- Davidson JS, Baumgarten IM, Harley EH. Reversible inhibition of intercellular junctional communication by glycyrrhetinic acid. Biochem Biophys Res Commun. 1986;134:29–36. doi: 10.1016/0006-291x(86)90522-x. [DOI] [PubMed] [Google Scholar]
- Deuchars SA, Atkinson L, Brooke RE, Musa H, Milligan CJ, Batten TF, Buckley NJ, Parson SH, Deuchars J. Neuronal P2X7 receptors are targeted to presynaptic terminals in the central and peripheral nervous systems. J Neurosci. 2001;21:7143–7152. doi: 10.1523/JNEUROSCI.21-18-07143.2001. [DOI] [PMC free article] [PubMed] [Google Scholar]
- Di Virgilio F, Chiozzi P, Falzoni S, Ferrari D, Sanz JM, Venketaraman V, Baricordi OR. Cytolytic P2X purinoceptors. Cell Death Differ. 1998;5:191–199. doi: 10.1038/sj.cdd.4400341. [DOI] [PubMed] [Google Scholar]
- Ferrari D, Chiozzi P, Falzoni S, Hanau S, Di Virgilio F. Purinergic modulation of interleukin-1 beta release from microglial cells stimulated with bacterial endotoxin. J Exp Med. 1997;185:579–582. doi: 10.1084/jem.185.3.579. [DOI] [PMC free article] [PubMed] [Google Scholar]
- Frisoni GB, Laakso MP, Beltramello A, Geroldi C, Bianchetti A, Soininen H, Trabucchi M. Hippocampal and entorhinal cortex atrophy in frontotemporal dementia and Alzheimer's disease. Neurology. 1999;52:91–100. doi: 10.1212/wnl.52.1.91. [DOI] [PubMed] [Google Scholar]
- Gehrmann J, Matsumoto Y, Kreutzberg GW. Microglia: intrinsic immuneffector cell of the brain. Brain Res Brain Res Rev. 1995;20:269–287. doi: 10.1016/0165-0173(94)00015-h. [DOI] [PubMed] [Google Scholar]
- Graeber MB, Streit WJ, Kiefer R, Schoen SW, Kreutzberg GW. New expression of myelomonocytic antigens by microglia and perivascular cells following lethal motor neuron injury. J Neuroimmunol. 1990;27:121–132. doi: 10.1016/0165-5728(90)90061-q. [DOI] [PubMed] [Google Scholar]
- Haroutunian V, Perl DP, Purohit DP, Marin D, Khan K, Lantz M, Davis KL, Mohs RC. Regional distribution of neuritic plaques in the nondemented elderly and subjects with very mild Alzheimer disease. Arch Neurol. 1998;55:1185–1191. doi: 10.1001/archneur.55.9.1185. [DOI] [PubMed] [Google Scholar]
- Haroutunian V, Purohit DP, Perl DP, Marin D, Khan K, Lantz M, Davis KL, Mohs RC. Neurofibrillary tangles in nondemented elderly subjects and mild Alzheimer disease. Arch Neurol. 1999;56:713–718. doi: 10.1001/archneur.56.6.713. [DOI] [PubMed] [Google Scholar]
- Hogquist KA, Nett MA, Unanue ER, Chaplin DD. Interleukin 1 is processed and released during apoptosis. Proc Natl Acad Sci U S A. 1991;88:8485–8489. doi: 10.1073/pnas.88.19.8485. [DOI] [PMC free article] [PubMed] [Google Scholar]
- Iglesias R, Locovei S, Roque A, Alberto AP, Dahl G, Spray DC, Scemes E. P2X7 receptor-Pannexin1 complex: pharmacology and signaling. Am J Physiol Cell Physiol. 2008;295:C752–760. doi: 10.1152/ajpcell.00228.2008. [DOI] [PMC free article] [PubMed] [Google Scholar]
- Jiang M, Deng L, Chen G. High Ca(2+)-phosphate transfection efficiency enables single neuron gene analysis. Gene Ther. 2004;11:1303–1311. doi: 10.1038/sj.gt.3302305. [DOI] [PubMed] [Google Scholar]
- Juottonen K, Laakso MP, Partanen K, Soininen H. Comparative MR analysis of the entorhinal cortex and hippocampus in diagnosing Alzheimer disease. AJNR Am J Neuroradiol. 1999;20:139–144. [PubMed] [Google Scholar]
- Kaye JA, Swihart T, Howieson D, Dame A, Moore MM, Karnos T, Camicioli R, Ball M, Oken B, Sexton G. Volume loss of the hippocampus and temporal lobe in healthy elderly persons destined to develop dementia. Neurology. 1997;48:1297–1304. doi: 10.1212/wnl.48.5.1297. [DOI] [PubMed] [Google Scholar]
- Khakh BS, Lester HA. Dynamic selectivity filters in ion channels. Neuron. 1999;23:653–658. doi: 10.1016/s0896-6273(01)80025-8. [DOI] [PubMed] [Google Scholar]
- Kingham PJ, Cuzner ML, Pocock JM. Apoptotic pathways mobilized in microglia and neurones as a consequence of chromogranin A-induced microglial activation. J Neurochem. 1999;73:538–547. doi: 10.1046/j.1471-4159.1999.0730538.x. [DOI] [PubMed] [Google Scholar]
- Le W, Rowe D, Xie W, Ortiz I, He Y, Appel SH. Microglial activation and dopaminergic cell injury: an in vitro model relevant to Parkinson's disease. J Neurosci. 2001;21:8447–8455. doi: 10.1523/JNEUROSCI.21-21-08447.2001. [DOI] [PMC free article] [PubMed] [Google Scholar]
- Le Feuvre R, Brough D, Rothwell N. Extracellular ATP and P2X7 receptors in neurodegeneration. Eur J Pharmacol. 2002;447:261–269. doi: 10.1016/s0014-2999(02)01848-4. [DOI] [PubMed] [Google Scholar]
- Lester HA, Karschin A. Gain of function mutants: ion channels and G protein-coupled receptors. Annu Rev Neurosci. 2000;23:89–125. doi: 10.1146/annurev.neuro.23.1.89. [DOI] [PubMed] [Google Scholar]
- Locovei S, Scemes E, Qiu F, Spray DC, Dahl G. Pannexin1 is part of the pore forming unit of the P2X(7) receptor death complex. FEBS Lett. 2007;581:483–488. doi: 10.1016/j.febslet.2006.12.056. [DOI] [PMC free article] [PubMed] [Google Scholar]
- Lundy PM, Hamilton MG, Mi L, Gong W, Vair C, Sawyer TW, Frew R. Stimulation of Ca(2+) influx through ATP receptors on rat brain synaptosomes: identification of functional P2X(7) receptor subtypes. Br J Pharmacol. 2002;135:1616–1626. doi: 10.1038/sj.bjp.0704624. [DOI] [PMC free article] [PubMed] [Google Scholar]
- Maienschein V, Marxen M, Volknandt W, Zimmermann H. A plethora of presynaptic proteins associated with ATP-storing organelles in cultured astrocytes. Glia. 1999;26:233–244. doi: 10.1002/(sici)1098-1136(199905)26:3<233::aid-glia5>3.0.co;2-2. [DOI] [PubMed] [Google Scholar]
- Mander P, Brown GC. Activation of microglial NADPH oxidase is synergistic with glial iNOS expression in inducing neuronal death: a dual-key mechanism of inflammatory neurodegeneration. J Neuroinflammation. 2005;2:20. doi: 10.1186/1742-2094-2-20. [DOI] [PMC free article] [PubMed] [Google Scholar]
- McGeer PL, McGeer EG. Mechanisms of cell death in Alzheimer disease–immunopathology. J Neural Transm Suppl. 1998;54:159–166. doi: 10.1007/978-3-7091-7508-8_15. [DOI] [PubMed] [Google Scholar]
- McLarnon JG, Ryu JK, Walker DG, Choi HB. Upregulated expression of purinergic P2X(7) receptor in Alzheimer disease and amyloid-beta peptide-treated microglia and in peptide-injected rat hippocampus. J Neuropathol Exp Neurol. 2006;65:1090–1097. doi: 10.1097/01.jnen.0000240470.97295.d3. [DOI] [PubMed] [Google Scholar]
- Murgia M, Hanau S, Pizzo P, Rippa M, Di Virgilio F. Oxidized ATP. An irreversible inhibitor of the macrophage purinergic P2Z receptor. J Biol Chem. 1993;268:8199–8203. [PubMed] [Google Scholar]
- Nimmerjahn A, Kirchhoff F, Helmchen F. Resting microglial cells are highly dynamic surveillants of brain parenchyma in vivo. Science. 2005;308:1314–1318. doi: 10.1126/science.1110647. [DOI] [PubMed] [Google Scholar]
- Parvathenani LK, Tertyshnikova S, Greco CR, Roberts SB, Robertson B, Posmantur R. P2X7 mediates superoxide production in primary microglia and is up-regulated in a transgenic mouse model of Alzheimer's disease. J Biol Chem. 2003;278:13309–13317. doi: 10.1074/jbc.M209478200. [DOI] [PubMed] [Google Scholar]
- Paukert M, Hidayat S, Gründer S. The P2X(7) receptor from Xenopus laevis: formation of a large pore in Xenopus oocytes. FEBS Lett. 2002;513:253–258. doi: 10.1016/s0014-5793(02)02324-4. [DOI] [PubMed] [Google Scholar]
- Pellegatti P, Falzoni S, Pinton P, Rizzuto R, Di Virgilio F. A novel recombinant plasma membrane-targeted luciferase reveals a new pathway for ATP secretion. Mol Biol Cell. 2005;16:3659–3665. doi: 10.1091/mbc.E05-03-0222. [DOI] [PMC free article] [PubMed] [Google Scholar]
- Pessac B, Godin I, Alliot F. [Microglia: origin and development] Bull Acad Natl Med. 2001;185:337–346. discussion 346–337. [PubMed] [Google Scholar]
- Ralevic V, Burnstock G. Receptors for purines and pyrimidines. Pharmacol Rev. 1998;50:413–492. [PubMed] [Google Scholar]
- Rana S, Dringen R. Gap junction hemichannel-mediated release of glutathione from cultured rat astrocytes. Neurosci Lett. 2007;415:45–48. doi: 10.1016/j.neulet.2006.12.043. [DOI] [PubMed] [Google Scholar]
- Reid CA, Clements JD, Bekkers JM. Nonuniform distribution of Ca2+ channel subtypes on presynaptic terminals of excitatory synapses in hippocampal cultures. J Neurosci. 1997;17:2738–2745. doi: 10.1523/JNEUROSCI.17-08-02738.1997. [DOI] [PMC free article] [PubMed] [Google Scholar]
- Rogove AD, Lu W, Tsirka SE. Microglial activation and recruitment, but not proliferation, suffice to mediate neurodegeneration. Cell Death Differ. 2002;9:801–806. doi: 10.1038/sj.cdd.4401041. [DOI] [PubMed] [Google Scholar]
- Sluyter R, Shemon AN, Wiley JS. Glu496 to Ala polymorphism in the P2X7 receptor impairs ATP-induced IL-1 beta release from human monocytes. J Immunol. 2004;172:3399–3405. doi: 10.4049/jimmunol.172.6.3399. [DOI] [PubMed] [Google Scholar]
- Smart ML, Gu B, Panchal RG, Wiley J, Cromer B, Williams DA, Petrou S. P2X7 receptor cell surface expression and cytolytic pore formation are regulated by a distal C-terminal region. J Biol Chem. 2003;278:8853–8860. doi: 10.1074/jbc.M211094200. [DOI] [PubMed] [Google Scholar]
- Solle M, Labasi J, Perregaux DG, Stam E, Petrushova N, Koller BH, Griffiths RJ, Gabel CA. Altered cytokine production in mice lacking P2X(7) receptors. J Biol Chem. 2001;276:125–132. doi: 10.1074/jbc.M006781200. [DOI] [PubMed] [Google Scholar]
- Soltys Z, Ziaja M, Pawlínski R, Setkowicz Z, Janeczko K. Morphology of reactive microglia in the injured cerebral cortex. Fractal analysis and complementary quantitative methods. J Neurosci Res. 2001;63:90–97. doi: 10.1002/1097-4547(20010101)63:1<90::AID-JNR11>3.0.CO;2-9. [DOI] [PubMed] [Google Scholar]
- Sperlágh B, Köfalvi A, Deuchars J, Atkinson L, Milligan CJ, Buckley NJ, Vizi ES. Involvement of P2X7 receptors in the regulation of neurotransmitter release in the rat hippocampus. J Neurochem. 2002;81:1196–1211. doi: 10.1046/j.1471-4159.2002.00920.x. [DOI] [PubMed] [Google Scholar]
- Spray DC, Rozental R, Srinivas M. Prospects for rational development of pharmacological gap junction channel blockers. Curr Drug Targets. 2002;3:455–464. doi: 10.2174/1389450023347353. [DOI] [PubMed] [Google Scholar]
- Steinberg TH, Newman AS, Swanson JA, Silverstein SC. ATP4- permeabilizes the plasma membrane of mouse macrophages to fluorescent dyes. J Biol Chem. 1987;262:8884–8888. [PubMed] [Google Scholar]
- Streit WJ, Walter SA, Pennell NA. Reactive microgliosis. Prog Neurobiol. 1999;57:563–581. doi: 10.1016/s0301-0082(98)00069-0. [DOI] [PubMed] [Google Scholar]
- Streit WJ, Mrak RE, Griffin WS. Microglia and neuroinflammation: a pathological perspective. J Neuroinflammation. 2004;1:14. doi: 10.1186/1742-2094-1-14. [DOI] [PMC free article] [PubMed] [Google Scholar]
- Surprenant A, Rassendren F, Kawashima E, North RA, Buell G. The cytolytic P2Z receptor for extracellular ATP identified as a P2X receptor (P2X7) Science. 1996;272:735–738. doi: 10.1126/science.272.5262.735. [DOI] [PubMed] [Google Scholar]
- Suzuki S, Matsuda Y, Sugawara T, Tabata T, Ishibashi H, Hoshikawa Y, Kubo H, Kondo T. Effects of carbenoxolone on alveolar fluid clearance and lung inflammation in the rat. Crit Care Med. 2004a;32:1910–1915. doi: 10.1097/01.ccm.0000139621.74965.fb. [DOI] [PubMed] [Google Scholar]
- Suzuki T, Hide I, Ido K, Kohsaka S, Inoue K, Nakata Y. Production and release of neuroprotective tumor necrosis factor by P2X7 receptor-activated microglia. J Neurosci. 2004b;24:1–7. doi: 10.1523/JNEUROSCI.3792-03.2004. [DOI] [PMC free article] [PubMed] [Google Scholar]
- Takeuchi H, Jin S, Wang J, Zhang G, Kawanokuchi J, Kuno R, Sonobe Y, Mizuno T, Suzumura A. Tumor necrosis factor-alpha induces neurotoxicity via glutamate release from hemichannels of activated microglia in an autocrine manner. J Biol Chem. 2006;281:21362–21368. doi: 10.1074/jbc.M600504200. [DOI] [PubMed] [Google Scholar]
- Véliz LP, González FG, Duling BR, Sáez JC, Boric MP. Functional role of gap junctions in cytokine-induced leukocyte adhesion to endothelium in vivo. Am J Physiol Heart Circ Physiol. 2008;295:H1056–H1066. doi: 10.1152/ajpheart.00266.2008. [DOI] [PMC free article] [PubMed] [Google Scholar]
- Verderio C, Matteoli M. ATP mediates calcium signaling between astrocytes and microglial cells: modulation by IFN-gamma. J Immunol. 2001;166:6383–6391. doi: 10.4049/jimmunol.166.10.6383. [DOI] [PubMed] [Google Scholar]
- Visentin S, Renzi M, Frank C, Greco A, Levi G. Two different ionotropic receptors are activated by ATP in rat microglia. J Physiol. 1999;519:723–736. doi: 10.1111/j.1469-7793.1999.0723n.x. [DOI] [PMC free article] [PubMed] [Google Scholar]
- von Kügelgen I, Allgaier C, Schobert A, Starke K. Co-release of noradrenaline and ATP from cultured sympathetic neurons. Neuroscience. 1994;61:199–202. doi: 10.1016/0306-4522(94)90223-2. [DOI] [PubMed] [Google Scholar]
- Wang X, Arcuino G, Takano T, Lin J, Peng WG, Wan P, Li P, Xu Q, Liu QS, Goldman SA, Nedergaard M. P2X7 receptor inhibition improves recovery after spinal cord injury. Nat Med. 2004;10:821–827. doi: 10.1038/nm1082. [DOI] [PubMed] [Google Scholar]
- Yawata I, Takeuchi H, Doi Y, Liang J, Mizuno T, Suzumura A. Macrophage-induced neurotoxicity is mediated by glutamate and attenuated by glutaminase inhibitors and gap junction inhibitors. Life Sci. 2008;82:1111–1116. doi: 10.1016/j.lfs.2008.03.010. [DOI] [PubMed] [Google Scholar]
- Yu Y, Ugawa S, Ueda T, Ishida Y, Inoue K, Kyaw Nyunt A, Umemura A, Mase M, Yamada K, Shimada S. Cellular localization of P2X7 receptor mRNA in the rat brain. Brain Res. 2008;1194:45–55. doi: 10.1016/j.brainres.2007.11.064. [DOI] [PubMed] [Google Scholar]