

Abstract
Previous studies have revealed the existence of gap junctions between GABAergic interneurons of a particular type in the striatum. Because of the technical difficulties, however, there is no information about their positions within the striatal circuitry. We have developed a method to detect neuronal gap junctions reliably at the light microscopic level and thereby explored the network architecture of the gap junctional linkage. Gap junction-coupled networks among parvalbumin-containing GABAergic interneurons extended nonuniformly in the feline striatum. They were located predominantly in the methionine–enkephalin–poor matrix. Moreover, the density of gap junctional coupling showed a marked regional difference along the anterior–posterior axis of the striatum. The densest interconnectivity was found in the posterior part of both caudate nucleus and putamen that corresponds to the sensory-recipient area of the feline striatum. Electron microscopic observations provided clear evidence of internalization of neuronal gap junction, indicating the dynamic nature of gap junctional linkage between neurons in vivo. The nonuniform organization of gap junction networks suggests differential modes of information processing in heterogeneous subregions of the striatum.
Keywords: gap junction, striatum, parvalbumin, connexin36, immunohistochemistry, electron microscopy
Introduction
Some neurons use not only conventional chemical synapses but also more direct channels called gap junctions in their communication (Sotelo and Korn, 1978; Galarreta and Hestrin, 2001; Connors and Long, 2004). Gap junctions allow direct transmission of electrical signals between neurons and thereby facilitate synchronous activities of coupled cells. Previous studies have shown frequent occurrence of neuronal gap junctions in different regions of mammalian brains (Sotelo and Palay, 1970; Sotelo et al., 1974; Sloper and Powell, 1978; Kosaka, 1983; Katsumaru et al., 1988; Galarreta and Hestrin, 1999; Gibson et al., 1999; Fukuda and Kosaka 2000, 2003; Landisman et al., 2002; Kosaka and Kosaka, 2005; Muller et al., 2005; Zsiros and Maccaferri, 2005). In most cases, however, it was nearly impossible to know the network architecture of gap junction-coupled neuronal linkage. We have recently developed a method to explore the three-dimensional organization of the gap junction network by the correlated confocal laser scanning light microscopy (CLSM)-electron microscopy (EM) (Fukuda et al., 2006). Our previous analysis in the visual cortex revealed that GABAergic interneurons of a particular type that contain a calcium-binding protein parvalbumin (PV) form dense and far-ranging networks through dendrodendritic gap junctions. These dendritic networks extend continuously in the lateral direction, freely traverse different functional columns of the visual cortex, and possibly provide homogeneous electrical connectivity among coupled interneurons (Fukuda, 2007). As individual cortical PV neurons powerfully regulate activities of hundreds of pyramidal neurons through perisomatic inhibitory synapses, direct electrical connectivity among PV neuron networks is expected to be involved in temporal coordination of population activities such as oscillation and synchronization (Galarreta and Hestrin, 1999; Gibson et al., 1999; Bartos et al., 2002; Traub et al., 2004). Striatum, the receptive part of the basal ganglia, also contain PV neurons. They share many morphological and physiological features with cortical PV neurons (Cowan et al., 1990; Kita et al., 1990; Kawaguchi, 1993; Bolam et al., 2000; Tepper et al., 2004), and gap junctions have been found between them (Kita et al., 1990; Koós and Tepper, 1999). However, little is known about the structural plan of their gap junction networks. The present study first visualizes how gap junctions are embedded in the neuronal circuitry in striatum. The results reveal the nonuniform nature of the network in both the arrangement of coupled neurons and the degree of interconnectivity, which is in good contrast with relatively homogenous gap junction networks in the visual cortex.
Materials and Methods
Tissue preparation.
Fixed brains of domestic cats were generously given by Drs. Satomi Ebara and Kenzo Kumamoto at Meiji University of Integrative Medicine, Kyoto, Japan. Five adult cats of both sexes (3–4 kg) obtained from their breeding colony were housed under 12 h light/dark cycle and supplied with food and water ad libitum. Experimental protocols followed National Institute of Health guidelines for animal research and were approved by the Institutional Animal Care and Use Committee at the Meiji University of Integrative Medicine. The animals were deeply anesthetized with a combination of ketamine hydrochloride (25 mg/kg body weight, i.m.) and sodium pentobarbital (50 mg/kg body weight, i.p.) and were transcardially perfused with 0.1 m PBS, pH 7.4, followed by 4 L of 4% paraformaldehyde in 0.1 m phosphate buffer (PB, pH 7.4) at room temperature. Brains were removed from the skull and stored in the same fixative at 4°C.
Immunohistochemistry.
Serial coronal sections 40–50 μm in thickness were cut with a vibrating microtome (VT1000, Leica). After cryo-protection in 30% sucrose in PB and freeze-thaw procedure using liquid N2, sections were processed for double-fluorescent immunohistochemistry as previously described (Fukuda et al., 2006) with slight modifications. Briefly, sections were incubated with 1% bovine serum albumin in PBS overnight, with a mixture of mouse anti-PV antibody (1:5000, SWANT) and rabbit anti-connexin36 (Cx36) antibodies (Zymed 36–4600, lot no. 30477005, Invitrogen, dilution 1:250) for 7 d at 20°C, with Alexa 488-conjugated donkey anti-mouse IgG (1:250; Invitrogen) and Rhodamine Red-conjugated donkey anti-rabbit IgG (1:200; Jackson ImmunoResearch) overnight, then mounted in Vectashield (Vector Laboratories) and examined with confocal laser-scanning microscopy (C1 plus, Nikon).
Correlated CLSM-EM.
After CLSM, sections were rinsed in PBS and incubated with mouse peroxidase-antiperoxidase complex (1:200; DAKO) overnight. No detergent was included in the incubation medium for EM specimens. Sections were treated with 0.1% glutaraldehyde in PB for 10 min, colored with diaminobenzidine chloride (DAB) and postfixed with 1% OsO4, then stained en bloc with uranyl acetate and mounted in Araldite. Areas previously examined in CLSM were identified by matching the profiles in the PV labeling, photographed and re-embedded in Araldite. Serial ultrathin sections were collected in formvar-coated single slot grids, stained with uranyl acetate and lead citrate, and examined in a transmission electron microscope (H-7100, Hitachi).
Cell reconstructions.
CLSM images were taken from the striatum in dual-labeled sections by using a high resolution objective (Plan Apo 60×, N.A. = 1.40, Nikon). Images were acquired as stacked files through the whole section thickness at optimal step size (0.15 μm) and from neighboring areas to cover the entire dendritic fields of several connected neurons. After transferring CLSM files to a personal computer (Inspiron 6000, Dell), both dendritic arborization of PV-immunoreactive neurons and positions of Cx36-immunoreactive dendrodendritic contacts were reconstructed with a computer-assisted system (Neurolucida Confocal Module, MicroBrightField).
Quantitative analysis.
The stereological method called optical disector was applied to CLSM images (Jinno et al., 1998) for comparison of numerical density of PV neurons between patch and matrix compartments. Serial 50-μm-thick coronal sections were cut from 4 cat brains, and every 20 sections in each brain, ranging from +18 through +12 in Horsely–Clarke coordinate, were used for analysis. Sections were immunostained as above using a mixture of mouse anti-PV antibody (1:5000, SWANT) and rabbit anti-methionine enkephalin (mENK) (1:2500, Immunostar) as primary antibodies. Montages covering the entire caudate nucleus were made from CLSM images taken with 4× objective (Plan Apo, N.A. = 0.2, Nikon), then the sampling frames (635 × 635 μm), each 160 μm apart from others, were superimposed on the montages. In each section, 4 sampling frames were selected at random from the dorsolateral quadrant of the caudate nucleus. Dual labeled stack-file images (635 × 635 μm) were taken with 20× objective (Plan Fluor, N.A. = 0.5, Nikon) at an optimal z step (1.10 μm). Data were transferred to a personal computer (PowerBook G4, Apple) and analyzed by using a public application Image J (National Institutes of Health). PV-positive somata that were contained in the space between the fifth and twenty-fifth optical slices were counted according to the general counting rule of disector (Sterio, 1984). The permeation of antibodies from the section surface was confirmed to be sufficient in the depth used for counting. The mENK-rich patches were discriminated by the immunofluorescence signals, and both the number of PV-positive somata and the volume of the space analyzed were separately measured for patch and matrix to yield the numerical density in each compartment.
Density of PV-immunoreactive dendrites was measured semiautomatically by combining several analytical tools in Image J. The same image files that were used for soma counting were analyzed. Optical slices from the fifth to twenty-fifth were projected onto a single image, and PV-immunoreactive dendrites in the projected image were extracted by thresholding the immunoreactivity represented as gray levels in each pixel. After skeletonizing the binary images of dendrites, the length of dendrites was measured by using the Analyze Particle command; the number of pixels contained in each “particle” (binary image of each dendritic segment) became equal to its length because skeletonized dendrites were 1 pixel-wide. Both the total length of dendrites and the volume for sampling were separately measured for mENK-defined patch and matrix. The threshold gray level was kept constant in each animal and was common to both patch and matrix compartments.
Density of gap junctions was measured in serial 50-μm-thick coronal sections cut from 3 brains. Every 20 sections ranging from +19 to +11 in Horsely–Clarke coordinate was immunostained for PV and Cx36 as above. Dual labeled CLSM stack images were taken with 60× objective (Plan Apo, N.A. = 1.40, Nikon), zoom factor 1.41 (frame size: 150 × 150 μm), at an optimal z step (0.15 μm) from 5 sites in each section that were selected at random from the area containing dense plexus of PV-immunoreactive dendrites located in dorsolateral quadrant of the caudate nucleus. Data were transferred to a personal computer (Power Book G4) and the number of Cx36-immunoreactive puncta located at the contact sites between PV-immunoreactive dendrites was counted in 160 serial optical slices (total thickness: 24 μm) and divided by the sampling volume.
Statistics.
Statistical analysis was performed by Mann–Whitney test for comparison of both somatic and dendritic densities of PV neurons between the mENK-defined patch and matrix and by Friedman test for comparison of the density of gap junctions along the anterior–posterior axis of the striatum with p < 0.05 as significant level.
Results
Identification of gap junctions
Neuronal gap junctions in the feline striatum were examined by both conventional immunoelectron microscopy and the correlated CLSM-EM. In the former analysis, typical ultrastructural profiles of gap junctions were observed between PV-immunoreactive dendrites (Fig. 1A,B). At high magnifications, two plasma membranes of the apposing neurons made direct contact with each other, forming a single straight or slightly curved line at the center of the pentalaminar (but not classical heptalaminar) profile that is characteristic to gap junctions in immunolabeled specimens (for structural details, see Fukuda and Kosaka, 2000, 2003). In the correlated CLSM-EM, the antibody raised against neuron-specific gap junction-constituting protein Cx36 (Condorelli et al., 1998; Söhl et al., 1998) was used to label gap junctions (Rash et al., 2000). In dual-label CLSM, Cx36-immunoreactivity was found in punctuate structures that were located at the contact sites between PV-immunoreactive dendrites (Fig. 1C,E). Direct correspondence of these small dots in CLSM and gap junctions in EM was confirmed thoroughly in our previous analysis in the cerebral cortex (Fukuda et al., 2006), where the fluorescence signals for PV neurons were converted to DAB reaction products, whereby the same contact sites were re-examined in EM. In the present study, this approach was applied to the striatum. The correlated CLSM-EM analysis clearly demonstrated the direct correspondence (Fig. 1C–E,G,H), indicating that Cx36-immunoreactive puncta on striatal PV neurons identified at the CLSM level reliably indicate sites of gap-junctional coupling. This enabled us to investigate the spatial arrangement of striatal gap junction network by examining serial, immunolabeled sections in CLSM.
Figure 1.
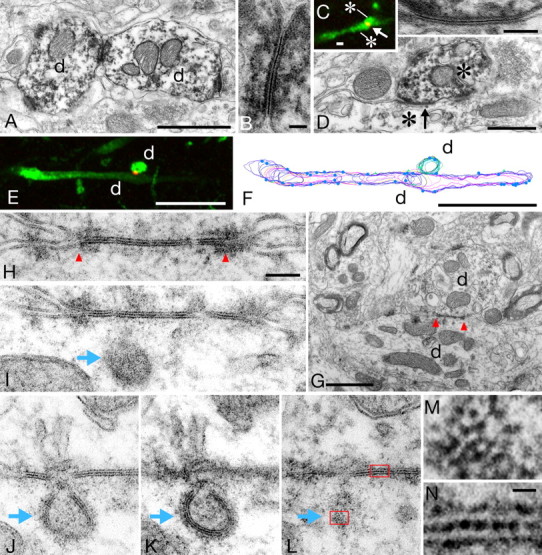
Identification of neuronal gap junctions in the striatum. A, Two PV-immunoreactive dendrites (d) make direct contact with each other. B, Enlargement of the contact site in A, demonstrating a typical ultrastructure of gap junction. C, Dual CLSM image showing Cx36 (red)-immunoreactive punctuate structure located at the contact site (arrow) between two PV (green)-immunoreactive dendrites (asterisks), one running horizontally while the other perpendicular to the image. D, The same contact site shown in C was re-examined in EM by converting fluorescent signals for PV to DAB reaction products. High-power view (inset) indicates strict correspondence of Cx36 labeling in CLSM to gap junction in EM. E–L, Functional and dynamic aspects of gap junctional coupling. After taking dual CLSM image (PV green; Cx36 red), the same contacting dendrites (d) were identified by EM (G), reconstructed from serial ultrathin sections (F), and confirmed to form gap junction between them (H). Blue dots on the surface of reconstructed dendrites in F indicate sites of synaptic contacts. Red arrowheads in G and H demarcate gap junction. Serial ultrathin sections (I–L) next to H demonstrate a presumed internalization of gap junction (blue arrows). Images in J and K are taken from the same specimen with different tilt angles for EM observations. Coated pits are visible around the internalized membranes in K. M, Enlargement of the framed area (bottom) in L. Note hexagonal array of spot-like reaction products. N, Enlargement of the framed area (top) in L, showing an alternating pattern of reaction products along the central line of the gap junction. Scale bars: A, C, G, 1 μm; B, 50 nm; D, 0.5 μm; inset, 100 nm; E, F, 10 μm; H-L, 100 nm; M, N, 10 nm.
Ultrastructural findings
The EM analysis was effective not only in characterization of anti-Cx36 antibody but also in illuminating some functional and even dynamic nature of gap junctional linkage (Fig. 1F–L). Dendrites forming gap junctions in the hippocampus and neocortex receive numerous synaptic inputs, and the proximity of these synapses to gap junctions has been argued with relation to propagation of postsynaptic events (Zsiros et al., 2007) that are slower and might be more readily transmitted through gap junctions than action potentials. The present serial section analysis revealed that striatal PV neurons also bear many synaptic contacts near gap junctions (Fig. 1F).
Interestingly, the serial section analysis also revealed the ultrastructural profiles of presumed internalization of gap junction (Fig. 1H–L) that closely resemble those demonstrated in Cx43-expressing HeLa cells (Gaietta et al., 2002), in which gap junction plaques are assembled from outer edges and removed from the central core. Similar profiles, called annular junctions, have been observed in several non-neural tissues (Larsen and Hai-Nan, 1978) as well as in cultured astrocytes (Dermietzel et al., 1991), and they have been proposed to be a mechanism of rapid removal of gap junctions from the cell surface (Jordan et al., 2001). As have been pointed out in some non-neural tissues, clathrin-like coated pits were also visible around the internalized membrane (Fig. 1K). Therefore, the present results first visualize the ultrastructure of internalized gap junction that was formed between neurons in vivo, which might further suggest a novel form of neuronal plasticity based on trafficking of gap junction-constituting proteins.
Close-up view of the most peripheral part of the internalized gap junction that was tangentially cut (Fig. 1L,M) demonstrates a hexagonal array of electron-dense spots with a center-to-center spacing of ∼6.9 nm (Fig. 1M). The central line in the cross-section of gap junctions also displayed some periodicity of ∼6.8 nm (Fig. 1N). As tissues were fixed only with 4% paraformaldehyde and thus shrunken (∼80%) during dehydration, these values were comparable with our previous data in rats (Fukuda and Kosaka, 2003) and also with a known structure of gap junctions in which hexagonal assembly of connexons have a similar mean interparticle distance (Makowski et al., 1977). The most reasonable interpretation is that these periodical dense spots represent DAB reaction products that penetrate into pores of connexons and settle near the interface between apposing hemichannels, resulting in the electron-dense central line observable in modest magnification (Fig. 1B,D,H).
Dense interconnectivity through gap junctions
On the basis of antibody characterization and confirmation of ultrastructural morphology, the network architecture of gap junction-coupled PV neurons was investigated in the striatum by using specific Cx36 labeling in CLSM. As in the primate, the striatum of the feline consists of two anatomical components, the putamen and the caudate nucleus, both of which extend along the anterior–posterior axis of the brain. Figure 2 shows an example of the dense interconnectivity among PV neurons in the posterior part of the putamen (supplemental Figs. 1, 2, available at www.jneurosci.org as supplemental material). Dendrites arising from different PV neurons made contact with one another at multiple sites where Cx36-positive dot-like signals were located (Fig. 2A–G), indicating that these dendrites were connected through gap junctions. The contacting dendrites were reconstructed by using a computer-assisted neuron tracing system (Fig. 2H,I). The trace clearly demonstrates that the linkage through gap junction is not just a connection between two cells but constitutes a network formed by multiple interconnected neurons (supplemental Fig. 3, available at www.jneurosci.org as supplemental material). Different symbols along dendrites shown in Figure 2I indicate Cx36-immunoreactive contact sites, all of which had contacting pairs most of which had not been traced further. If one considers that only a small fraction of gap junction-coupled neurons are shown in Figure 2I, it becomes evident that dendrites constituting the network have an exceedingly high degree of interconnectivity.
Figure 2.
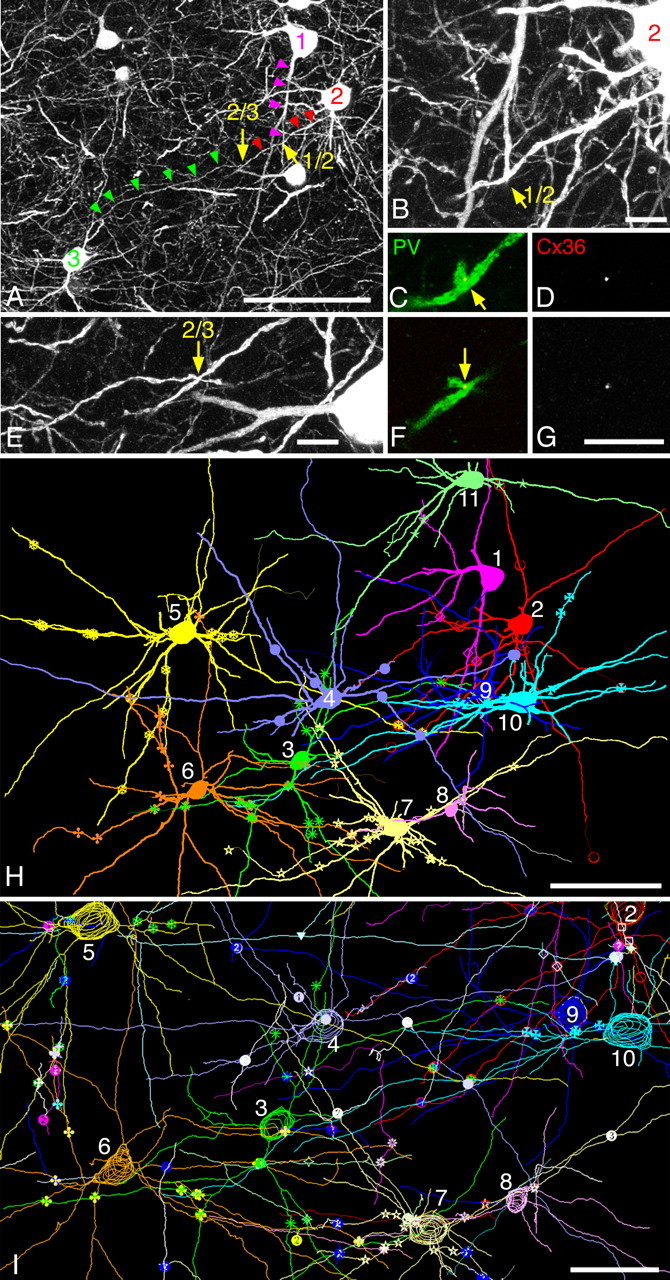
Gap junctions establish a dense network of PV neurons in the posterior putamen. Images are taken from the area shown in supplemental Figure 1B, available at www.jneurosci.org as supplemental material, at +11 in Horsely–Clarke coordinate. A–G, Dendrites arising from three somata (No. 1–3) come close to one another (triangles), making direct contacts between cells 1 and 2 (B, C) as well as between cells 2 and 3 (E, F). Exactly at these contact sites are Cx36-positive gap junctions (D, G). H, Computer-assisted reconstruction of 11 PV neurons including the three in A. All these neurons are directly connected to one another through gap junctions. Different symbols along dendrites indicate sites of gap junctions. Detailed interconnectivity is depicted in supplemental Figure 3, available at www.jneurosci.org as supplemental material, and the actual CLSM image of a part of this tracing is shown in supplemental Figure 2, available at www.jneurosci.org as supplemental material. I, Enlargement of the central part of H. Note that not only dendrites belonging to the reconstructed 11 neurons but also all contacting pairs that were traced from all Cx36-positive contact sites (different symbols) are included in the drawing here, although many of the paired dendrites were traced only in short segments. Scale bars: A, H, 100 μm; B–G, 10 μm; I, 50 μm.
Nonuniformity in gap junctional networks
PV neurons in the visual cortex also form dense gap junctional linkage, and the networks extend homogeneously in the lateral direction (Fukuda et al., 2006). In contrast, close observations of the staining pattern in the striatum revealed that PV neurons and their dendritic nets are not distributed uniformly across the striatum, especially in the caudate nucleus. Immunostaining for PV in the caudate nucleus exhibited an irregular mosaic-like pattern with PV-poor areas scattered among PV-rich territories (Figs. 3A,C,E; 4). This pattern is reminiscent of the well known patch/matrix compartmental organization of the striatum. In the feline striatum the patches are distinctly identifiable as the domains of accumulation of mENK-immunoreactivity and these domains correspond to acetylcholine esterase-poor striosomes (Graybiel and Chesselet, 1984; Groves et al., 1988). Therefore, nonuniform pattern in PV immunohistochemistry was analyzed in sections simultaneously labeled for mENK. It was found that PV-poor areas closely matched mENK-rich patches (Figs. 3B; 4). Patch/matrix organization has been identified in different species by using various chemical markers. As there are some nonoverlapping portions in their detailed distributions, the term “mENK-rich patches” is used in this study for clarification.
Figure 3.
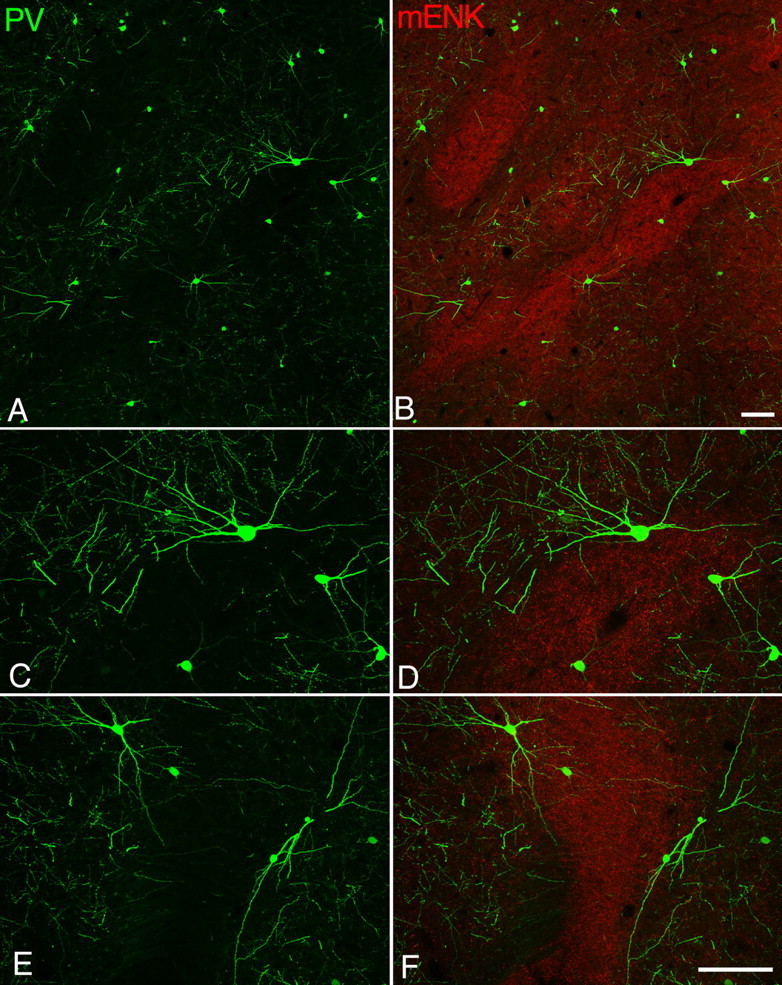
PV neuron networks avoid mENK-rich patches. A, B, PV immunoreactive structures (green) are nonuniformly distributed in the caudate nucleus with their somata and dendrites located predominantly outside the patches that are recognizable as mENK (red)-rich zones. Images are taken at +13 in Horsely–Clarke coordinate. C–F, High-power view confirms preferential localization of PV immunoreactivity in the mENK-poor matrix. Although the patch contains a few thinner dendrites, the greater part of dendritic plexus is confined to the matrix. Note the course of thick dendrites arising from somata located near the patch/matrix border. Scale bars, 100 μm.
Figure 4.
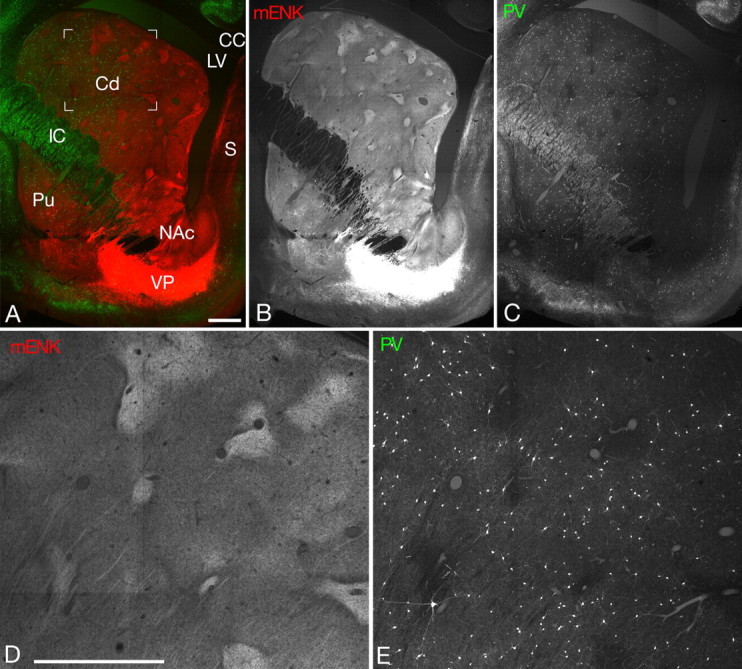
The distribution of PV (green) and mENK (red) immunoreactivities in the striatum at +16 in Horsely–Clarke coordinate. A, C, PV immunoreactivity has a gradient along the dorsolateral-ventromedial axis of the caudate nucleus (Cd). CC, Corpus callosum; IC, internal capsule; LV, lateral ventricle; Pu, putamen; S, septum; VP, ventral pallidum. B, mENK-rich patches are rather indistinct and irregularly shaped in both the ventromedial sector of the caudate nucleus and the ventral striatum (nucleus accumbens, NAc). mENK-rich patches are also indistinct in the putamen. D, E, Enlargement of the framed area in A. Scale bars, 1 mm.
The preferential localization to the area outside patches, which is called mENK-poor matrix here, was apparent not only in somatic distribution but also in dendritic arborization (Fig. 3C–F). Thick dendrites arising from PV neurons near the mENK-defined patch/matrix border often ran parallel to that border and avoided the mENK-rich patch, although a small fraction of thinner dendrites occasionally entered the patch.
Despite the apparent staining pattern associated with the matrix compartment, the presence of some PV immunoreactive elements in patches has been repeatedly described (Kita et al., 1990; Kubota and Kawaguchi, 1993; Bennett and Bolam, 1994a), leaving the issue of preferential localization of PV neurons to matrix still open. Moreover, the patches occupied only 10% of the volume of the feline caudate nucleus (data not shown). Thus, it is possible that the apparent scarcity of PV neurons in the patch might simply reflect its small volume (Cowan et al., 1990). Therefore, I decided to compare the density of PV neurons (number per unit volume) between the mENK-defined patch and matrix by the bias-free stereological method called disector (Sterio, 1984). In the following quantitative analyses, I focused on the dorsolateral sector of the caudate nucleus, because there was a consistent gradient of incidence of PV neurons with a higher number at dorsolateral sector and a gradual decrease toward the ventromedial end where PV neurons were only sparsely seen (Fig. 4). Furthermore, mENK-rich patches became small, irregular and rather indistinct in the ventromedial sector as well as in the nucleus accumbens (ventral striatum).
The disector analysis (Fig. 5A) revealed that the cellular density in the mENK-rich patches was <220 per mm3 at all locations along the anterior–posterior axis, whereas the mENK-poor matrix showed significantly higher density than the patches at most of the anterior–posterior locations. The density of dendrites (total length of dendrites that are contained in unit volume) was also measured semiautomatically and compared between the two compartments (Fig. 5B). The dendritic density was significantly higher in mENK-defined matrix than in patches at all anterior–posterior levels. These quantitative data provided the proof of the preferential localization of PV neurons and their dendrites in the mENK-poor matrix compartment in the dorsolateral caudate nucleus of the feline. The distribution of PV neurons in the ventromedial sector was also nearly limited to the matrix compartment.
Figure 5.

Quantitative analyses on the nonuniform organization of PV neuron networks in the caudate nucleus. Abscissa indicates Horsely–Clarke coordinates. A, The numerical density of PV neuron somata in the mENK-poor matrix (M) is higher than that in the mENK-rich patches (P) at most of the anterior–posterior locations. Asterisks indicate significant difference (p < 0.05, Mann–Whitney test). B, Total dendritic length contained per unit volume in the mENK-poor matrix is also higher than that in the mENK-rich patches at all anterior–posterior levels (p < 0.05, Mann–Whitney test). C, Density of gap junctions in the mENK-poor matrix shows marked regional difference along the anterior–posterior axis (p < 0.05, Friedman test). Dotted lines indicate data from three animals, whereas thick line their average.
Heterogeneity along the anterior–posterior axis of the striatum
The graphs in Figure 5, A and B, indicate the tendency of both cellular and dendritic densities that are higher in the posterior part of the caudate nucleus. This suggests another heterogeneity in the incidence of gap junction-mediated interconnectivity, i.e., nonuniformity along the anterior–posterior axis of the striatum. I compared the numerical density of gap junctions (number per unit volume) in the matrix among different anterior–posterior locations of the caudate nucleus (Fig. 5C). The graph indicates that the density of gap junctional coupling depends on the anterior–posterior locations (p < 0.05, Friedman test) with higher density in the posterior part of the caudate nucleus: the data from all three animals showed a similar trend. The density of gap junctions was particularly high at the coordinates of +11 to +13 that correspond to “body” part of the caudate nucleus. The computer-assisted tracings demonstrated that PV-neurons in this region actually formed dense gap junction networks (Fig. 6) as in the posterior putamen.
Figure 6.

Dense gap junctional network in the matrix of the posterior caudate nucleus (+13 in Horsely–Clarke coordinate). Five reconstructed cells shown here are connected through gap junctions that are indicated by different symbols. In contrast, on the left side of red dotted line is the patch where some PV-immunoreactive dendrites are seen but devoid of gap junctional linkage. Scale bar, 100 μm.
The gap junctional coupling in the putamen also showed a similar anterior–posterior difference, although not analyzed quantitatively. The posterior putamen corresponding to the location where it comprises the lenticular nucleus with the globus pallidus (supplemental Fig. 1A, available at www.jneurosci.org as supplemental material) showed a high degree of gap junction-mediated interconnectivity between PV neurons (Fig. 2). However, the anterior part that is a continuation of the head of the caudate nucleus did not show such dense interconnectivity. As to the relationship to patch/matrix organization, the compartmentalization was not so distinct in the putamen because the greater part of the feline putamen corresponds to the matrix (Groves et al., 1988). mENK-rich patches were found in only small areas of the putamen, and the PV immunoreactivity was almost lacking in such areas. Based on the results in this study, it is concluded that the gap junction-coupled neuronal linkage in the striatum extends predominantly in the mENK-poor matrix compartment and is most conspicuous in the posterior part of both caudate nucleus and putamen where multiple interconnected PV neurons form dense and homogeneous coupling.
Discussion
The present study has demonstrated the actual structure of the neuronal networks linked by gap junctions in the striatum. The newly developed morphological technique enabled us to visualize gap junctions reliably at the light microscopic level across large brain areas. The emergent network architecture is closely related to the two key organizations in the striatum, i.e., the mENK-defined patch/matrix compartments and the rostrocaudal subdivisions of the striatum, both of which represent functionally important heterogeneity inside the striatum.
Distribution in the matrix compartment
There have been controversial data and different interpretations on the preferential localization of PV neurons to the matrix in other species (Cowan et al., 1990; Kubota and Kawaguchi, 1993; Bennett and Bolam, 1994a). I, therefore, performed a stereology-based quantification to compare the cellular density between the mENK-defined patch and matrix. The density of dendrites was also analyzed by objective, semiautomatic procedures. These analyses clearly indicate that PV neurons and their dendritic networks are distributed predominantly in the mENK-poor matrix compartment of the feline striatum. Although some dendrites are located in the mENK-rich patch, they are much sparser than dendritic plexus in the matrix and hence they have much less opportunity to meet and form a network with others. According to the previous observations in the primate striatum, some PV neurons are located in the patch compartment with relative densities that appear to be higher than the present results in the feline. However, it is general in neurosciences that the same brain region of different species shows both similarities and dissimilarities. Stereology-based studies in other species will clarify to what extent the present findings can be generalized.
Comparison between the striatum and neocortex
The structural design of gap junctional network in striatum was found to be different from that in the neocortex. The cortical network spreads rather homogenously in the lateral direction, whereas the striatal network follows discontinuous patch/matrix patterns. The architecture in the cortical linkage is thought to reflect the lateral continuity observable in cortical tissues themselves. Although one may think of cortical columns that are arranged in vertical directions, columns actually do not have strict lateral borders, except for special cases such as barrels in layer 4 of the somatosensory cortex. Orientation-preference columns in the visual cortex, for example, are often demonstrated by a finite number of color codes representing angles of stimulating light, but most probably they are organized as a continuous spectrum just like colors in the rainbow. We found that gap junction-coupled dendrites of PV neurons freely traverse continuous cortical tissues displaying different orientation preferences (Fukuda et al., 2006). In contrast, striatal patch/matrix organization is based on the morphological segregation: various chemical substances accumulate or avoid patches and thus delineate the mosaic pattern. Moreover, patch and matrix regions have distinctive extrinsic connections with the cerebral cortex and midbrain dopaminergic nuclei. PV neurons and their gap junction networks thus follow this anatomical nonuniformity within the striatum.
Notwithstanding the contrasting architecture of the striatal and neocortical gap junction networks, it is also necessary to consider the structure of the striatal gap junction network from a different viewpoint. The discontinuity in the striatal network can be ascribed to the anatomical nonuniformity of the striatum itself, but when one considers the continuity inside the space that is occupied by the continuous matrix compartment (Groves et al., 1988), the dense and homogeneous linkage among gap junction-coupled dendrites in matrix is rather similar to the interconnectivity observable in PV neuron networks in the neocortex [compare Fig. 2I to Fukuda et al. (2006), their Fig. 6]. This is an important viewpoint when one discusses local integration of diverse information that converges into a confined tissue space (see below).
Implications in the striatal circuitry
As glutamatergic neurons are absent in the striatum, the excitatory driving inputs to striatal interneurons should mediate the feedforward inhibitory actions rather than the feedback type. In fact, striatal PV neurons are known to receive direct excitatory inputs from the neocortex and in turn establish synaptic contacts on medium spiny neurons of the striatum (Bennett and Bolam, 1994b). Moreover, firing of PV-fast spiking cells are known to elicit quite large postsynaptic inhibitory responses in medium spiny neurons (Koós and Tepper, 1999). Therefore, the implication of the present findings is that the mENK-poor matrix is the region where the feedforward inhibitory mechanism takes place by way of wide-ranging PV neuron networks that use gap junctions for communication, particularly in the posterior striatum. However, the paucity of both PV neurons and their gap junctional coupling in mENK-rich patches suggests considerably different mode of information processing in the patch compartment.
Nonuniformity along the anterior–posterior axis of the striatum
The regional difference in gap junction density along the anterior–posterior axis appears to be related to functional heterogeneity inside the striatum. The striatum of the primate can be divided into several territories: the anterior parts of both caudate nucleus (caudate head) and putamen are related to cognitive processes, the middle of the caudate (body) is to oculomotor, the posterior putamen to sensorimotor, and the ventral striatum to limbic processes (Parent, 1990). Although it is uncertain to which extent these divisions are applicable to the feline striatum, tracer experiments have depicted the basically similar organization (Malach and Graybiel, 1986; Norita et al., 1991; Updyke, 1993). The posterior caudate nucleus of the cat especially contains neurons that respond to different sensory stimuli such as visual, auditory, somatosensory or even multisensory inputs (Nagy et al., 2005). Importantly, all these neurons are confined to the dorsolateral sector of the posterior caudate, which closely matches the areas of high gap junctional coupling in this study. The sensory receptive fields of these neurons are extremely large covering the entire external field. The pathway originating from the tectum through extrageniculate thalamus (Harting et al., 2001) is assumed to be responsible for these broad responses. In addition to this subcortical multimodal inputs, cortical afferents conveying anatomically and/or functionally distinct inputs also converge and interdigitate with each other in the matrix, forming minute mosaic patterns (Selemon and Goldman-Rakic, 1985; Malach and Graybiel, 1986). Moreover, the double anterograde tracing studies have directly shown the presence of PV neurons that received inputs from different cortical regions (Bolam et al., 2000). Judging from the dense and homogeneous interconnectivity among coupled dendrites seen in the mENK-defined matrix of the posterior striatum and from the occurrence of multimodal sensory cells, it is conceivable that the intricate gap junction networks in this region is involved in the local integration of diverse information streams and might provide the anatomical substrate for cross-modal/submodal computations (Nagy et al., 2006). The anterior striatum was not equipped with so much gap junctional coupling, but it will be an intriguing issue how it is in the primate.
Footnotes
This work was supported by a Grant-in-Aid for Science Research from the Japan Society for the Promotion of Science (18300108). I thank Drs. S. Ebara and K. Kumamoto for generously giving the materials, K. Sawai and C. Goto for excellent technical assistance, and Dr. Kosaka for carefully reading this manuscript and providing useful comments.
References
- Bartos M, Vida I, Frotscher M, Meyer A, Monyer H, Geiger JR, Jonas P. Fast synaptic inhibition promotes synchronized gamma oscillations in hippocampal interneuron networks. Proc Natl Aca Sci U S A. 2002;99:13222–13227. doi: 10.1073/pnas.192233099. [DOI] [PMC free article] [PubMed] [Google Scholar]
- Bennett BD, Bolam JP. Localisation of parvalbumin-immunoreactive structures in primate caudate-putamen. J Comp Neurol. 1994a;347:340–356. doi: 10.1002/cne.903470303. [DOI] [PubMed] [Google Scholar]
- Bennett BD, Bolam JP. Synaptic input and output of parvalbumin-immunoreactive neurons in the neostriatum of the rat. Neuroscience. 1994b;62:707–719. doi: 10.1016/0306-4522(94)90471-5. [DOI] [PubMed] [Google Scholar]
- Bolam JP, Hanley JJ, Booth PA, Bevan MD. Synaptic organization of the basal ganglia. J Anat. 2000;196:527–542. doi: 10.1046/j.1469-7580.2000.19640527.x. [DOI] [PMC free article] [PubMed] [Google Scholar]
- Condorelli DF, Parenti R, Spinella F, Trovato Salinaro A, Belluardo N, Cardile V, Cicirata F. Cloning of a new gap junction gene (CX36) highly expressed in mammalian brain neurons. Eur J Neurosci. 1998;10:1202–1208. doi: 10.1046/j.1460-9568.1998.00163.x. [DOI] [PubMed] [Google Scholar]
- Connors BW, Long MA. Electrical synapses in the mammalian brain. Annu Rev Neurosci. 2004;27:393–418. doi: 10.1146/annurev.neuro.26.041002.131128. [DOI] [PubMed] [Google Scholar]
- Cowan RL, Wilson CJ, Emson PC, Heizmann CW. Parvalbumin-containing GABAergic interneurons in the rat neostriatum. J Comp Neurol. 1990;302:197–205. doi: 10.1002/cne.903020202. [DOI] [PubMed] [Google Scholar]
- Dermietzel R, Hertberg EL, Kessler JA, Spray DC. Gap junctions between cultured astrocytes: immunocytochemical, molecular, and electrophysiological analysis. J Neurosci. 1991;11:1421–1432. doi: 10.1523/JNEUROSCI.11-05-01421.1991. [DOI] [PMC free article] [PubMed] [Google Scholar]
- Fukuda T. Structural organization of the gap junction network in the cerebral cortex. Neuroscientist. 2007;13:199–207. doi: 10.1177/1073858406296760. [DOI] [PubMed] [Google Scholar]
- Fukuda T, Kosaka T. Gap junctions linking the dendritic network of GABAergic interneurons in the hippocampus. J Neurosci. 2000;20:1519–1528. doi: 10.1523/JNEUROSCI.20-04-01519.2000. [DOI] [PMC free article] [PubMed] [Google Scholar]
- Fukuda T, Kosaka T. Ultrastructural study of gap junctions between dendrites of parvalbumin-containing GABAergic neurons in various neocortical areas of the adult rat. Neuroscience. 2003;120:5–20. doi: 10.1016/s0306-4522(03)00328-2. [DOI] [PubMed] [Google Scholar]
- Fukuda T, Kosaka T, Singer W, Galuske RAW. Gap junctions among dendrites of cortical GABAergic neurons establish a dense and widespread intercolumnar network. J Neurosci. 2006;26:3434–3443. doi: 10.1523/JNEUROSCI.4076-05.2006. [DOI] [PMC free article] [PubMed] [Google Scholar]
- Gaietta G, Deerinck TJ, Adams SR, Bouwer J, Tour O, Laird DW, Sosinsky GE, Tsien RY, Ellisman MH. Multicolor and electron microscopic imaging of connexin trafficking. Science. 2002;296:503–507. doi: 10.1126/science.1068793. [DOI] [PubMed] [Google Scholar]
- Galarreta M, Hestrin S. A network of fast-spiking cells in the neocortex connected by electrical synapses. Nature. 1999;402:72–75. doi: 10.1038/47029. [DOI] [PubMed] [Google Scholar]
- Galarreta M, Hestrin S. Electrical synapses between GABA-releasing interneurons. Nat Rev Neurosci. 2001;2:425–433. doi: 10.1038/35077566. [DOI] [PubMed] [Google Scholar]
- Gibson JR, Beierlein M, Connors BW. Two networks of electrically coupled inhibitory neurons in neocortex. Nature. 1999;402:75–79. doi: 10.1038/47035. [DOI] [PubMed] [Google Scholar]
- Graybiel AM, Chesselet MF. Compartmental distribution of striatal cell bodies expressing [Met]enkephalin-like immunoreactivity. Proc Natl Acad Sci U S A. 1984;81:7980–7984. doi: 10.1073/pnas.81.24.7980. [DOI] [PMC free article] [PubMed] [Google Scholar]
- Groves PM, Martone M, Young SJ, Armstrong DM. Three-dimensional pattern of enkephalin-like immunoreactivity in the caudate nucleus of the cat. J Neurosci. 1988;8:892–900. doi: 10.1523/JNEUROSCI.08-03-00892.1988. [DOI] [PMC free article] [PubMed] [Google Scholar]
- Harting JK, Updyke BV, Van Lieshout DP. Striatal projections from the cat visual thalamus. Eur J Neurosci. 2001;14:893–896. doi: 10.1046/j.0953-816x.2001.01712.x. [DOI] [PubMed] [Google Scholar]
- Jinno S, Aika Y, Fukuda T, Kosaka T. Quantitative analysis of GABAergic neurons in the mouse hippocampus, with optical disector using confocal laser scanning microscope. Brain Res. 1998;814:55–70. doi: 10.1016/s0006-8993(98)01075-0. [DOI] [PubMed] [Google Scholar]
- Jordan K, Chodock R, Hand AR, Laird DW. The origin of annular junctions: a mechanism of gap junction internalization. J Cell Sci. 2001;114:763–773. doi: 10.1242/jcs.114.4.763. [DOI] [PubMed] [Google Scholar]
- Katsumaru H, Kosaka T, Heizmann CW, Hama K. Gap junctions on GABAergic neurons containing the calcium-binding protein parvalbumin in the rat hippocampus (CA1 region) Exp Brain Res. 1988;72:363–370. doi: 10.1007/BF00250257. [DOI] [PubMed] [Google Scholar]
- Kawaguchi Y. Physiological, morphological, and histochemical characterization of three classes of interneurons in rat neostriatum. J Neurosci. 1993;13:4908–4923. doi: 10.1523/JNEUROSCI.13-11-04908.1993. [DOI] [PMC free article] [PubMed] [Google Scholar]
- Kita H, Kosaka T, Heizmann CW. Parvalbumin-immunoreactive neurons in the rat neostriatum: a light and electron microscopic study. Brain Res. 1990;536:1–15. doi: 10.1016/0006-8993(90)90002-s. [DOI] [PubMed] [Google Scholar]
- Koós T, Tepper JM. Inhibitory control of neostriatal projection neurons by GABAergic interneurons. Nat Neurosci. 1999;2:467–472. doi: 10.1038/8138. [DOI] [PubMed] [Google Scholar]
- Kosaka T. Gap junctions between non-pyramidal cell dendrites in the rat hippocampus (CA1 and CA3 regions) Brain Res. 1983;271:157–161. doi: 10.1016/0006-8993(83)91377-x. [DOI] [PubMed] [Google Scholar]
- Kosaka T, Kosaka K. Intraglomerular dendritic link connected by gap junctions and chemical synapses in the mouse main olfactory bulb: electron microscopic serial section analysis. Neuroscience. 2005;131:611–625. doi: 10.1016/j.neuroscience.2004.11.050. [DOI] [PubMed] [Google Scholar]
- Kubota Y, Kawaguchi Y. Spatial distribution of chemically identified intrinsic neurons in relation to patch and matrix compartments of rat neostriatum. J Comp Neurol. 1993;332:499–513. doi: 10.1002/cne.903320409. [DOI] [PubMed] [Google Scholar]
- Landisman CE, Long MA, Beierlein M, Deans MR, Paul DL, Connors BW. Electrical synapses in the thalamic reticular nucleus. J Neurosci. 2002;22:1002–1009. doi: 10.1523/JNEUROSCI.22-03-01002.2002. [DOI] [PMC free article] [PubMed] [Google Scholar]
- Larsen WJ, Hai-Nan Origin and fate of cytoplasmic gap junctional vesicles in rabbit granulose cells. Tissue Cell. 1978;10:585–598. doi: 10.1016/s0040-8166(16)30351-2. [DOI] [PubMed] [Google Scholar]
- Makowski L, Caspar DL, Phillips WC, Goodenough DA. Gap junction structures: II. Analysis of the X-ray diffraction data. J Cell Biol. 1977;74:629–645. doi: 10.1083/jcb.74.2.629. [DOI] [PMC free article] [PubMed] [Google Scholar]
- Malach R, Graybiel AM. Mosaic architecture of the somatic sensory-recipient sector of the cat's striatum. J Neurosci. 1986;6:3436–3458. doi: 10.1523/JNEUROSCI.06-12-03436.1986. [DOI] [PMC free article] [PubMed] [Google Scholar]
- Muller JF, Mascagni F, McDonald AJ. Coupled networks of parvalbumin-immunoreactive interneurons in the rat basolateral amygdala. J Neurosci. 2005;25:7366–7376. doi: 10.1523/JNEUROSCI.0899-05.2005. [DOI] [PMC free article] [PubMed] [Google Scholar]
- Nagy A, Paróczy Z, Norita M, Benedek G. Multisensory responses and receptive field properties of neurons in the substantia nigra and in the caudate nucleus. Eur J Neurosci. 2005;22:419–424. doi: 10.1111/j.1460-9568.2005.04211.x. [DOI] [PubMed] [Google Scholar]
- Nagy A, Eördegh G, Paróczy Z, Márkus Z, Benedek G. Multisensory integration in the basal ganglia. Eur J Neurosci. 2006;24:917–924. doi: 10.1111/j.1460-9568.2006.04942.x. [DOI] [PubMed] [Google Scholar]
- Norita M, McHaffie JG, Shimizu H, Stein BE. The corticostriatal and corticotectal projections of the feline lateral suprasylvian cortex demonstrated with anterograde biocytin and retrograde fluorescent techniques. Neurosci Res. 1991;10:149–155. doi: 10.1016/0168-0102(91)90037-y. [DOI] [PubMed] [Google Scholar]
- Parent A. Extrinsic connections of the basal ganglia. Trends Neurosci. 1990;13:254–258. doi: 10.1016/0166-2236(90)90105-j. [DOI] [PubMed] [Google Scholar]
- Rash JE, Staines WA, Yasumura T, Patel D, Furman CS, Stelmack GL, Nagy JI. Immunogold evidence that neuronal gap junctions in adult brain and spinal cord contain connexin-36 but not connexin-32 or connexin-43. Proc Natl Acad Sci U S A. 2000;97:7573–7588. doi: 10.1073/pnas.97.13.7573. [DOI] [PMC free article] [PubMed] [Google Scholar]
- Selemon LD, Goldman-Rakic PS. Longitudinal topography and interdigitation of corticostriatal projections in the rhesus monkey. J Neurosci. 1985;5:776–794. doi: 10.1523/JNEUROSCI.05-03-00776.1985. [DOI] [PMC free article] [PubMed] [Google Scholar]
- Sloper JJ, Powell TPS. Gap junctions between dendrites and somata of neurons in the primate sensori-motor cortex. Proc R Soc Lond B Biol Sci. 1978;203:39–47. doi: 10.1098/rspb.1978.0089. [DOI] [PubMed] [Google Scholar]
- Söhl G, Degen J, Teubner B, Willecke K. The murine gap junction gene connexin36 is highly expressed in mouse retina and regulated during brain development. FEBS Letters. 1998;428:27–31. doi: 10.1016/s0014-5793(98)00479-7. [DOI] [PubMed] [Google Scholar]
- Sotelo C, Korn H. Morphological correlates of electrical and other interactions through low-resistance pathways between neurons of the vertebrate central nervous system. Int Rev Cytol. 1978;55:67–107. doi: 10.1016/s0074-7696(08)61887-2. [DOI] [PubMed] [Google Scholar]
- Sotelo C, Palay SL. The fine structure of the lateral vestibular nucleus in the rat: II. Synaptic organization. Brain Res. 1970;18:93–115. doi: 10.1016/0006-8993(70)90459-2. [DOI] [PubMed] [Google Scholar]
- Sotelo C, Llinas R, Baker R. Structural study of inferior olivary nucleus of the cat: morphological correlates of electron coupling. J Neurophysiol. 1974;37:541–559. doi: 10.1152/jn.1974.37.3.541. [DOI] [PubMed] [Google Scholar]
- Sterio DC. The unbiased estimation of number and sizes of arbitrary particles using disector. J Microsc. 1984;134:127–136. doi: 10.1111/j.1365-2818.1984.tb02501.x. [DOI] [PubMed] [Google Scholar]
- Tepper JM, Koós T, Wilson CJ. GABAergic microcircuits in the neostriatum. Trends Neurosci. 2004;27:662–669. doi: 10.1016/j.tins.2004.08.007. [DOI] [PubMed] [Google Scholar]
- Traub RD, Bibbig A, LeBeau FE, Buhl EH, Whittington MA. Cellular mechanisms of neuronal population oscillations in the hippocampus in vitro. Annu Rev Neurosci. 2004;27:247–278. doi: 10.1146/annurev.neuro.27.070203.144303. [DOI] [PubMed] [Google Scholar]
- Updyke BV. Organization of visual corticostriatal projections in the cat, with observations on visual projections to claustrum and amygdala. J Comp Neurol. 1993;327:159–193. doi: 10.1002/cne.903270202. [DOI] [PubMed] [Google Scholar]
- Zsiros V, Maccaferri G. Electrical coupling between interneurons with different excitable properties in the stratum lacunosum-moleculare of the juvenile CA1 rat hippocampus. J Neurosci. 2005;25:8686–8695. doi: 10.1523/JNEUROSCI.2810-05.2005. [DOI] [PMC free article] [PubMed] [Google Scholar]
- Zsiros V, Aradi I, Maccaferri G. Propagation of postsynaptic currents and potentials via gap junctions in GABAergic networks of the rat hippocampus. J Physiol. 2007;576:527–544. doi: 10.1113/jphysiol.2006.123463. [DOI] [PMC free article] [PubMed] [Google Scholar]