

Abstract
We present for the first time direct electrophysiological evidence of the phenomenon of traveling electrical waves produced by populations of interneurons within the spinal cord. We show that, during a fictive rhythmic motor task, scratching, an electrical field potential of spinal interneurons takes the shape of a sinuous wave, “sweeping” the lumbosacral spinal cord rostrocaudally with a mean speed of ∼0.3 m/s. We observed that traveling waves and scratching have the same cycle duration and that duration of the flexor phase, but not of the extensor phase, is highly correlated with the cycle duration of the traveling waves. Furthermore, we found that the interneurons from the deep dorsal horn and the intermediate nucleus can generate the spinal traveling waves, even in the absence of motoneuronal activity. These findings show that the sinusoidal field potentials generated during fictive scratching could be a powerful tool to disclose the organization of central pattern generator networks.
Keywords: slow oscillations, scratching, dorsal horn neurons, scratch reflex, traveling waves, spinal cord
Introduction
Traveling electrical waves in the CNS have been described theoretically and experimentally in a variety of species and neural tissues (Ermentrout and Kleinfeld, 2001); however, to our knowledge there are no experimental studies about the functional role of these waves in the spinal cord. Here we present a description of an interesting phenomenon of traveling electrical waves in the cat spinal cord associated with fictive scratching.
Scratching is a motor task in which one hindlimb approaches the head and performs rhythmic movements to remove an irritating stimulus from a receptive area of the skin (Kuhta and Smith, 1990). It is well known that interneurons exhibiting rhythmic activity during scratching in the cat are located in the hindlimb enlargement of the spinal cord (Berkinblit et al., 1978a,b, 1981; Baev et al., 1981; Deliagina et al., 1983). Furthermore, there is evidence that, during scratching, the cat spinal cord exhibits sinusoidal-like cord dorsum potentials (CDPs) after a tonic CDP (Bayev and Kostyuk, 1981). Nonetheless, although many refined electrophysiological studies have been performed separately to determine either the “temporal activation” or the “location” of the spinal neurons during scratching (Berkinblit et al., 1978; Kuhta and Smith, 1990; Barajon et al., 1992; Kiehn and Kjaerulff, 1998; Orlovsky et al., 1999; Lafreniere-Roula and McCrea, 2005), there are no studies analyzing simultaneously the “spatiotemporal” sequence of activation of spinal interneurons. The analysis of this spatiotemporal organization of spinal neurons during a rhythmic motor task, such as scratching, is relevant to studies on spinal neuronal networks known as central pattern generators (CPGs).
The first aim of the present research was to analyze the spatiotemporal distribution of the sinusoidal CDPs and intraspinal field potentials generated by spinal interneurons during fictive scratching in the cat. We hypothesized that, during this motor task, there is a sequential rostrocaudal activation of interneurons, in the form of an electrical sinusoidal wave. We assumed that this wave travels with a defined trajectory and velocity, as was predicted by experimental and theoretical studies of the CPG for locomotion in lampreys, turtles, mice, rats, cats, and humans (Grillner et al., 1976, 1995; Wallén and Williams, 1984; Matsushima and Grillner, 1990, 1992; Roberts et al., 1998; Kotaleski et al., 1999; Bonnot et al., 2002; Yakovenko et al., 2002; Bem et al., 2003; Kaske et al., 2003; Kaske and Bertschinger, 2005; Stein, 2005; Ivanenko et al., 2006; Falgairolle and Cazalets, 2007). The second aim was to provide experimental evidence that the sinusoidal traveling wave can be generated by the electrical activity of a system of interneurons located in the deep dorsal horn and the intermediate nucleus, even in absence of motoneuronal activity. In this context, our study is novel and extends the spatiotemporal analysis of CPGs at the level of populations of spinal interneurons in vivo. This study is also relevant because the analysis of traveling electrical waves recorded with multielectrodes in the CNS may become a powerful tool to disclose in detail the organization of the CPG circuits.
Materials and Methods
In the present study, we used decerebrate and paralyzed cats and adapted an electroencephalographic (EEG) amplifier system of 32 channels (Neuroscan) to record spinal cord dorsum activity by means of a multielectrode array positioned on L4–S1 segments. To our knowledge, this method of recording spinal field potentials is novel, and it provides guidance in the selection of locations for micropipette recordings in the spinal cord.
Preparation
Experiments were performed in 28 adult cats (2.0–3.5 kg). For surgery, anesthesia was induced and maintained with halothane (1%) delivered in a mixture of 30% oxygen and 70% nitrous oxide. Atropine (0.05 mg/kg) and dexamethasone (2 mg/kg) were given at the beginning of surgery. Guidelines contained in the National Institutes of Health Guide for the Care and Use of Laboratory Animals (publication 85-23, revised in 1985) were strictly followed. The level of anesthesia was verified throughout the surgery by monitoring arterial blood pressure and by testing for the lack of withdrawal reflexes and muscle tone. The radial vein was cannulated to administer fluids and the carotid artery to monitor blood pressure. A bicarbonate (100 mm) and glucose (5%) solution was delivered intravenously throughout the experiment at a rate of 5 ml/h. Dextran and saline solutions were given as necessary to maintain blood pressure between 80 and 120 mmHg.
Bilateral tibialis anterior (TA), lateral gastrocnemius plus soleus (LGS), and medial gastrocnemius (MG) nerves were dissected. In another series of experiments (see below, Lesions of the ventral horn), the following nerves were also dissected: semimembranous and anterior biceps (SmAB), sartorius (Srt), extensor digitorum longus (EDL), and flexor digitorum longus (FDL). The lumbosacral and low thoracic spinal segments were exposed, and the dura mater was removed. After these surgical procedures, the animal was mounted on a stereotaxic apparatus using spinal and pelvic clamps. Pools were formed with the skin around the exposed tissues, filled with mineral oil (after placement of the electrodes), and maintained at a constant temperature (37°C). A mechanical precollicular–postmammillary decerebration was performed with removal of both cortices and all tissue rostral to the transection. After decerebration, the anesthesia was discontinued. The animals were paralyzed with pancuronium bromide (Pavulon; Organon) and artificially ventilated. At the end of the experiment, each animal was killed with an overdose of pentobarbital.
Electrophysiological recordings
Scratching was provoked by tactile stimulation of the ipsilateral pinna, or by tactile stimulation of other scratch reflex receptive fields located around the neck or the head, after the application of a piece of cotton impregnated with d-tubocurarine (0.1%) on the surface of the C1–C2 segments.
We recorded electroneurograms from the distal end of the sectioned nerves (Fig. 1). Spinal electrical activity (i.e., slow oscillations) was monopolarly recorded [in direct (DC) or alternating current (AC) mode] (Figs. 1, 2) on a Synamps EEG amplifier (NeuroScan) using a system of 30 Ag–AgCl electrodes (200 μm diameter) positioned on the surface of the lumbosacral L4–S1 spinal cord (Fig. 1) against an indifferent electrode placed on the paravertebral muscles. We constructed this multielectrode array in our laboratory and adapted it to the surface of the cat spinal cord (Manjarrez et al., 2005). The distance between electrodes was 5 mm along the rostrocaudal axis and 1 mm along the mediolateral direction. A careful identification of the L4 to S1 ventral roots allowed the precise positioning of the multielectrode system on the L4 to S1 spinal segments. Topographic maps were created using Scan 4.2 Software from NeuroScan. With the Synamps amplifier, we have the option to record in DC or AC modes. With the AC mode enabled, a decoupling single-pole resistance–capacitance high-pass filter (0.05 Hz, −6 dB/octave/pole) is switched into the signal path. In 23 experiments, we recorded in AC mode the cord dorsum potentials and electroneurograms with a 0.05–500 Hz bandpass filter with a sampling rate of 10 kHz. In some of these experiments (see Figs. 3–8), the cord dorsum potentials were refiltered at 1–70 Hz bandpass. In five other experiments (see Figs. 1, 2), we obtained recordings in DC mode of the cord dorsum potentials and electroneurograms with a wider DC–500 Hz bandpass filter. Furthermore, in some cases, we used additional amplifiers and the Digidata system (Molecular Devices) to record simultaneously the electroneurographic (ENG) activity (bandpass, 0.05 Hz to 30 kHz) from flexor and extensor nerves with a sampling rate of 10 kHz. In this case, we synchronized the recording of Synamps and Digidata using a trigger, consisting of transistor–transistor logic pulses produced by MASTER-8 pulse generator.
Figure 1.
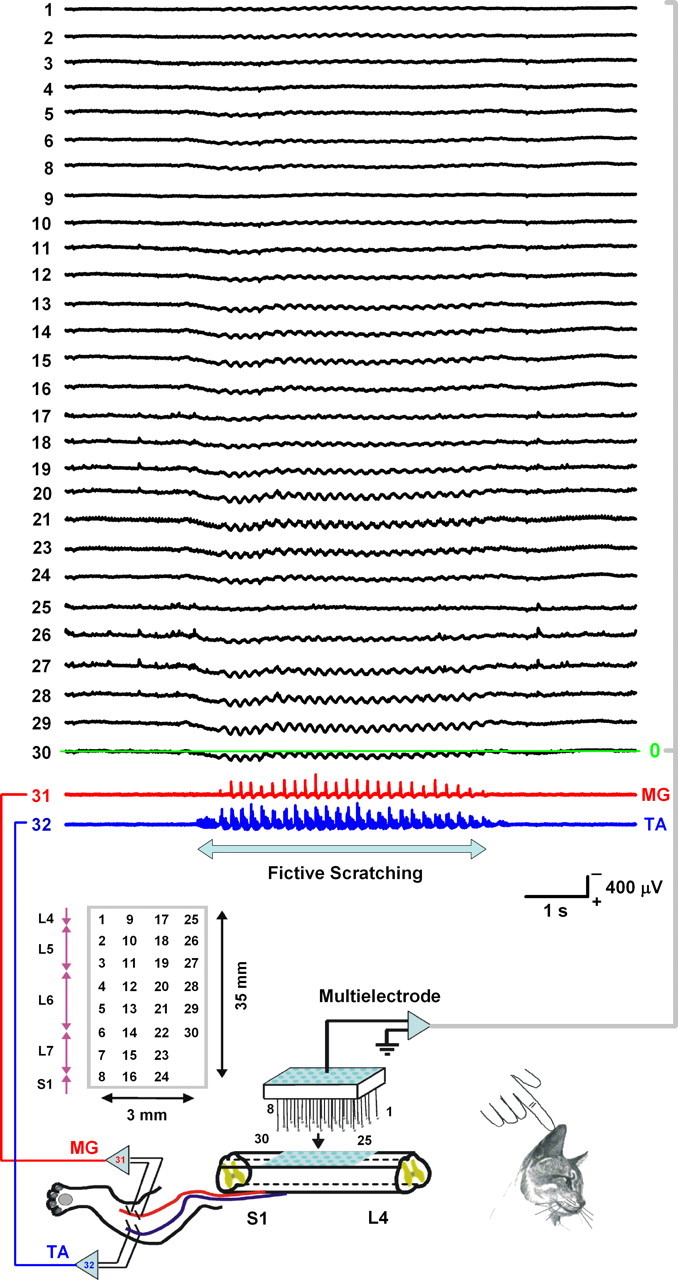
Multielectrode array for the simultaneous DC recording of CDPs and electroneurograms of extensor (MG) and flexor (TA) nerves during scratching. The rectangle indicates the positions of the electrodes from which the CDPs (1–30, black traces) were recorded. Red and blue traces show the MG and TA electroneurographic activity, respectively. Note the sinusoidal-like shape of the CDP waves and the slow positive potential associated with the initial tonic firing of TA during this episode of right scratching. The signals were filtered at DC–500 Hz bandpass.
Figure 2.
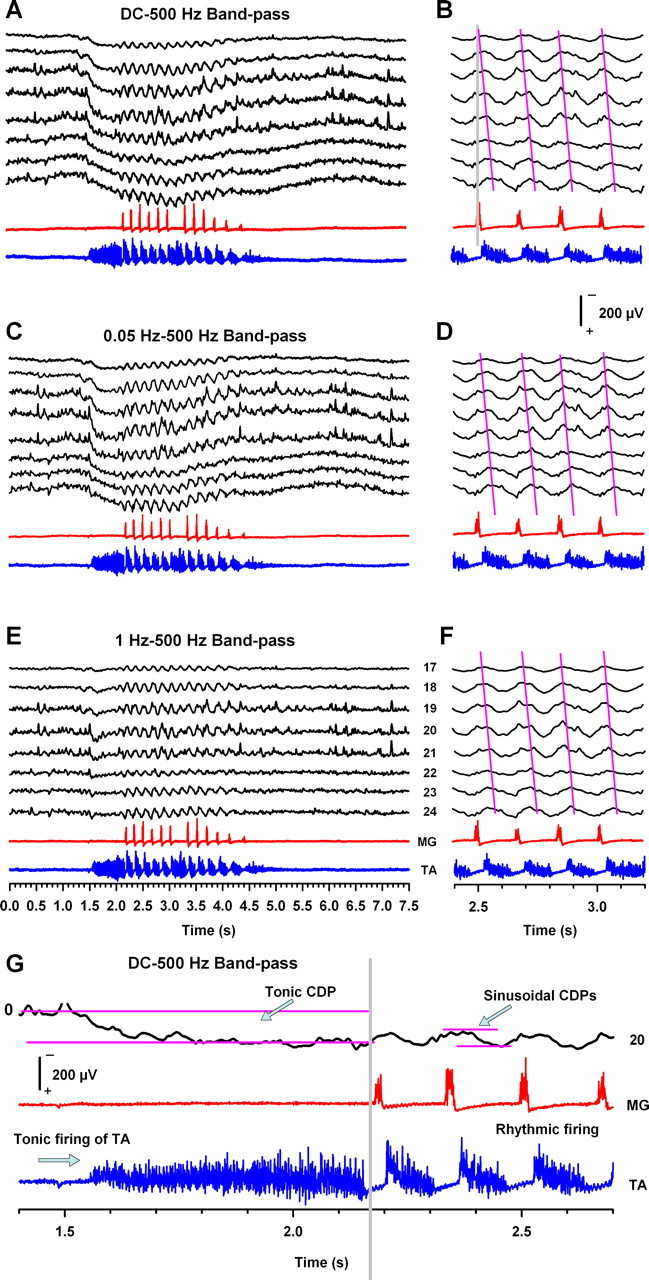
Recordings in DC mode (A, G) and in AC mode (C, E) of tonic CDPs and sinusoidal CDPs with three different bandpass filters (DC–500 Hz, 0.05–500 Hz, and 1–70 Hz). Traces in B, D, and F represent a zoom of recordings in A, C, and E. The magenta lines in B, D, and F indicate the phase gradient associated with the traveling CDPs for each scratching cycle at the indicated bandpass filters. The horizontal magenta lines in G illustrate how the amplitude for the tonic CDP and the sinusoidal CDPs were measured. Similar results were obtained from five cats.
Figure 3.
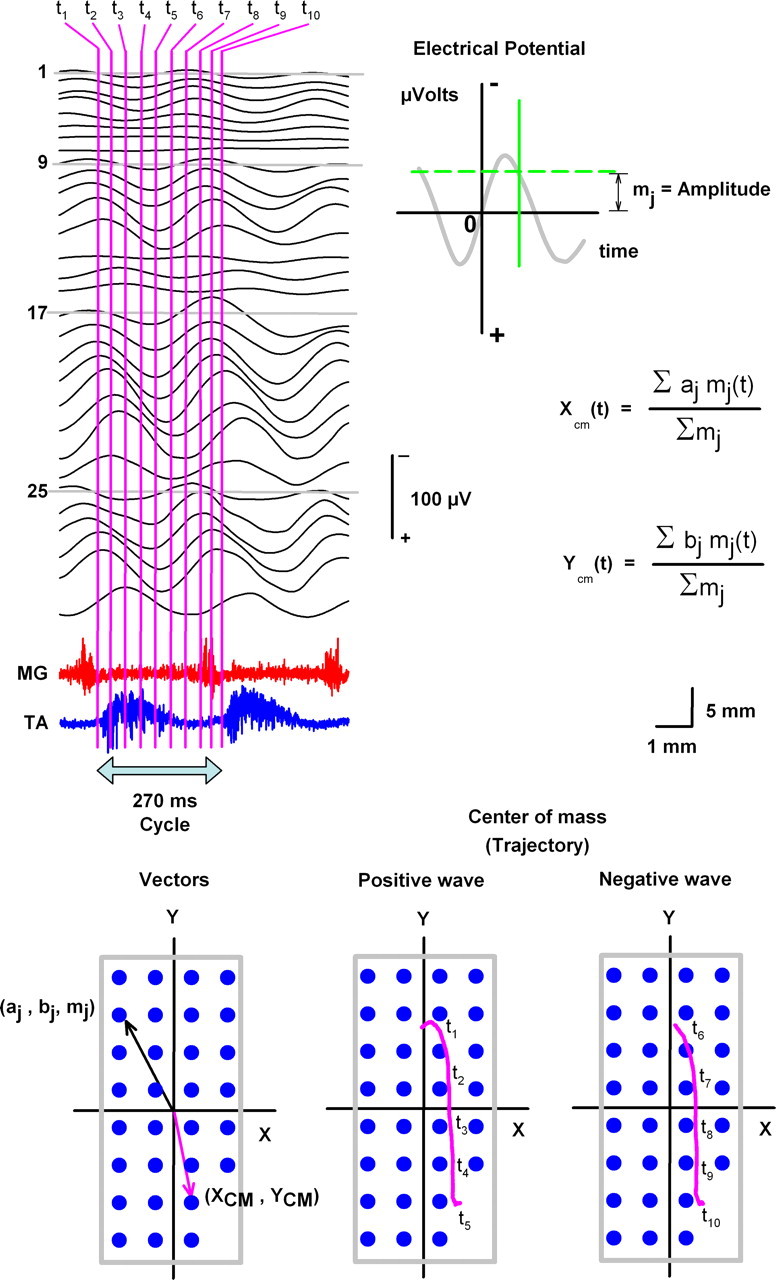
Center-of-mass method used to calculate trajectories of electrical spinal waves during scratching in one cat. Black traces (1–30), recordings of the sinusoidal CDPs during scratching, obtained with the multielectrode system illustrated in Figure 1. Such recordings were used to compute the center of mass (Xcm, Ycm) for the times indicated (from t1 to t10, i.e., a complete cycle). The formula to calculate the center of mass shows the coordinates for the electrode positions (aj, bj; see blue circles in the graphs) and the amplitude of the sinusoidal electrical potential (mj; see horizontal green line in the top graph). The trajectories of the center of mass for the positive and negative sinusoidal CDPs are illustrated with the pink lines on the right bottom graphs. The signals were refiltered at 1–70 Hz bandpass.
Figure 4.
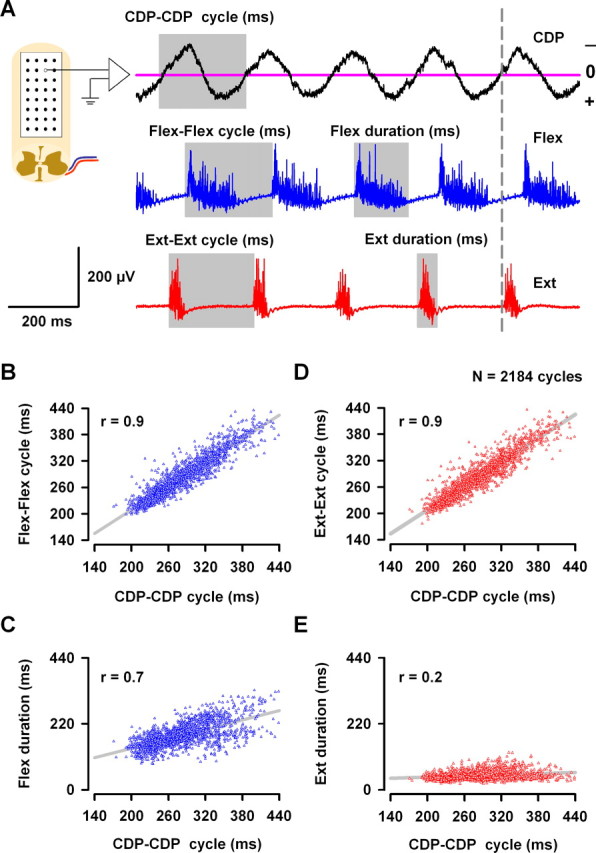
Correlations between the cord dorsum sinusoidal waves (sinusoidal CDP) and the flexor and extensor electroneurograms during scratching. A, Illustrative description of the measurements obtained. The cycle duration of the CDP sinusoidal waves (CDP–CDP cycle) was measured as a complete occurrence of one negative and one positive wave crossing by zero. The cycle duration of flexion (Flex–Flex cycle) of the TA nerve was measured from the beginning of the flexor burst to the beginning of the next flexor burst. The cycle duration of extension (Ext-Ext cycle) of MG or LGS nerves was measured from the beginning of the extensor burst to the beginning of the next extensor burst. The durations of the burst of flexor or extensor electroneurographic activity were measured as is indicated, covering only the zone with spike activity. B, CDP–CDP cycle associated with scratching versus the Flex–Flex cycle of the TA nerve. D, The same as B but for the Ext–Ext cycle of the MG nerve. C, E, The same as B and D but for the Flex duration and the Ext duration of the TA and MG (or LGS) bursts, respectively. Data were obtained from ∼2000 cycles measured from the scratching episodes in 22 cats. The sinusoidal CDP signals were refiltered at 1–70 Hz bandpass.
Figure 5.

A, Longitudinal distribution of the mean amplitude of sinusoidal (and tonic) cord dorsum potentials during scratching for five cats. B, Laminar distribution of intraspinal field potentials during scratching. The sinusoidal CDPs were used to average the intraspinal EFPs recorded at the indicated depths. The graph represents the grand average for the amplitude distribution of the EFPs versus the depth of recording obtained from seven cats. The histological reconstructions for the electrode trajectories are illustrated for four cats. The magenta circles indicate the depth in which the EFPs of maximal amplitude were obtained. C, Simultaneous recordings of sinusoidal CDPs, single interneuron (INT), and MG and TA electroneurograms. D, Correlation between the cycle of sinusoidal CDPs (CDP–CDP cycle) and the cycle of the interneuronal firing (INT cycle). E, Histological reconstructions of the L6 lumbar spinal cord for three cats. The symbols represent the location of 18 interneurons. For clarity, the symbols were colored.
Figure 6.
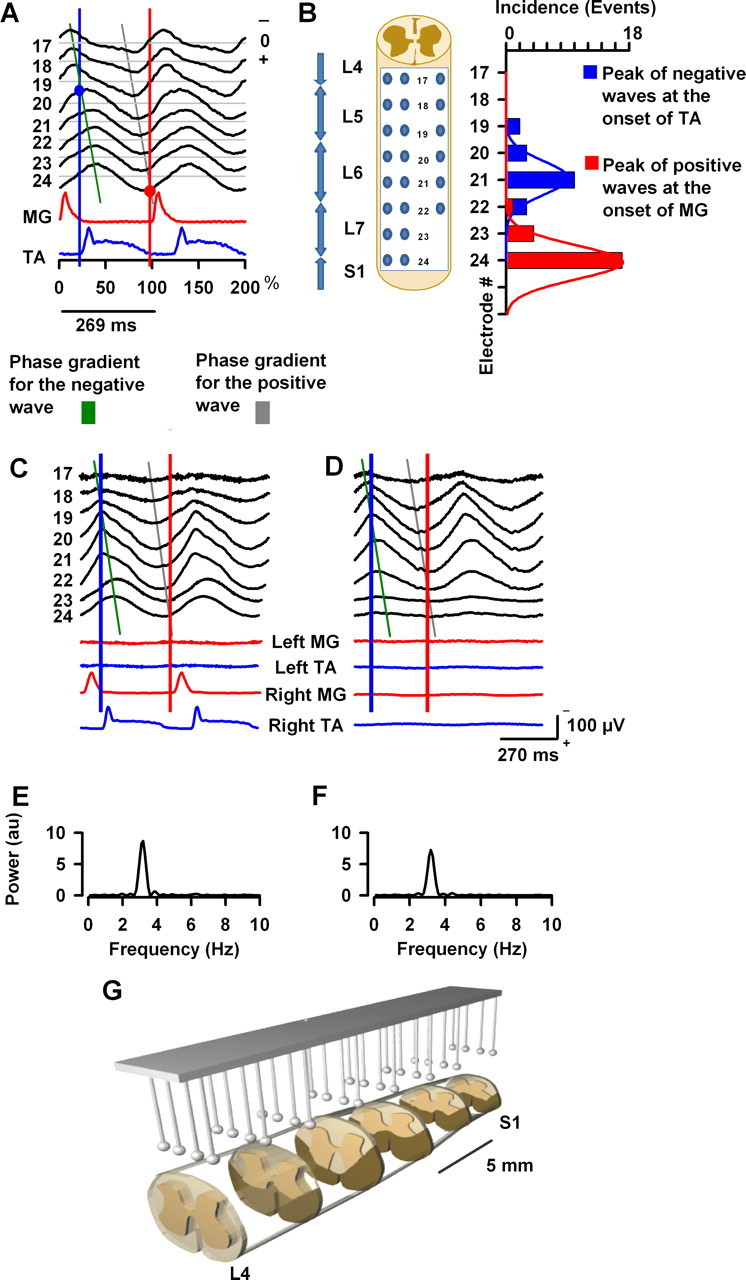
The sinusoidal field potentials during scratching propagate as a traveling wave. A, The traces indicated with electrodes 17–24 show averaged recordings of sinusoidal CDPs. MG and TA indicate the normalized, integrated, and rectified electroneurograms for the extensor medial gastrocnemius and flexor tibialis anterior nerves during scratching, respectively, for one cat. Each trace is the average of 95–200 normalized scratching cycles. Note that the peak of the negative component of the wave exhibits a phase gradient that occurs before and after the activation of the flexor TA nerve; in contrast, the peak of the positive component exhibits a phase gradient before the activation of the extensor MG nerve. The green and gray lines indicate the phase gradient in the sinusoidal-like CDPs. The blue and red circles show the points of intersection of the phase gradient lines and the vertical lines of the beginning for the flexor and extensor activity. B, Incidence of the negative or positive waves that immediately precedes the activation of flexor or extensor motoneurons, respectively, as is indicated by blue and red circles in Figure 6A versus the recording electrode (17–24). This graph was obtained from 18 cats for right scratching. C, D, The sinusoid-like cord dorsum potentials during scratching persist after the bilateral lesion of the ventral horn. C, Sinusoidal-like cord dorsum potentials and electroneurographic activity of the MG and TA nerves before the lesion of the ventral horn. The green and gray lines indicate the phase gradient in both conditions. D, The same as C but after the lesion of the ventral horn. Note that the sinusoidal potentials persist but the rhythmic activity in the nerves was abolished. E, F, Power spectra obtained from the sinusoidal cord dorsum potentials recorded with electrode 21. Au, Arbitrary units. G, Histological reconstruction of the lesions of the ventral horn in one cat. The sinusoidal CDP signals were refiltered at 1–70 Hz bandpass.
Figure 7.

The negative and positive sinusoid-like cord dorsum potentials during scratching propagate as a traveling wave with a mean velocity of 0.29 ± 0.12 and 0.32 ± 0.15 m/s, respectively. A, Averaged recordings of the positive and negative sinusoidal waves during right scratching for electrodes 17–24. The red and blue circles show the times used to obtain the graphs in the right panel. The first red and blue points in the recording from electrode 17 were taken as zero. After that, the following points were used to obtain a time interval Δt. This time interval Δt (in milliseconds) was plotted versus the position Δx (in millimeters) of the respective electrodes. The velocity (in meters per second) was calculated as the inverse of the slope in the linear part of the graphs, as is indicated by the formula. B, Recordings of intraspinal EFPs during scratching. These EFPs were recorded as is indicated in the illustrations and averaged (n = 64). Note that, when the micropipettes were separated by 3 mm, there was almost no appreciable propagation between the EFPs. However, when the micropipettes were separated by 22 mm, then the propagation was notable. The sinusoidal CDP signals were refiltered at 1–70 Hz bandpass.
Figure 8.
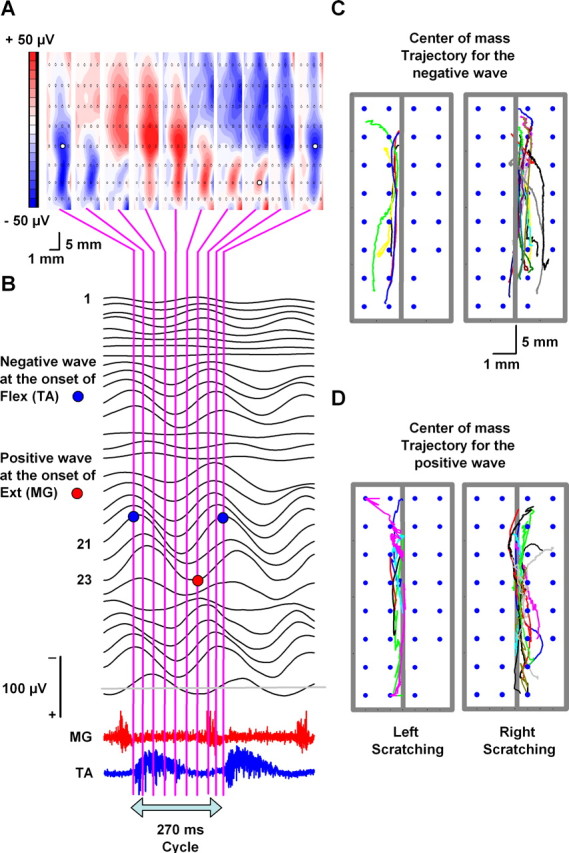
Topographical maps versus trajectories of the center of mass for traveling electrical waves in the cat spinal cord. A, Topographical maps calculated for 10 successive times as is indicated by the vertical lines in B. B, Recordings obtained with the multielectrode array during two cycles of extension–flexion. The red and blue circles indicate that there are positive and negative waves preceding the beginning of the extensor (MG) and flexor (TA) bursts. C, D, Superimposed trajectories in the conditions indicated (data obtained from 22 cats; each color represents the trajectory of a different cat). Note that, during the negative and positive phases of the traveling wave, the trajectories follow a rostrocaudal direction. Additionally, the ipsilateral (left or right) scratching was associated with ipsilateral trajectories of traveling waves, which resembled strips across the longitudinal axis of the spinal cord, from L4 to S1. The sinusoidal CDP signals were refiltered at 1–70 Hz bandpass.
In five experiments, we used glass micropipettes filled with NaCl (1.2 MΩ) to record extracellular field potentials (EFPs) during scratching, in regions in which sinusoidal CDPs of maximal amplitude were recorded with the multielectrode array. We performed simultaneous recordings of EFPs in two different lumbar segments. Furthermore, we characterized the intraspinal distribution of these EFPs during the occurrence of the traveling spinal waves. The intraspinal field potentials were filtered at 0.1–1000 Hz bandpass. To record the unitary activity of spinal interneurons firing during traveling spinal waves associated with the scratching cycles, we used 7–15 MΩ glass micropipettes filled with 1.2 m NaCl.
Lesions of the ventral horn
In three cats, we used an ophthalmic microcautery (with a low-temperature fine tip; Aaron Medical) to perform longitudinal lesions of the ventral horn. These lesions were made within the bilateral L4–S2 spinal segments. The laminectomy was wide enough to avoid rotation of the spinal cord and a possible trauma in the nonlesioned areas. The extension of the lesions was controlled by the observation of the rhythmic electroneurographic activity of some flexor and extensor nerves (SmAB, Srt, LGS, MG, TA, EDL, and FDL). The absence of the rhythmic activity of these nerves indicated that the associated motor nuclei were destroyed. After the experiments, the spinal cord was recovered for histological analysis.
Histology
Microelectrode placements and lesions of the ventral horn were verified by histology. At the end of each experiment, the micropipettes used were cut and left in place. The animal was then killed with an overdose of pentobarbital and perfused with 10% Formalin. After complete fixation and dehydration, the lumbosacral spinal cord was placed in a solution of methyl salicylate for clearing. The spinal cord with the segment containing the microelectrode was sectioned and photographed. To verify the extension of the lesions in the ventral horn, serial sections were obtained and photographed.
Data analysis
The center of mass of sinusoidal CDP traveling waves.
Recently, we published a method for the computation of trajectories of traveling electrical waves in the human brain (Manjarrez et al., 2007). Here we adapted this method to analyze in more detail trajectories of the spinal waves traveling during the scratching cycles. Figure 3 shows how the coordinates for the trajectories of the positive and negative components of the sinusoidal CDPs can be calculated by means of the center-of-mass formula. The procedure is straightforward. First, we calculate the amplitude (mj, i.e., “the mass”) of the positive and negative sinusoidal CDPs recorded with all the electrodes at different times (for clarity, Fig. 3 illustrates 10 different times from t1 to t10). Second, we introduce these amplitude values and the corresponding coordinates of the electrodes (aj, bj) in the center-of-mass formula. Third, we obtain two graphs of the coordinates of the center-of-mass (Xcm, Ycm), i.e., the trajectories for the positive and negative sinusoidal CDPs.
Characterization of the sinusoidal CDP and their relationship with the scratching cycle, statistical analysis.
Duration of the flexor and extensor phases were measured from individual cycles, and the zero crossings of the CDP recording of maximal amplitude were used to determine the cycle duration of the sinusoidal CDPs. We computed these durations from ∼2000 scratching cycles in 22 cats. A linear regression and a statistical significant level of p < 0.01 were used to analyze correlations between cycle durations of the sinusoidal CDPs and cycle durations of the flexor and extensor phases of scratching. Specifically, the Spearman's rank correlation method was used to test for significant correlations [Spearman's rank correlation coefficient (r); p < 0.01]. All results are given as mean ± SD.
Velocity of the sinusoidal CDP wave propagation.
The speed of wave propagation was measured from the row of electrodes 17–24 (for right scratching) or 9–16 (for left scratching). The velocity of the wave propagation was calculated using the equation (1/slope) of the linear correlation between the distance on the spinal cord and the measured delay (of the maximal negative CDP peak). This slope was obtained from a linear regression of the linear part of the corresponding sigmoid curve. A given velocity was obtained for each experiment.
Scratch-triggered averaging and normalization analysis of sinusoidal CDPs and electroneurograms.
The analysis of normalization, rectification, and integration of some data was made with the software developed in the Spinal Cord Research Centre at the University of Manitoba. We analyzed the propagation of the traveling spinal wave by means of the scratch-triggered averaging of the spinal electrical activity (see Fig. 6). The scratching cycles of TA activity during one episode of scratching were normalized and used to average the MG activity and the CDP recordings from all the electrodes positioned on the spinal cord.
Spectral analysis of sinusoidal CDPs.
We used Matlab software (MathWorks) to perform spectral analysis of sinusoidal CDPs. First, the electrophysiological signal was considered as a function g(t), and its Fourier transform G(f) was computed. Then the power spectrum was obtained: P(f) = |G(f)|2, with a resolution of 0.1 Hz.
Results
Figure 1 shows DC recordings of cord dorsum potentials (1 to 30) and electroneurograms (31 and 32) of MG and TA nerves during a typical fictive scratching episode in one cat. The filters were set at DC–500 Hz bandpass. Note the sinusoid-like waveform of the cord dorsum potential during a right scratching episode. We termed this electrical activity as “spinal electrical waves” or sinusoidal CDPs. Electrodes were positioned from L4 to S1 spinal segments. Note the clear positive tonic CDP during the initial tonic firing of the TA nerve for this right scratching.
Because the scratching episode is composed of an initial tonic firing of flexor motoneurons and a subsequent rhythmic activity of extensor and flexor motoneurons, we analyzed the CDP recordings during both stages: the tonic flexor and the rhythmic alternating activity. In five cats, we analyzed DC and AC recordings with the filters set at DC–500 Hz and 0.05–500 and 1–500 Hz bandpass. Figure 2A–G shows the results obtained from one animal, but similar results were observed in four other cats. We found that, during the tonic stage of the TA nerve, the DC recordings of the CDP exhibit a slow positive change in the amplitude (tonic CDP) (Fig. 2A–G). This tonic CDP was also evident when the recordings were filtered at 0.05–500 Hz bandpass (Fig. 2C) but disappeared when the recordings were filtered at 1–500 Hz bandpass (Fig. 2E). In this context, the filtering of the CDPs at 1–500 Hz bandpass can offer a limitation to visualize the tonic component of the CDP during scratching. However, note that the filtering in these bands does not alter the rostrocaudal phase gradient observed in the sinusoidal CDPs (Fig. 2B,D,F, magenta lines).
Figure 2G shows in detail DC-coupled recordings of the CDP from electrode 20 and of the MG and TA nerves. We found that, during the tonic discharge of the TA nerve, the DC-coupled recording of the CDP exhibits a slow positive shift (tonic CDP) in agreement with the AC recordings of the CDP during scratching reported by Bayev and Kostyuk (1981). Therefore, our technique can accurately describe the tonic CDP during the initial tonic firing of flexors.
We analyzed the amplitude of the tonic CDP versus the amplitude of the sinusoidal CDP recorded with the electrode 20 from 15 episodes in five cats. The horizontal magenta lines in Figure 2G illustrate how the amplitudes for the tonic CDP and the sinusoidal CDP were measured (all the sinusoidal CDPs from the episode were considered). We found that the mean amplitude of the tonic CDP from electrode 20 was ∼159% of the amplitude for the corresponding sinusoidal CDP (taken as 100%). Figure 5A shows that the relative amplitude of the sinusoidal CDP follows a similar distribution as the amplitude of the tonic CDP (mean ± SD).
The cycle duration of the sinusoidal CDP associated with scratching is highly correlated with the scratch cycle duration
Sinusoidal cord dorsum potentials exhibit a negative and positive peak during each scratching cycle when filtered at 1–70 Hz. Figure 4A illustrates five typical cycles recorded with 1 of the 30 electrodes and the corresponding alternating electroneurographic activity from flexor (TA) and extensor (MG) nerves. Cycles such as those illustrated in Figure 4A are repeated during the whole scratching episode.
Cycle duration of CDP and ENG activity were measured directly from the recordings filtered at 1–70 Hz (Fig. 4A). We selected the sinusoidal CDPs recorded from the electrodes 20 or 21 for right scratching or from the electrodes 12 or 13 for left scratching (region with the largest sinusoidal CDPs, as illustrated in Fig. 5A for right scratching). Figure 4B–E shows pooled data of ∼2000 cycles in 22 cats. Each point in these graphs corresponds to a single scratching cycle (obtained from 18 cats for right scratching and 4 cats for left scratching). Cycle duration of the sinusoid-like electrical activity during scratching (termed CDP–CDP cycle) showed a significant correlation with duration of flexion-to-flexion (Flex–Flex) cycle of the TA (Fig. 4B) and with duration of the extension-to-extension (Ext–Ext) cycle of the LGS or MG nerves (Fig. 4D). However, CDP–CDP cycle duration was correlated with the flexion duration (Fig. 4C) but not with the extensor duration (Fig. 4E).
Laminar distribution of intraspinal field potentials and rhythmic interneurons during scratching
Before the microelectrode recording (intraspinal field potentials or extracellular recording of single neurons), we analyzed the regions in which the amplitude of the sinusoidal CDPs was maximal. First, we computed the power spectra for the sinusoidal CDPs during scratching and analyzed the longitudinal distribution of the power spectra area from L4 to S1. Figure 5A shows the normalized distribution of sinusoidal and tonic CDPs (obtained from five cats for right scratching, but we obtained a similar distribution for right and left scratching). Second, microelectrodes were placed within the region of the spinal cord (L6) in which the sinusoidal CDPs were maximal (i.e., around surface electrodes 20 and 21).
To investigate the interneuronal activity associated with the spinal waves recorded on the spinal cord dorsum (i.e., the sinusoidal CDPs), we examined the intraspinal EFPs recorded concurrently. The EFPs were recorded with a micropipette at different depths of the spinal cord during scratching. The EFPs were averaged by using spinal sinusoid-like cord dorsum recordings as a trigger. Traces in Figure 5B illustrate typical EFP recordings obtained from one experiment. The top trace corresponds to the sinusoid-like spinal wave recorded on the surface of the spinal cord (CDP). Bottom traces correspond to recordings of EFPs at the indicated depths. It is notable that EFPs associated with scratching have a similar sinusoidal-like shape as that of the surface CDP potentials.
The graph in Figure 5B shows the mean amplitude distribution of the sinusoidal-like EFPs during scratching for seven cats and the histological reconstructions of micropipette tracks from four experiments. The magenta circles illustrated in Figure 5B indicate the region in which the sinusoidal EFPs of maximal amplitude were recorded. Note that these EFPs were mostly found below the dorsal horn, in the intermediate nucleus (lamina VII).
In three experiments, we recorded extracellularly the activity of 18 single interneurons during scratching. Microelectrodes were placed within the region of the spinal cord (L6) in which sinusoidal CDPs were maximal (i.e., around surface electrodes 20 and 21). Figure 5C illustrates an interneuron firing rhythmically during the extension phase of scratching and with the sinusoidal CDP waves. The cycle of the interneuronal activity was measured from the onset of the interneuronal burst to the onset of the subsequent interneuronal burst, regardless the profile of activity (flexor, extensor, or transitional).
The graph in Figure 5D shows pooled data of 1087 cycles from 18 neurons versus the corresponding sinusoidal CDP–CDP cycles. Note the high correlation (r = 0.8) between the sinusoidal CDP–CDP cycles and the interneuronal bursting cycles. The colored symbols illustrated in Figure 5E indicate the region in which we recorded interneurons firing in synchrony with the sinusoidal CDPs. Note that these interneurons were found in lamina VII and in the ventral horn (12 of 18). Only 6 of 18 interneurons were recorded in the dorsal horn, in laminae IV–VI.
The sinusoidal CDPs during scratching propagate as a traveling wave
We analyzed the propagation of the traveling spinal wave by means of the scratch-triggered averaging of the spinal electrical activity (Fig. 6). The scratching cycles of TA activity during one episode of scratching were normalized and used to average the MG activity and the CDP recordings from all the electrodes positioned on the spinal cord. Figure 6A shows the normalized recordings obtained from one cat, but we observed the same in 18 cats. For clarity in Figure 6A, we only show the averaged CDPs from electrodes 17–24 and the averages of ipsilateral MG and TA activity.
We observed that, for all of the cats, these sinusoidal peaks exhibit a phase gradient from rostral to caudal regions of the spinal cord. In Figure 6A, typical phase gradients are indicated with green and gray lines for the negative and positive CDPs, respectively. Note that the maximal negative sinusoidal peak recorded with electrode 17 occurs before the maximal negative peak recorded with electrode 24.
Blue circle in Figure 6A shows that the onset of TA electroneurograms coincides with the peak of the negative wave in electrode 20 (see intersection of the green line and the vertical blue line). Furthermore, red circle in Figure 6A shows that the onset of the MG electroneurogram coincides with the peak of the positive wave in electrode 24 (see intersection of the gray line and the vertical red line).
Figure 6B shows a graph (obtained from 18 cats) for the incidence of negative (blue) or positive (red) components of the sinusoidal waves intercepting the vertical lines and the lines of the phase gradient (Fig. 6A). Note that, for right scratching, the largest incidence of negative waves occurs mostly around electrode 21; however, the largest incidence of positive waves occurs mostly in electrode 24. The blue vertical arrows in Figure 6B indicate the approximate location of the spinal segments. The graph of incidence illustrated in Figure 6B shows that the negative waves occurring at the onset of the TA electroneurogram are distributed within the L6 segment; however, the positive waves with peaks occurring at the beginning of the MG electroneurogram are distributed around the S1 segment.
Sinusoidal CDPs during scratching remain after a longitudinal lesion of the ventral horn
The distribution of EFP amplitude (depth >3500 μm) in the graph of Figure 5B indicates that, during the sinusoidal cord dorsum potentials, the neurons in the ventral horn are active. It is likely that such ventral horn neurons correspond to motoneurons concomitantly active during scratching and that their electrical activity was detected by the intraspinal microelectrode. Therefore, to elucidate whether the sinusoidal cord dorsum potentials can be generated independently of the motoneuronal activity, we performed a longitudinal, and bilateral, lesion of the ventral horn (see Materials and Methods). Figure 6C–G shows results obtained from one cat, but we observed similar results in two other cats. Figure 6C–D shows that the sinusoidal cord dorsum potentials and the phase gradient persist after the lesion of the ventral horn from L4 to S2. We observed that the lesion of the ventral horn produced a reduction in the amplitude of the sinusoidal potentials with no change in frequency, as revealed from the mean power spectra of the sinusoidal potentials of maximal amplitude recorded from three cats (Fig. 6E,F). Note the absence of ENG activity in left and right nerves (Fig. 6D). Figure 6G shows a three-dimensional histological reconstruction of the bilateral lesion performed through L4 to S1 in the ventral horn for one cat.
Variable propagation speed of the sinusoidal CDPs during scratching
We computed the mean velocity of propagation of the traveling waves for all of the scratching episodes in 22 cats. This velocity was obtained from the averaged and normalized sinusoidal-like CDPs recorded from the row of electrodes 17–24 (for right scratching) and 9–16 (for left scratching). The procedure for normalization in Figure 7A was the same as in Figure 6. The normalized recordings were used to compute the velocity of the traveling wave. The mean velocity of the positive and negative CDP waves (for 22 cats) was obtained from the phase gradient, as illustrated with red circles (maximal positivity) or blue circles (maximal negativity) in Figure 7A. Typical phase gradients (Δt, in milliseconds) versus the relative position of the row of recording electrodes (Δx, in millimeters) are shown in the graphs of Figure 7A for one cat. The mean velocity was obtained from (1/slope) of the linear part of the curve (by means of the formula depicted in Fig. 7A). We observed that the range of mean velocities for the traveling waves during scratching is restricted between 0.09 and 0.79 m/s, with a mean velocity of 0.29 ± 0.12 m/s for negative and 0.32 ± 0.15 m/s for positive waves in all the cats we examined. The mean velocities for the negative waves were not significantly different from the mean velocities for the positive waves (p > 0.5, Student's, t test).
In summary, in 22 cats, we analyzed up to 2184 left and right scratching cycles, the duration of the sinusoidal CDP–CDP cycle, the cycle flexion–flexion and extension–extension, the duration of the flexor and extensor bursts, and the velocity of the negative and positive components of the spinal electrical waves (Table 1). The last column of Table 1 indicates the number of left (L) or right (R) scratching cycles analyzed in each cat.
Table 1.
Scratching cycles, duration of the sinusoidal CDP–CDP cycle, cycle flexion–flexion and extension–extension, duration of the flexor and extensor bursts, and velocity of the negative and positive components of the spinal electrical waves in 22 cats analyzed
| Cat | Velocity negative wave (m/s) | Velocity positive wave (m/s) | Flexion–flexion cycle (ms) | Flex (ms) | Extension–extension cycle (ms) | Ext (ms) | Sinusoidal CDP–CDP cycle (ms) | Scratching cycles # |
|---|---|---|---|---|---|---|---|---|
| 05120 | 0.5 ± 0.15 | 0.1 ± 0.03 | 364 ± 13 | 192 ± 13 | 362 ± 10 | 159 R | ||
| 06222 | 0.36 ± 0.37 | 0.27 ± 0.17 | 347 ± 73 | 230 ± 52 | 352 ± 16 | 85 R | ||
| 06228 | 0.1 ± 0.04 | 0.17 ± 0.04 | 257.6 ± 26.2 | 150.2 ± 24.3 | 257.3 ± 26.3 | 42.1 ± 6.07 | 270 ± 36 | 41 R |
| 06314 | 0.44 ± 0.22 | 0.47 ± 0.12 | 286 ± 18 | 209 ± 16 | 286 ± 18 | 19 R | ||
| 06328 | 0.42 ± 0.44 | 0.26 ± 0.25 | 284.3 ± 23.3 | 196.9 ± 18.6 | 284.7 ± 23.2 | 51.98 ± 10.5 | 283 ± 24 | 80 R |
| 06525 | 0.24 ± 0.36 | 0.35 ± 0.18 | 287.9 ± 24.4 | 181.3 ± 29.2 | 287.7 ± 24.5 | 52.42 ± 18.6 | 304 ± 38 | 78 R |
| 06606 | 0.17 ± 0.23 | 0.35 ± 0.31 | 291.3 ± 25.5 | 171.2 ± 22.7 | 291.5 ± 27.2 | 55.6 ± 16.09 | 287 ± 7 | 98 L |
| 06704 | 0.25 ± 0.25 | 0.4 ± 0.51 | 262 ± 20 | 186 ± 18.3 | 261.7 ± 21 | 37.9 ± 6 | 242 ± 32 | 59 R |
| 06822 | 0.38 ± 0.03 | 0.43 ± 0.09 | 253.1 ± 21.3 | 50.5 ± 7.5 | 253.1 ± 20.8 | 26.9 ± 3.2 | 254 ± 27 | 176 R |
| 06831 | 0.19 ± 0.12 | 0.29 ± 0.21 | 282.6 ± 38.2 | 160.6 ± 14.7 | 279.9 ± 40.5 | 69.47 ± 19.2 | 268 ± 22 | 102 L |
| 06921 | 0.23 ± 0.12 | 0.35 ± 0.14 | 331.4 ± 34.1 | 255 ± 28.5 | 331 ± 37.5 | 68.4 ± 12.5 | 313 ± 5 | 85 R |
| 06929 | 0.11 ± 0.02 | 0.11 ± 0.03 | 279.1 ± 23.9 | 175.9 ± 17.8 | 280.1 ± 25.14 | 49.1 ± 11.89 | 252 ± 35 | 80 R |
| 061010 | 0.16 ± 0.07 | 0.12 ± 0.02 | 227.8 ± 2.4 | 179.95 ± 10.94 | 228.09 ± 4.56 | 27.73 ± 4.63 | 238 ± 8 | 13 R |
| 07111 | 0.24 ± 0.18 | 0.53 ± 0.21 | 234.1 ± 19.4 | 140.4 ± 15.3 | 233.2 ± 20.56 | 50.89 ± 9 | 239 ± 24 | 79 R |
| 07125 | 0.12 ± 0.05 | 0.1 ± 0.02 | 302.9 ± 38 | 221 ± 29 | 302.6 ± 38.2 | 43.1 ± 6.9 | 306 ± 59 | 118 R |
| 07223 | 0.37 ± 0.04 | 0.53 ± 0.0.14 | 248.1 ± 23.8 | 156.3 ± 13.4 | 248 ± 24.5 | 44.6 ± 7.7 | 256 ± 26 | 260 R |
| 07301 | 0.31 ± 0.37 | 0.19 ± 0.07 | 363.7 ± 26.7 | 177.4 ± 34.9 | 363.8 ± 24.5 | 43.6 ± 10.3 | 227 ± 59 | 129 R |
| 07308 | 0.39 ± 0.44 | 0.4 ± 0.23 | 381.4 ± 79.3 | 242.2 ± 66.2 | 380 ± 77.9 | 39.9 ± 4.3 | 353 ± 72 | 28 R |
| 07329 | 0.42 ± 0.21 | 0.63 ± 0.1 | 246.2 ± 23 | 171.2 ± 11.3 | 245.7 ± 22.9 | 44.2 ± 5.5 | 246 ± 27 | 164 R |
| 07426 | 0.33 ± 0.19 | 0.44 ± 0.06 | 343.8 ± 22.1 | 244.4 ± 20.4 | 343.5 ± 23.2 | 41.2 ± 7.48 | 344 ± 26 | 115 L |
| 07621 | 0.46 ± 0.12 | 0.42 ± 0.03 | 293.15 ± 22.8 | 127.1 ± 53.7 | 293.3 ± 23.1 | 37.5 ± 8.3 | 292 ± 24 | 116 R |
| 07712 | 0.29 ± 0.12 | 0.29 ± 0.15 | 235.46 ± 20.1 | 120.8 ± 17.2 | 235.1 ± 20 | 38.4 ± 5.1 | 236 ± 23 | 100 L |
| Mean ± SD | 0.29 ± 0.12 | 0.32 ± 0.15 | 291.0 ± 45.9 | 179.0 ± 46.6 | 284.2 ± 44.0 | 45.5 ± 11.1 | 282.2 ± 41.9 | 2184 |
R, Right; L, left.
The intraspinal field potentials during scratching propagate as a traveling wave
By means of the multielectrode array system, we observed that, during scratching, the sinusoidal spinal waves propagate in the lumbosacral segments with a rostrocaudal gradient. To investigate whether an associated intraspinal wave is also traveling rostrocaudally, we obtained during scratching simultaneous recordings of EFPs from two segmental regions of the spinal cord within L4–S1 separated by different longitudinal distances (from 8 to 22 mm regardless of a determined segment of reference). Furthermore, recordings of EFPs in close proximity (∼3 mm) were obtained. The EFP recordings were performed within the intermediate nucleus, the region in which the EFPs of maximal amplitude were found (∼1700–2100 μm). The EFPs were averaged (n = 64) and the phase gradient computed. In all of the cases, we observed a rostrocaudal phase gradient of EFPs. We observed that, when the microelectrodes were positioned in close proximity (3 mm), the phase gradient between EFPs was very small (almost the same) (Fig. 7B, left). In contrast, when the microelectrodes were separated by a distance of 22 mm, a clear high phase gradient between EFPs was observed (Fig. 7B, right). The mean speed of the traveling EFPs in five experiments was 0.28 ± 0.22 m/s (mean ± SD) for the positive wave and 0.25 ± 0.22 m/s for the negative wave (microelectrodes separated from 8 to 22 mm).
The center of mass of electrical spinal waves
We analyzed in more detail the propagation of the negative and positive phases of the traveling spinal wave during scratching. We used two-dimensional topographical maps and analysis of the center of mass of the spinal electrical activity to reveal wave propagation trajectories (see Materials and Methods). Figure 3 provides an illustrative description of the method. The ordered pairs (aj, bj) indicate the fixed positions of the recording electrodes, and the values mj indicate the amplitudes of the wave measured at those positions. The ordered pairs [Xcm(t), Ycm(t)] show positions of the center of mass as a function of time (t). Figure 3 shows with a dashed green line how the mass was measured from the electrical potential. We considered the mass as the voltage value at time t. This mass was represented with the symbol mj(t), and their units are in microvolts. That means that the mass mj(t) represents the amplitude of the field potential recorded with the electrode in the position (aj, bj). The center of mass [Xcm(t), Ycm(t)] was computed using the straightforward formula indicated in Figure 3. The corresponding trajectories for the positive and negative traveling waves are shown in Figure 3 from t1 to t10, as indicated.
Figure 8A shows an example of topographical maps obtained from one cat for the positive and negative traveling waves at 10 successive times. The color scale in Figure 8A indicates in blue (and red) the regions in which the maximal negativity (and positivity) occurs. Note that both of the maps in blue and red propagate from the rostral to the caudal regions of the spinal cord. We selected those times from the onset of the flexor burst to the onset of the subsequent flexor burst, covering a complete cycle of flexion–extension. In the example depicted in Figure 8A, the positive wave (red map) “sweeps” mostly from electrodes 17–24 (to locate the electrode numbers, see Fig. 1), through the right side of the spinal cord.
Figure 8, C and D, shows the superimposed trajectories of the negative and positive waves obtained from all the episodes in all the cats that exhibited scratching in the left and right side of the spinal cord, as indicated. The mean velocity of propagation associated with these trajectories (for negative and positive waves) was ∼0.26 ± 0.25 m/s. These results also suggest that, during scratching, there is clear spinal wave propagation in a rostrocaudal direction.
We reproduced the results of Figures 3–8 from DC recordings of sinusoidal CDPs (five other experiments) with filters set at DC–500 Hz, 0.05–500 Hz, and 1–70 Hz bandpass, thus showing that the filtering at these bands does not alter our conclusions. Also, we must note that the “positive” and “negative” CDP waves represent values around a zero voltage AC signal for the filtered signals. However, we also must indicate that the “upward” and “downward” sinusoidal CDP waves represent voltage changes around a particular voltage DC signal. That means that the characteristic sinusoidal shape of the CDPs remains when the signals are filtered at DC–500 Hz, 0.05–500 Hz, and 1–70 Hz bandpass. Therefore, we could say that our conclusions related to the sinusoidal CDP waves are not altered when these waves are filtered at the bands indicated.
Discussion
In the present study, we observed that, during fictive scratching, the rhythmic activity of spinal neurons propagates as a rostrocaudal sinusoid-like wave along the ipsilateral lumbar segments with a similar velocity for the negative (0.29 ± 0.12 m/s) and the positive (0.32 ± 0.15 m/s) waves (Table 1). The propagation of this spinal wave was detected on the surface of the spinal cord as a sinusoidal CDP and within the lamina VII as a sinusoidal focal field potential. These results were reproducible across cycles of flexion–extension for all the animals studied. This is the first description of a spreading sinusoid-like wave process recorded in vivo in the spinal cord operating at a frequency of the scratching rhythm in the cat.
The sinusoidal CDP during scratching seems to represent the activity of the CPG itself, as well as the activation of its “outputs” or “followers,” like the activity of the interneurons mediating primary afferent depolarization (PAD). As a matter of fact, the sinusoidal CDP precedes the PAD with a significant phase shift (our unpublished observations). Thus, we suggest that the sinusoidal CDP represents to a great extent a measure of the activity of CPG interneurons with bursting activity during scratching, as was also demonstrated with the recording of single interneurons (from the deep dorsal horn and intermediate nucleus) firing in synchrony with the sinusoidal CDP (see location and activity of these interneurons in Fig. 5C–E).
Propagation of electrical waves in the spinal cord is not attributable to the volume conductor
The observations depicted in Figure 5A strengthen the hypothesis that the propagation of electrical activity of spinal neurons during scratching is not an epiphenomenon. Because the amplitude distribution of sinusoidal CDPs exhibits a bell shape (Fig. 5A), we suggest that the rostrocaudal propagation of these field potentials from L4 to S1 is not the result of a simple volume-conductor effect, which is known to produce an exponential decrease (and not a bell shape) in the amplitude of field potentials along the neural tissue.
Another interesting observation is that, at the L6 segment, the velocity of the traveling wave is lower than the velocity at L4 or S1, which is consistent with the fact that the amplitude of field potentials is larger at the L6 segment than at the rostral L4 or caudal S1 segments. Figure 7A shows that the “instantaneous” velocity (Δx/Δt) is higher at the beginning and end of the cycle but slower at the intermediate part of the cycle (when the wave is traveling from electrodes 19–22, i.e., traveling along the L6 segment during right scratching). This observation suggests that this process does not occur with a constant velocity, which is consistent with previous reports regarding the variable velocity of motor activation during locomotion in the in vitro preparation of the rat spinal cord (Cazalets, 2005). In this context, the slower traveling wave in the middle of the cycle at L6 could be associated with a recruitment of a larger number of neurons in the middle of the scratching cycle at the L6 lumbar segment. This argument can be justified because the L6 lumbar segment is also associated with the traveling potentials of maximal amplitude, which may be generated by a large number of interneurons, thus explaining the characteristic bell shape for the amplitude distribution of the sinusoidal CDPs during scratching (Fig. 5A).
Intraspinal location of neurons associated with sinusoidal traveling waves during scratching
The results illustrated in Figure 5, B and E, are consistent with the extensive electrophysiological study performed by Berkinblit et al. (1978a,b) and Bayev et al. (1981), about the “laminar location” of spinal neurons during scratching. Many of the rhythmically modulated interneurons in the study by Berkinblit et al. (1978b, their Fig. 3) are located in the intermediate nucleus and very deep in the ventral horn. In fact, a very small fraction of the modulated neurons by Berkinblit et al. (1978b) are in the dorsal horn, as is illustrated in our Figure 5E for those neurons firing in synchrony with the sinusoidal CDPs.
Our results illustrated in Figure 5B are also consistent with histological studies performed in cats. These studies show c-fos-positive neurons in the dorsolateral part of the ventral horn and in the intermediate nucleus, ipsilaterally to the scratching side (Barajon et al., 1992). However, Barajon et al. (1992) did not evaluate the presence of c-fos-labeled neurons within the L6 segment and only reported the distribution of neurons associated with scratching in the caudal segments L7 and S1, the segments in which we observed the smallest sinusoidal CDPs (Fig. 5A). Therefore, based on our results, we predict that a c-fos study from the L6 segment will show some cell bodies in the deep dorsal horn (laminae IV–VI), as is suggested by Figure 5E.
Furthermore, because a longitudinal and bilateral lesion of the ventral horn from L4 to S1 segments did not abolish the sinusoidal CDPs (Fig. 6C–G), we assume that these sinusoidal potentials can be produced by the cumulative electrical activity of populations of spinal interneurons located in the deep dorsal horn and intermediate zone.
Evidence suggesting a rostrocaudal activation of spinal neurons during rhythmic movement
The idea that the CPG architecture is rostrocaudally distributed is supported by many theoretical (Wadden et al., 1997; Kotaleski et al., 1999; Bem et al., 2003; Kaske et al., 2003; Kaske and Bertschinger, 2005) and experimental studies of motoneuron or electromyographic (EMG) activity mainly performed on fish (Grillner et al., 1976), lampreys (Wallén and Williams, 1984; Matsushima and Grillner, 1990, 1992; Grillner et al., 1995), tadpoles (Roberts et al., 1998), cats (Yakovenko et al., 2002), mouse (Bonnot et al., 2002), and humans (Ivanenko et al., 2006). Furthermore, in cats (Yakovenko et al., 2002) and humans (Ivanenko et al., 2006), a dynamic model based on anatomical data of motoneuron locations and EMG recordings suggests that, during the locomotor cycle, there is a rostrocaudal activation of lumbosacral motoneurons. A spatiotemporal propagation of motoneuron activation has also been observed using optical and electrophysiological recordings in the neonatal mouse (Bonnot et al., 2002) and by analyzing kinematic, anatomical, and electrophysiological data in the newborn rat (Falgairolle and Cazalets, 2007). However, in all these studies, the electrical activity of populations of spinal interneurons involved in the CPG was not recorded. In this context, the present study is novel and approaches the spatiotemporal analysis of CPGs toward population level of the spinal interneurons, thus extending previous studies on the spatiotemporal distribution of motoneurons or EMG activity during locomotion in cats (Yakovenko et al., 2002) and humans (Ivanenko et al., 2006).
The results in Figure 6B are consistent with those obtained from the study of the anatomical distribution of motoneuron pools in the cat spinal cord (Yakovenko et al., 2002) (see also Romanes, 1964; Vanderhorst and Holstege, 1997). Note the similarity between the incidence of the negative (or positive) waves associated with scratching and the rostrocaudal distribution of TA (or MG) motoneuron pools active during scratching, which is consistent with previous studies on locomotion (Yakovenko et al., 2002).
Our results support the notion that neurons belonging to the CPG are rostrocaudally activated and that there is a traveling wave associated with this sequential activation. In contrast, Yakovenko et al. (2002) noted that there is a dramatic transition from one anatomical locus of the motor pool to another rather than a traveling wave. An explanation for this apparent discrepancy is that these authors incorporated the EMG profiles recorded during real locomotion into their simulation. Thus, the transitions might have been imposed by the sensory feedback (Pearson and Duysens, 1976), which is not operating during fictive scratching, as in our case. However, other plausible explanation for this apparent discrepancy is that there are likely more excitatory and inhibitory interneurons belonging to the “CPG itself” and the “CPG outputs” than motoneurons commanding the muscles. In this context, we suggest that a parallel organization of the CPG (with traveling waves) and the motoneuronal pools (with dramatic activations from one anatomical locus to another) is possible.
Our results about the rostrocaudal propagation of the sinusoidal CDP traveling wave differ from those reported by Bayev and Kostyuk (1981, their Fig. 5). These authors show results from just one cat in which the sinusoidal CDPs recorded at L3, L5, and S1 are synchronized. We do not have an explanation for this discrepancy, but our results are based on the analysis of a considerable number of cats and the analysis of EFPs.
Deliagina et al. (1981) found that, during fictive scratching, there is a phase delay of ∼20 ms between the activation of Srt compared with the activation of TA and EDL and of ∼70 ms between vasti and MG. These delays suggest that there is actually a sequential activation of flexors and extensors operating at two different joints (hip and ankle) and located at different spinal segments. In the present study, we found a traveling CDP sweeping the spinal cord with a comparable delay between L4 and S1 segments. In this context, our results also suggest a parallel organization of interneuronal systems generating the traveling sinusoidal CDPs and the motoneuronal pools.
Footnotes
This work was supported by the following grants: CONACyT F1–62610 (E.M.) and VIEP-PIFI-FOMES-BUAP-Puebla (E.M.), México. We thank A. Carapia for technical assistance and Dr. S. Hochman for critical reading of this manuscript.
References
- Baev et al., 1981.Baev KV, Degtyarenko AM, Zavadskaya TV, Kostyuk PG. Activity of lumbosacral interneurons during fictitious scratching. Neurophysiology. 1981;13:45–52. [Google Scholar]
- Barajon et al., 1992.Barajon I, Gossard JP, Hultborn H. Induction of fos expression by activity in the spinal rhythm generator for scratching. Brain Res. 1992;588:168–172. doi: 10.1016/0006-8993(92)91359-m. [DOI] [PubMed] [Google Scholar]
- Bayev and Kostyuk, 1981.Bayev KV, Kostyuk PG. Primary afferent depolarization evoked by the activity of spinal scratching generator. Neuroscience. 1981;6:205–215. doi: 10.1016/0306-4522(81)90056-7. [DOI] [PubMed] [Google Scholar]
- Bem et al., 2003.Bem T, Cabelguen JM, Ekeberg O, Grillner S. From swimming to walking: a single basic network for two different behaviors. Biol Cybern. 2003;88:79–90. doi: 10.1007/s00422-002-0340-3. [DOI] [PubMed] [Google Scholar]
- Berkinblit et al., 1978a.Berkinblit MB, Deliagina TG, Feldman AG, Gelfand IM, Orlovsky GN. Generation of scratching. I. Activity of spinal interneurons during scratching. J Neurophysiol. 1978a;41:1040–1057. doi: 10.1152/jn.1978.41.4.1040. [DOI] [PubMed] [Google Scholar]
- Berkinblit et al., 1978b.Berkinblit MB, Deliagina TG, Feldman AG, Gelfand IM, Orlovsky GN. Generation of scratching. II. Nonregular regimes of generation. J Neurophysiol. 1978b;41:1058–1069. doi: 10.1152/jn.1978.41.4.1058. [DOI] [PubMed] [Google Scholar]
- Bonnot et al., 2002.Bonnot A, Whelan PJ, Mentis GZ, O'Donovan MJ. Locomotor-like activity generated by the neonatal mouse spinal cord. Brain Res Rev. 2002;40:141–151. doi: 10.1016/s0165-0173(02)00197-2. [DOI] [PubMed] [Google Scholar]
- Cazalets, 2005.Cazalets JR. Metachronal propagation of motoneurone burst activation in isolated spinal cord of newborn rat. J Physiol. 2005;568:583–597. doi: 10.1113/jphysiol.2005.086850. [DOI] [PMC free article] [PubMed] [Google Scholar]
- Deliagina et al., 1981.Deliagina TG, Orlovsky GN, Perret C. Efferent activity during fictitious scratch reflex in the cat. J Neurophysiol. 1981;45:595–604. doi: 10.1152/jn.1981.45.4.595. [DOI] [PubMed] [Google Scholar]
- Deliagina et al., 1983.Deliagina TG, Orlovsky GN, Pavlova GA. The capacity for generation of rhythmic oscillations is distributed in the lumbosacral spinal cord of the cat. Exp Brain Res. 1983;53:81–90. doi: 10.1007/BF00239400. [DOI] [PubMed] [Google Scholar]
- Ermentrout and Kleinfeld, 2001.Ermentrout GB, Kleinfeld D. Traveling electrical waves in cortex: Insights from phase dynamics and speculation on a computational role. Neuron. 2001;29:33–44. doi: 10.1016/s0896-6273(01)00178-7. [DOI] [PubMed] [Google Scholar]
- Falgairolle and Cazalets, 2007.Falgairolle M, Cazalets JR. Metachronal coupling between spinal neuronal networks during locomotor activity in newborn rat. J Physiol. 2007;580:87–102. doi: 10.1113/jphysiol.2006.115709. [DOI] [PMC free article] [PubMed] [Google Scholar]
- Grillner et al., 1976.Grillner S, Perret C, Zangger P. Central generation of locomotion in the spinal dogfish. Brain Res. 1976;109:255–269. doi: 10.1016/0006-8993(76)90529-1. [DOI] [PubMed] [Google Scholar]
- Grillner et al., 1995.Grillner S, Deliagina T, Ekeberg O, el Manira A, Hill RH, Lansner A, Orlovsky GN, Wallén P. Neural networks that co-ordinate locomotion and body orientation in lamprey. Trends Neurosci. 1995;18:270–279. [PubMed] [Google Scholar]
- Ivanenko et al., 2006.Ivanenko YP, Poppele RE, Lacquaniti F. Spinal cord maps of spatiotemporal alpha-motoneuron activation in humans walking at different speeds. J Neurophysiol. 2006;95:602–618. doi: 10.1152/jn.00767.2005. [DOI] [PubMed] [Google Scholar]
- Kaske and Bertschinger, 2005.Kaske A, Bertschinger N. Travelling wave patterns in a model of the spinal pattern generator using spiking neurons. Biol Cybern. 2005;92:206–218. doi: 10.1007/s00422-005-0540-8. [DOI] [PubMed] [Google Scholar]
- Kaske et al., 2003.Kaske A, Winberg G, Cöster J. Emergence of coherent traveling waves controlling quadruped gaits in a two dimensional spinal cord model. Biol Cybern. 2003;88:20–32. doi: 10.1007/s00422-002-0335-0. [DOI] [PubMed] [Google Scholar]
- Kiehn and Kjaerulff, 1998.Kiehn O, Kjaerulff O. Distribution of central pattern generators for rhythmic motor outputs in the spinal cord of limbed vertebrates. Ann N Y Acad Sci. 1998;860:110–129. doi: 10.1111/j.1749-6632.1998.tb09043.x. [DOI] [PubMed] [Google Scholar]
- Kotaleski et al., 1999.Kotaleski JH, Grillner S, Lansner A. Neural mechanisms potentially contributing to the intersegmental phase lag in lamprey. I. Segmental oscillations dependent on reciprocal inhibition. Biol Cybern. 1999;81:317–330. doi: 10.1007/s004220050565. [DOI] [PubMed] [Google Scholar]
- Kuhta and Smith, 1990.Kuhta PC, Smith JL. Scratch responses in normal cats: hindlimb kinematics and muscle synergies. J Neurophysiol. 1990;64:1653–1667. doi: 10.1152/jn.1990.64.6.1653. [DOI] [PubMed] [Google Scholar]
- Lafreniere-Roula and McCrea, 2005.Lafreniere-Roula M, McCrea DA. Deletions of rhythmic motoneuron activity during fictive locomotion and scratch provide clues to the organization of the mammalian central pattern generator. J Neurophysiol. 2005;94:1120–1132. doi: 10.1152/jn.00216.2005. [DOI] [PubMed] [Google Scholar]
- Manjarrez et al., 2005.Manjarrez E, Hernández-Paxtián Z, Kohn AF. Spinal source for the synchronous fluctuations of bilateral monosynaptic reflexes in cats. J Neurophysiol. 2005;94:3199–3210. doi: 10.1152/jn.00501.2005. [DOI] [PubMed] [Google Scholar]
- Manjarrez et al., 2007.Manjarrez E, Vázquez M, Flores A. Computing the center of mass for traveling alpha waves in the human brain. Brain Res. 2007;1145:239–247. doi: 10.1016/j.brainres.2007.01.114. [DOI] [PubMed] [Google Scholar]
- Matsushima and Grillner, 1990.Matsushima T, Grillner S. Intersegmental co-ordination of undulatory movements: “a trailing oscillator” hypothesis. Neuroreport. 1990;1:97–100. doi: 10.1097/00001756-199010000-00003. [DOI] [PubMed] [Google Scholar]
- Matsushima and Grillner, 1992.Matsushima T, Grillner S. Neural mechanisms of intersegmental coordination in lamprey: local excitability changes modify the phase coupling along the spinal cord. J Neurophysiol. 1992;67:373–388. doi: 10.1152/jn.1992.67.2.373. [DOI] [PubMed] [Google Scholar]
- Orlovsky et al., 1999.Orlovsky GN, Deliagina TG, Grillner S. Neuronal control of locomotion from mollusk to man. New York: Oxford UP; 1999. [Google Scholar]
- Pearson and Duysens, 1976.Pearson KG, Duysens JD. Function of segmental reflexes in the control of stepping in cockroaches and cats. In: Herman RM, Grillner S, Stein PSG, Stuart DG, editors. Neural control of locomotion. New York: Plenum; 1976. pp. 519–538. [Google Scholar]
- Roberts et al., 1998.Roberts A, Soffe SR, Wolf ES, Yoshida M, Zhao FY. Central circuits controlling locomotion in young tadpoles. Ann N Y Acad Sci. 1998;860:19–34. doi: 10.1111/j.1749-6632.1998.tb09036.x. [DOI] [PubMed] [Google Scholar]
- Romanes, 1964.Romanes GJ. The motor pools of the spinal cord. Prog Brain Res. 1964;11:93–119. doi: 10.1016/s0079-6123(08)64045-5. [DOI] [PubMed] [Google Scholar]
- Stein, 2005.Stein PS. Neuronal control of turtle hindlimb motor rhythms. J Comp Physiol A Neuroethol Sens Neural Behav Physiol. 2005;191:213–229. doi: 10.1007/s00359-004-0568-6. [DOI] [PubMed] [Google Scholar]
- Vanderhorst and Holstege, 1997.Vanderhorst VG, Holstege G. Organization of lumbosacral motoneuronal cell groups innervating hindlimb, pelvic floor, and axial muscles in the cat. J Comp Neurol. 1997;382:46–76. [PubMed] [Google Scholar]
- Wallén and Williams, 1984.Wallén P, Williams TL. Fictive locomotion in the lamprey spinal cord in vitro compared with swimming in the intact and spinal animal. J Physiol. 1984;347:225–239. doi: 10.1113/jphysiol.1984.sp015063. [DOI] [PMC free article] [PubMed] [Google Scholar]
- Yakovenko et al., 2002.Yakovenko S, Mushahwar V, VanderHorst V, Holstege G, Prochazka A. Spatiotemporal activation of lumbosacral motoneurons in the locomotor step cycle. J Neurophysiol. 2002;87:1542–1553. doi: 10.1152/jn.00479.2001. [DOI] [PubMed] [Google Scholar]