

Abstract
We investigated a possible role of the central glucagon-like peptide (GLP-1) receptor system as an essential brain circuit regulating adiposity through effects on nutrient partitioning and lipid metabolism independent from feeding behavior. Both lean and diet-induced obesity mice were used for our experiments. GLP-1 (7–36) amide was infused in the brain for 2 or 7 d. The expression of key enzymes involved in lipid metabolism was measured by real-time PCR or Western blot. To test the hypothesis that the sympathetic nervous system may be responsible for informing adipocytes about changes in CNS GLP-1 tone, we have performed direct recording of sympathetic nerve activity combined with experiments in genetically manipulated mice lacking β-adrenergic receptors. Intracerebroventricular infusion of GLP-1 in mice directly and potently decreases lipid storage in white adipose tissue. These effects are independent from nutrient intake. Such CNS control of adipocyte metabolism was found to depend partially on a functional sympathetic nervous system. Furthermore, the effects of CNS GLP-1 on adipocyte metabolism were blunted in diet-induced obese mice. The CNS GLP-1 system decreases fat storage via direct modulation of adipocyte metabolism. This CNS GLP-1 control of adipocyte lipid metabolism appears to be mediated at least in part by the sympathetic nervous system and is independent of parallel changes in food intake and body weight. Importantly, the CNS GLP-1 system loses the capacity to modulate adipocyte metabolism in obese states, suggesting an obesity-induced adipocyte resistance to CNS GLP-1.
Introduction
White adipose tissue (WAT) is key in the regulation of both glucose and lipid homeostasis, and adipocytes contain specific molecules and pathways that can rapidly switch between favoring lipid storage or lipid mobilization. These metabolic pathways confer a gatekeeper role on adipocytes in the regulation of lipid metabolism (Guilherme et al., 2008). Lipid excess, impaired lipid storage, and lipotoxicity contribute to obesity in part by fatty acids impacting on insulin signaling pathways. Thus, a functionally relevant dissection of molecular mechanisms directly regulating fatty acid deposition and mobilization is of considerable importance for the development of new therapeutics preventing and treating diabetes and obesity.
Glucagon-like peptide (GLP-1) is a gut hormone, neuropeptide and incretin (Baggio and Drucker, 2007), secreted in response to absorbed nutrients (Schirra et al., 1996). There is evidence that circulating GLP-1 receptor agonists can activate CNS neurons (Yamamoto et al., 2002) and that GLP-1 may cross the blood–brain barrier (Kastin et al., 2002). GLP-1 is also synthesized in specific neuron populations in the nucleus of the solitary tract of the hindbrain (Han et al., 1986; Jin et al., 1988), and GLP-1 receptors are found in many CNS areas known to be involved in the control of energy metabolism (Larsen et al., 1997a,b; Merchenthaler et al., 1999), including the hypothalamic arcuate and paraventricular nuclei. Consistent with this, GLP-1 has been reported to directly stimulate hypothalamic neuroendocrine neurons including those expressing pro-opiomelanocortin (Larsen et al., 1997b; Ma et al., 2007). Biologically, GLP-1 exerts a broad range of actions such as stimulating insulin release, reducing glucagon release, and reducing gastric emptying (Willms et al., 1996; Baggio et al., 2004), and at least some of its actions appear to be mediated through neuroendocrine mechanisms. CNS GLP-1 receptor activation has been linked to the control of food intake (Tang-Christensen et al., 1996; Turton et al., 1996; Pérez-Tilve et al., 2007), some stress responses (Kinzig et al., 2003), glucose homeostasis (Sandoval, 2008), and locomotor activity (Knauf et al., 2008). However, a potential role of CNS GLP-1 receptor activity in the direct control of lipid deposition or lipid mobilization remains unknown.
Specific circuits in the CNS have recently been found to be directly connected to WAT via the sympathetic nervous system (SNS), thereby providing an avenue for a direct CNS influence on adipocyte metabolism. This pathway may, therefore, provide the explanation as to how central administration of leptin (Buettner et al., 2008), ghrelin (Theander-Carrillo et al., 2006), neuropeptide Y (Zarjevski et al., 1994), and melanocortins (Nogueiras et al., 2007) control adipocyte metabolism. Because GLP-1 analogues are now approved and widely used as a therapeutic adjunct for human metabolic disease, we asked whether CNS GLP-1 action directly modulates peripheral lipid metabolism, and we demonstrate for the first time that CNS GLP-1 potently and rapidly decreases lipid deposition in WAT and liver. The actions on WAT, but not liver, are independent of changes in food intake and are partially modulated through the SNS. Interestingly, direct CNS GLP-1 modulation of peripheral lipid metabolism appears to be blunted in diet-induced obesity.
Materials and Methods
All procedures were approved either by the Institutional Animal Care and Use Committees at the University of Cincinnati and University of Iowa, in accordance with the National Institutes of Health Guide for the Care and Use of Laboratory Animals, or the Vétérinaire Fédéral et Cantonal, Geneva, Switzerland.
Experiments.
Several experiments were conducted, each of which was designed to answer a specific aspect of the overall hypothesis. At the termination of all of the experiments, the animals were killed by decapitation, trunk blood was collected, and several tissues were removed and stored at −80°C until further processing for the measurement of hormones, metabolites, and tissue-specific mRNA or protein expression of various enzymes.
In chronic experiments, Exendin 9–39 (7.5 nmol/d), an antagonist of the GLP-1 receptor, or GLP-1 (7–36) amide (0.75 nmol/d), both provided by Dr. R. Di Marchi (Indiana University, Bloomington, IN), were delivered via intracerebroventricular infusion for 7 d or 48 h to mice. The doses used for Exendin 9–39 and GLP-1 were adapted from previous reports performed in rats showing that those doses were efficient in the modulation of body weight (Meeran et al., 1999). These experiments analyzed food intake, energy expenditure, respiratory quotient (RQ), and locomotor activity of chow-fed mice using a novel, custom-made 32-cage calorimetry system (LabMaster multipurpose screening system; TSE Systems).
To determine whether the observed effects could be mediated by GLP-1 leaking from the CNS after intracerebroventricular infusion and impacting peripheral receptors directly, we subcutaneously infused rats with saline or GLP-1 (7–36) amide (0.75 nmol/d) for a 2 d period using minipumps (model 1003D; Alzet Osmotic Pumps; DURECT) (Theander-Carrillo et al., 2006; Nogueiras et al., 2007, 2008).
To investigate the role of the sympathetic nervous system in mediating the effect of GLP-1 on adipocyte metabolism, first we tested the effect of intracerebroventricular GLP-1 on sympathetic nerve activity (SNA) subserving WAT. Then, we compared the effect of intracerebroventricular infusion of GLP-1 (0.75 nmol/d, 2 d) between mice deficient for the β1, β2, and β3 adrenergic receptors (ARs) and wild-type (wt) controls.
Animals.
For all experiments of intracerebroventricular and peripheral GLP-1 administration, 8- to 10-week-old, male C57BL/6 mice purchased from The Jackson Laboratory were housed in individual cages under conditions of controlled temperature (23°C) and illumination (12 h light/dark cycle). They were allowed ad libitum access to water and pelleted low-fat laboratory chow, or else a high-fat diet during 6 months (D12451, 45 kcal percentage fat; Research Diets). Food intake and body weight were measured daily during the experimental phase in all experiments.
Eight-week-old wild-type and triple β-adrenoreceptor knock-out (TKO) mice were obtained as described previously (Theander-Carrillo et al., 2006; Nogueiras et al., 2007). Briefly, β1+/−β2+/−β3+/− mice were crossed to generate β1+/+β2+/+β3+/+ and β1−/−β2−/−β3−/− mice. Several couples were then established from these homozygous mice at the University of Geneva, and experiments were performed on β1+/+β2+/+β3+/+ and β1−/−β2−/−β3−/− mice offspring.
Intracerebroventricular infusions.
Mice were anesthetized by an intraperitoneal injection of ketamine/xylazine [ketamine 100 mg/kg body weight (BW) plus xylazine 15 mg/kg BW]. Brain infusion cannulae were stereotaxically placed with their tips in the lateral cerebral ventricle using the following coordinates: 0.7 mm posterior to bregma, 1.2 mm lateral to the midsagittal suture, and to a depth of 2.0 mm, with bregma and lambda at the same vertical dimension. The cannula was secured by glue. The location of the cannula was confirmed at the end of the experiment by methylene blue staining. A catheter tube (ALZET Brain Infusion Kit 3; Alzet Osmotic Pumps; DURECT) was connected from the brain infusion cannula to an osmotic minipump flow moderator (model 1003D or 1007D; Alza). A subcutaneous pocket on the dorsal surface was created using blunt dissection, and the osmotic minipump was inserted. The incision was closed with sutures, and mice were kept warm until fully recovered. Mice were then infused with either saline, Exendin 9–39 (7.5 nmol/d), or GLP-1 (7–36) amide (0.75 nmol/d) for 7 d or 48 h. After surgery, the animals received a single subcutaneous dose of 0.28 mg/kg buprenorphin (Buprenex; Reckitt Benckiser Healthcare). Because GLP-1 caused a marked suppression of food intake, a saline pair-fed group (restricted to the same amount of food each day as consumed by the intracerebroventricular GLP-1-infused mice) was also used.
The pair-feeding regimen consisted in giving one-third of the daily food amount in the morning and the remaining two-thirds just before onset of darkness. Thus, the experiments included three groups of animals: an ad libitum-fed control group infused with intracerebroventricular saline, an intracerebroventricular GLP-1-infused group, and a saline-pair-fed group.
Energy expenditure, locomotor activity, RQ, and lipid utilization.
During intracerebroventricular treatment, mice were analyzed for 7 consecutive days for energy expenditure, RQ, and locomotor activity using a custom-made 32-cage calorimetry system (LabMaster; TSE Systems). The instrument consists of a combination of highly sensitive feeding and drinking sensors for automated online measurement. The calorimetry system is an open-circuit system that determines O2 consumption, CO2 production, and RQ (RQ = Vco2/Vo2). A photobeam-based activity-monitoring system detects and records every ambulatory movement including rearing and climbing movements in every cage. Detection of animal location is performed with infrared sensor pairs arranged in strips for horizontal and vertical (rearing) activity. The sensors for detection of movement operate efficiently in both light and dark phases allowing continuous recording. All of the parameters can be measured continuously and simultaneously in up to 32 animals. The mice (7–8 per group) were placed in the calorimetric system cages on day 1 of treatment. After 72 h of adaptation, data were collected over the subsequent 4 d.
Body composition was measured in mice infused intracerebroventricularly with saline or GLP-1 using nuclear magnetic resonance imaging (Whole Body Composition Analyzer; EchoMRI). Measurements were performed before surgery and before killing after 2 or 7 d of treatment.
Quantitative real-time-PCR procedure.
Mice were killed by decapitation in the fed state (1 h after morning feeding), and several tissues were dissected, freeze-clamped, and stored at −80°C for subsequent measurement of mRNA expression of fatty acid synthase (FAS), stearoyl-CoA desaturase 1 (SCD-1), acetyl-CoA carboxylase-α (ACCα), lipoprotein lipase (LPL), carnitine palmitoyltransferase-1-α (CPT-1α), hormone-sensitive lipase (HSL), β-adrenoreceptors 1, 2, and 3, and hypoxanthine guanine phosphoribosyltransferase (HPRT) by real-time (RT)-qPCR (Bio-Rad). See Table 1 for primer sequences. Total RNA was extracted from frozen tissue samples using TRIzol Reagent (Invitrogen). RNA integrity was assessed by performing a 1% agarose gel electrophoresis in 1× Tris–borate–EDTA, and its concentration was determined by spectrophotometry. cDNA templates for RT-PCR were synthesized using 2 μg of total RNA random hexamers (Microsynth), dNTPs, RNase inhibitor, Rnasin (Catalys; Promega), and Superscript III (Invitrogen). qPCR was performed using SYBR Green I DNA master mixture (Bio-Rad) according to the standard protocol using ∼70 ng template cDNA. All primers were used at a final concentration of 0.5 μm. A standard curve was used to obtain the relative concentration of each experimental gene; and values were normalized to the concentration of HPRT in each sample.
Table 1.
Primer sequences used for real-time qPCR
| Gene | Accession number | Forward sequence | Reverse sequence | PCR product | Annealing T° |
|---|---|---|---|---|---|
| ACCα | NM133360 | 5′-GCC TCT TCC TGA CAA ACG AG-3′ | 5′-TGA CTG CCG AAA CAT CTC TG-3′ | 239 | 60 |
| FAS | NM007988 | 5′-TTG CTG GCA CTA CAG AAT GC-3′ | 5′-AAC AGC CTC AGA GCG ACA AT-3′ | 192 | 60 |
| SCD-1 | NM009127 | 5′-CTT CAA GGG CAG TTC TGA GG-3′ | 5′-CAA TGG TTT TCA TGG CAG TG-3′ | 203 | 60 |
| LPL | NM008509 | 5′-CAG CTG GGC CTA ACT TTG AG-3′ | 5′-AAT CAC ACG GAT GGC TTC TC-3′ | 206 | 60 |
| CPT-1α | AF017174 | 5′-GTC GCT TCT TCA AGG TCT GG-3′ | 5′-AAG AAA GCA GCA CGT TCG AT-3′ | 232 | 60 |
| HSL | BC021642 | 5′-AGA CAC CAG CCA ACG GAT AC-3′ | 5′-ATC ACC CTC GAA GAA GAG CA-3′ | 239 | 60 |
| SREBP1c | NM011480 | 5′-TAG AGC ATA TCC CCC AGG TG-3′ | 5′-GGT ACG GGC CAC AAG AAG TA-3′ | 245 | 60 |
| β1-AR | NM007419 | 5′-CG GCC TTT CGT GTG TTT AAT-3′ | 5′-GCA AAG GGA AAC ACT TCC TG-3′ | 232 | 60 |
| β2-AR | NM007420 | 5′-GAG CAC AAA GCC CTC AAG AC-3′ | 5′-GTT GAC GTA GCC CAA CCA GT-3′ | 153 | 60 |
| β3-AR | NM013462 | 5′-GAC AGC CTC AAA TGC ATC CT-3′ | 5′-CCC AGT CCA CAC ACC TTT CT-3′ | 220 | 60 |
| NOR-1 | NM015743 | 5′-TCA GCC TTT TTG GAG CTG TT-3′ | 5′-TAA CCC ATG TCG CTC TGT GA-3′ | 234 | 60 |
| HPRT | NM013556 | 5′-TGC TCG AGA TGT CAT GAA GG-3′ | 5′-TAT GTC CCC CGT TGA CTG AT-3′ | 196 | 60 |
Western blot analysis.
WAT total protein lysates were subjected to SDS-PAGE, electrotransferred on a polyvinylidene fluoride membrane and probed with FAS antibody (BD Transduction Laboratories) and β-actin (Abcam). For protein detection, we used HRP-conjugated secondary antibodies and chemiluminescence (Amersham Biosciences) (López et al., 2008; Vázquez et al., 2008). We used six mice per group, and the protein levels were normalized to β-actin for each sample.
Recording of SNA.
C57BL/6J mice that had received intracerebroventricular cannulas at least 1 week before the study were anesthetized with ketamine (91 mg/kg) and xylaxine (9.1 mg/kg), intraperitoneally. To measure SNA subserving WAT, a nerve fascicle projecting to the left epididymal fat pad was carefully isolated. A bipolar platinum-iridium electrode (Cooner Wire) was suspended under the nerve and secured with silicone gel (Kwik-Cast, WPI). The nerve signal was amplified and filtered as described previously (Rahmouni et al., 2004, 2008). Anesthesia was sustained with the administration of α-chloralose (25 mg/kg/h) intravenously. Body temperature was maintained at 37.5°C with the assistance of a lamp and a heating pad.
Baseline SNA was recorded for 10 min followed by intracerebroventricular administration of GLP-1 (0.1 or 0.5 μg) or vehicle (2 μl of saline). SNA responses to GLP-1 and vehicle were recorded continuously for 240 min. At the end of the study, mice were killed with a lethal dose of ketamine/xylazine. The integrated voltage after death (background noise) was subtracted from the total integrated voltage to calculate real WAT SNA.
Levels of plasma metabolites and hormones.
Plasma levels of insulin, leptin, glucagon, and GLP-1 in wt and TKO mice were determined using Mouse Endocrine LINCOplex kit (Linco Research). Blood samples (200 μl) were treated with 3 μl of aprotinin (Sigma–Fluka) for glucagon and 2 μl of dipeptidyl-peptidase 4 (Linco Research) for GLP-1 dosage, before plasma extraction. Triglyceride (TG) levels were determined using a kit from bioMérieux.
Statistics.
Results are given as mean ± SEM. Statistical analysis was performed using one-way ANOVA followed by the post hoc Tukey test. A two-tailed p value <0.05 was considered statistically significant.
Results
CNS GLP-1 reduces adiposity independent of food intake
Chronic intracerebroventricular infusion of GLP-1 (0.75 nmol/d for 7 d) decreased food intake in ad libitum-fed mice compared with intracerebroventricular saline-infused controls, whereas chronic intracerebroventricular infusion of Exendin 9–39 (7.5 nmol/d for 7 d) did not affect feeding behavior (Fig. 1A). A second control group of intracerebroventricular saline-infused animals was pair-fed to match the intake of GLP-1-infused mice (saline-pf). Weight gain of intracerebroventricular GLP-1-infused mice was significantly lower than that of controls or saline-pf mice (Fig. 1B), suggesting that the loss of body weight in GLP-1-infused mice is not entirely explained by the anorexigenic effect of GLP-1. Consistent with those data, central blockade of GLP-1 receptor by Exendin 9–39 increased the body weight (Fig. 1B), although Exendin 9–39-infused mice ate the same amount of food than the control group. The decreased body weight observed after intracerebroventricular GLP-1 infusion was correlated with a net loss of fat mass (Fig. 1C), which was not observed in the pair-fed control group. The increased body weight observed after intracerebroventricular Exendin 9–39 infusion, an antagonist for the GLP-1 receptor, was correlated with the gain of fat mass (Fig. 1D). Neither GLP-1 nor Exendin 9–39 changed the amount of nonfat mass (Fig. 1E).
Figure 1.

Effect of a 7 d intracerebroventricular GLP-1 (0.75 nmol/d) or Exendin 9–39 (7.5 nmol/d) infusion on cumulative food intake (A), body weight gain (B), body weight (C), fat mass change (D), nonfat mass (E), energy expenditure (F–H), locomotor activity (I–K), and respiratory quotient (L–N). Values are mean ± SEM of 7–8 animals per group. *p < 0.05; **p < 0.01 versus saline.
Chronic intracerebroventricular GLP-1 infusion also prevented the expected compensatory decrease of energy expenditure which occurred in saline-pf mice (Fig. 1F–H), a phenomenon which could not be explained by changes in locomotor activity (Fig. 1I–K). Interestingly, however, continuous CNS GLP-1 infusion did result in a slight decrease of the RQ, particularly during the dark phase (Fig. 1L–N). These data indirectly suggest that central GLP-1 activation promotes a food intake independent shift of nutrient partitioning toward fat utilization, at the expense of lipid deposition rates.
These findings demonstrated that chronic central infusion of GLP-1 or Exendin 9–39 modified body weight and fat mass independent of food intake but did not exert any significant change on nonfat mass. Thus, our first data suggested that modulation of CNS GLP-1 receptor plays a relevant role in the regulation of adipocyte metabolism. However, the effects of GLP-1 on body weight were not consistent after 48 h, because CNS GLP-1-treated mice regained body weight at day 3 of infusion (Fig. 1C). Therefore, we decreased the time of the treatment. Constant intracerebroventricular GLP-1 infusion for 48 h induced markedly suppressed cumulative food intake (Fig. 2A) and reduced body weight (saline ad libitum, −0.11 ± 0.31 g; GLP-1, −4.14 ± 0.20 g; and saline-pf, −2.54 ± 0.46 g). Again, the loss of body weight in intracerebroventricular GLP-1-infused mice could not be sufficiently explained by its anorexigenic effects, as the saline-pf mice did not lose as much weight. Both intracerebroventricular GLP-1-infused and saline-pf mice exhibited less fat mass than the saline ad libitum group after treatment (Fig. 2B). This was demonstrated by the fact that at the end of the treatment, the amount of fat mass present in both GLP-1-infused and saline-pf groups was too low to be detected by nuclear magnetic resonance, meaning that the loss of fat mass was higher in these two groups in comparison with the saline ad libitum group, in which the final amount of fat mass could be detected.
Figure 2.

A, B, Effect of a 2 d intracerebroventricular GLP-1 (0.75 nmol/d) infusion on cumulative food intake (A) and fat mass change (B). C,D, Effect of a 2 d intracerebroventricular GLP-1 (0.75 nmol/d) infusion on TG content in WAT (C) and liver (D). E, Effect of a 2 d intracerebroventricular GLP-1 (0.75 nmol/d) infusion on WAT mRNA expression of FAS, SCD-1, ACCα, LPL, CPT-1α, and HSL. F, Effect of a 2 d intracerebroventricular GLP-1 (0.75 nmol/d) infusion on protein levels of FAS in WAT. G, Effect of a 2 d intracerebroventricular GLP-1 (0.75 nmol/d) infusion on liver mRNA expression of SREBP-1c (sterol regulatory element-binding protein 1c), FAS, SCD-1, ACCα, and CPT-1α. Data are presented as values normalized to HRPT, which was used as a housekeeping gene. mRNA levels are relative to controls. Values are mean ± SEM of 7–8 animals per group. *p < 0.05; **p < 0.01; ***p < 0.001 versus saline.
CNS GLP-1 levels determine white adipose tissue triglyceride metabolism
The greater decrease in fat mass in mice infused with intracerebroventricular GLP-1 for 48 h, relative to saline ad libitum and saline-pf mice, suggested direct stimulation of neural circuits that elicit TG mobilization from WAT by CNS GLP-1. To test this hypothesis, we first quantified TG lipid content in WAT and liver and observed that the total amount of TG/g in both tissues was decreased in response to chronic intracerebroventricular GLP-1 infusion (Fig. 2C,D). This phenomenon, however, was independent of food intake only for WAT (Fig. 2C), whereas in liver, this effect was predominantly associated with GLP-1's anorectic actions as demonstrated by the fact that both GLP-1 and saline-pf groups exhibited the same levels of TG (Fig. 2D).
To begin to identify the molecular underpinnings responsible for the decreased TG content in WAT, we analyzed the lipid metabolism gene program. Independent of hypophagia, GLP-1 markedly decreased mRNA expression profiles of genes promoting lipogenesis, lipid deposition, and TG storage in adipocytes; i.e., these target genes included FAS, SCD-1, ACCα, and LPL (Fig. 2E). However, mRNA expression levels of enzymes promoting lipid mobilization or fat oxidation, including, for example, CPT-1α, were not significantly modified in mice infused with intracerebroventricular GLP-1 (Fig. 2E). In addition, sustained intracerebroventricular GLP-1 did not alter WAT mRNA expression of HSL, which, in its phosphorylated form, is considered a surrogate marker for lipid mobilization in WAT (Fig. 2E). To corroborate our gene expression findings, we quantified protein levels of FAS (Fig. 2F), which supported the conclusion of decreased lipid deposition-promoting programs in response to chronic intracerebroventricular infusion of GLP-1. Consistent with the observed lower hepatic TG content, intracerebroventricular GLP-1 markedly decreased mRNA levels of genes promoting lipogenesis and TG storage in liver. Interestingly and differing from effects in adipose tissue, that phenomenon seemed to be largely dependent on nutrient intake, as those hepatic gene programs were turned off to a similar extent in CNS saline-infused mice which were pair-fed to mice receiving intracerebroventricular GLP-1 (Fig. 2G).
No peripheral interference of centrally derived GLP-1 peptide
To rule out the possibility that centrally infused GLP-1 leaks out of the CNS into the circulation and elicits a response by directly acting at peripheral GLP-1 receptors, we administered GLP-1 peripherally (2 d, via subcutaneous minipumps) using the exact same dose as that infused centrally (0.75 nmol/d). There were no effects on food intake (Fig. 3A), body weight (Fig. 3B), or lipid metabolism in WAT (Fig. 3C) after peripheral infusion of GLP-1. We, therefore, conclude that the effects observed during intracerebroventricular administration are attributable to CNS GLP-1-R activation.
Figure 3.

A–C, Effect of a 2 d peripheral GLP-1 (0.75 nmol/d) infusion on cumulative food intake (A), body weight change (B), and WAT mRNA expression of FAS, SCD-1, ACCα, LPL, and CPT-1α (C). Data are presented as values normalized to HRPT, which was used as a housekeeping gene. mRNA levels are relative to controls. Values are mean ± SEM of 7–8 animals per group.
Impact of sustained intracerebroventricular GLP-1 on adipocyte metabolism is blunted in diet-induced obese mice
To determine whether the effect of intracerebroventricular GLP-1 would be sustained in an obese animal model, we used diet-induced obesity (DIO) C57B6/6J mice (mean of 49.5 g body weight), a well established mouse obesity model. Mice received intracerebroventricular GLP-1 (0.75 nmol/d) or saline for 48 h. Consistent with data obtained in lean mice, DIO mice responded to intracerebroventricular GLP-1 with a decrease in food intake (Fig. 4A) and a reduction of body weight (saline ad libitum, −2.35 ± 0.31 g; GLP-1, −4.91 ± 0.38 g; and saline-pf, −3.27 ± 0.28 g). Interestingly, the reduction of body weight was not reflected by a respective decrease in fat mass in DIO mice (Fig. 4B). Consistent with the lack of changes in adiposity, we failed to detect changes in any of the previously described gene expression program of lipid metabolism in this obesity model (Fig. 4C). Thus, we conclude that the regulatory impact of CNS GLP-1-R signaling on food intake and body weight is preserved in DIO mice, although these mice become resistant to a direct CNS GLP-1 control over WAT lipid metabolism.
Figure 4.

A–C, Effect of a 2 d intracerebroventricular GLP-1 (0.75 nmol/d) infusion in DIO mice on cumulative food intake (A), fat mass change (B), and WAT mRNA expression of FAS, SCD-1, ACCα, and CPT-1α (C). Data are presented as values normalized to HRPT, which was used as a housekeeping gene. mRNA levels are relative to controls. Values are mean ± SEM of 7–8 animals per group. **p < 0.01 versus saline.
Role of the sympathetic nervous system in the CNS GLP-1 control of lipid metabolism
Adipocytes are connected with hypothalamic areas controlling energy balance via the autonomic nervous system, in particular the SNS. To determine whether CNS GLP-1 activity directly triggers the efferent SNS projections to WAT, we used multifiber recording to test the effect of CNS GLP-1-R activation on SNS nerve subserving WAT. We found that CNS GLP-1-R activation via intracerebroventricular injection of low dose GLP-1 increased SNA recorded from nerve endings in epididymal WAT (Fig. 5A–C). This effect was dose-dependent and had a relatively slow onset, suggesting that gene expression changes within some brain cells might be involved downstream of GLP-1-R activation and upstream of CNS SNS efferents. The WAT SNS activity started to increase 30–60 min after the start of intracerebroventricular GLP-1 infusion and reached a maximum at ∼150 min (Fig. 5B,C).
Figure 5.

Effect of intracerebroventricular administration of GLP-1 on SNA subserving epididymal WAT in anesthetized mice. A, Original records of WAT SNA at baseline and 4 h after intracerebroventricular injection of vehicle or GLP-1 (0.5 μg). B, Time course of WAT SNA response to GLP-1 (0.5 μg). There was a significant difference (p < 0.01 by two-way repeated-measures ANOVA) between the effects of GLP-1 and vehicle on WAT SNA. C, Dose–response effect of intracerebroventricular GLP-1 on WAT SNA. B, C, SNA represents the percentage change from baseline. Data represent means ± SEM of 6–10 animals per group. *p < 0.05 versus saline (by one-way ANOVA followed by Fisher test).
We next tested the physiological relevance of GLP-1 activation of SNA by examining whether CNS GLP-1-R activation would affect WAT lipid metabolism in the absence of SNS signaling. For this purpose, we treated wt and triple (β1-, β2-, and β3-) AR-deficient mice (TKO) with intracerebroventricular GLP-1 using the same treatment paradigm (0.75 nmol/d, 48 h). Intracerebroventricular GLP-1 decreased cumulative food intake in wt mice as well as in TKO mice (Fig. 6A). Body weight of wt mice was also reduced by intracerebroventricular GLP-1, whereas TKO mice, although not significant, showed a similar profile in the decrease of body weight (Fig. 6B). The WAT TG synthesis pathways were markedly downregulated in response to intracerebroventricular GLP-1 in wt mice as reflected by decreased mRNA levels of FAS (Fig. 6C), SCD-1 (Fig. 6D), and ACCα (Fig. 6E), whereas those effects were not observed in TKO mice (Fig. 6C–E). These findings indicate an important mediating role for the SNS in the CNS control of lipid metabolism. We also corroborated that protein levels of FAS were correlated with its gene expression, consistent with our previous findings (Fig. 6F). Contrary to the specific and direct actions of intracerebroventricular GLP-1 on WAT of wt mice but not TKO mice, we observed that in liver of both wt and TKO mice the expression of lipid synthesis and deposition-promoting enzymes was decreased in response to intracerebroventricular GLP-1 (supplemental Fig. 1, available at www.jneurosci.org as supplemental material). Therefore, our results suggest that deficient SNS signaling specifically affects the direct CNS GLP-1-mediated control over adipocyte metabolism.
Figure 6.

A–E, Effect of a 2 d intracerebroventricular GLP-1 infusion (0.75 nmol/d) on cumulative food intake (A), body weight change (B), and WAT mRNA expression of FAS (C), SCD-1 (D), and ACCα (E) in wt and TKO mice. F, Effect of a 2 d intracerebroventricular GLP-1 infusion (0.75 nmol/d) on protein levels of FAS in WAT of wt and TKO mice. Data are presented as values normalized to HPRT, which was used as a housekeeping gene. Values are means ± SEM of 5 to 6 animals per group. Statistical significance: *p < 0.05; **p < 0.01 versus saline.
Finally, we assessed if and to what extent sustained CNS GLP-1 infusion would modulate the SNS effectors in WAT. β-ARs are a family of G-protein-coupled receptors that represent a key link involved in the regulation of adipocyte lipid metabolism by the SNS (van Baak, 2001; Bartness and Song, 2007). Therefore, we measured mRNA expression of beta1, 2, and 3 adrenergic receptors (β-1, β2, β3-AR) in WAT of intracerebroventricular GLP-1-infused lean and obese mice. The gene expression of β1-AR was slightly increased (Fig. 7A), and β2-AR mRNA expression levels were markedly stimulated in WAT in response to CNS GLP-1 of lean mice (Fig. 7B). No changes were observed in β3-AR gene expression (Fig. 7C). Intriguingly and consistent with our main hypothesis, we failed to detect any significant changes in β receptor expression patterns in the WAT of DIO mice receiving intracerebroventricular GLP-1 (Fig. 7E–G).
Figure 7.

A–D, Effect of a 2 d intracerebroventricular GLP-1 (0.75 nmol/d) infusion in lean mice on WAT mRNA expression of β1-AR (A), β2-AR (B), β3-AR (C), and NOR-1 (D). E–H, Effect of a 2 d intracerebroventricular GLP-1 (0.75 nmol/d) infusion in DIO mice on WAT mRNA expression of β1-AR (E), β2-AR (F), β3-AR (G), and NOR-1 (H). Data are presented as values normalized to HRPT, which was used as a housekeeping gene. mRNA levels are relative to controls. Values are mean ± SEM of 7–8 animals per group. **p < 0.01; *p < 0.05 versus saline.
We next assessed the specific gene expression of the nuclear receptor NOR-1, a specific target of the β adrenergic signal (Pearen et al., 2006) as a potential downstream effector of SNS activity in WAT (supplemental Fig. 2, available at www.jneurosci.org as supplemental material), and measured its levels in WAT of lean and obese mice (Fig. 7). NOR-1 mRNA expression was increased in WAT of lean mice when compared with saline ad libitum and saline-pf mice in response to continued CNS GLP-1 (Fig. 7D). On the contrary, NOR-1 gene expression was unmodified in the WAT of DIO mice, consistent with a potentially important functional role of NOR-1 in intracellular metabolic processes (Fig. 7H).
Sustained CNS GLP-1 infusion did not change plasma levels of insulin, glucagon or TG (Table 2). Plasma leptin levels were significantly decreased by CNS GLP-1 treatment in wt mice as expected but did not change in TKO GLP-1-infused mice (Table 2). Plasma total GLP-1 levels were elevated both in CNS GLP-1-infused wt and TKO mice (Table 2).
Table 2.
Plasma levels of insulin, leptin, GLP-1, and glucagon in wt and TKO mice treated intracerebroventricularly with either GLP-1 (0.75 nmol/d) or vehicle (saline) for 48 h
| wt |
TKO |
|||
|---|---|---|---|---|
| Saline | GLP-1 | Saline | GLP-1 | |
| Insulin (ng/ml) | 0.63 ± 0.14 | 0.33 ± 0.03 | 0.58 ± 0.24 | 0.51 ± 0.08 |
| Leptin (ng/ml) | 1.88 ± 0.45 | 0.92 ± 0.13* | 1.75 ± 0.26 | 2.53 ± 0.83 |
| GLP-1 (ng/ml) (total) | 0.21 ± 0.03 | 14.41 ± 7.62* | 0.08 ± 0.01 | 13.72 ± 6.30* |
| Glucagon (ng/ml) | 0.11 ± 0.02 | 0.15 ± 0.05 | 0.07 ± 0.02 | 0.07 ± 0.02 |
| TG (mg/ml) | 2.9 ± 0.08 | 2.54 ± 0.15 | 3.07 ± 0.24 | 2.27 ± 0.12 |
Values are means ± SEM. n = 6–7 mice per group.
*p < 0.05 versus saline.
Discussion
We report herein that the CNS GLP-1 system directly controls adipocyte lipid metabolism. Our central finding is that when GLP-1 is administered into the CNS at a slow infusion rate via an osmotic minipump, it potently decreases lipid deposition in adipocytes of lean but not obese mice. These actions seem to be partially modulated through effects on sympathetic outflow, and more specifically by β1- and β2-AR, thereby efficiently shifting substrate metabolism to reduce energy storage and adiposity. These findings provide a compelling explanation for how fat mass decreases in response to an increase of CNS GLP-1 activity independent of its anorexigenic actions.
Central GLP-1 signaling reduces food intake (Turton et al., 1996) as well as mediating aspects of visceral illness (Seeley et al., 2000) and stress (Yamamoto et al., 2002; Kinzig et al., 2003). More recent reports indicate that GLP-1, acting on its receptors in the brain, is linked to the control of peripheral glucose homeostasis by inhibiting noninsulin-mediated glucose uptake by muscle and increasing insulin secretion from the pancreas (Knauf et al., 2005; Sandoval, 2008). Hence, one of the functional roles of the CNS GLP-1 system appears to be to modulate activity in peripheral organs that are crucial for the maintenance of energy homeostasis. In view of our present findings in mice, we conclude that another of those peripheral organs is the WAT.
The present experiments have confirmed that activation of the CNS GLP-1 system can decrease food intake and body weight (Tang-Christensen et al., 1996, 1998; Meeran et al., 1999; Rodriquez de Fonseca et al., 2000). The decrease in body weight is consistent with the observed lower amount of fat mass after central GLP-1 infusion. Most importantly, the decreased fat mass in mice receiving chronic intracerebroventricular GLP-1, in comparison with levels in saline ad libitum and saline-pf mice, led us to investigate the molecular pathways mediating CNS GLP-1 actions in WAT. We found that pharmacological stimulation of the CNS GLP-1 system decreased WAT TG content and deposition independent of its anorexigenic actions. However, in contrast to WAT, the effects of CNS GLP-1 on hepatic lipid deposition are dependent on and presumably secondary to reduced nutrient intake. Although GLP-1-R has not been found in WAT (Bullock et al., 1996), several studies have suggested that GLP-1 can directly act on adipocyte metabolism, although the molecular mechanisms modulating those peripheral actions are unknown (Ruiz-Grande et al., 1992; Mérida et al., 1993; Valverde et al., 1993; Bertin et al., 2001; Villanueva-Peñacarrillo et al., 2001; Sancho et al., 2005, 2006). We have excluded the possibility that increased peripheral GLP-1 levels contributed to the observed effects, because peripheral infusion of the identical amount of GLP-1 failed to trigger any effects. Nonetheless, we did detect a slight increase of plasma total GLP-1 levels after central GLP-1 infusion. The reason for the increase is unclear, but parallel occurrences have been reported. Central infusion of ghrelin elicits increased plasma ghrelin levels (Theander-Carrillo et al., 2006), and central administration of insulin leads to a transient increase of pancreatic insulin secretion (Woods et al., 1998). In the case of GLP-1, the present findings cannot be explained by increased peripheral GLP-1 levels, because peripheral infusion of amounts identical to those administered centrally failed to exert any effects. To our knowledge, this is the first report documenting the potential effects of CNS GLP-1 on adipocyte lipid metabolism.
Available data from DIO rodents, which may represent the form of obesity encountered in most obese humans, strongly suggest that central resistance to some hormones regulating food intake contribute to the development of obesity (Howard et al., 2004; Myers et al., 2008). The most extensively studied hormone in this regard is leptin, whose central anorectic action is reduced in DIO rats (Widdowson et al., 1997) and DIO mice (Lin et al., 2000; Howard et al., 2004; Myers et al., 2008). It is, therefore, reasonable to hypothesize that other central signaling pathways implicated in energy homeostasis might be defective in obese states. Perhaps consistent with this, a recent report indicates that chronic blockage of brain GLP-1 signaling by Exendin-9 totally prevents hyperinsulinemia and insulin-resistance in DIO mice (Knauf et al., 2008), suggesting that the central GLP-1 actions on glucose homeostasis are unaltered in obese models. In the present experiments, we evaluated if pharmacological stimulation of CNS GLP-1-R would be also efficient on adipocyte metabolism in DIO mice. Centrally infused GLP-1 in DIO mice elicited suppression of food intake and reduced body weight gain relative to results in saline ad libitum and saline-pf mice. However, the loss of body weight was not correlated with the amount fat mass, which remained unchanged in DIO mice with chronic intracerebroventricular GLP-1. Consistent with the lack of effects of CNS GLP-1 on fat mass, we also failed to detect any significant change in the expression of several key enzymes regulating lipid metabolism in WAT. Therefore, we conclude that obesity is associated with a selective central GLP-1-resistance: the CNS GLP-1 system is efficiently regulating food intake, body weight, and glucose homeostasis (Knauf et al., 2008), but it has no capacity to exert its actions on adipocyte metabolism.
To dissect the molecular underpinnings responsible for actions of CNS GLP-1 on WAT of lean but not obese mice, we analyzed the role of the SNS. The SNS connects WAT cells via a direct neuronal circuit with homeostatic control areas in the CNS (van Baak, 2001). We, therefore, tested the hypothesis that the SNS system may be responsible for informing adipocytes about changes in CNS GLP-1 tone. For this purpose, we have performed direct recording of SNA combined with experiments in genetically manipulated mice lacking β-adrenergic receptors. Our findings demonstrate that CNS GLP-1 increases SNS activity to epididymal WAT. However, it is important to point out that the increased SNA or even the WAT lipid metabolism changes could theoretically be secondary to endocrine changes in the hypothalamus-pituitary-adrenal axis and/or the hypothalamus-pituitary-thyroid axis. Moreover, we acknowledge that complete disruption of SNS signaling in the TKO mice may create undesired tangential phenotypes that could have interfered with our interpretation of the neuropharmacology studies in this loss-of-function model.
However, we also assessed the expression of specific receptor mediating CNS GLP-1 actions on WAT. We found that intracerebroventricular GLP-1 infusion increases the gene expression of β1-AR and especially β2-AR in WAT of lean mice but not in DIO mice. The lack of changes of β-AR gene expression in the WAT of obese mice is in agreement with previous reports demonstrating a decreased sensitivity of fat cells to adrenergic stimulation in obesity (van Baak, 2001). Although an additional role of classic hypothalamus–pituitary–endocrine mechanisms cannot be entirely ruled out, our combined set of data on SNA activity, genetically engineered β-adrenergic receptor deficient mice, and β-ARs gene expression profiles indicate that the SNS plays a functionally important role in the observed CNS GLP-1–WAT cross talk.
Finally, it has been reported that NOR-1, a specific target of β2-AR, is involved in the regulation of genes controlling fatty acid and glucose oxidation in skeletal muscle (Pearen et al., 2006, 2008). As NOR-1 has also been identified in adipose tissue, we hypothesized that NOR-1 might be regulated by the increased expression of β2-AR in WAT of centrally GLP-1-infused lean mice. Our finding of an increase in NOR-1 expression in WAT of lean but not obese mice supports the hypothesis that NOR-1 is positively regulated by β2-AR and plays an important role in fatty acid metabolism not only in muscle but also in WAT.
As summarized in Figure 8, we have provided a combination of pharmacological and genetic evidence to demonstrate that the CNS GLP-1 system decreases fat storage via direct modulation of adipocyte metabolism. This CNS GLP-1 control of adipocyte lipid metabolism appears to be, at least to a significant extent, mediated by the SNS, particularly β2-AR, and is independent of parallel changes in food intake and body weight. Importantly, the CNS GLP-1 system loses the capacity to modulate adipocyte metabolism in obese states, suggesting an obesity-induced adipocyte resistance to CNS GLP-1.
Figure 8.
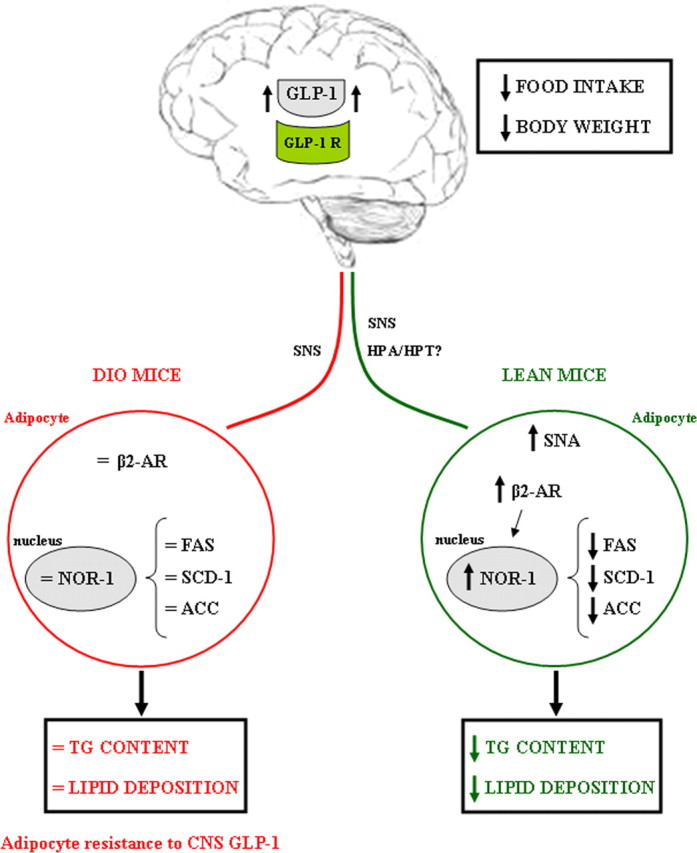
Schematic overview summarizing the pharmacological effects of CNS GLP-1 on fat tissue. Stimulation of CNS GLP-1 increases sympathetic nerve activity in lean mice, leading to a stimulation of β2-AR and NOR-1 and thereby decreasing the expression of some key enzymes promoting lipid deposition. The role of the hypothalamus–pituitary–adrenal axis and/or the hypothalamus–pituitary–thyroid axis needs to be elucidated. These metabolic changes in fat tissue represent a synergistic shift in substrate choice and nutrient partitioning, resulting in decreased energy storage. Contrary, in DIO mice, CNS GLP-1 loses its capacity to act on WAT, indicating that obesity induces an adipocyte resistance to CNS GLP-1.
Footnotes
This work was supported by the European Community FP6 funding (contract no. LSHMCT-2003-503041 to C.D., F.R.-J., M.H.T.), by Swiss National Science Foundation Grant No. 310000-120147 (F.R.-J.), and by Ministerio de Educación y Ciencia Grant RYC-2008-02219 (to R.N.).
References
- Baggio LL, Drucker DJ. Biology of incretins: GLP-1 and GIP. Gastroenterology. 2007;132:2131–2157. doi: 10.1053/j.gastro.2007.03.054. [DOI] [PubMed] [Google Scholar]
- Baggio LL, Huang Q, Brown TJ, Drucker DJ. A recombinant human glucagon-like peptide (GLP)-1-albumin protein (albugon) mimics peptidergic activation of GLP-1 receptor-dependent pathways coupled with satiety, gastrointestinal motility, and glucose homeostasis. Diabetes. 2004;53:2492–2500. doi: 10.2337/diabetes.53.9.2492. [DOI] [PubMed] [Google Scholar]
- Bartness TJ, Song CK. Thematic review series: adipocyte biology. Sympathetic and sensory innervation of white adipose tissue. J Lipid Res. 2007;48:1655–1672. doi: 10.1194/jlr.R700006-JLR200. [DOI] [PubMed] [Google Scholar]
- Bertin E, Arner P, Bolinder J, Hagström-Toft E. Action of glucagon and glucagon-like peptide-1-(7–36) amide on lipolysis in human subcutaneous adipose tissue and skeletal muscle in vivo. J Clin Endocrinol Metab. 2001;86:1229–1234. doi: 10.1210/jcem.86.3.7330. [DOI] [PubMed] [Google Scholar]
- Buettner C, Muse ED, Cheng A, Chen L, Scherer T, Pocai A, Su K, Cheng B, Li X, Harvey-White J, Schwartz GJ, Kunos G, Rossetti L, Buettner C. Leptin controls adipose tissue lipogenesis via central, STAT3-independent mechanisms. Nat Med. 2008;14:667–675. doi: 10.1038/nm1775. [DOI] [PMC free article] [PubMed] [Google Scholar]
- Bullock BP, Heller RS, Habener JF. Tissue distribution of messenger ribonucleic acid encoding the rat glucagon-like peptide-1 receptor. Endocrinology. 1996;137:2968–2978. doi: 10.1210/endo.137.7.8770921. [DOI] [PubMed] [Google Scholar]
- Guilherme A, Virbasius JV, Puri V, Czech MP. Adipocyte dysfunctions linking obesity to insulin resistance and type 2 diabetes. Nat Rev Mol Cell Biol. 2008;9:367–377. doi: 10.1038/nrm2391. [DOI] [PMC free article] [PubMed] [Google Scholar]
- Han VK, Hynes MA, Jin C, Towle AC, Lauder JM, Lund PK. Cellular localization of proglucagon/glucagon-like peptide I messenger RNAs in rat brain. J Neurosci Res. 1986;16:97–107. doi: 10.1002/jnr.490160110. [DOI] [PubMed] [Google Scholar]
- Howard JK, Cave BJ, Oksanen LJ, Tzameli I, Bjørbaek C, Flier JS. Enhanced leptin sensitivity and attenuation of diet-induced obesity in mice with haploinsufficiency of Socs3. Nat Med. 2004;10:734–738. doi: 10.1038/nm1072. [DOI] [PubMed] [Google Scholar]
- Jin SL, Han VK, Simmons JG, Towle AC, Lauder JM, Lund PK. Distribution of glucagonlike peptide I (GLP-I), glucagon, and glicentin in the rat brain: an immunocytochemical study. J Comp Neurol. 1988;271:519–532. doi: 10.1002/cne.902710405. [DOI] [PubMed] [Google Scholar]
- Kastin AJ, Akerstrom V, Pan W. Interactions of glucagon-like peptide-1 (GLP-1) with the blood-brain barrier. J Mol Neurosci. 2002;18:7–14. doi: 10.1385/JMN:18:1-2:07. [DOI] [PubMed] [Google Scholar]
- Kinzig KP, D'Alessio DA, Herman JP, Sakai RR, Vahl TP, Figueiredo HF, Murphy EK, Seeley RJ, Figueredo HF. CNS glucagon-like peptide-1 receptors mediate endocrine and anxiety responses to interoceptive and psychogenic stressors. J Neurosci. 2003;23:6163–6170. doi: 10.1523/JNEUROSCI.23-15-06163.2003. [DOI] [PMC free article] [PubMed] [Google Scholar]
- Knauf C, Cani PD, Perrin C, Iglesias MA, Maury JF, Bernard E, Benhamed F, Grémeaux T, Drucker DJ, Kahn CR, Girard J, Tanti JF, Delzenne NM, Postic C, Burcelin R. Brain glucagon-like peptide-1 increases insulin secretion and muscle insulin resistance to favor hepatic glycogen storage. J Clin Invest. 2005;115:3554–3563. doi: 10.1172/JCI25764. [DOI] [PMC free article] [PubMed] [Google Scholar]
- Knauf C, Cani PD, Ait-Belgnaoui A, Benani A, Dray C, Cabou C, Colom A, Uldry M, Rastrelli S, Sabatier E, Godet N, Waget A, Pénicaud L, Valet P, Burcelin R. Brain glucagon-like peptide 1 signaling controls the onset of high-fat diet-induced insulin resistance and reduces energy expenditure. Endocrinology. 2008;149:4768–4777. doi: 10.1210/en.2008-0180. [DOI] [PubMed] [Google Scholar]
- Larsen PJ, Tang-Christensen M, Holst JJ, Orskov C. Distribution of glucagon-like peptide-1 and other preproglucagon-derived peptides in the rat hypothalamus and brainstem. Neuroscience. 1997a;77:257–270. doi: 10.1016/s0306-4522(96)00434-4. [DOI] [PubMed] [Google Scholar]
- Larsen PJ, Tang-Christensen M, Jessop DS. Central administration of glucagon-like peptide-1 activates hypothalamic neuroendocrine neurons in the rat. Endocrinology. 1997b;138:4445–4455. doi: 10.1210/endo.138.10.5270. [DOI] [PubMed] [Google Scholar]
- Lin S, Thomas TC, Storlien LH, Huang XF. Development of high fat diet-induced obesity and leptin resistance in C57Bl/6J mice. Int J Obes Relat Metab Disord. 2000;24:639–646. doi: 10.1038/sj.ijo.0801209. [DOI] [PubMed] [Google Scholar]
- López M, Lage R, Saha AK, Pérez-Tilve D, Vázquez MJ, Varela L, Sangiao-Alvarellos S, Tovar S, Raghay K, Rodríguez-Cuenca S, Deoliveira RM, Castañeda T, Datta R, Dong JZ, Culler M, Sleeman MW, Alvarez CV, Gallego R, Lelliott CJ, Carling D, et al. Hypothalamic fatty acid metabolism mediates the orexigenic action of ghrelin. Cell Metab. 2008;7:389–399. doi: 10.1016/j.cmet.2008.03.006. [DOI] [PubMed] [Google Scholar]
- Ma X, Bruning J, Ashcroft FM. Glucagon-like peptide 1 stimulates hypothalamic proopiomelanocortin neurons. J Neurosci. 2007;27:7125–7129. doi: 10.1523/JNEUROSCI.1025-07.2007. [DOI] [PMC free article] [PubMed] [Google Scholar] [Retracted]
- Meeran K, O'Shea D, Edwards CM, Turton MD, Heath MM, Gunn I, Abusnana S, Rossi M, Small CJ, Goldstone AP, Taylor GM, Sunter D, Steere J, Choi SJ, Ghatei MA, Bloom SR. Repeated intracerebroventricular administration of glucagon-like peptide-1-(7–36) amide or Exendin-(9–39) alters body weight in the rat. Endocrinology. 1999;140:244–250. doi: 10.1210/endo.140.1.6421. [DOI] [PubMed] [Google Scholar]
- Merchenthaler I, Lane M, Shughrue P. Distribution of pre-pro-glucagon and glucagon-like peptide-1 receptor messenger RNAs in the rat central nervous system. J Comp Neurol. 1999;403:261–280. doi: 10.1002/(sici)1096-9861(19990111)403:2<261::aid-cne8>3.0.co;2-5. [DOI] [PubMed] [Google Scholar]
- Mérida E, Delgado E, Molina LM, Villanueva-Peñacarrillo ML, Valverde I. Presence of glucagon and glucagon-like peptide-1-(7–36)amide receptors in solubilized membranes of human adipose tissue. J Clin Endocrinol Metab. 1993;77:1654–1657. doi: 10.1210/jcem.77.6.8263154. [DOI] [PubMed] [Google Scholar]
- Myers MG, Cowley MA, Münzberg H. Mechanisms of leptin action and leptin resistance. Annu Rev Physiol. 2008;70:537–556. doi: 10.1146/annurev.physiol.70.113006.100707. [DOI] [PubMed] [Google Scholar]
- Nogueiras R, Wiedmer P, Perez-Tilve D, Veyrat-Durebex C, Keogh JM, Sutton GM, Pfluger PT, Castaneda TR, Neschen S, Hofmann SM, Howles PN, Morgan DA, Benoit SC, Szanto I, Schrott B, Schürmann A, Joost HG, Hammond C, Hui DY, Woods SC, et al. The central melanocortin system directly controls peripheral lipid metabolism. J Clin Invest. 2007;117:3475–3488. doi: 10.1172/JCI31743. [DOI] [PMC free article] [PubMed] [Google Scholar]
- Nogueiras R, Veyrat-Durebex C, Suchanek PM, Klein M, Tschöp J, Caldwell C, Woods SC, Wittmann G, Watanabe M, Liposits Z, Fekete C, Reizes O, Rohner-Jeanrenaud F, Tschöp MH. Peripheral, but not central, CB1 antagonism provides food intake independent metabolic benefits in diet-induced obese rats. Diabetes. 2008;57:2977–2991. doi: 10.2337/db08-0161. [DOI] [PMC free article] [PubMed] [Google Scholar]
- Pearen MA, Ryall JG, Maxwell MA, Ohkura N, Lynch GS, Muscat GE. The orphan nuclear receptor, NOR-1, is a target of beta-adrenergic signaling in skeletal muscle. Endocrinology. 2006;147:5217–5227. doi: 10.1210/en.2006-0447. [DOI] [PubMed] [Google Scholar]
- Pearen MA, Myers SA, Raichur S, Ryall JG, Lynch GS, Muscat GE. The orphan nuclear receptor, NOR-1, a target of beta-adrenergic signaling, regulates gene expression that controls oxidative metabolism in skeletal muscle. Endocrinology. 2008;149:2853–2865. doi: 10.1210/en.2007-1202. [DOI] [PubMed] [Google Scholar]
- Pérez-Tilve D, González-Matías L, Alvarez-Crespo M, Leiras R, Tovar S, Diéguez C, Mallo F. Exendin-4 potently decreases ghrelin levels in fasting rats. Diabetes. 2007;56:143–151. doi: 10.2337/db05-0996. [DOI] [PubMed] [Google Scholar]
- Rahmouni K, Morgan DA, Morgan GM, Liu X, Sigmund CD, Mark AL, Haynes WG. Hypothalamic PI3K and MAPK differentially mediate regional sympathetic activation to insulin. J Clin Invest. 2004;114:652–658. doi: 10.1172/JCI21737. [DOI] [PMC free article] [PubMed] [Google Scholar]
- Rahmouni K, Fath MA, Seo S, Thedens DR, Berry CJ, Weiss R, Nishimura DY, Sheffield VC. Leptin resistance contributes to obesity and hypertension in mouse models of Bardet-Biedl syndrome. J Clin Invest. 2008;118:1458–1467. doi: 10.1172/JCI32357. [DOI] [PMC free article] [PubMed] [Google Scholar]
- Rodriquez de Fonseca F, Navarro M, Alvarez E, Roncero I, Chowen JA, Maestre O, Gómez R, Muñoz RM, Eng J, Blázquez E. Peripheral versus central effects of glucagon-like peptide-1 receptor agonists on satiety and body weight loss in Zucker obese rats. Metabolism. 2000;49:709–717. doi: 10.1053/meta.2000.6251. [DOI] [PubMed] [Google Scholar]
- Ruiz-Grande C, Alarcón C, Mérida E, Valverde I. Lipolytic action of glucagon-like peptides in isolated rat adipocytes. Peptides. 1992;13:13–16. doi: 10.1016/0196-9781(92)90134-o. [DOI] [PubMed] [Google Scholar]
- Sancho V, Trigo MV, González N, Valverde I, Malaisse WJ, Villanueva-Peñacarrillo ML. Effects of glucagon-like peptide-1 and exendins on kinase activity, glucose transport and lipid metabolism in adipocytes from normal and type-2 diabetic rats. J Mol Endocrinol. 2005;35:27–38. doi: 10.1677/jme.1.01747. [DOI] [PubMed] [Google Scholar]
- Sancho V, Trigo MV, Martín-Duce A, Gonz Lez N, Acitores A, Arnés L, Valverde I, Malaisse WJ, Villanueva-Peñacarrillo ML. Effect of GLP-1 on D-glucose transport, lipolysis and lipogenesis in adipocytes of obese subjects. Int J Mol Med. 2006;17:1133–1137. [PubMed] [Google Scholar]
- Sandoval D. CNS GLP-1 regulation of peripheral glucose homeostasis. Physiol Behav. 2008;94:670–674. doi: 10.1016/j.physbeh.2008.04.018. [DOI] [PMC free article] [PubMed] [Google Scholar]
- Schirra J, Katschinski M, Weidmann C, Schäfer T, Wank U, Arnold R, Göke B. Gastric emptying and release of incretin hormones after glucose ingestion in humans. J Clin Invest. 1996;97:92–103. doi: 10.1172/JCI118411. [DOI] [PMC free article] [PubMed] [Google Scholar]
- Seeley RJ, Blake K, Rushing PA, Benoit S, Eng J, Woods SC, D'Alessio D. The role of CNS glucagon-like peptide-1 (7–36) amide receptors in mediating the visceral illness effects of lithium chloride. J Neurosci. 2000;20:1616–1621. doi: 10.1523/JNEUROSCI.20-04-01616.2000. [DOI] [PMC free article] [PubMed] [Google Scholar]
- Tang-Christensen M, Larsen PJ, Göke R, Fink-Jensen A, Jessop DS, Møller M, Sheikh SP. Central administration of GLP-1-(7–36) amide inhibits food and water intake in rats. Am J Physiol. 1996;271:R848–856. doi: 10.1152/ajpregu.1996.271.4.R848. [DOI] [PubMed] [Google Scholar]
- Tang-Christensen M, Vrang N, Larsen PJ. Glucagon-like peptide 1(7–36) amide's central inhibition of feeding and peripheral inhibition of drinking are abolished by neonatal monosodium glutamate treatment. Diabetes. 1998;47:530–537. doi: 10.2337/diabetes.47.4.530. [DOI] [PubMed] [Google Scholar]
- Theander-Carrillo C, Wiedmer P, Cettour-Rose P, Nogueiras R, Perez-Tilve D, Pfluger P, Castaneda TR, Muzzin P, Schürmann A, Szanto I, Tschöp MH, Rohner-Jeanrenaud F. Ghrelin action in the brain controls adipocyte metabolism. J Clin Invest. 2006;116:1983–1993. doi: 10.1172/JCI25811. [DOI] [PMC free article] [PubMed] [Google Scholar]
- Turton MD, O'Shea D, Gunn I, Beak SA, Edwards CM, Meeran K, Choi SJ, Taylor GM, Heath MM, Lambert PD, Wilding JP, Smith DM, Ghatei MA, Herbert J, Bloom SR. A role for glucagon-like peptide-1 in the central regulation of feeding. Nature. 1996;379:69–72. doi: 10.1038/379069a0. [DOI] [PubMed] [Google Scholar]
- Valverde I, Mérida E, Delgado E, Trapote MA, Villanueva-Peñacarrillo ML. Presence and characterization of glucagon-like peptide-1(7–36) amide receptors in solubilized membranes of rat adipose tissue. Endocrinology. 1993;132:75–79. doi: 10.1210/endo.132.1.8380388. [DOI] [PubMed] [Google Scholar]
- van Baak MA. The peripheral sympathetic nervous system in human obesity. Obes Rev. 2001;2:3–14. doi: 10.1046/j.1467-789x.2001.00010.x. [DOI] [PubMed] [Google Scholar]
- Vázquez MJ, González CR, Varela L, Lage R, Tovar S, Sangiao-Alvarellos S, Williams LM, Vidal-Puig A, Nogueiras R, López M, Diéguez C. Central resistin regulates hypothalamic and peripheral lipid metabolism in a nutritional-dependent fashion. Endocrinology. 2008;149:4534–4543. doi: 10.1210/en.2007-1708. [DOI] [PubMed] [Google Scholar]
- Villanueva-Peñacarrillo ML, Márquez L, González N, Díaz-Miguel M, Valverde I. Effect of GLP-1 on lipid metabolism in human adipocytes. Horm Metab Res. 2001;33:73–77. doi: 10.1055/s-2001-12428. [DOI] [PubMed] [Google Scholar]
- Widdowson PS, Upton R, Buckingham R, Arch J, Williams G. Inhibition of food response to intracerebroventricular injection of leptin is attenuated in rats with diet-induced obesity. Diabetes. 1997;46:1782–1785. doi: 10.2337/diab.46.11.1782. [DOI] [PubMed] [Google Scholar]
- Willms B, Werner J, Holst JJ, Orskov C, Creutzfeldt W, Nauck MA. Gastric emptying, glucose responses, and insulin secretion after a liquid test meal: effects of exogenous glucagon-like peptide-1 (GLP-1)-(7–36) amide in type 2 (noninsulin-dependent) diabetic patients. J Clin Endocrinol Metab. 1996;81:327–332. doi: 10.1210/jcem.81.1.8550773. [DOI] [PubMed] [Google Scholar]
- Woods SC, Seeley RJ, Porte D, Jr, Schwartz MW. Signals that regulate food intake and energy homeostasis. Science. 1998;280:1378–1383. doi: 10.1126/science.280.5368.1378. [DOI] [PubMed] [Google Scholar]
- Yamamoto H, Lee CE, Marcus JN, Williams TD, Overton JM, Lopez ME, Hollenberg AN, Baggio L, Saper CB, Drucker DJ, Elmquist JK. Glucagon-like peptide-1 receptor stimulation increases blood pressure and heart rate and activates autonomic regulatory neurons. J Clin Invest. 2002;110:43–52. doi: 10.1172/JCI15595. [DOI] [PMC free article] [PubMed] [Google Scholar]
- Zarjevski N, Cusin I, Vettor R, Rohner-Jeanrenaud F, Jeanrenaud B. Intracerebroventricular administration of neuropeptide Y to normal rats has divergent effects on glucose utilization by adipose tissue and skeletal muscle. Diabetes. 1994;43:764–769. doi: 10.2337/diab.43.6.764. [DOI] [PubMed] [Google Scholar]