

Abstract
A high intracellular chloride concentration in immature neurons leads to a depolarizing action of GABA that is thought to shape the developing neuronal network. We show that GABA-triggered depolarization and Ca2+ transients were attenuated in mice deficient for the Na–K–2Cl cotransporter NKCC1. Correlated Ca2+ transients and giant depolarizing potentials (GDPs) were drastically reduced and the maturation of the glutamatergic and GABAergic transmission in CA1 delayed. Brain morphology, synaptic density, and expression levels of certain developmental marker genes were unchanged. The expression of lynx1, a protein known to dampen network activity, was decreased. In mice deficient for the neuronal Cl−/HCO3− exchanger AE3, GDPs were also diminished. These data show that NKCC1-mediated Cl− accumulation contributes to GABAergic excitation and network activity during early postnatal development and thus facilitates the maturation of excitatory and inhibitory synapses.
Introduction
The development and maturation of the brain involve cellular proliferation and migration, followed by dendritic and axonal outgrowth, synapse formation, and circuit refinement. Whereas the first events are mainly genetically determined, the latter processes are believed to depend on intrinsic spontaneous and later on extrinsically evoked neuronal activity (Katz and Shatz, 1996; Khazipov and Luhmann, 2006). GABA, the main inhibitory neurotransmitter of the mature CNS, is the main excitatory agonist in the immature brain (Ben-Ari et al., 1989) and is thought to be important for brain development (Hanse et al., 1997; Leinekugel et al., 1997; Ben-Ari, 2002; Owens and Kriegstein, 2002). GABA-dependent depolarization can lead to network-driven, spontaneous giant depolarizing potentials (GDPs), which drive the correlated activity of large ensembles of pyramidal neurons in the developing hippocampus (Khazipov et al., 1997; Leinekugel et al., 1997; Garaschuk et al., 1998; Ben-Ari, 2002). The ensuing opening of voltage-gated calcium channels results in Ca2+ oscillations, which may trigger neuronal growth and synaptogenesis. GDPs disappear around the second postnatal week with decreasing neuronal [Cl−]i (Garaschuk et al., 1998) that results from the increasing expression of the K–Cl cotransporter KCC2 (Rivera et al., 1999; Stein et al., 2004). Disruption of Kcc2 in mice leads to hyperexcitability and perinatal death because of impaired synaptic inhibition in spinal cord and brainstem (Hübner et al., 2001b). Conversely, premature lowering of [Cl−]i by overexpressing KCC2 in Xenopus tectal neurons blocks the normal developmental increase in AMPA receptor-mediated retinotectal transmission (Akerman and Cline, 2006). Using in utero electroporation, KCC2 was expressed prematurely in rat ventricular progenitors and cortical neurons (Cancedda et al., 2007), resulting in a marked impairment of morphological maturation.
The mechanisms contributing to intracellular chloride accumulation in immature neurons are insufficiently characterized. The Na–K–2Cl cotransporter NKCC1, which uses the inwardly directed sodium gradient to raise [Cl−]i, shows a decreasing neuronal expression during postnatal development (Clayton et al., 1998; Hübner et al., 2001a). Inhibition of Na–K–2Cl cotransport by bumetanide causes a hyperpolarizing shift of the GABA reversal potential in rat neocortical neurons (Yamada et al., 2004) and in hippocampal neurons (Dzhala et al., 2005; Sipilä et al., 2006). Likewise, in dorsal root ganglion neurons, which normally maintain high levels of NKCC1 but do not express KCC2, disruption of Nkcc1 abolishes GABA-induced depolarization (Sung et al., 2000). Small interfering RNA-mediated knock-down of NKCC1 in the developing cortex entailed profound morphological and developmental changes in single neurons (Wang and Kriegstein, 2008).
We used Nkcc1-knock-out (KO) (Nkcc1−/−) mice (Pace et al., 2000) to examine the role of NKCC1 in the regulation of [Cl−]i and the developing neuronal network in the immature hippocampus. Diminished GABAergic excitation in Nkcc1−/− mice resulted in reduced and less correlated spontaneous network activity. We further show that the neuronal anion exchanger AE3 also influences early network activity. Whereas we did not detect morphological defects, we observed a delayed maturation of glutamatergic and GABAergic synapses in Nkcc1−/− mice. Our results demonstrate the importance of GABAergic excitation for early network development and suggest a homeostatic control of network excitability by nicotinergic mechanisms.
Materials and Methods
Mice.
The generation of Nkcc1−/− and Ae3−/− mice used in this study has been described previously (Pace et al., 2000; Hentschke et al., 2006). Studies were performed on a C57BL/6 (NKCC1) or a mixed 129-SVJ/C57BL/6 (AE3) background, respectively, using littermates as controls. Genotyping was performed on tail biopsy DNA by PCR using standard protocols. For Nkcc1, the sense primer F1 (GCA AAT ATC TCA GGT GAT CTT GC) and the antisense primers R1 (GAG TTC TGT TGC TAC TTC TGA AC) and R2 (CTA AAG CGC ATG CTC CAG ACT GCC) were used in a single PCR mix. The primer pair F1/R1 amplified a ∼600 bp band for the wild-type (WT) allele and the primer pair F1/R2 a ∼200 bp band for the targeted allele. For Ae3, the sense primer F1′ (GCC ACC AGG GGA ATG ACA AGC CCG) and the antisense primers R1′ (CTG GAG ACC TGG GGG TTG GGC TAA) and R2′ (TCT CTA GAC ACC TAG CTC CCA ACA) were used in a single PCR mix, F1′/R1′ yielding a ∼800 bp amplicon in the knock-out and the primer pair F1′/R2′, a ∼400 bp wild-type allele. Experiments were approved by the Ministry of Science and Public Health of Hamburg and Berlin, Germany. Experimenters were blinded to the genotype.
Expression analysis.
Total hippocampal RNA was extracted from postnatal day 1 (P1), P5, and P15 Nkcc1−/− and wild-type littermates using Trizol (Invitrogen) reagent and the High Pure RNA purification kit (QIAGEN). RNA was transcribed into cDNA using the SuperScript II cDNA kit (Invitrogen) with random hexamers. Real-time PCR was performed using the 7900 HT cycler from Applied Biosystems and the SYBR Green Power PCR master mix (Applied Biosystems) and normalized to GAPDH (glyceraldehyde-3-phosphate dehydrogenase) and HPRT (hypoxanthine phosphoribosyltransferase). An initial denaturation step (10 min at 95°C) was followed by 40 cycles with two steps: 95°C for 15 s, followed by 60°C for 60 s. Each sample was amplified in triplicate and gave consistent results in two independent experiments. The value of one P1 animal, the calibrator, was set to 1. All other amplicons are shown as x-fold of the calibrator. Contamination with genomic DNA was negligible. Primers are listed in supplemental Table 1 (available at www.jneurosci.org as supplemental material).
Affymetrix GeneChip Mouse Expression Array 430A and TEST chips were used for expression analysis. Total hippocampal RNA was extracted from three Nkcc1−/− and three control mice at P5 using Trizol reagent (Invitrogen) followed by the High Pure RNA purification kit (QIAGEN). First-strand cDNA was synthesized using T7-Oligo-dT24 Primer (Ambion) and Superscript II (Invitrogen) following the manufacturers' instructions. Second-strand synthesis was accomplished using Escherichia coli DNA ligase, E. coli DNA polymerase I, E. coli RNase H and T4 DNA polymerase (all from Invitrogen) according to the manufacturers' instructions. cDNA was then extracted using phenol–chloroform–isoamylalcohol plus EDTA and precipitated with NH4OAc and EtOH, washed twice with 80% EtOH, dried, and dissolved in H2O. Biotin-labeled cRNA was synthesized with the RNA labeling kit (Enzo). RNA and cDNA quality were controlled at all stages. Labeled cRNA was checked on TEST chips before hybridizing chip A according to the Affymetrix protocol. Chip data were analyzed using the RMAexpress software (Bolstad et al., 2003) (version 0.4.1 release) followed by t test evaluation (cutoff, p > 0.05). In situ hybridization was performed as described previously (Hübner et al., 2001a).
Slice electrophysiology.
Brains were removed from decapitated mice and placed directly into chilled artificial CSF (ACSF) containing the following (in mm): 119 NaCl, 2.5 KCl, 4 CaCl2, 1.3 MgSO4, 2.7 MgCl2, 1 NaH2PO4, 26 NaHCO3, and 11 glucose (unless otherwise indicated), which was gassed continuously with 95% O2/5% CO2 (carbogen). From P1 to P7, brains were cut horizontally 350 μm thick with a vibratome (Leica). In the case of 2-week-old mice, we cut transverse hippocampal slices. After equilibration in gassed ACSF at 32°C for at least 45 min, slices were placed into a bath chamber, and continuously superfused with carbogen-gassed ACSF at room temperature (22–24°C) at a rate of 2–3 ml/min. Pyramidal CA1 and CA3 neurons were visualized using differential interference contrast infrared video microscopy.
The GABA reversal potential was determined in P1 CA1 pyramidal neurons in the presence of TTX (0.5 μm) to block voltage-gated Na+ channels and exclude network effects. GABA (100 μm) was bath applied. Electrodes (Clarke Electromedical Instruments) (5–8 MΩ) were filled with a solution containing the following (in mm): 140 KCl, 2 MgCl2, 10 HEPES, 5 EGTA at pH 7.4. Pipettes were dipped into this solution for several seconds and then backfilled with the same solution containing gramicidin (Sigma-Aldrich) (10 μg/ml). The chloride reversal potential was measured using a voltage ramp from +20 to −100 mV at a rate of 150 mV/s after stepping the membrane from a holding potential of −60 to +20 mV for 80 ms. Recordings were performed with an Axopatch 200A amplifier and analyzed with pClamp 8.0 (Molecular Devices).
Field EPSPs were recorded in the stratum radiatum of CA1 of P15 mice in the presence of 100 μm picrotoxin (PTX) (Sigma-Aldrich) using a MultiClamp 700A amplifier (Molecular Devices). Recording and stimulation electrodes were filled with ASCF containing the following (in mm): 119 NaCl, 2.5 KCl, 2.5 CaCl2, 1.3 MgSO4, 1 NaH2PO4, 26.2 NaHCO3, and 11 glucose. Inputs from CA1 to CA3 were severed to prevent propagation of epileptiform activity.
To measure the AMPA/NMDA ratio, whole-cell patch recordings were performed with 3–5 MΩ glass electrodes filled with an internal solution containing the following (in mm): 150 Cs-gluconate, 8 NaCl, 2 MgATP, 10 HEPES, 0.2 EGTA, 0.1 spermine, and 5 lidocaine N-ethyl chloride (QX-314) (Tocris Bioscience), pH 7.2. Ratios of AMPA to NMDA currents in CA1 pyramidal cells were obtained by evoking evoked EPSCs (eEPSCs) with a monopolar glass electrode. AMPA eEPSCs were recorded at −70 mV, the NMDA component was recorded at +40 mV, the current being taken 70 ms after stimulus. Spontaneous miniature EPSCs (mEPSCs) were recorded at −70 mV in the presence of TTX (0.5 μm), PTX (100 μm), and 50 mm sucrose in ACSF to increase the events frequency. mEPSCs were analyzed off-line with customized software using a threshold of 5 pA. Spontaneous miniature IPSCs (mIPSCs) were recorded at −70 mV in ACSF in the presence of 0.5 μm TTX and 20 μm NBQX. The pipette solution contained the following (in mm): 90 CsCl, 20 Cs-gluconate, 8 NaCl, 2 MgCl2, 2 QX-314, 10 HEPES, and 1 EGTA.
For extracellular measurements of spontaneous activity (GDPs), P5 and P10 slices were recorded at 32°C in ACSF containing 4.5 mm KCl. The 3–5 MΩ glass electrodes filled with ACSF were placed into the CA3 stratum pyramidale. Extracellular voltage changes were recorded using a MultiClamp 700A amplifier (Molecular Devices). Voltage changes were analyzed off-line with Clampfit (Molecular Devices) using a threshold of 0.01 mV and visual event control.
Calcium imaging.
Animals were decapitated, and their brains were removed and placed directly into chilled ACSF containing the following (in mm): 125 NaCl, 4.5 KCl, 1.25 NaH2PO4, 26 NaHCO3, 2 CaCl2, 1 MgCl2, and 20 glucose gassed continuously with carbogen. The 300 μm horizontal slices were equilibrated in gassed ACSF at 32°C for at least 45 min and then loaded with the Ca2+-sensitive dye fura-2 AM (15 μm; Invitrogen) in ACSF for 30 min at 37°C. Fura-2 was excited using a multiple wavelength monochromator (Polychrome IV; TILL Photonics) and the emitted light filtered at a wavelength of 510 nm using a bandpass filter. Images were obtained using a 40× water-immersion objective fitted to a CCD camera (Imago) on an upright microscope (Olympus; BXWI50) at a 0.5 Hz rate. To record responses to either GABA (100 μm) or glutamate (100 μm), TTX (0.5 μm) was added to the superfusion buffer (ACSF) to block network effects. Analysis was performed with the TILLvisION software (version 4.0; TILL Photonics) for user-defined individual pyramidal cell somata. [Ca2+]i was expressed as the ratio of fura-2 fluorescence intensity at 340 nm divided by that at 380 nm. [Ca2+]i changes in response to GABA or glutamate were calculated by subtracting the average [Ca2+]i of five consecutive images before agonist application from the peak fluorescence in response to these drugs (Δ340/380).
Spontaneous CA1 Ca2+ events were recorded in ACSF at 32°C (without TTX; continuously gassed with carbogen) for 500 s at 2 Hz sampling rate using a 40× water-immersion objective (Olympus) lens. The change in [Ca2+]i for individual cells was calculated.
To analyze the network of spontaneously active neurons, we adopted a method described by Schwartz et al. (1998). Changes in fluorescence in multiple cells were analyzed with a program written in MatLab (Mathworks). The onset of each calcium transient for every cell was determined by the following algorithm.
To correct for baseline drifts, we high-pass filtered the raw data in the following way. Each recording was separated into 10 segments of 50 s. The value corresponding to the lower 10% percentile of each segment was used as the baseline of the segment. This baseline value was placed in the middle of the respective segment. These points were fitted with a “spline” function, which was then subtracted from the recording.
Because biologically significant increases of intracellular Ca2+ are characterized by a fast rise-time, we used the first derivative of the baseline-corrected fluorescence trace to detect “Ca2+ events.” We determined the noise level of the recording to define a threshold for event detection in a two-step process. In the first step, we calculated the mean (MV1) and the SD (SD1) of the first derivative for each cell. Because these values include all Ca2+ events, a threshold based on this SD would be larger than necessary and might lead to false negatives. In particular, apparent noise levels and hence detection criteria would depend on the frequency of Ca2+ events in the recording, which would pose a problem when comparing KO and WT slices (the latter showing higher activity). Therefore, we minimized the influence of Ca2+ events on the detection threshold by excluding values above a first threshold [T1 = MV1 + 1.64 * SD1 (note that the mean value of the first derivate is almost zero)] to calculate a second mean (MV2) and second SD (SD2). Time points at which values exceeded a threshold based on MV2 and SD2 (T2 = MV2 + 3.09 * SD2) were defined as Ca2+ events. Thus, Ca2+-induced fluorescence continuously increasing over several time points will be interpreted as a series of Ca2+ events, whereas a “plateau” will just yield a single event at the beginning.
To test whether the coincidence of “Ca2+ events” (as determined by the above procedure) of different cells was attributable to some form of coupling, we compared our data to the coincidence expected by chance if neurons fire randomly and independently. This is commonly done by Monte Carlo simulations (Schwartz et al., 1998). These, however, are slow because they need a high number of simulations (N ∼ 1000) to give reliable results. Because speed is a critical factor in the analysis of large networks, we developed an analytical method to calculate probabilities of coinciding events. This method is illustrated below. In contrast to Monte Carlo simulations, which are only valid for a specific parameter set (Aguiló et al., 1999), our analytical model allows us to calculate the number of coincident events expected by chance independent of event rate and recording length. We then defined a correlation index Icorr as the ratio of coincidences found in a specific set of cell pairs to that expected by chance for the same parameters. In other words, if the number of coincidences is equal to that expected by chance, the correlation index equals 1, and increases with a larger event correlation.
For two given time series of length N, the number of events shall be n, m; 0 ≤ m, n ≤ N in each trace, and n ≥ m. In this case, the maximum of possible coincidences is m. The probability for M coinciding events is given by the following:
 |
using the Pascal matrix P with elements pi,j and
 |
The resulting distribution is known as hypergeometric distribution (Feller, 1968). We verified this specific numerical model against a Monte Carlo simulation (MCS). We obtained equivalent results when using sufficiently large sample sizes (N ≥ 10,000 MCS runs). This enabled us to calculate the significance for coinciding events, and also yielded a relative measure for coincidence. For two randomly chosen cells (i, j) of a set of cells with M coinciding events, the synchronous activity is described by the following matrix element:
 |
where E is the expectancy value as follows:
 |
This symmetric matrix is then used to calculate the correlation index Icorr by averaging the triangular elements (i ≠ j) and scaling with the number of elements (=number of possible cell pairs) as follows:
 |
Icorr represents the statistical average interaction in the observed set and describes the characteristics for a given number of cells (NC). Hence the number of possible cell pairs [N = (NC2 − NC)/2] may differ from set to set; averages of experiments with differing numbers of cells have to be weighted with the number of pairs.
We analyzed 12 KO and 9 WT slices at P2 and 35 KO and 33 WT slices at P4. The median of observed cells per set were n = 52 (27–88; KO) versus n = 56 (35–117; WT) at P2 and n = 49 (30–81; KO) versus n = 49 (22–86; WT) at P4. All recorded cells of one experiment (slice) were used for the analysis, leading to an average number of pairs of >1300 contributing to the index Icorr.
Details on the methods and routines in MatLab (Mathworks) will be made available on request.
Western blot analysis.
Hippocampi were dissected from P1, P5, and P15 Nkcc1−/− and WT mice. Tissues were homogenized in lysis buffer (20 mm Tris, 140 mm NaCl, 5 mm EDTA, 1% Triton X-100, pH 7.4) supplemented with a commercial protease inhibitor mixture (Complete; Roche). Debris was pelleted by centrifugation at 1000 × g for 10 min. The protein concentration of the supernatant was determined and 20 μg of total protein per lane were separated on 8.5–15% SDS-polyacrylamide gels, followed by a transfer to polyvinylidene difluoride membranes. These blots were incubated with respective primary antibodies and rabbit anti-actin or mouse anti-tubulin (both 1:2000; Sigma-Aldrich) as a loading control. Detection used a peroxidase-coupled anti-IgG antibody (Roche) and a chemoluminescence kit (Renaissance; DuPont). Quantification of Western blots was performed using a camera detection system (ChemiSmart 5000/ChemiCapt; PeqLab) allowing for linear signal integration. Band intensities were quantified using NIH ImageJ software. Intensity values were normalized to tubulin levels. The following primary antibodies were used: rabbit anti-KCC2 (1:500) (Hübner et al., 2001b), mouse anti-GluR2 (1:500; Millipore Bioscience Research Reagents), mouse anti-gephyrin (1:500; Synaptic Systems), mouse anti-glutamic acid decarboxylase (GAD)65/67 (1:500; BioTrend), mouse anti-Synaptophysin (1:1000; Sigma-Aldrich), rabbit anti-lynx1 (1:100) (Ibañez-Tallon et al., 2002), rabbit anti-GluR4p842 (1:1000) (Esteban et al., 2003), rabbit anti-GluR4 (1:1000), rabbit anti-GluR1 (1:1000), rabbit anti-GluR1p831 (1:1000), rabbit anti-GluR1p845 (1:1000; all from Millipore), rabbit anti-AE3 (1:200; epitope, H2N-CLLRKRREREQTKVEM-CONH2, purified with standard procedures against the peptide).
Morphological studies.
For light microscopy, brains were dissected and fixed at 4°C for 6 h in 4% paraformaldehyde (PFA) in PBS. The barrel cortex of P5 mice was stained for cytochrome oxidase as described previously (Iwasato et al., 2000). Nissl stainings were performed on 5 μm paraffin tissue sections. Immunohistological stainings were done on freely floating 50 μm cryosections. In brief, sections were blocked with 5% normal goat serum (NGS), 0.25% Triton X-100 in 0.1 m phosphate buffer (PB). Dilutions of primary and secondary fluorescence-labeled antibodies were applied in 0.1 m PB with 5% NGS and 0.25% Triton X-100. Sections were mounted on gelatinized glass slides, coverslipped with Fluoromount, and visualized using confocal microscopy (Leica TCS SP2). The following primary antibodies were used: rabbit anti-KCC2 (1:500) (Hübner et al., 2001b), mouse anti-Map2 (1:1000; Millipore Bioscience Research Reagents), rabbit anti-synaptophysin (1:1000; Synaptic Systems), mouse anti-reelin (1:1000; gift from A. Goffinet, Catholic University of Leuven, Leuven, Belgium), mouse anti-GAD65/67 (1:1000; BioTrend), mouse anti-synaptophysin (1:1000; Sigma-Aldrich), guinea pig anti-vGlut1 (1:500; Millipore Bioscience Research Reagents), rabbit anti-Snap25 (1:500; Synaptic Systems), rabbit anti-GABAA α1 (1:500; Millipore), rabbit anti-GABAA α3 (1:500; Sigma-Aldrich), and rabbit anti-GluR4 (1:1000; Millipore). Secondary antibodies were goat anti-rabbit 488 and goat anti-mouse 546 (both Invitrogen), each used at 1:1000. Nuclei were stained with TOTO-3 (Invitrogen; 1:2000).
Biocytin filling was done as described previously (Wilson and Sachdev, 2004) using the whole-cell patch-clamp technique. Briefly, P7 animals were decapitated, and brain slices were prepared as described above. CA1 neurons were patched using differential interference contrast visual control. After sealing and whole-cell access, Neurobiotin (Vector Laboratories) [2.5% in internal solution containing the following (in mm): 150 Cs-gluconate, 8 NaCl, 2 MgATP, 10 HEPES, 0.2 EGTA, pH 7.2] filling was done for 10–15 min. The slices were fixed in 4% PFA/PBS at 4°C overnight and Neurobiotin visualized using 488-coupled streptavidin (Invitrogen). Stack images were taken with a confocal microscope (Leica TCS SP2). After dendritic reconstruction, apical dendritic length and branching points were determined with NeuronJ (application of ImageJ; W. S. Rasband, ImageJ, National Institutes of Health, Bethesda, MD; http://rsb.info.nih.gov/ij/; 1997–2007). For the Sholl analysis of dendritic complexity (Sholl, 1953), crossings of apical dendrites with a grid of concentric circles spaced 5 μm and centered on the soma were counted.
For electron microscopy, four P4 and four P8 hippocampi per genotype were fixed in 1% glutaraldehyde and 1% paraformaldehyde in 0.1 m PB, postfixed in 1% OsO4 for 30 min, dehydrated in graded ethanol using 1% uranyl acetate in 70% ethanol for 30 min, and embedded in Epon 820 (Serva). Blocks were trimmed to contain only the stratum pyramidale and radiatum of the CA1 region. Thin sections were cut on a Reichert-Jung OmU3 ultramicrotome. Ultrathin sections were stained with uranyl acetate followed by lead citrate. Hippocampi were evaluated for the density of synapses. The spine synapse density was calculated using unbiased stereological methods as described previously (Prange-Kiel et al., 2004). Briefly, pairs of consecutive serial ultrathin sections were cut and collected on Formvar-coated single grids. The sections contained the upper and middle third of the CA1 stratum radiatum. Photographs were made at a magnification of 6600× with the observer blinded to the genotype. Areas occupied by interfering structures, such as large dendrites or blood vessels, were excluded. To obtain a comparable measure of synaptic numbers, unbiased for possible changes in synaptic size, the disector technique was used (Sterio, 1984). The density of spine synapses of pyramidal cell dendrites was calculated with the help of a reference grid superimposed on the EM prints. Only those spine synapses were counted that were present on the reference section but not on the look-up section. The disector volume was calculated by multiplying the unit area of the reference grid by the distance (0.09 μm) between the upper faces of the reference and the look-up section. At least 10 neuropil fields were photographed on each electron-microscopic grid. With at least two grids from each slice, containing at least two pairs of consecutive ultrathin sections, each slice provided a minimum of 20 neuropil fields.
Results
NKCC1-dependent chloride accumulation is important for excitatory GABA responses in P1 hippocampal pyramidal neurons
In situ hybridization of hippocampal sections showed that neuronal NKCC1 expression decreased from P1 to P15 in the CA1 and CA3 regions and in the dentate gyrus (supplemental Fig. S1A–H, available at www.jneurosci.org as supplemental material). Quantitative reverse transcription (RT)-PCR using RNA extracted from dissected hippocampi revealed a decline of NKCC1 mRNA levels from P1 to P15 by almost 50% (supplemental Fig. S1I, available at www.jneurosci.org as supplemental material), whereas the amount of the KCC2 message more than doubled during the same period (supplemental Fig. S1J, available at www.jneurosci.org as supplemental material). Expression levels of KCC2 did not differ between the WT and the NKCC1 KO hippocampus (supplemental Fig. S1J, available at www.jneurosci.org as supplemental material).
To determine whether NKCC1 contributes to GABAergic excitation by accumulating chloride into early postnatal neurons, GABA reversal potentials were measured using gramicidin-perforated patch-clamp recordings. Resting membrane potentials of P1 CA1 hippocampal pyramidal cells were unaltered in Nkcc1−/− neurons (−63.4 ± 2.4 vs −67.8 ± 2.3 mV in the WT; p = 0.21, t test; WT, six cells from four mice; Nkcc1−/−, nine cells from five mice). In the presence of GABA, the reversal potential shifted to −46.9 ± 3.1 mV in WT but only to −57.6 ± 1.9 mV in Nkcc1−/− neurons (Fig. 1A,B). The lower GABA-induced depolarization of Nkcc1−/− neurons [5.8 ± 0.7 mV (Nkcc1−/−) vs 20.9 ± 2.2 mV (WT); p < 0.05, t test] indicates a decrease of [Cl−]i, caused by the loss of the chloride cotransporter NKCC1.
Figure 1.

GABA-induced depolarization in hippocampal CA1 neurons depends on NKCC1. A, B, Representative current–voltage traces of hippocampal pyramidal CA1 neurons (P1) from both WT (A) and Nkcc1−/− (B) mice using gramicidin-perforated patch clamping before and during application of 100 μm GABA. C–E, Reduced Ca2+ entry in response to GABA, but not glutamate, in Nkcc1−/− CA1 neurons at P1. C, D, Typical fura-2 fluorescence traces indicative of intracellular calcium of a single WT (C) and Nkcc1−/− (D) CA1 neuron sequentially exposed to GABA (100 μm) and glutamate (100 μm) for 60 s each. The ratio of fluorescence at 340 and 380 nm, which increases with [Ca2+]i, is given. E, Ca2+ responses as indicated by mean changes in fura-2 fluorescence in response to GABA and glutamate in WT (filled bars) and Nkcc1−/− (open bars) P1 CA1 neurons (WT: 108 cells, 6 recordings, 5 mice; Nkcc1−/−: 141 cells, 7 recordings, 5 mice). The asterisks indicate significance (***p < 0.001, t test). Error bars indicate SEM.
Depolarization of neurons can evoke a Ca2+ response, which is mainly caused by the activation of voltage-gated calcium channels (Yuste and Katz, 1991). We recorded changes in the fluorescence of the Ca2+ indicator fura-2 as an indirect measure of the depolarization induced by GABA. WT pyramidal neurons responded rapidly to GABA (100 μm) with a transient Ca2+ signal of 1.03 ± 0.03 [F340/380 (peak) − F340/380 (baseline)]. This signal was approximately threefold larger than that evoked in Nkcc1−/− preparations (0.31 ± 0.02). The response to the excitatory neurotransmitter glutamate, in contrast, was not affected by the loss of NKCC1 (Fig. 1C–E; supplemental Fig. S2A,C, available at www.jneurosci.org as supplemental material). Hence calcium imaging provided additional support for a role of NKCC1 in early GABA-mediated excitation. This finding motivated us to use Nkcc1−/− mice as a model to study the role of GABA-mediated neuronal activity in the developing brain.
Spontaneous Ca2+ transients are reduced in number and are less correlated in hippocampal slices of Nkcc1−/− mice at P2 and P4
The depolarizing action of GABA is critical for neuronal network activity during the first week after birth (Leinekugel et al., 1997; Garaschuk et al., 1998). To investigate the role of NKCC1-dependent Cl− accumulation in spontaneous network activity, Ca2+ signals from fura-2 fluorescence traces (Fig. 2A) were quantified in the CA1 region of WT and Nkcc1−/− hippocampal slices. Data were reduced to “Ca2+ events” at the time point at which the rate of the fluorescence increase exceeded a certain threshold (for details, see Materials and Methods) (supplemental Fig. S3A,B, available at www.jneurosci.org as supplemental material). The frequency of Ca2+ events per neuron increased in WT from P2 (12.5 ± 0.5 events per 1000 s) to P4 (18.3 ± 0.6 events per 1000 s). In Nkcc1−/− animals, Ca2+ events were significantly reduced at P2 (7.1 ± 0.3 events/1000 s) and did not increase with time (P4, 7.1 ± 0.4 events/1000 s) (Fig. 2B).
Figure 2.

Correlated network activity is present in WT, but not in Nkcc1−/− hippocampal slices. A, Representative recordings of fura-2 fluorescence indicative of [Ca2+]i changes in single neurons in WT and Nkcc1−/− slices at P2 and P4. Most Ca2+ events in WT slices occur simultaneously in many neurons, whereas they are reduced in number and mostly lack correlation in Nkcc1−/− slices. Calibration: horizontal, 50 s; vertical, 0.15 F340/F380. B, C, Quantification of the number of calcium events (B) and of correlated activity (C) at P2 and P4 shows highly significant reduction in Nkcc1−/− slices (open bars) (P2: 3 mice per genotype, 6 slices per genotype; P4: 3 mice per genotype, 5 slices per genotype; p < 0.001, t test). Error bars indicate SEM.
To compare the degree of synchronous Ca2+ activity between different CA1 pyramidal neurons independent of overall activity, we developed an algorithm to determine a correlation index Icorr. Values of Icorr > 1 indicate a correlation greater than that achieved by chance alone. The correlation index was drastically decreased in Nkcc1−/− slices at both P2 [Icorr = 13.1 ± 0.3 (WT); Icorr = 2.7 ± 0.2 (Nkcc1−/−)] and at P4 [Icorr = 20.8 ± 0.3 (WT); Icorr = 2.1 ± 0.3 (Nkcc1−/−)], as illustrated in Figure 2C. Thus, NKCC1 plays a pivotal role in correlated network activity.
Frequency and amplitudes of GDPs are reduced in Nkcc1−/− and Ae3−/− mice at P5
GDPs of the early postnatal hippocampus are known to depend on GABA (Leinekugel et al., 1997; Ben-Ari, 2002; Sipilä et al., 2005). In mice, GDPs are observed in the first postnatal week and gradually disappear after P10 (Crépel et al., 2007). We measured GDPs at P5 by extracellular recordings of spontaneous activity in the CA3 stratum pyramidale. GDP frequencies and amplitudes were significantly reduced, but not abolished in Nkcc1−/− mice at P5 (Fig. 3A–C; supplemental Fig. S4A, available at www.jneurosci.org as supplemental material). At P10, GDP frequency had decreased and the difference between genotypes had vanished (supplemental Fig. S5, available at www.jneurosci.org as supplemental material).
Figure 3.

Reduced spontaneous electrical activity in CA3 of Nkcc1−/− and Ae3−/− hippocampal slices. A, Representative extracellular recordings in CA3 stratum pyramidale of P5 Nkcc1 and Ae3 WT and KO slices. The framed parts are shown as enlargements below the original trace. Calibration: horizontal, 2 min (original trace), 7.5 s (enlargement); vertical, 0.04 mV. Quantification of frequency (B), amplitude (C), and area under curve (AUC) (D) of single spontaneous electrical events are shown for Nkcc1 and Ae3 WT and KO slices. The asterisks indicate significant difference (*p < 0.05, ***p < 0.001, t test) (NKCC1: WT, 3 mice, 15 slices; KO, 3 mice, 19 slices; AE3: WT, 3 mice, 11 slices; KO, 3 mice, 12 slices). Different WT levels may be attributable to differences in genetic background of NKCC1 and AE3 mouse lines (see Materials and Methods). Error bars indicate SEM.
Because GABA was still slightly depolarizing in P1 pyramidal neurons of Nkcc1−/− mice (Fig. 1E), we hypothesized that transporters other than NKCC1 may also raise [Cl−]i and contribute to the generation of GDPs. The neuronal anion exchanger AE3 is expressed early in development (Hentschke et al., 2006) and is predicted to elevate [Cl−]i above electrochemical equilibrium. However, GABA reversal potentials and GABA-evoked Ca2+ responses of CA1 neurons did not differ between Ae3−/− and WT mice at P1 (supplemental Figs. S2B,D, S6, available at www.jneurosci.org as supplemental material), suggesting that Cl− accumulation by AE3 is insignificant compared with that by NKCC1 at that early time point. However, at P5, when AE3 protein levels had increased compared with P1 (supplemental Fig. S7I, available at www.jneurosci.org as supplemental material), disruption of AE3 decreased GDP frequency and amplitudes (Fig. 3A–C; supplemental Fig. S4B, available at www.jneurosci.org as supplemental material).
No gross structural alterations are evident in Nkcc1−/− brains
Because GABAA receptor-dependent depolarization has been implicated in the migration and differentiation of neuronal precursor cells (Owens and Kriegstein, 2002), we performed Nissl stainings of neocortical (Fig. 4A,B) and hippocampal sections (Fig. 4C,D) at P5. Gross brain structure appeared unaltered in Nkcc1−/− mice with regard to both layering and estimated neuron density. We did not detect changes in the refinement of the somatosensory barrel cortex at P5, a structure known to depend on neuronal activity (Iwasato et al., 2000; Lu et al., 2003) (Fig. 4E,F). Neither the quantification by electron microscopy of spine synapses per cubic micrometer in the stratum radiatum of the CA1 region at P4 and P8 (Fig. 4L) nor the reconstruction of individual P7 CA1 pyramidal neurons (Fig. 4G–K) revealed significant structural changes in Nkcc1−/− brains. In addition, hippocampal sections were stained for marker proteins such as GABAA receptor subunits α1 (Fig. 4M,N) and α3 (supplemental Fig. S8W,Z, available at www.jneurosci.org as supplemental material), GAD (a presynaptic marker of GABAergic synapses) (supplemental Fig. S8V,Y, available at www.jneurosci.org as supplemental material), the vesicular glutamate transporter vGlut1 (a presynaptic protein of glutamatergic synapses) (Fig. 4O,P; supplemental Fig. S8Q–T, available at www.jneurosci.org as supplemental material), and the neuronal KCl cotransporter KCC2 (supplemental Fig. S8A–H,U,X, available at www.jneurosci.org as supplemental material). None of these or other stainings (supplemental Fig. S8, available at www.jneurosci.org as supplemental material) indicated significant differences between WT and Nkcc1−/− brains, neither at P1 nor at P7.
Figure 4.
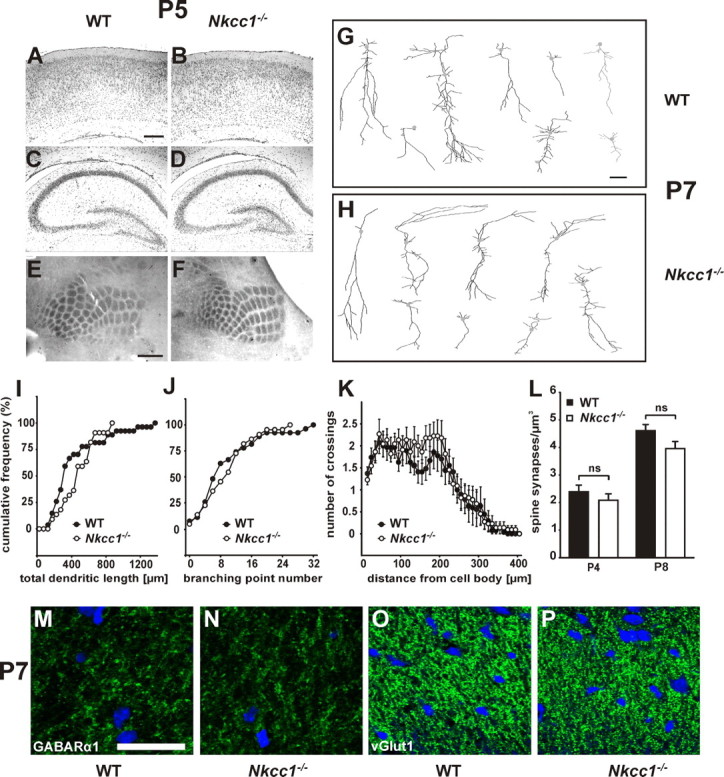
Gross morphology is intact in Nkcc1−/− brain. A–D, No obvious changes were detected in the layering of the cortex (A, B) and the hippocampus (C, D) in Nissl-stained sections. E, F, Analysis of the barrel cortex at P5 of WT (E) and Nkcc1−/− mice (F) did not reveal any differences in sections stained for cytochrome oxidase. G, H, Two-dimensional projection of three-dimensional reconstruction of representative biocytin-filled P7 CA1 pyramidal neurons of WT (G) and Nkcc1−/− (H) mice. Quantification of total dendritic length (I), branching point number (J), and Sholl test of dendritic complexity (K) revealed no major differences between WT and Nkcc1−/− mice (WT: 5 mice, 27 cells; Nkcc1−/−: 7 mice, 22 cells). L, Spine synapse numbers were unchanged in the stratum radiatum of CA1 neurons at P4 and P8 in Nkcc1−/− (white bars) compared with WT (black bars) (4 mice per age and genotype). Error bars indicate SEM. Immunocytochemistry (M–P) of GABAA receptor subunit α1 (M, N) and vesicular glutamate transporter vGLUT1 (O, P) showed comparable staining of P7 stratum radiatum in WT (M, O) and Nkcc1−/− (N, P) slices. Cell nuclei are stained in blue. Scale bars: (in A) A–D, 200 μm; (in E) E, F, 500 μm; (in G) G, H, 20 μm; (in M) M, N, 20 μm; (in M) O, P, 35 μm. Statistical analysis was as follow: total dendritic length: p > 0.05, Kolmogorov–Smirnov test; branching point number: p > 0.05, Kolmogorov–Smirnov test; Sholl test, p > 0.05, t test for individual data points; synapse number: p > 0.05, t test.
The maturation of excitatory and inhibitory synapses is delayed in CA1 pyramidal cells at P7
The absence of gross morphological abnormalities in Nkcc1−/− animals did not exclude a functional deficit in synaptic transmission. To test basal synaptic transmission, we compared the size of the presynaptic fiber volley (input) with the slope of the excitatory postsynaptic field potential (output) in the stratum radiatum of CA1. No differences were found between genotypes at P15, a time point after the GABA switch in that region (Stein et al., 2004) (supplemental Fig. S9A, available at www.jneurosci.org as supplemental material). Paired-pulse facilitation at 40 and 100 ms pulse interval (150 ms not shown) was not significantly altered either, excluding a major presynaptic defect at this time point (supplemental Fig. S9B, available at www.jneurosci.org as supplemental material).
During early postnatal development, excitatory hippocampal synapses contain mainly NMDA receptors and lack AMPA receptors (Durand et al., 1996; Tyzio et al., 1999). To examine the maturation of excitatory synaptic transmission, the relative contribution of CA1 AMPA versus NMDA receptors was measured at the end of the first postnatal week, when NKCC1 is rapidly replaced by KCC2 in the WT, and at P15, when KCC2 plays the major role in neuronal chloride homeostasis. Whereas the AMPA/NMDA ratio was unaltered at P15, it was reduced in Nkcc1−/− slices at P7 to 1.3 ± 0.1 (Nkcc1−/−) versus 1.8 ± 0.1 in WT (Fig. 5A). To understand the basis of the reduction of the AMPA/NMDA ratio, we evaluated mEPSCs. Similar to the changes in AMPA/NMDA ratio, mEPSC amplitudes and frequencies were reduced at P7 (Fig. 5B,C), but not at P15 (Fig. 5D,E), indicating a delay in the maturation of excitatory synapses in the absence of NKCC1.
Figure 5.
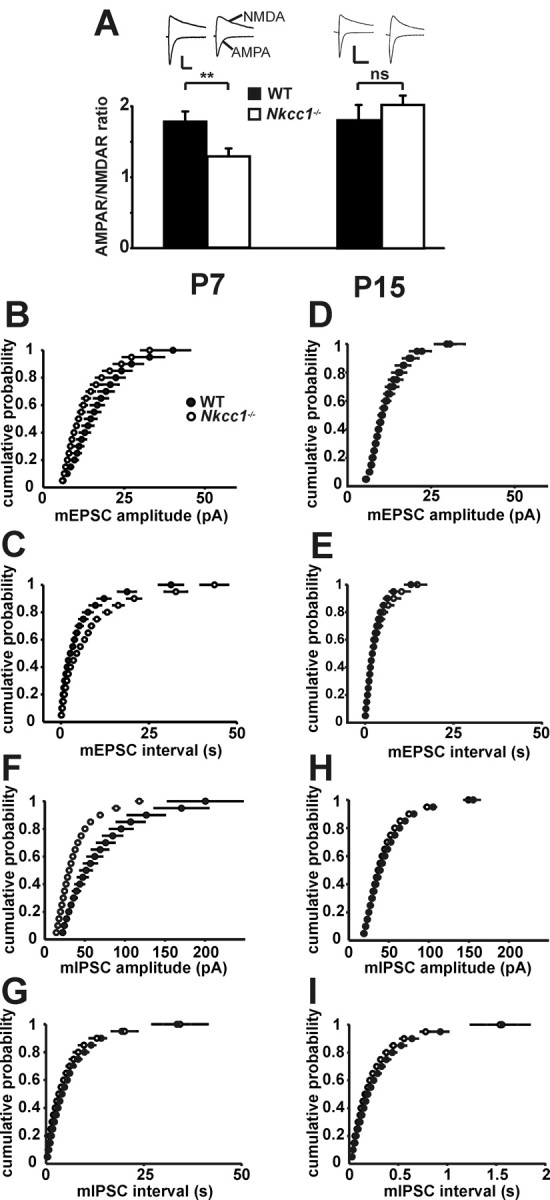
Delayed maturation of glutamatergic and GABAergic synapses in Nkcc1−/− CA1 neurons. A, AMPA/NMDA ratio is reduced in Nkcc1−/− CA1 neurons at P7 but not at P15 (P7: 5 mice per genotype; WT, 25 cells; KO, 26 cells; P15: 3 mice per genotype; WT, 8 cells, KO, 10 cells; mean ± SEM). Representative current traces for WT and Nkcc1−/− CA1 neurons at P7 and P15 are shown above. Stimulation artifacts were omitted for clarity. Calibration: P7: vertical, 40 pA; horizontal, 50 ms; P15: vertical, 100 pA; horizontal, 100 ms. B, C, mEPSCs are reduced in amplitude (B) and frequency (C) at P7, but not at P15 (D, E) in Nkcc1−/− CA1 neurons as shown in cumulative distribution plots (3 mice per age and genotype; P7: WT, 10 cells; KO, 11 cells; P15: WT, 9 cells; KO, 10 cells; P7: amplitude, p < 0.005; interval, p < 0.005; P15: amplitude, p > 0.1; interval, p > 0.1; Kolmogorov–Smirnov test). F, G, In Nkcc1−/− CA1 neurons, mIPSCs are reduced in amplitude (F) but not frequency (G) at P7, whereas they were unchanged at P15 (H, I) as shown in cumulative distribution plots (3 mice per age and genotype; P7: WT, 8 cells; KO, 16 cells; P15: WT, 23 cells; KO, 30 cells; P7: amplitude, p < 0.0005; interval, p > 0.1; P15: amplitude, p > 0.1; interval, p > 0.1; Kolmogorov–Smirnov test). The asterisks indicate significance (**p < 0.01, t test).
Similar to mEPSCs, the amplitudes of mIPSCs of Nkcc1−/− CA1 pyramidal neurons were reduced at P7. This difference had vanished at P15. mIPSC frequencies were unchanged throughout (Fig. 5F–I). These results indicate an influence of NKCC1 on the maturation of GABAergic synapses.
AMPA receptors are the major source of CA1 postsynaptic glutamatergic depolarization in the adult brain (Bredt and Nicoll, 2003). Phosphorylation of specific serines of GluR1 and GluR4 is important for their regulated postsynaptic insertion (Boehm and Malinow, 2005). We therefore analyzed the phosphorylation state of GluR1 and GluR4 with phosphospecific antibodies. GluR1 phosphorylation at serines 831 and 845 was not significantly altered between WT and Nkcc1−/− hippocampus at P5 and P15 (supplemental Fig. S7E,F, available at www.jneurosci.org as supplemental material). In contrast, GluR4 phosphorylation at serine 842 was moderately, but significantly decreased compared with WT at P5 (Fig. 6A) and drastically increased at P15 (Fig. 6B). At both time points, total amounts of GluR1, GluR2, and GluR4 did not differ between the genotypes neither on protein (Fig. 6A,B; supplemental Fig. S7A–C,E,F, available at www.jneurosci.org as supplemental material) nor on RNA levels (supplemental Fig. S10, available at www.jneurosci.org as supplemental material). In the hippocampal formation, GluR4 mainly localized to GABAergic interneurons at P15 in WT and Nkcc1−/− animals (supplemental Fig. S11, available at www.jneurosci.org as supplemental material). The decrease in S842 phosphorylation of GluR4 in the hippocampus of young Nkcc1−/− animals might be a consequence of the decreased and mostly uncorrelated neuronal activity (Fig. 2) and may underlie the observed decreased AMPA/NMDA ratio at P7 (Fig. 5A).
Figure 6.
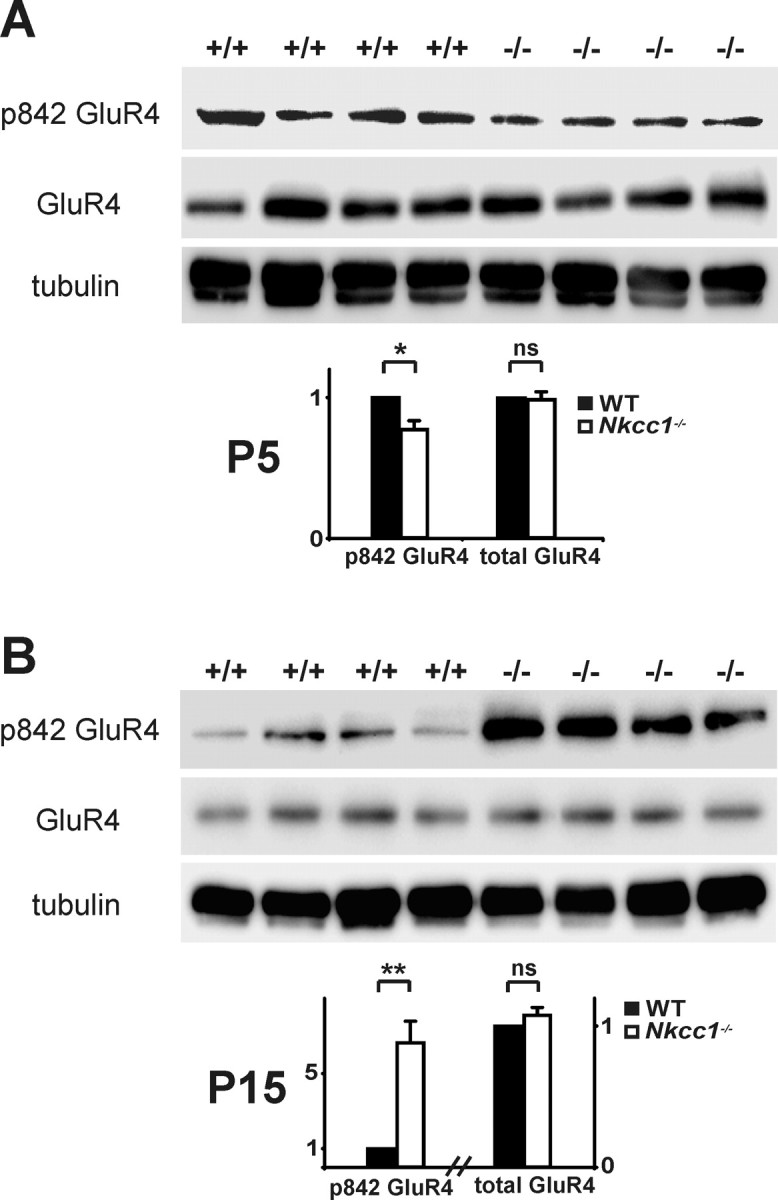
Differential GluR4 phosphorylation during development. A, B, Compared with WT, in the Nkcc1−/− hippocampus serine 842 of GluR4 is less phosphorylated at P5 (A) and more phosphorylated at P15 (B). Quantification of total and phosphorylated (at serine 842) GluR4 is shown below the respective Western blots (normalized to tubulin ± SEM; P5: n > 12 animals per genotype, P15: n > 4 animals per genotype). The asterisks indicate significance (*p < 0.05, **p < 0.01, t test).
To determine whether changes in spontaneous neuronal activity in Nkcc1−/− hippocampi may also induce more global changes, we analyzed the phosphorylation states of the transcriptional regulator CREB (cAMP-responsive element binding protein), which plays a key role in changing glutamatergic transmission in long-term plasticity, and of the upstream ERK1/2 (extracellular signal-regulated kinases 1/2). We could not detect significant differences between the genotypes in the phosphorylation states of these proteins, neither at P5 nor at P15 (supplemental Fig. S7G,H, available at www.jneurosci.org as supplemental material).
lynx1, a modulator of network activity, is decreased in the developing Nkcc1−/− hippocampus
The changes in spontaneous activity in the Nkcc1−/− hippocampus prompted us to look for alterations in expression levels of activity-dependent genes, genes important for GABAergic function, and genes involved in postsynaptic glutamatergic transmission (supplemental Figs. S7A–D, S10, available at www.jneurosci.org as supplemental material). Except for Olig1 (Fig. 7A), a transcription factor important for oligodendrocyte function and for neural precursor cell differentiation (Ross et al., 2003), no significant changes in the expression of genes enumerated in supplemental Figure S10 (available at www.jneurosci.org as supplemental material) were found by either quantitative RT-PCR or Western blot analysis. We also performed a chip-based comparison of the transcriptome of WT and Nkcc1−/− hippocampus at P5. Differentially expressed transcripts (verified by RT-PCR) were the transcriptional regulator Id4, which is important for neural progenitor proliferation and differentiation (Yun et al., 2004; Bedford et al., 2005), the cell cycle-associated gene G0s2 (Russell and Forsdyke, 1991), the gene encoding the neurofilament heavy chain, as well as lynx1 (Fig. 7A,B; supplemental Fig. S12, available at www.jneurosci.org as supplemental material). Lynx1 is a membrane-anchored protein that interacts with nicotinic acetylcholine receptors (nAChRs) and thereby influences neuronal excitability (Ibañez-Tallon et al., 2002; Miwa et al., 2006). Lynx1 was downregulated both at the mRNA (P1, P5, P15) (Fig. 7B) and at the protein level (P5 and P15) (Fig. 7C). In contrast, expression levels of lynx2 and Ly-6H (Fig. 7B), proteins related to lynx1 and expressed in the hippocampus (Dessaud et al., 2006), were unchanged. The abundance of the transcripts encoding the α7, α4, and β2 subunits of nAChRs, known targets of lynx1 that are expressed in the early hippocampus, were not changed either (Fig. 7B). In conclusion, the expression of a small subset of genes involved in cell differentiation, proliferation, and network excitability were changed in the absence of NKCC1.
Figure 7.

Transcriptional changes in Nkcc1−/− hippocampus. A, Quantification of quantitative RT-PCR (qRT-PCR) of neurofilament heavy chain, Id4, G0s2 (found in gene chip analysis), and Olig1 (found in independent screen) at different ages during development (normalized to WT ± SEM; n > 3 animals per genotype and age). B, lynx1 mRNA is downregulated in the Nkcc1−/− hippocampus at different ages during early development as assessed by qRT-PCR, whereas nicotinic receptor subunits α4, α7, β2, and lynx1-related genes (lynx2, Ly-6H) are unaffected (normalized to WT ± SEM; n > 3 animals per genotype). C, Lynx1 protein is downregulated in the Nkcc1−/− hippocampus at P5 and P15. Quantifications are shown to the right of Western blots (normalized to tubulin ± SEM; 6 animals per genotype and age). The asterisks indicate significance (*p < 0.05, **p < 0.01, t test).
Discussion
Chloride accumulation via NKCC1 significantly contributes to GABA-dependent depolarization early in development
The excitatory action of GABA on immature neurons is a consequence of active chloride accumulation. The Na–K–2Cl cotransporter NKCC1, a chloride loader, is expressed early during neuronal differentiation (Hübner et al., 2001a). Application of bumetanide, a NKCC1 inhibitor, shifted the GABA reversal potential by −10 mV in P1–P3 cortical neurons (Yamada et al., 2004) and by −13 to −18 mV in CA3 pyramidal cells (Dzhala et al., 2005; Sipilä et al., 2006). In a genetic approach, we used Nkcc1−/− mice to examine the role of NKCC1 in determining [Cl−]i and in brain maturation. The GABA reversal potential was shifted by approximately −10 mV in Nkcc1−/− pyramidal cells, identifying NKCC1 as a major chloride loader in these neurons. GABA was still depolarizing and could trigger Ca2+ transients by opening voltage-dependent Ca2+ channels (Yuste and Katz, 1991; Owens et al., 1996) in the absence of NKCC1. At P1, the anion exchanger AE3 is expressed at low levels in the hippocampus and did not contribute to chloride loading in CA1 cells in the presence of NKCC1. However, we cannot exclude that it raises Cl− in the absence of this major Cl− loader. At P5, expression levels of AE3 are higher and disruption of AE3 led to a decrease in GDPs. This decrease in GDP frequency suggests an effect of diminished intracellular chloride. An increased HCO3− efflux through GABAA receptors owed to an increase in cellular HCO3− (another possible outcome of the AE3 KO) should rather lead to an increase in excitability and hence GDPs. The unchanged steady-state intracellular pH in Ae3−/− neurons (Hentschke et al., 2006) makes it unlikely that AE3 influences GDPs by changing pH-dependent conductances.
Network-driven calcium events and GDPs are diminished in Nkcc1−/− mice
Long-lasting elevations of intracellular calcium concentration can be observed in the early hippocampus. The underlying mechanisms change during hippocampal development (Garaschuk et al., 1998; Crépel et al., 2007). At late embryonic stages, small ensembles of neurons show calcium events that depend strongly on voltage-gated Ca2+ channels, but not on GABAA receptors. Around birth, long-lasting gap junction-mediated calcium plateaus appear. They disappear gradually during the following days, whereas the number of calcium elevations driven by GDPs increases with ongoing hippocampal maturation and increasing synaptic connectivity. GDPs are population discharges that mainly originate in the CA3 subfield and propagate to CA1, thereby affecting the entire hippocampal network (Menendez de la Prida et al., 1998). They depend on synaptic transmission and involve both the action of glutamate and of depolarizing GABA, gradually disappearing in parallel to the GABA switch during the second postnatal week (Ben-Ari et al., 1989; Sipilä et al., 2005). Because glutamatergic synapses between CA3 and CA1 neurons are initially purely NMDA receptor based (Durand et al., 1996; Tyzio et al., 1999), GABA-induced depolarization may be needed to facilitate glutamatergic transmission by weakening the voltage-dependent Mg2+ block of NMDA receptors (Leinekugel et al., 1997). In Nkcc1−/− mice, extracellular GDPs in CA3 were indeed diminished in amplitude and frequency. The relative lack of synchronicity of calcium events in the Nkcc1−/− hippocampus at P2 and P4 suggests that the electrical synchronization of large neuronal ensembles depends on depolarizing GABA at that developmental stage. Both recurrent glutamatergic connections between pyramidal neurons (Miles and Wong, 1983; Sipilä et al., 2006) as well as synchronous activation of interneurons that excite multiple target neurons via excitatory GABA transmission (Khazipov et al., 1997; Garaschuk et al., 1998) were proposed as mechanisms for synchronization. Our results favor the latter mechanism and show that the generation and propagation of early network activity critically depends on high [Cl−]i that is established by NKCC1. At P10, when in the WT the chloride loader NKCC1 is mostly replaced by the chloride extruder KCC2, GDPs in Nkcc1−/− hippocampi were indistinguishable from the WT.
Delayed maturation of glutamatergic and GABAergic transmission in Nkcc1−/− mice
Correlated spiking of presynaptic and postsynaptic neurons can result in strengthening or weakening of glutamatergic synapses, depending on the temporal order of spiking. Pairing of GDPs with Schaffer collateral stimulation can enhance the efficacy of these glutamatergic synapses (Mohajerani et al., 2007). Therefore, the observed decrease in coincident activity in Nkcc1−/− hippocampus might change glutamatergic transmission between the Schaffer collaterals and CA1 neurons. Indeed, evoked AMPA eEPSCs in CA1 were decreased compared with NMDA eEPSCs at P7. Moreover, the amplitudes and frequencies of spontaneous mEPSCs were diminished in Nkcc1−/− mice at that time. The decreased frequency is most likely caused by poor detection of small events, rather than a decrease in synapse number. This interpretation is corroborated by our observation that the number of synaptic spines is unchanged in the KO compared with WT.
These change in excitatory synaptic transmission may result from a differential insertion of receptors into the postsynaptic membrane rather than from differential transcription (Malenka and Bear, 2004). Indeed, we did not detect differences between the genotypes in mRNA and protein levels of different GluR subunits, neither at P5 nor at P15. We suggest that the decreased S842 phosphorylation of GluR4 observed at P5 is a consequence of the decreased and mostly uncorrelated electrical activity of the Nkcc1−/− hippocampus. Because phosphorylation may stimulate the incorporation of glutamate receptors into silent synapses (Zhu et al., 2000; Esteban et al., 2003), such a mechanism could explain the decrease in AMPA/NMDA ratio in P7 Nkcc1−/− hippocampus. No differences in GluR1 phosphorylation were detected, consistent with the predominant role of GluR4 in activity-dependent maturation of silent synapses (Zhu et al., 2000).
The changes in glutamatergic transmission disappear at P15 when NKCC1 expression in pyramidal neurons has declined in favor of KCC2 and when GDPs do not differ anymore between genotypes. The impressive increase in phosphorylation of GluR4 at S842 in P15 Nkcc1−/− hippocampus was not associated with a changed AMPA/NMDA ratio of pyramidal cells, quite in contrast to the correlation between decreased GluR4 phosphorylation and decreased AMPA/NMDA ratio at earlier time points. This difference can be explained by the shift in expression pattern of GluR4 from pyramidal cells to interneurons in adult hippocampus (supplemental Fig. S11, available at www.jneurosci.org as supplemental material) (Kullmann and Lamsa, 2007). The increased GluR4 phosphorylation therefore probably occurs in interneurons, rather than in pyramidal cells that were studied electrophysiologically.
The maturational delay also extended to GABAergic synapses, with mIPSC amplitudes being lower in Nkcc1−/− mice at P7, but not at P15. Similar to the amplitude changes observed for mEPSCs, these amplitude changes may result from changes in the numbers of postsynaptic receptors. Compared with mEPSCs, mIPSCs have much larger amplitudes under our recording conditions. Therefore, fewer events escaped detection in the KO, the result being that we measured similar frequencies to WT.
The shift of the GABA reversal potential in Nkcc1−/− pyramidal cells (Fig. 1) was not associated with an increase of KCC2 transcript and protein levels (supplemental Figs. S1J, S7D, available at www.jneurosci.org as supplemental material). Together with previous work (Ludwig et al., 2003; Titz et al., 2003; Wojcik et al., 2006), our results do not support a role of depolarizing GABA in inducing KCC2 expression, an effect previously reported in cultured neurons (Ganguly et al., 2001).
Expression analysis of Nkcc1−/− hippocampus
Genome-wide expression analysis revealed a downregulation of lynx1 in Nkcc1−/− hippocampus at P1, P5, and P15. Lynx1, a membrane-tethered protein, reduces the agonist sensitivity of nicotinic acetylcholine receptors and accelerates their desensitization, thereby decreasing neuronal excitation (Ibañez-Tallon et al., 2002; Miwa et al., 2006). A downregulation of lynx1 should increase neuronal excitability, thereby partially compensating for the diminished GABAergic excitation in Nkcc1−/− mice. Thus, our data suggest a previously unrecognized role of lynx1 in early network homeostasis.
No obvious defects in brain morphology of Nkcc1−/− mice
In spite of the trophic effects of depolarizing GABA on neurite extension, neuronal migration, differentiation, and synaptogenesis (Komuro and Rakic, 1998; Ben-Ari, 2002), no morphological alterations were observed in Nkcc1−/− hippocampal neurons, which displayed normal dendritic length, branching, and spine synapse density. However, inducing a hyperpolarizing GABA response by prematurely expressing KCC2 in a subpopulation of rat ventricular neuronal progenitor cells impaired their dendritic arborization (Cancedda et al., 2007). These differences might be explained by the fact that GABA was still slightly depolarizing in Nkcc1−/− neurons. Additionally, one must distinguish between manipulations of individual neurons within a normally developing network and manipulations of the global network as in our study. Indeed, the number of functional synapses in developing cultured neurons was reduced when their electrical activity was suppressed individually, but not when all neurons were uniformly suppressed (Burrone et al., 2002). Similarly, expression of short hairpin RNAs against NKCC1 in just a small subset of newborn granular neurons or ventricular neuronal progenitor cells changed synapse formation and dendritic development (Ge et al., 2006; Wang and Kriegstein, 2008).
We also identified differences in mRNA levels of Olig1 and Id4, transcription factors with a role in brain development (Ross et al., 2003; Yun et al., 2004; Bedford et al., 2005), as well as of the cell cycle-related gene G0s2 (Russell and Forsdyke, 1991). Those findings suggest that GABAergic excitation may influence early transcriptional processes involved in cell proliferation and differentiation, although we did not detect changes in hippocampal architecture.
In summary, our analysis showed a major role of NKCC1-dependent Cl− accumulation in the excitatory action of GABA. Nkcc1 disruption severely affected early spontaneous electrical activity and transiently delayed the maturation of glutamatergic and GABAergic synapses without, however, leading to detectable morphological changes. Our work focusing on the role of NKCC1 in early network activity further suggests that future studies addressing the role of lynx1 in early network homeostasis may be warranted.
Footnotes
This work was supported in part by a grant from the Deutsche Forschungsgemeinschaft (T.J.J., C.A.H.) and by Prix Louis-Jeantet de Médecine (T.J.J.). We thank B. Koller for generously making Nkcc1−/− mice available, A. Goffinet for the anti-reelin antibody, I. Ibañez-Tallon and N. Heintz for anti-lynx1 antibodies, and R. Huganir for anti-p842-GluR4 antibody. We are grateful to J. Lieboldt, M. Kolster, K. Bieberich, and N. Meyer for technical assistance. We thank Corette Wierenga and Inés Ibañez-Tallon for thoughtful discussion.
References
- Aguiló A, Schwartz TH, Kumar VS, Peterlin ZA, Tsiola A, Soriano E, Yuste R. Involvement of Cajal–Retzius neurons in spontaneous correlated activity of embryonic and postnatal layer 1 from wild-type and reeler mice. J Neurosci. 1999;19:10856–10868. doi: 10.1523/JNEUROSCI.19-24-10856.1999. [DOI] [PMC free article] [PubMed] [Google Scholar]
- Akerman CJ, Cline HT. Depolarizing GABAergic conductances regulate the balance of excitation to inhibition in the developing retinotectal circuit in vivo. J Neurosci. 2006;26:5117–5130. doi: 10.1523/JNEUROSCI.0319-06.2006. [DOI] [PMC free article] [PubMed] [Google Scholar]
- Bedford L, Walker R, Kondo T, van Crüchten I, King ER, Sablitzky F. Id4 is required for the correct timing of neural differentiation. Dev Biol. 2005;280:386–395. doi: 10.1016/j.ydbio.2005.02.001. [DOI] [PubMed] [Google Scholar]
- Ben-Ari Y. Excitatory actions of GABA during development: the nature of the nurture. Nat Rev Neurosci. 2002;3:728–739. doi: 10.1038/nrn920. [DOI] [PubMed] [Google Scholar]
- Ben-Ari Y, Cherubini E, Corradetti R, Gaiarsa JL. Giant synaptic potentials in immature rat CA3 hippocampal neurones. J Physiol. 1989;416:303–325. doi: 10.1113/jphysiol.1989.sp017762. [DOI] [PMC free article] [PubMed] [Google Scholar]
- Boehm J, Malinow R. AMPA receptor phosphorylation during synaptic plasticity. Biochem Soc Trans. 2005;33:1354–1356. doi: 10.1042/BST0331354. [DOI] [PubMed] [Google Scholar]
- Bolstad BM, Irizarry RA, Astrand M, Speed TP. A comparison of normalization methods for high density oligonucleotide array data based on variance and bias. Bioinformatics. 2003;19:185–193. doi: 10.1093/bioinformatics/19.2.185. [DOI] [PubMed] [Google Scholar]
- Bredt DS, Nicoll RA. AMPA receptor trafficking at excitatory synapses. Neuron. 2003;40:361–379. doi: 10.1016/s0896-6273(03)00640-8. [DOI] [PubMed] [Google Scholar]
- Burrone J, O'Byrne M, Murthy VN. Multiple forms of synaptic plasticity triggered by selective suppression of activity in individual neurons. Nature. 2002;420:414–418. doi: 10.1038/nature01242. [DOI] [PubMed] [Google Scholar]
- Cancedda L, Fiumelli H, Chen K, Poo MM. Excitatory GABA action is essential for morphological maturation of cortical neurons in vivo. J Neurosci. 2007;27:5224–5235. doi: 10.1523/JNEUROSCI.5169-06.2007. [DOI] [PMC free article] [PubMed] [Google Scholar]
- Clayton GH, Owens GC, Wolff JS, Smith RL. Ontogeny of cation-Cl− cotransporter expression in rat neocortex. Brain Res Dev Brain Res. 1998;109:281–292. doi: 10.1016/s0165-3806(98)00078-9. [DOI] [PubMed] [Google Scholar]
- Crépel V, Aronov D, Jorquera I, Represa A, Ben-Ari Y, Cossart R. A parturition-associated nonsynaptic coherent activity pattern in the developing hippocampus. Neuron. 2007;54:105–120. doi: 10.1016/j.neuron.2007.03.007. [DOI] [PubMed] [Google Scholar]
- Dessaud E, Salaün D, Gayet O, Chabbert M, deLapeyrière O. Identification of lynx2, a novel member of the ly-6/neurotoxin superfamily, expressed in neuronal subpopulations during mouse development. Mol Cell Neurosci. 2006;31:232–242. doi: 10.1016/j.mcn.2005.09.010. [DOI] [PubMed] [Google Scholar]
- Durand GM, Kovalchuk Y, Konnerth A. Long-term potentiation and functional synapse induction in developing hippocampus. Nature. 1996;381:71–75. doi: 10.1038/381071a0. [DOI] [PubMed] [Google Scholar]
- Dzhala VI, Talos DM, Sdrulla DA, Brumback AC, Mathews GC, Benke TA, Delpire E, Jensen FE, Staley KJ. NKCC1 transporter facilitates seizures in the developing brain. Nat Med. 2005;11:1205–1213. doi: 10.1038/nm1301. [DOI] [PubMed] [Google Scholar]
- Esteban JA, Shi SH, Wilson C, Nuriya M, Huganir RL, Malinow R. PKA phosphorylation of AMPA receptor subunits controls synaptic trafficking underlying plasticity. Nat Neurosci. 2003;6:136–143. doi: 10.1038/nn997. [DOI] [PubMed] [Google Scholar]
- Feller W. New York: Wiley; 1968. An introduction to probability theory and its applications. [Google Scholar]
- Ganguly K, Schinder AF, Wong ST, Poo M. GABA itself promotes the developmental switch of neuronal GABAergic responses from excitation to inhibition. Cell. 2001;105:521–532. doi: 10.1016/s0092-8674(01)00341-5. [DOI] [PubMed] [Google Scholar]
- Garaschuk O, Hanse E, Konnerth A. Developmental profile and synaptic origin of early network oscillations in the CA1 region of rat neonatal hippocampus. J Physiol. 1998;507:219–236. doi: 10.1111/j.1469-7793.1998.219bu.x. [DOI] [PMC free article] [PubMed] [Google Scholar]
- Ge S, Goh EL, Sailor KA, Kitabatake Y, Ming GL, Song H. GABA regulates synaptic integration of newly generated neurons in the adult brain. Nature. 2006;439:589–593. doi: 10.1038/nature04404. [DOI] [PMC free article] [PubMed] [Google Scholar]
- Hanse E, Durand GM, Garaschuk O, Konnerth A. Activity-dependent wiring of the developing hippocampal neuronal circuit. Semin Cell Dev Biol. 1997;8:35–42. doi: 10.1006/scdb.1996.0119. [DOI] [PubMed] [Google Scholar]
- Hentschke M, Wiemann M, Hentschke S, Kurth I, Hermans-Borgmeyer I, Seidenbecher T, Jentsch TJ, Gal A, Hübner CA. Mice with a targeted disruption of the Cl−/HCO3− exchanger AE3 display a reduced seizure threshold. Mol Cell Biol. 2006;26:182–191. doi: 10.1128/MCB.26.1.182-191.2006. [DOI] [PMC free article] [PubMed] [Google Scholar]
- Hübner CA, Lorke DE, Hermans-Borgmeyer I. Expression of the Na-K-2Cl-cotransporter NKCC1 during mouse development. Mech Dev. 2001a;102:267–269. doi: 10.1016/s0925-4773(01)00309-4. [DOI] [PubMed] [Google Scholar]
- Hübner CA, Stein V, Hermans-Borgmeyer I, Meyer T, Ballanyi K, Jentsch TJ. Disruption of KCC2 reveals an essential role of K-Cl cotransport already in early synaptic inhibition. Neuron. 2001b;30:515–524. doi: 10.1016/s0896-6273(01)00297-5. [DOI] [PubMed] [Google Scholar]
- Ibañez-Tallon I, Miwa JM, Wang HL, Adams NC, Crabtree GW, Sine SM, Heintz N. Novel modulation of neuronal nicotinic acetylcholine receptors by association with the endogenous prototoxin lynx1. Neuron. 2002;33:893–903. doi: 10.1016/s0896-6273(02)00632-3. [DOI] [PubMed] [Google Scholar]
- Iwasato T, Datwani A, Wolf AM, Nishiyama H, Taguchi Y, Tonegawa S, Knöpfel T, Erzurumlu RS, Itohara S. Cortex-restricted disruption of NMDAR1 impairs neuronal patterns in the barrel cortex. Nature. 2000;406:726–731. doi: 10.1038/35021059. [DOI] [PMC free article] [PubMed] [Google Scholar]
- Katz LC, Shatz CJ. Synaptic activity and the construction of cortical circuits. Science. 1996;274:1133–1138. doi: 10.1126/science.274.5290.1133. [DOI] [PubMed] [Google Scholar]
- Khazipov R, Luhmann HJ. Early patterns of electrical activity in the developing cerebral cortex of humans and rodents. Trends Neurosci. 2006;29:414–418. doi: 10.1016/j.tins.2006.05.007. [DOI] [PubMed] [Google Scholar]
- Khazipov R, Leinekugel X, Khalilov I, Gaiarsa JL, Ben-Ari Y. Synchronization of GABAergic interneuronal network in CA3 subfield of neonatal rat hippocampal slices. J Physiol. 1997;498:763–772. doi: 10.1113/jphysiol.1997.sp021900. [DOI] [PMC free article] [PubMed] [Google Scholar]
- Komuro H, Rakic P. Orchestration of neuronal migration by activity of ion channels, neurotransmitter receptors, and intracellular Ca2+ fluctuations. J Neurobiol. 1998;37:110–130. [PubMed] [Google Scholar]
- Kullmann DM, Lamsa KP. Long-term synaptic plasticity in hippocampal interneurons. Nat Rev Neurosci. 2007;8:687–699. doi: 10.1038/nrn2207. [DOI] [PubMed] [Google Scholar]
- Leinekugel X, Medina I, Khalilov I, Ben-Ari Y, Khazipov R. Ca2+ oscillations mediated by the synergistic excitatory actions of GABAA and NMDA receptors in the neonatal hippocampus. Neuron. 1997;18:243–255. doi: 10.1016/s0896-6273(00)80265-2. [DOI] [PubMed] [Google Scholar]
- Lu HC, She WC, Plas DT, Neumann PE, Janz R, Crair MC. Adenylyl cyclase I regulates AMPA receptor trafficking during mouse cortical “barrel” map development. Nat Neurosci. 2003;6:939–947. doi: 10.1038/nn1106. [DOI] [PubMed] [Google Scholar]
- Ludwig A, Li H, Saarma M, Kaila K, Rivera C. Developmental up-regulation of KCC2 in the absence of GABAergic and glutamatergic transmission. Eur J Neurosci. 2003;18:3199–3206. doi: 10.1111/j.1460-9568.2003.03069.x. [DOI] [PubMed] [Google Scholar]
- Malenka RC, Bear MF. LTP and LTD: an embarrassment of riches. Neuron. 2004;44:5–21. doi: 10.1016/j.neuron.2004.09.012. [DOI] [PubMed] [Google Scholar]
- Menendez de la Prida L, Bolea S, Sanchez-Andres JV. Origin of the synchronized network activity in the rabbit developing hippocampus. Eur J Neurosci. 1998;10:899–906. doi: 10.1046/j.1460-9568.1998.00097.x. [DOI] [PubMed] [Google Scholar]
- Miles R, Wong RK. Single neurones can initiate synchronized population discharge in the hippocampus. Nature. 1983;306:371–373. doi: 10.1038/306371a0. [DOI] [PubMed] [Google Scholar]
- Miwa JM, Stevens TR, King SL, Caldarone BJ, Ibanez-Tallon I, Xiao C, Fitzsimonds RM, Pavlides C, Lester HA, Picciotto MR, Heintz N. The prototoxin lynx1 acts on nicotinic acetylcholine receptors to balance neuronal activity and survival in vivo. Neuron. 2006;51:587–600. doi: 10.1016/j.neuron.2006.07.025. [DOI] [PubMed] [Google Scholar]
- Mohajerani MH, Sivakumaran S, Zacchi P, Aguilera P, Cherubini E. Correlated network activity enhances synaptic efficacy via BDNF and the ERK pathway at immature CA3 CA1 connections in the hippocampus. Proc Natl Acad Sci U S A. 2007;104:13176–13181. doi: 10.1073/pnas.0704533104. [DOI] [PMC free article] [PubMed] [Google Scholar]
- Owens DF, Kriegstein AR. Is there more to GABA than synaptic inhibition? Nat Rev Neurosci. 2002;3:715–727. doi: 10.1038/nrn919. [DOI] [PubMed] [Google Scholar]
- Owens DF, Boyce LH, Davis MB, Kriegstein AR. Excitatory GABA responses in embryonic and neonatal cortical slices demonstrated by gramicidin perforated-patch recordings and calcium imaging. J Neurosci. 1996;16:6414–6423. doi: 10.1523/JNEUROSCI.16-20-06414.1996. [DOI] [PMC free article] [PubMed] [Google Scholar]
- Pace AJ, Lee E, Athirakul K, Coffman TM, O'Brien DA, Koller BH. Failure of spermatogenesis in mouse lines deficient in the Na+-K+-2Cl− cotransporter. J Clin Invest. 2000;105:441–450. doi: 10.1172/JCI8553. [DOI] [PMC free article] [PubMed] [Google Scholar]
- Prange-Kiel J, Rune GM, Leranth C. Median raphe mediates estrogenic effects to the hippocampus in female rats. Eur J Neurosci. 2004;19:309–317. doi: 10.1111/j.0953-816x.2003.03124.x. [DOI] [PubMed] [Google Scholar]
- Rivera C, Voipio J, Payne JA, Ruusuvuori E, Lahtinen H, Lamsa K, Pirvola U, Saarma M, Kaila K. The K+/Cl− co-transporter KCC2 renders GABA hyperpolarizing during neuronal maturation. Nature. 1999;397:251–255. doi: 10.1038/16697. [DOI] [PubMed] [Google Scholar]
- Ross SE, Greenberg ME, Stiles CD. Basic helix-loop-helix factors in cortical development. Neuron. 2003;39:13–25. doi: 10.1016/s0896-6273(03)00365-9. [DOI] [PubMed] [Google Scholar]
- Russell L, Forsdyke DR. A human putative lymphocyte G0/G1 switch gene containing a CpG-rich island encodes a small basic protein with the potential to be phosphorylated. DNA Cell Biol. 1991;10:581–591. doi: 10.1089/dna.1991.10.581. [DOI] [PubMed] [Google Scholar]
- Schwartz TH, Rabinowitz D, Unni V, Kumar VS, Smetters DK, Tsiola A, Yuste R. Networks of coactive neurons in developing layer 1. Neuron. 1998;20:541–552. doi: 10.1016/s0896-6273(00)80993-9. [DOI] [PubMed] [Google Scholar]
- Sholl DA. Dendritic organization in the neurons of the visual and motor cortices of the cat. J Anat. 1953;87:387–406. [PMC free article] [PubMed] [Google Scholar]
- Sipilä ST, Huttu K, Soltesz I, Voipio J, Kaila K. Depolarizing GABA acts on intrinsically bursting pyramidal neurons to drive giant depolarizing potentials in the immature hippocampus. J Neurosci. 2005;25:5280–5289. doi: 10.1523/JNEUROSCI.0378-05.2005. [DOI] [PMC free article] [PubMed] [Google Scholar]
- Sipilä ST, Schuchmann S, Voipio J, Yamada J, Kaila K. The cation-chloride cotransporter NKCC1 promotes sharp waves in the neonatal rat hippocampus. J Physiol. 2006;573:765–773. doi: 10.1113/jphysiol.2006.107086. [DOI] [PMC free article] [PubMed] [Google Scholar]
- Stein V, Hermans-Borgmeyer I, Jentsch TJ, Hübner CA. Expression of the KCl cotransporter KCC2 parallels neuronal maturation and the emergence of low intracellular chloride. J Comp Neurol. 2004;468:57–64. doi: 10.1002/cne.10983. [DOI] [PubMed] [Google Scholar]
- Sterio DC. The unbiased estimation of number and sizes of arbitrary particles using the disector. J Microsc. 1984;134:127–136. doi: 10.1111/j.1365-2818.1984.tb02501.x. [DOI] [PubMed] [Google Scholar]
- Sung KW, Kirby M, McDonald MP, Lovinger DM, Delpire E. Abnormal GABAA receptor-mediated currents in dorsal root ganglion neurons isolated from Na–K–2Cl cotransporter null mice. J Neurosci. 2000;20:7531–7538. doi: 10.1523/JNEUROSCI.20-20-07531.2000. [DOI] [PMC free article] [PubMed] [Google Scholar]
- Titz S, Hans M, Kelsch W, Lewen A, Swandulla D, Misgeld U. Hyperpolarizing inhibition develops without trophic support by GABA in cultured rat midbrain neurons. J Physiol. 2003;550:719–730. doi: 10.1113/jphysiol.2003.041863. [DOI] [PMC free article] [PubMed] [Google Scholar]
- Tyzio R, Represa A, Jorquera I, Ben-Ari Y, Gozlan H, Aniksztejn L. The establishment of GABAergic and glutamatergic synapses on CA1 pyramidal neurons is sequential and correlates with the development of the apical dendrite. J Neurosci. 1999;19:10372–10382. doi: 10.1523/JNEUROSCI.19-23-10372.1999. [DOI] [PMC free article] [PubMed] [Google Scholar]
- Wang DD, Kriegstein AR. GABA regulates excitatory synapse formation in the neocortex via NMDA receptor activation. J Neurosci. 2008;28:5547–5558. doi: 10.1523/JNEUROSCI.5599-07.2008. [DOI] [PMC free article] [PubMed] [Google Scholar]
- Wilson CJ, Sachdev RN. Intracellular and juxtacellular staining with biocytin. Curr Protoc Neurosci. 2004;1:1–12. doi: 10.1002/0471142301.ns0112s26. [DOI] [PubMed] [Google Scholar]
- Wojcik SM, Katsurabayashi S, Guillemin I, Friauf E, Rosenmund C, Brose N, Rhee JS. A shared vesicular carrier allows synaptic corelease of GABA and glycine. Neuron. 2006;50:575–587. doi: 10.1016/j.neuron.2006.04.016. [DOI] [PubMed] [Google Scholar]
- Yamada J, Okabe A, Toyoda H, Kilb W, Luhmann HJ, Fukuda A. Cl− uptake promoting depolarizing GABA actions in immature rat neocortical neurones is mediated by NKCC1. J Physiol. 2004;557:829–841. doi: 10.1113/jphysiol.2004.062471. [DOI] [PMC free article] [PubMed] [Google Scholar]
- Yun K, Mantani A, Garel S, Rubenstein J, Israel MA. Id4 regulates neural progenitor proliferation and differentiation in vivo. Development. 2004;131:5441–5448. doi: 10.1242/dev.01430. [DOI] [PubMed] [Google Scholar]
- Yuste R, Katz LC. Control of postsynaptic Ca2+ influx in developing neocortex by excitatory and inhibitory neurotransmitters. Neuron. 1991;6:333–344. doi: 10.1016/0896-6273(91)90243-s. [DOI] [PubMed] [Google Scholar]
- Zhu JJ, Esteban JA, Hayashi Y, Malinow R. Postnatal synaptic potentiation: delivery of GluR4-containing AMPA receptors by spontaneous activity. Nat Neurosci. 2000;3:1098–1106. doi: 10.1038/80614. [DOI] [PubMed] [Google Scholar]