

Abstract
The potential association between microbial infection and reactivation of a multiple sclerosis (MS) lesion is an important issue that remains unresolved, primarily because of the absence of suitable animal models and imaging techniques. Here, we have evaluated this question in an empirical manner using immunohistochemistry and magnetic resonance imaging (MRI), before and after the induction of a systemic inflammatory response in two distinct models of MS. In a pattern-II-type focal myelin oligodendrocyte glycoprotein-experimental autoimmune encephalomyelitis model, systemic endotoxin injection caused an increase in regional cerebral blood volume (rCBV) around the lesion site after 6 h, together with a reduction in the magnetization transfer ratio of the lesioned corpus callosum. These changes were followed by an increase in the diffusion of tissue water within the lesion 24 h after endotoxin challenge and new leukocyte recruitment as revealed both immunohistochemically and by MRI tracking of ultrasmall superparamagnetic iron oxide-labeled macrophages. Importantly, we detected in vivo expression of E- and P-selectin in quiescent lesions by MRI-detectable glyconanoparticles conjugated to sialyl LewisX. This finding may explain, at least in part, the ability of quiescent MS lesions to rapidly reinitiate the cell recruitment processes. In a pattern-I-type delayed-type hypersensitivity response model, a similar effect of endotoxin challenge on rCBV was observed, together with delayed breakdown of the blood–brain barrier, showing that systemic infection can alter the pathogenesis of MS-like lesions regardless of lesion etiology. These findings will have important implications for the management and monitoring of individuals with MS.
Introduction
The immunopathological characteristics of multiple sclerosis (MS) are heterogeneous, but cases can primarily be grouped into those that exhibit T-cell- and macrophage-dominated inflammatory lesions (patterns I and II), with close similarities to experimental autoimmune encephalomyelitis (EAE), and those, much rarer, with signs of oligodendrocyte dystrophy (patterns III and IV) (Lucchinetti et al., 2000). The major feature that distinguishes pattern I from pattern II lesions is the prominent deposition of Ig and complement at sites of active myelin destruction, which is found exclusively in pattern II lesions. Individuals with pattern I and II MS mainly display the relapsing-remitting type of the disease, but it seems that there is no simple relationship between relapse and disease progression (Giovannoni and Ebers, 2007). However, there is growing evidence that there may be a link between infection and relapse (Buljevac et al., 2002). A number of studies have shown that approximately one-third of MS relapses are preceded by a viral infection (Sibley et al., 1985; Andersen et al., 1993; Panitch, 1994; Edwards et al., 1998; Buljevac et al., 2002). Relapse in individuals with MS has also been associated with bacterial infections, such as those of the urinary tract, which appear to trigger relapse in as many as 30% of MS patients (Rapp et al., 1995). Chlamydia pneumoniae infection is known to be associated with exacerbation of clinical signs in individuals with MS (Buljevac et al., 2003) and worsening of clinical score in a murine EAE model (Du et al., 2002).
Contrast-enhancing lesions, indicating blood–brain barrier (BBB) breakdown, are generally considered to be a sensitive marker for disease activity in MS patients (Brück and Stadelmann, 2005). A small number of magnetic resonance imaging (MRI) studies have been performed to investigate the effect of peripheral infection in MS, but the results have been inconsistent. Edwards et al. (1998) reported that the number and the volume of enhancing lesions in MS patients increased during peripheral infection. However, others have reported no increase in the number of contrast-enhancing lesions despite worsening of neurological symptoms at the time of infection (Barkhof, 2002). These findings highlight the so-called clinico-radiological paradox in MS, which is that the MRI findings do not always accurately reflect the clinical symptoms (Barkhof, 2002). It is essential, therefore, that we identify more sensitive indices of disease activity and lesion status. Combining MRI and immunohistochemistry in clinically relevant animal models is an approach that allows us to systematically investigate the acute effects of systemic inflammation on individual MS-like lesions and dissect the neuropathology that underlies the MRI signal changes.
The aim of the present study was to determine whether a systemic inflammatory response could reactivate quiescent focal CNS lesions in rodent models of pattern I and pattern II MS plaque formation. We demonstrate that multiple features of both focal myelin oligodendrocyte glycoprotein-induced EAE (fMOG-EAE) and focal Th1-type bacillus Calmette-Guerin-induced delayed type hypersensitivity (BCG-DTH) lesions can be reactivated by a systemic challenge with lipopolysaccharide (LPS). Importantly, reactivation was a consequence of the LPS challenge in both pattern I- and pattern II-like EAE plaques.
Materials and Methods
All experimental procedures used in this study were approved by the United Kingdom Home Office.
Induction of a cytokine-induced fMOG-EAE lesion in rats
Sensitization procedure.
Male Lewis rats (80–120 g; Charles River) were anesthetized with 1.5–3% isoflurane in a mixture of nitrous oxide/oxygen (70%/30%) and injected subcutaneously at the base of the tail with 100 μl of MOG (35–55) peptide (Activotec) (25 μg of diluted in saline) emulsified in incomplete Freund's adjuvant (IFA) (1:1; Sigma-Aldrich). Control animals were injected with the same volume of saline emulsified in IFA (1:1).
Intracerebral stereotactic injection of cytokines.
To induce targeted, focal EAE lesions, MOG-immunized rats were anesthetized and stereotaxically injected with cytokines in the corpus callosum 21 d after MOG injection in a modification of our focal spinal EAE model (Kerschensteiner et al., 2004). A midline incision was made in the scalp, and a burr hole was drilled 1 mm anterior and 3 mm lateral to bregma. Using a finely drawn microcapillary, animals were injected with 2 μl of sterile saline containing 1.45 μg of recombinant rat tumor necrosis factor (PeproTech) and 1 μg of recombinant rat interferon γ (IFN-γ) (PeproTech) at a depth of 3 mm over a 10 min period. Subsequently, the wound was closed and the animals were allowed to recover from anesthesia. The focal, unilateral nature of the lesion does not give rise to any overt clinical signs.
Experimental protocol.
Four weeks after the intracerebral cytokine injection, at a point when immunohistochemical and MRI-detectable changes have essentially returned to baseline, animals were injected intraperitoneally with 500 μg/kg Escherichia coli lipopolysaccharide endotoxin (strain CO111:B4; Sigma-Aldrich) in sterile pyrogen-free saline to induce a systemic inflammatory response. fMOG-EAE (n = 7) and IFA (n = 3) rats underwent additional MRI analysis at 6 and 24 h after LPS challenge, followed by histological analysis at 24 h (n = 7 and 5, respectively). Control fMOG-EAE (n = 7) and IFA animals (n = 4), not challenged with LPS, also underwent MRI at the same time points, followed by histological assessment (n = 7 and 5, respectively). It should be noted that no mortality was observed after LPS injection over a 72 h period. The 500 μg/kg LPS challenge was chosen as that required to produce a robust febrile response (Combrinck et al., 2002) and is sufficient to exacerbate the local inflammatory response and increase neuronal death in murine prion disease (Cunningham et al., 2005). It should be noted that rodents are remarkably resistant to endotoxin, and levels that would be associated with fulminant septiceamia in humans often do not elicit overt behavioral responses in mice in a strain-dependent manner, which may be attributable, at least in part, to deferential effects on SR-A expression by monocytes/macrophages in mice and humans (Fitzgerald et al., 2000).
Two additional groups of fMOG-EAE rats [(1) LPS challenged and (2) not challenged] were intravenously injected with 150 μl of ferumoxtran-10 [Sinerem; Guerbet (gift from Guerbet Research, Villepinte, France)] 5 min before intraperitoneal injection of LPS (n = 6) or at the equivalent time point in nonchallenged animals (n = 6) and then killed for ex vivo high-resolution MRI and histology.
One group of fMOG-EAE rats, not injected with LPS, was used to visualize the expression of the cellular adhesion molecules E- and P-selectin at the point of LPS challenge (i.e., when the initial lesion had apparently resolved). Animals were injected intravenously with either 100 μl of glyconanoparticle conjugated with sialyl Lewisx (GNP-sLex) (n = 5) (Kasteren, 2007) or 100 μl of control-nanoparticle (control-NP) (n = 5) and underwent MRI 1 h later.
Induction of DTH lesion
Sensitization procedure.
Male Lewis rats (Charles River) were anesthetized with 2–3% isoflurane in a mixture of nitrous oxide/oxygen (70%/30%) and placed in a stereotaxic frame. A midline incision was made in the scalp, and a burr hole was drilled 1 mm anterior and 3 mm lateral to bregma. Animals were injected stereotaxically with BCG suspension over a 15 min period at three depths: 0.5 μl each at a depth of 4, 3, and 2 mm, as a modification of the previously described DTH lesion (Broom et al., 2005). To initiate a spontaneous DTH response at the intraparenchymal injection site, 0.2 μl of the BCG suspension was deposited on the cortical surface of the brain to activate the immune system. Subsequently, the wound was closed and the animals were allowed to recover from anesthesia.
Experimental protocol.
Six weeks after the intracerebral injection, when the initial inflammatory response had mostly resolved, animals underwent the same reactivation procedure as for fMOG-EAE and additional MRI analysis at 6, 24, and 72 h after LPS challenge (n = 11). Control DTH animals, not challenged with LPS, also underwent MRI (n = 5) at the same time points.
Magnetic resonance imaging.
Animals were anesthetized with 1–2% isoflurane in 70% N2O/30% O2 and positioned in a quadrature birdcage coil (5 cm inner diameter). Electrocardiogram was monitored throughout, and body temperature was maintained at ∼37°C. MRI data were acquired using a 7 T horizontal bore magnet with a Varian Inova spectrometer.
Scout images were acquired to determine the location of the lesion, and a single 1 mm coronal slice centered on the lesion was selected for the full imaging protocol. T2-weighted images were acquired using a fast spin-echo sequence [repetition time (TR), 3.0 s; echo time (TE), 40 ms]. Apparent diffusion coefficient (ADC) “trace” maps were calculated from diffusion-weighted images acquired using a navigated pulsed-gradient spin-echo sequence (TR, 2.0 s; TE, 0.0365 s; b = 125, 500, and 1000 s/mm2; Δ = 17.5 ms; * = 12.5 ms) as described previously (Broom et al., 2005). Magnetization transfer (MT) images were acquired (MT pulse length, 32 ms; number of MT pulses, 12; TR, 1.5 s; TE, 0.02 s) with and without the MT saturation pulse. Regional cerebral blood volume (rCBV) maps were generated from 40 FLASH images (TR, 20 ms; TE, 10 ms; flip angle, 20°) acquired during bolus injection of contrast agent [gadolinium (Gd)] (Omniscan; GE Healthcare) and tracer kinetic analysis (Broom et al., 2005). Spin-echo T1-weighted images (TR, 500 ms; TE, 13 ms) were acquired both before and 10 min after Gd injection to identify BBB permeability. The matrix size and field of view (FOV) were 128 × 128 and 3.5 × 3.5 cm, respectively, for all images, except for the rCBV data, which were acquired with a 128 × 64 matrix and a 3 × 4 cm FOV for increased temporal resolution.
In fMOG-EAE animals injected with GNP-sLex or control-NP, a T2*-weighted three-dimensional (3D) gradient-echo dataset encompassing the entire brain was acquired: flip angle, 11°; TR, 25 ms; TE, 10 ms; matrix size, 350 × 192 × 192; field of view, 4.2 × 3.07 × 3.07 cm; four averages; total acquisition time, 1 h. The midpoint of the acquisition was 1.5 h after GNP-sLex injection. Data were zero filled to 350 × 256 × 256 and reconstructed offline, with a final isotropic voxel size of 120 μm.
In animals injected with Sinerem to identify macrophage recruitment to the brain after LPS challenge, ex vivo 3D high-resolution imaging was performed on postfixed brains. Brains were embedded in a solution containing agarose (2%) and gadolinium (2 mm) inside a nuclear magnetic resonance tube of 26 mm diameter. A 3D dataset was acquired using a 3D gradient echo sequence: flip angle, 10°; TR, 30 ms; TE, 10 ms; matrix size, 512 × 256 × 256; field of view, 6.4 × 3.2 × 3.2 cm; 26 averages; total acquisition time, 14 h. Data were reconstructed offline, with a final isotropic voxel size of 125 μm.
MRI data analysis.
Regional cerebral blood volume maps were generated and then were thresholded as described previously (Broom et al., 2005). Regions of interest (ROIs) were drawn around the areas of elevated CBV on the thresholded images. The same procedure was used to identify and quantify areas of gadolinium enhancement in the injected hemisphere. MT ratio (MTR) maps were created as described previously (Dousset et al., 1992) and ROIs around the left and right corpus callosum were drawn. Regions of interest encompassing areas of both increased and decreased signal intensity compared with the non-injected hemisphere were drawn on the T2-weighted images and ADC trace maps. All hemispheric differences are expressed as ratios of left/right (L/R) (i.e., injected/non-injected). Areas of hypointensity resulting from ultrasmall superparamagnetic iron oxide particles (USPIO) accumulation on ex vivo 3D high-resolution imaging were quantified by drawing around the regions of T2* hypointensity in the injected hemisphere on a slice-by-slice basis. 3D reconstruction maps of USPIO accumulation were generated using Image Pro software (version 4.5.1; Media Cybernetic) as described previously (McAteer et al., 2007).
Immunohistochemistry.
Animals were deeply anesthetized with an intraperitoneal injection of sodium pentobarbitone (120 mg/kg) and transcardially perfused with 0.9% heparinized saline, followed by 200 ml of periodate lysine paraformaldehyde. After dissection, the brains were postfixed, cryoprotected, embedded, and frozen in isopentane at −40°C as described previously (Broom et al., 2005). Immunohistochemistry was performed on frozen, 10-μm-thick, serial sections. Antigens were detected using a three-step indirect method (Hsu et al., 1981; Broom et al., 2005) using (1) ED1 antibodies (Serotec) for recruited monocytes/activated resident macrophages (microglia), (2) OX42 antibodies for activated microglia (Serotec), and (3) OX22 antibodies for T and B cells (gift from Dr. Simon Hunt, Sir William Dunn School of Pathology, Oxford University, Oxford, UK). In each group of animals, inflammatory cell infiltration was quantified by counting the number of ED1-positive or OX22-positive cells and expressed as an average number per square millimeter. Four grids (0.064 mm2) on three step sections 60 μm apart were counted such that an average of 12 sections per animal was analyzed for each antibody. It should be noted that a cell is only counted as “positive” if the staining is associated with a nucleus. Areas of OX42 staining in the corpus callosum were drawn around and quantified (Broom et al., 2005). The extent of demyelination was ranked from 0 to 3 by an individual blind to the identity of the tissue. Iron particles in brain sections from animals injected with Sinerem were detected with a modified Prussian blue method (Schroeter et al., 2004), which uses diaminobenzamidine (DAB) to reveal immunoreactivity as a brown insoluble precipitate.
Statistics
Statistical analysis was performed using SPSS. One-way ANOVA followed by pairwise Bonferroni's t tests or Kruskal–Wallis tests were used to identify specific differences between the groups, as parametric and nonparametric tests, respectively. One-way repeated measures ANOVA was used to analyze data over time. Paired-sample t tests were used to identify differences between the groups in both GNP-sLex and USPIO experiments. The relationship between histopathological parameters and MRI signal intensities was tested by a bivariate correlation analysis including calculation of the Pearson's correlation (r) or Spearman's r (r).
Results
Primary evolution of the fMOG-EAE lesion
No lesions were found in the brain parenchyma of animals that were sensitized to MOG but did not undergo intracerebral cytokine injections. Similarly, we found that, in animals undergoing intracerebral vehicle (saline) injection, the needle effect is undetectable and does not elicit a robust inflammatory response or traumatic injury, which is in accord with our previous work (McCluskey et al., 2008).
Conventional MRI was performed throughout the development of the fMOG-EAE lesion. In all animals, the fMOG-EAE lesion was visible as a hyperintense region on T2-weighted images, which coincided with the gadolinium enhancement on postcontrast T1-weighted images demonstrating breakdown of the BBB (Fig. 1A,B). The mean area of T1-weighted contrast enhancement was 32 ± 11 mm2 in fMOG-EAE animals compared with 9 ± 2 mm2 in IFA animals. In the same region, ADC trace maps showed a focal area of reduced ADC surrounded by an area of increased ADC (Fig. 1C). In addition, an increase in rCBV was observed in the injected hemisphere around the lesion site (Fig. 1D). These MRI-detectable changes peaked between 1 and 3 d after intracerebral cytokine injection and subsequently returned to baseline. Immunohistochemically, the initial lesion showed macrophage recruitment, microglial activation, and OX22-positive cell recruitment peaking around day 7 (n = 1817 ± 565 and 65 ± 27 cells/mm2, respectively), together with progressive demyelination that was maximal between days 7 and 14 (mean rank, 2.2 ± 0.8). In all cases, the number of newly recruited cells, demyelination, or area of OX42 staining lay within 50–100% of that seen at the peak of the original disease. The focal brain lesions generated by cytokine injection alone into the IFA animals resolved quickly and were no longer visible after 1 week and well before the systemic LPS injection at day 28 (data not shown).
Figure 1.

MRI data acquired from an fMOG-EAE rat 3 d after intracerebral cytokine injection. A, T2-weighted image showing a hyperintense region within the injected corpus callosum corresponding to the lesion site. B, Postcontrast T1-weighted image acquired to evaluate BBB integrity, showing gadolinium enhancement at the lesion site. C, ADC trace map showing an area of decreased ADC surrounded by a rim of increased ADC. D, Thresholded rCBV map showing an increase in rCBV in the ventral half of the injected hemisphere.
Reactivation of the fMOG-EAE lesion detected immunohistochemically
To mimic the effect of a bacterial infection on the reactivation of the fMOG-EAE lesion, we injected LPS intraperitoneally and examined the effect on the quiescent lesion by immunohistochemistry and MRI. After LPS injection, new recruitment of inflammatory cells and increased demyelination were evident, with close spatial correlation, in the lesioned corpus callosum (Fig. 2A–D). The numbers of both activated macrophages and lymphocytes (T and B cells) in the LPS-treated fMOG-EAE group were significantly greater than in the control groups 24 h after LPS injection (Fig. 3A,B). Similarly, the area of OX42 staining (activated microglia) was significantly greater in the LPS-treated fMOG-EAE group than in either the untreated fMOG-EAE group or the LPS-treated IFA group 24 h after LPS injection (Fig. 3C). The extent of demyelination in the injected corpus callosum was ranked in all four groups and was significantly greater in the LPS-treated fMOG-EAE group than in the three other groups (Fig. 3D). Moreover, a significant correlation was found between the number of activated macrophages and the area of demyelination across all fMOG-EAE animals (r = 0.72; p = 0.009; n = 12).
Figure 2.

Photomicrographs illustrating ED1-positive cells (brown DAB stain; A), myelin basic protein (B), OX22-positive cells (C), OX42-positive cells (D) and in the injected corpus callosum of an fMOG-EAE animal 24 h after intraperitoneal LPS injection (+LPS) or control (−LPS). Animals were injected with LPS on day 29 and perfused 24 h later. Scale bars: A, B, 500 μm; insets in A, B, 50 μm; C, 20 μm; D, 50 μm.
Figure 3.

Quantitation of the immunohistochemistry data showed a significant increase in the number of ED1-positive cells (microglia/macrophages; A), the number of OX22-positive cells (T-/B-cells; B), and the area of OX42 expression (microglia; C) in LPS-treated fMOG-EAE animals 24 h after LPS injection that was not seen in any other group. Ranked MBP data also revealed greater demyelination in the LPS-treated fMOG-EAE group than any other group (D). Animals were injected with LPS on day 29; time points in brackets represent after LPS injection. *, #, † denote significant differences between LPS-treated fMOG-EAE group and untreated fMOG-EAE, LPS-treated IFA, and untreated IFA groups, respectively (*,#,†p < 0.05; **, ##, ††p < 0.01; ***,###,†††p < 0.001). All values are expressed as mean ± SD: black bars, LPS-treated fMOG-EAE (n = 7); dark grey bars, untreated fMOG-EAE (n = 7); light grey bars, LPS-treated IFA (n = 5); and white bars, untreated IFA (n = 5).
Evidence of new macrophage recruitment to the fMOG-EAE lesion
To establish whether the LPS challenge was associated with extravasations of leukocytes into the lesion or simply with activation of resident microglia, we injected USPIO intravenously 5 min before LPS injection or at the equivalent time point in nonchallenged animals. It has been shown that these particles are actively phagocytosed by macrophages/monocytes in the blood, and subsequent recruitment of iron-laden macrophages to the brain can be detected on T2*-weighted images as a reduction in signal intensity (Weissleder et al., 1990). In this study, high-resolution ex vivo T2*-weighted images 24 h after LPS injection revealed a hypointense region localized to the lesion site and surrounding area (Fig. 4A). Paired t tests indicated a higher number of T2* hypointense pixels in LPS-treated fMOG-EAE animals than in the untreated fMOG-EAE animals (p = 0.047) (Fig. 4C), thus confirming increased macrophage infiltration in the fMOG-EAE animals after LPS injection. However, it was interesting to note that some USPIO-laden macrophages were evident in the non-LPS-challenged fMOG-EAE animals, indicating a low level of ongoing recruitment in apparently quiescent lesions (Fig. 4B,C). Postcontrast Gd-DTPA-enhanced T1-weighted images confirmed BBB integrity at either 6 or 24 h after LPS injection in fMOG-EAE animals (data not shown). The presence of iron particles was confirmed immunohistochemically (Fig. 4D). No hypointensities on T2*-weighted images, indicative of endogenous iron deposition, were observed at these time points in fMOG-EAE animals not injected with UPSIO (data not shown).
Figure 4.

A, High-resolution MRI images from LPS-treated (A) or untreated (B) fMOG-EAE animals, which have received an injection of USPIO 24 h previously (5 min pre-LPS in LPS-treated animals). Note that the presence of USPIO is revealed by a T2* hypointense region in the left corpus callosum and in the striatum. C, Graph showing the greater number of T2* hypointense pixels in LPS-treated fMOG-EAE animals (■; n = 6) compared with untreated fMOG-EAE animals (□; n = 6) (*p < 0.05). D, Photomicrograph illustrating iron particle staining (brown) in the brain parenchyma of an LPS-treated fMOG-EAE animal injected with USPIO. Scale bar, 20 μm.
Presence of upregulated cell adhesion molecules in the quiescent fMOG-EAE lesion
To further investigate this residual activity in apparently quiescent lesions, we used a newly developed sLex-targeted contrast agent to specifically visualize the expression of E- and P-selectin on the vascular endothelium (Kasteren, 2007). 3D gradient echo T2*-weighted datasets were obtained 1.5 h after GNP-sLex injection from animals with a quiescent fMOG-EAE lesion (no Gd-DTPA enhancement, T2, ADC, or MT signal changes). Little background or nonspecific binding was seen after the injection of control nanoparticles in fMOG-EAE animals (Fig. 5B). In contrast, in fMOG-EAE animals, the presence of GNP-sLex particles was evident in the region of, and immediately adjacent to, the site of the fMOG-EAE lesion (Fig. 5A), indicating ongoing endothelial activation despite intact BBB integrity and normalization of all other MRI indices. The volume of hypointensities was found to be 1.33 ± 0.58 mm3 in the lesioned (ipsilateral) hemisphere of GNP-sLex-injected animals compared with 0.51 ± 0.11 mm3 in control animals (paired t tests, p = 0.031). No significant differences were found in GNP-sLex particles accumulate in the contralateral hemisphere between fMOG-EAE and control animals (0.53 ± 0.21 vs 0.38 ± 0.09 mm3; paired t tests, p = 0.052). Paired t tests analysis demonstrated a greater L/R ratio for the volume of hypointensities in GNP-sLex-injected animals than controls (p = 0.009) (Fig. 5C).
Figure 5.
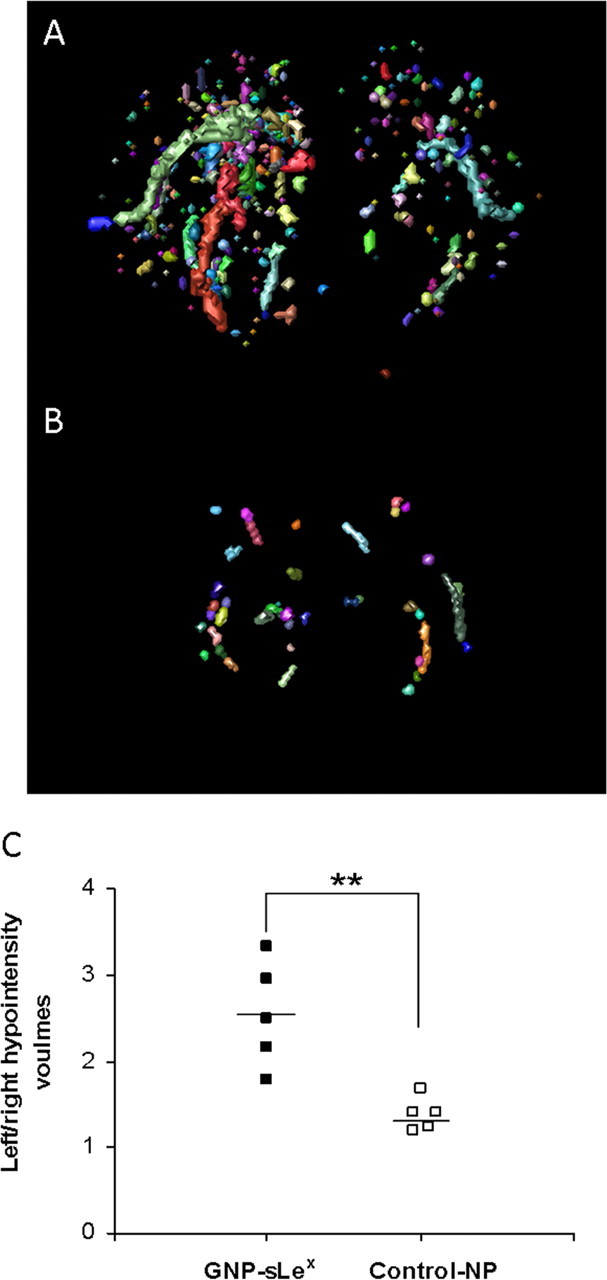
3D reconstruction maps revealing E- and P-selectin expression (automatic color volumes) in fMOG-EAE animals 28 d after intracerebral injection of cytokine injected with either GNP-sLex (A) or nonfunctionalized control-NP (B). C, Graph showing quantitative analysis of iron oxide nanoparticle accumulation, given as relative volume (left/right) of T2* hypointensities, in GNP-sLex-injected (■; n = 5) and control-NP-injected (□; n = 5) animals (**p < 0.01).
Reactivation of the fMOG-EAE lesion revealed by MRI
In fMOG-EAE animals challenged with LPS, a striking increase in rCBV in the zone surrounding the lesion was evident compared with pre-LPS rCBV maps (Fig. 6A,B). The area of increased rCBV in LPS-treated fMOG-EAE animals was significantly greater after challenge at both 6 h (2.24 ± 0.49; p = 0.006) and 24 h (1.79 ± 0.44; p = 0.029) compared with prechallenge values (1.05 ± 0.14). The L/R ratio for the area of increased rCBV was significantly greater in the LPS-treated fMOG-EAE group than all other groups at 6 h after LPS injection (Fig. 6C). In contrast, LPS challenge in the IFA group had no effect on rCBV (Fig. 6C). Interestingly, a significant correlation was found between L/R rCBV ratio and the number of activated macrophages (r = 0.76; p = 0.004; n = 12) at the 24 h time point across all fMOG-EAE animals (Fig. 6D). A small, but significant, decrease in the L/R MTR ratio of the corpus callosum in LPS-treated fMOG-EAE animals was evident 6 h after LPS injection (p = 0.05) (Fig. 6E), followed by a significant increase in the area of ADC hyperintensity around the corpus callosum at 24 h (p = 0.026) (Fig. 6F), possibly indicating active inflammatory processes. No breakdown of the BBB was found at either 6 or 24 h in LPS-treated fMOG-EAE animals. However, two additional fMOG-EAE animals challenged with LPS underwent MRI at 72 h after injection, and a mild Gd-DTPA enhancement in the lesioned hemisphere was observed (data not shown).
Figure 6.

CBV maps obtained before (A) and 6 h after (B) LPS injection in a fMOG-EAE animal, demonstrating areas of increased rCBV around the lesion 6 h after LPS injection. C, Graph showing L/R ratio for areas of increased rCBV (from thresholded images) over the time course after LPS injection. A significant increase in rCBV ratio compared with baseline was seen in LPS-treated fMOG-EAE animals but not in untreated fMOG-EAE animals or either IFA group (§p < 0.05; §§p < 0.01). D, Graph showing the correlation between ED1-positive cells and L/R rCBV area ratio across all fMOG-EAE animals. E, Graph showing time course of MTR ratio changes in which a significant decrease in the L/R MTR ratio is evident in the LPS-treated fMOG-EAE group 6 h after LPS injection (§p < 0.05). F, Graph showing time course of ADC changes in which an increase in the area of ADC hyperintensity can be seen at 6 and 24 h after LPS injection (§p < 0.05). In all cases, baseline data were obtained 1 d before LPS injection (day 28); time points in brackets represent post-LPS injection. All values are expressed as mean ± SD: black bars, LPS-treated fMOG-EAE (n = 7); dark grey bars, untreated fMOG-EAE (n = 7); light grey bars, LPS-treated IFA (n = 3); and white bars, untreated IFA (n = 4). *, #, † denote significant differences between LPS-treated fMOG-EAE group and untreated fMOG-EAE, LPS-treated IFA, and untreated IFA groups, respectively (*, #, †p < 0.05; **,##,††p < 0.01; ***, ###, †††p < 0.001).
Reactivation of DTH lesion detected by MRI
We have reported previously the progression of MRI-detectable changes after initiation of a focal DTH lesion in rat brain (Broom et al., 2005), which in most animals (60–65%) has completely resolved 4 weeks after lesion induction. In the remaining animals, either a residual elevation in rCBV (7–20%) or a small region of BBB compromise persists. As for the fMOG-EAE animals, systemic LPS injection at this time point caused an increase in rCBV in the lesioned (left) hemisphere compared with pre-LPS values (Fig. 7A,B). A significant increase in the L/R ratio for the area of elevated rCBV was found 6 h after injection in the DTH animals injected with LPS compared with pre-LPS values (p = 0.023) (Fig. 7E). In 60% of the LPS-treated DTH animals, rCBV had returned to normal by 24 h after LPS injection. No significant change rCBV was found in the DTH control animals during the analogous period.
Figure 7.

CBV maps acquired from a DTH animal before (A) and 6 h after (B) LPS injection, demonstrating an increase in rCBV in the zone surrounding the lesion 6 h after LPS injection. Subtraction (post-Gd − pre-Gd) T1-weighted images acquired before (C) and 6 h after (D) LPS injection. Areas showing no BBB breakdown appear black, and areas in which there is breakdown of the BBB and leakage of the contrast agent into the tissue appear white. Breakdown of the BBB is evident throughout the lesioned (left) hemisphere 24 h after LPS injection in this animal. E, Graph showing the increase in the L/R ratio for the area of increased CBV (from thresholded images) 6 h after LPS injection in DTH animals (black bars; n = 11). This increase was significant compared with pre-LPS values in this group (§p < 0.05). No significant change in rCBV was seen in control DTH animals over time (white bars; n = 5). F, Graph showing temporal changes in the area of contrast enhancement, which reflects BBB breakdown, in DTH animals (black bars; n = 11) after LPS injection compared with untreated DTH animals (white bars; n = 5). Data are given as mean ± SEM; baseline data were obtained 1 d before LPS injection (day 42), and time points in brackets represent post-LPS injection.
Increased BBB breakdown, as demonstrated in contrast enhancement, was also apparent in 60% of the LPS-treated DTH animals at some point between 6 and 72 h after LPS injection compared with pre-LPS values (Fig. 7C,D,F). However, this breakdown was both transient (lasting between 24 and 48 h) and variable in onset. In the remaining animals, no evidence of increased BBB breakdown was observed after LPS challenge over the time course studied. None of the DTH-control animals showed enhanced BBB breakdown during the analogous period. It is of note that the peripheral administration of LPS to naive animals did not cause breakdown of the BBB.
Discussion
In this study, we have used two different rat model systems reflective of pattern I (T-cell dependent) and pattern II (Ig/complement-dependent) MS plaque formation to determine whether a systemic inflammatory challenge, induced by peripheral LPS challenge, will reactivate quiescent CNS lesions. fMOG-EAE leads to antibody-mediated lesion formation, whereas, in the BCG-DTH model, this is a T-cell- and macrophage-mediated process, thus representing the two most common types of MS pathogenesis. The formation of stratified lesions in terms of spatial distribution and kinetics distinguishes these models from other types of EAE in which lesion presentation is random and variable, and hence is not quantifiable. To our knowledge, the consequences of a systemic challenge in models of pattern I and pattern II MS lesions have not been demonstrated previously. Our data show that, regardless of the pattern of the CNS pathology, quiescent lesions can be reactivated.
Here, LPS induced an increase in inflammatory activity in the fMOG-EAE lesion, as revealed by an increase in the number of newly recruited lymphocytes (T and B cells) and macrophages/activated microglia at the lesion site, together with increased demyelination. These findings bear similarities to recent studies of other brain pathologies in which systemic LPS injections in models of either brain injury or chronic neurodegenerative disease exacerbated brain damage and modified the local inflammatory response (Cunningham et al., 2005; McColl et al., 2007; Godoy et al., 2008). A link between the first clinical attack in MS or relapse and infection has been proposed on numerous occasions on the basis of epidemiological observations (Giovannoni and Ebers, 2007). However, although a link between infectious agents and disease initiation is now well established for Guillain-Barré syndrome and for chronic inflammatory demyelinating polyradicalneuropathy (Koga et al., 2006), two diseases that share many pathophysiologic aspects of MS, a causative role for specific infectious agents for MS has not materialized. In fact, many attempts to identify a viral or bacterial cause of MS have failed. Moreover, the heterogeneous nature of MS lesion formation supports the concept that MS may not be a nosologic entity but may be more syndromatic in its nature (Noseworthy et al., 2000). In this context, infectious diseases are, given the evidence presented here, more likely to activate disease activity in MS in a nonspecific way, either directly by the generic response to cell bacterial cell-wall products (LPS and analogs) or indirectly via secondary enhancement of an overactive immune response, leading to “bystander activation” of an MS-specific immune process. However, both pathways are, at least initially, dependent on activation of the innate immune system.
To establish whether or not the reactivation process was associated with new leukocyte recruitment, we used MRI to track USPIO-labeled macrophages. This approach has been used to track monocyte infiltration in both animal models (Floris et al., 2004; Brochet et al., 2006) and in patients (Saleh et al., 2004; Dousset et al., 2006) across a range of diseases, including stroke and multiple sclerosis. In this study, hypointense areas at the lesion site on T2*-weighted images strongly suggested new macrophage recruitment after LPS injection. No BBB breakdown was detected at either 6 or 24 h after LPS injection, and, therefore, it seems likely that migrating USPIO-laden monocytes crossed an intact BBB in response to inflammatory processes. However, we cannot entirely eliminate the possibility of transient BBB breakdown during the intervening period, which could allow free USPIO entry to the brain and phagocytosis by resident microglia. However, diffuse breakdown detected at 72 h (i.e., later than USPIO accumulation) suggests that earlier breakdown is unlikely. It should be noted that no BBB breakdown occurs after injection of the current LPS dose in either the control group or naive animals (our unpublished observations). This is in accord with previous studies using radioisotope tracers (Bickel et al., 1998). Moreover, we know that the use of intravenous Gd-DTPA and T1-weighted imaging are more sensitive to BBB compromise than immunohistochemical marker horseradish peroxidase (Sibson et al., 2002). Thus, it is most likely that our USPIO-enhanced data reflect new recruitment of blood-borne macrophages, alongside the renewed lymphocyte (T and B cell) recruitment from the circulation, but we cannot rule out the possibility that the signals reflect USPIO uptake by resident microglia.
The presence of some residual USPIO signal in the brains of animals with quiescent fMOG-EAE (no LPS challenge) was investigated using a new generation of targeted contrast agents that enable visualization of cerebral endothelium activation. This glyconanoparticle that we have developed recently enables the direct detection of E- and P-selectin upregulation on the luminal surface of the endothelium, through the targeting moiety sialyl Lewis-X. Using GNP-sLex, we detected marked E- and P-selectin expression in and around the lesion site, indicating ongoing lesion activity despite the absence of other MRI-detectable markers. Interestingly, the vessels showing the greatest increase in CBV after LPS challenge appear to map to those exhibiting ongoing selectin upregulation. This residual activity may explain, in part, both the ability of these lesions to rapidly reactivate after LPS challenge and the ongoing low-level leukocyte infiltration revealed by USPIO-MRI in unchallenged fMOG-EAE animals. However, the somewhat more widespread extent of GNP-sLex binding compared with the focal EAE lesion suggests that additional mechanisms are also required. Nevertheless, these data suggest that GNP-sLex has potential as a highly sensitive biomarker in MS and may enable more accurate assessment of lesion activity.
The use of conventional MRI in the current study has revealed further, clinically translatable, measures of lesion reactivation, including changes in rCBV, MTR, and tissue water ADC. In both types of immune-mediated CNS lesion, a striking acute increase in rCBV was observed after LPS injection. The increased rCBV coincides temporally with increases in body temperature and reduced locomotor activity after systemic LPS injection as reported previously (Konsman et al., 2002). The mechanism underlying the increase in rCBV is unclear but may reflect, at least in part, (1) reactivation of metabolically active leukocytes, (2) local production of the vasodilator nitric oxide (Willenborg et al., 1999), or (3) increased expression of local cytokines. We have shown previously that injection of IL-1β into the rat brain results in an acute increase in rCBV (Blamire et al., 2000). It is also known that peripheral injection of LPS induces IL-1β expression in both the periphery and the brain (Zetterström et al., 1998; McColl et al., 2007). Thus, it is likely that systemic administration of LPS in both fMOG-EAE and DTH animals resulted in synthesis and release of cytokines, such as IL-1β, within the brain and particularly in the region of the initial lesion. It is of interest to note that the number of macrophages in the lesion and the L/R rCBV ratio correlated significantly, suggesting that the source of vasoactive metabolites is likely to be recruited macrophages and activated microglia. We have demonstrated previously that increases in rCBV occur earlier in disease progression than clinically used indices of MS (Broom et al., 2005), and this has been confirmed in both retrospective and prospective clinical studies (Buljevac et al., 2002, 2003). The current findings suggest that increased rCBV may be a sensitive indicator of renewed lesion activity as well as acute disease onset.
The later increase in ADC in the lesioned corpus callosum may reflect increased demyelination at this time point, giving rise to a less restricted diffusion environment. However, the acute reduction in MTR did not appear to correlate with the level of myelination/demyelination and likely reflects other inflammatory events, as suggested previously (Gareau et al., 2000). These changes may provide additional information for the clinical assessment of MS lesion activity during relapse.
Breakdown of the BBB has been reported in a clinical study by Edwards et al. (1998) in MS patients during periods of infection. In contrast, in the more recent study by Buljevac et al. (2002), peripheral infection did not appear to alter the number of contrast-enhancing lesions in MS patients, although changes in the spatial extent of existing lesions were not considered. It seems likely that the time at which MRI is performed relative to infection is critical in such studies. For example, in Buljevac's study, MRI was performed after MS patients reported a clinical infection, and the average interval between identifying infection and the MRI scan was 7 d. Our study demonstrates the transient and variable nature of the reopening of the BBB after infection, suggesting that, in the clinical situation, a single and late time point MRI scan after infection is unlikely to consistently detect exacerbation of lesion enhancement.
Concerning the mechanism of reactivation, it is known that systemic LPS injections induce an acute-phase response (Campbell et al., 2003) and that the production of hepatic acute-phase proteins is responsible for increasing the number and the activation status of circulating leukocytes (Campbell et al., 2008). We have shown previously that the systemic administration of exogenous hepatic acute-phase proteins leads to an increase in the number of leukocytes that are recruited to focal lesions in the injured brain (Campbell et al., 2005). Here, we demonstrate the presence of sustained local expression of selectins in dormant lesions, and we can hypothesize that the continued expression of adhesion molecules contributes to the targeting of new leukocyte recruitment after activation of the hepatic acute-phase response.
In conclusion, a systemic inflammatory response to a single peripheral injection of LPS induces clear reactivation of both pattern I- and pattern II-like MS lesions, as determined both immunohistochemically and by multimodal MRI. Our results argue that, whatever etiological factor is responsible for the development of an immune-mediated CNS lesion, the presence of a pathogen in the periphery has the capacity to alter the pathogenesis of that lesion. The use of our novel targeted contrast agent and a USPIO-macrophage tracking approaches demonstrates that residual activity in apparently quiescent lesions may, at least in part, underlie the ability of these lesions to rapidly reactivate during systemic infection. These observations have important implications for the management and assessment of individuals with MS. In particular, more aggressive prevention and treatment strategies for infectious disease may be warranted in MS patients.
Footnotes
This work was supported by Medical Research Council Research Grant G0401438. We thank Dr. Alexandr Khrapichev for technical assistance and Dr. David Leppert for helpful advice in the preparation of this manuscript.
References
- Andersen O, Lygner PE, Bergström T, Andersson M, Vahlne A. Viral infections trigger multiple sclerosis relapses: a prospective seroepidemiological study. J Neurol. 1993;240:417–422. doi: 10.1007/BF00867354. [DOI] [PubMed] [Google Scholar]
- Barkhof F. The clinico-radiological paradox in multiple sclerosis revisited. Curr Opin Neurol. 2002;15:239–245. doi: 10.1097/00019052-200206000-00003. [DOI] [PubMed] [Google Scholar]
- Bickel U, Grave B, Kang YS, del Rey A, Voigt K. No increase in blood-brain barrier permeability after intraperitoneal injection of endotoxin in the rat. J Neuroimmunol. 1998;85:131–136. doi: 10.1016/s0165-5728(98)00004-6. [DOI] [PubMed] [Google Scholar]
- Blamire AM, Anthony DC, Rajagopalan B, Sibson NR, Perry VH, Styles P. Interleukin-1β-induced changes in blood–brain barrier permeability, apparent diffusion coefficient, and cerebral blood volume in the rat brain: a magnetic resonance study. J Neurosci. 2000;20:8153–8159. doi: 10.1523/JNEUROSCI.20-21-08153.2000. [DOI] [PMC free article] [PubMed] [Google Scholar]
- Brochet B, Deloire MS, Touil T, Anne O, Caillé JM, Dousset V, Petry KG. Early macrophage MRI of inflammatory lesions predicts lesion severity and disease development in relapsing EAE. Neuroimage. 2006;32:266–274. doi: 10.1016/j.neuroimage.2006.03.028. [DOI] [PubMed] [Google Scholar]
- Broom KA, Anthony DC, Blamire AM, Waters S, Styles P, Perry VH, Sibson NR. MRI reveals that early changes in cerebral blood volume precede blood-brain barrier breakdown and overt pathology in MS-like lesions in rat brain. J Cereb Blood Flow Metab. 2005;25:204–216. doi: 10.1038/sj.jcbfm.9600020. [DOI] [PubMed] [Google Scholar]
- Brück W, Stadelmann C. The spectrum of multiple sclerosis: new lessons from pathology. Curr Opin Neurol. 2005;18:221–224. doi: 10.1097/01.wco.0000169736.60922.20. [DOI] [PubMed] [Google Scholar]
- Buljevac D, Flach HZ, Hop WC, Hijdra D, Laman JD, Savelkoul HF, van Der Meché FG, van Doorn PA, Hintzen RQ. Prospective study on the relationship between infections and multiple sclerosis exacerbations. Brain. 2002;125:952–960. doi: 10.1093/brain/awf098. [DOI] [PubMed] [Google Scholar]
- Buljevac D, Verkooyen RP, Jacobs BC, Hop W, van der Zwaan LA, van Doorn PA, Hintzen RQ. Chlamydia pneumoniae and the risk for exacerbation in multiple sclerosis patients. Ann Neurol. 2003;54:828–831. doi: 10.1002/ana.10759. [DOI] [PubMed] [Google Scholar]
- Campbell SJ, Hughes PM, Iredale JP, Wilcockson DC, Waters S, Docagne F, Perry VH, Anthony DC. CINC-1 is an acute-phase protein induced by focal brain injury causing leukocyte mobilization and liver injury. FASEB J. 2003;17:1168–1170. doi: 10.1096/fj.02-0757fje. [DOI] [PubMed] [Google Scholar]
- Campbell SJ, Perry VH, Pitossi FJ, Butchart AG, Chertoff M, Waters S, Dempster R, Anthony DC. Central nervous system injury triggers hepatic CC and CXC chemokine expression that is associated with leukocyte mobilization and recruitment to both the central nervous system and the liver. Am J Pathol. 2005;166:1487–1497. doi: 10.1016/S0002-9440(10)62365-6. [DOI] [PMC free article] [PubMed] [Google Scholar]
- Campbell SJ, Anthony DC, Oakley F, Carlsen H, Elsharkawy AM, Blomhoff R, Mann DA. Hepatic nuclear factor kappa B regulates neutrophil recruitment to the injured brain. J Neuropathol Exp Neurol. 2008;67:223–230. doi: 10.1097/NEN.0b013e3181654957. [DOI] [PubMed] [Google Scholar]
- Combrinck MI, Perry VH, Cunningham C. Peripheral infection evokes exaggerated sickness behaviour in pre-clinical murine prion disease. Neuroscience. 2002;112:7–11. doi: 10.1016/s0306-4522(02)00030-1. [DOI] [PubMed] [Google Scholar]
- Cunningham C, Wilcockson DC, Campion S, Lunnon K, Perry VH. Central and systemic endotoxin challenges exacerbate the local inflammatory response and increase neuronal death during chronic neurodegeneration. J Neurosci. 2005;25:9275–9284. doi: 10.1523/JNEUROSCI.2614-05.2005. [DOI] [PMC free article] [PubMed] [Google Scholar]
- Dousset V, Grossman RI, Ramer KN, Schnall MD, Young LH, Gonzalez-Scarano F, Lavi E, Cohen JA. Experimental allergic encephalomyelitis and multiple sclerosis: lesion characterization with magnetization transfer imaging. Radiology. 1992;182:483–491. doi: 10.1148/radiology.182.2.1732968. [DOI] [PubMed] [Google Scholar]
- Dousset V, Brochet B, Deloire MS, Lagoarde L, Barroso B, Caille JM, Petry KG. MR imaging of relapsing multiple sclerosis patients using ultra-small-particle iron oxide and compared with gadolinium. Am J Neuroradiol. 2006;27:1000–1005. [PMC free article] [PubMed] [Google Scholar]
- Du C, Yao SY, Ljunggren-Rose A, Sriram S. Chlamydia pneumoniae infection of the central nervous system worsens experimental allergic encephalitis. J Exp Med. 2002;196:1639–1644. doi: 10.1084/jem.20020393. [DOI] [PMC free article] [PubMed] [Google Scholar]
- Edwards S, Zvartau M, Clarke H, Irving W, Blumhardt LD. Clinical relapses and disease activity on magnetic resonance imaging associated with viral upper respiratory tract infections in multiple sclerosis. J Neurol Neurosurg Psychiatry. 1998;64:736–741. doi: 10.1136/jnnp.64.6.736. [DOI] [PMC free article] [PubMed] [Google Scholar]
- Fitzgerald ML, Moore KJ, Freeman MW, Reed GL. Lipopolysaccharide induces scavenger receptor A expression in mouse macrophages: a divergent response relative to human THP-1 monocyte/macrophages. J Immunol. 2000;164:2692–2700. doi: 10.4049/jimmunol.164.5.2692. [DOI] [PubMed] [Google Scholar]
- Floris S, Blezer EL, Schreibelt G, Döpp E, van der Pol SM, Schadee-Eestermans IL, Nicolay K, Dijkstra CD, de Vries HE. Blood-brain barrier permeability and monocyte infiltration in experimental allergic encephalomyelitis: a quantitative MRI study. Brain. 2004;127:616–627. doi: 10.1093/brain/awh068. [DOI] [PubMed] [Google Scholar]
- Gareau PJ, Rutt BK, Karlik SJ, Mitchell JR. Magnetization transfer and multicomponent T2 relaxation measurements with histopathologic correlation in an experimental model of MS. J Magn Reson Imaging. 2000;11:586–595. doi: 10.1002/1522-2586(200006)11:6<586::aid-jmri3>3.0.co;2-v. [DOI] [PubMed] [Google Scholar]
- Giovannoni G, Ebers G. Multiple sclerosis: the environment and causation. Curr Opin Neurol. 2007;20:261–268. doi: 10.1097/WCO.0b013e32815610c2. [DOI] [PubMed] [Google Scholar]
- Godoy MC, Tarelli R, Ferrari CC, Sarchi MI, Pitossi FJ. Central and systemic IL-1 exacerbates neurodegeneration and motor symptoms in a model of Parkinson's disease. Brain. 2008;131:1880–1894. doi: 10.1093/brain/awn101. [DOI] [PMC free article] [PubMed] [Google Scholar]
- Hsu SM, Raine L, Fanger H. Use of avidin-biotin-peroxidase complex (ABC) in immunoperoxidase techniques: a comparison between ABC and unlabeled antibody (PAP) procedures. J Histochem Cytochem. 1981;29:577–580. doi: 10.1177/29.4.6166661. [DOI] [PubMed] [Google Scholar]
- Kasteren V. Physical sciences. Oxford: University of Oxford; 2007. Probes for the in vivo visualisation of cerebral inflammation; p. 269. [Google Scholar]
- Kerschensteiner M, Stadelmann C, Buddeberg BS, Merkler D, Bareyre FM, Anthony DC, Linington C, Brück W, Schwab ME. Targeting experimental autoimmune encephalomyelitis lesions to a predetermined axonal tract system allows for refined behavioral testing in an animal model of multiple sclerosis. Am J Pathol. 2004;164:1455–1469. doi: 10.1016/S0002-9440(10)63232-4. [DOI] [PMC free article] [PubMed] [Google Scholar]
- Koga M, Gilbert M, Takahashi M, Li J, Koike S, Hirata K, Yuki N. Comprehensive analysis of bacterial risk factors for the development of Guillain-Barre syndrome after Campylobacter jejuni enteritis. J Infect Dis. 2006;193:547–555. doi: 10.1086/499969. [DOI] [PubMed] [Google Scholar]
- Konsman JP, Parnet P, Dantzer R. Cytokine-induced sickness behaviour: mechanisms and implications. Trends Neurosci. 2002;25:154–159. doi: 10.1016/s0166-2236(00)02088-9. [DOI] [PubMed] [Google Scholar]
- Lucchinetti C, Brück W, Parisi J, Scheithauer B, Rodriguez M, Lassmann H. Heterogeneity of multiple sclerosis lesions: implications for the pathogenesis of demyelination. Ann Neurol. 2000;47:707–717. doi: 10.1002/1531-8249(200006)47:6<707::aid-ana3>3.0.co;2-q. [DOI] [PubMed] [Google Scholar]
- McAteer MA, Sibson NR, von Zur Muhlen C, Schneider JE, Lowe AS, Warrick N, Channon KM, Anthony DC, Choudhury RP. In vivo magnetic resonance imaging of acute brain inflammation using microparticles of iron oxide. Nat Med. 2007;13:1253–1258. doi: 10.1038/nm1631. [DOI] [PMC free article] [PubMed] [Google Scholar]
- McCluskey L, Campbell S, Anthony D, Allan SM. Inflammatory responses in the rat brain in response to different methods of intra-cerebral administration. J Neuroimmunol. 2008;194:27–33. doi: 10.1016/j.jneuroim.2007.11.009. [DOI] [PubMed] [Google Scholar]
- McColl BW, Rothwell NJ, Allan SM. Systemic inflammatory stimulus potentiates the acute phase and CXC chemokine responses to experimental stroke and exacerbates brain damage via interleukin-1- and neutrophil-dependent mechanisms. J Neurosci. 2007;27:4403–4412. doi: 10.1523/JNEUROSCI.5376-06.2007. [DOI] [PMC free article] [PubMed] [Google Scholar]
- Noseworthy JH, Lucchinetti C, Rodriguez M, Weinshenker BG. Multiple sclerosis. N Engl J Med. 2000;343:938–952. doi: 10.1056/NEJM200009283431307. [DOI] [PubMed] [Google Scholar]
- Panitch HS. Influence of infection on exacerbations of multiple sclerosis. Ann Neurol. 1994;36(Suppl):S25–S28. doi: 10.1002/ana.410360709. [DOI] [PMC free article] [PubMed] [Google Scholar]
- Rapp NS, Gilroy J, Lerner AM. Role of bacterial infection in exacerbation of multiple sclerosis. Am J Phys Med Rehabil. 1995;74:415–418. doi: 10.1097/00002060-199511000-00004. [DOI] [PubMed] [Google Scholar]
- Saleh A, Schroeter M, Jonkmanns C, Hartung HP, Mödder U, Jander S. In vivo MRI of brain inflammation in human ischaemic stroke. Brain. 2004;127:1670–1677. doi: 10.1093/brain/awh191. [DOI] [PubMed] [Google Scholar]
- Schroeter M, Saleh A, Wiedermann D, Hoehn M, Jander S. Histochemical detection of ultrasmall superparamagnetic iron oxide (USPIO) contrast medium uptake in experimental brain ischemia. Magn Reson Med. 2004;52:403–406. doi: 10.1002/mrm.20142. [DOI] [PubMed] [Google Scholar]
- Sibley WA, Bamford CR, Clark K. Clinical viral infections and multiple sclerosis. Lancet. 1985;1:1313–1315. doi: 10.1016/S0140-6736(85)92801-6. [DOI] [PMC free article] [PubMed] [Google Scholar]
- Sibson NR, Blamire AM, Perry VH, Gauldie J, Styles P, Anthony DC. TNF-alpha reduces cerebral blood volume and disrupts tissue homeostasis via an endothelin- and TNFR2-dependent pathway. Brain. 2002;125:2446–2459. doi: 10.1093/brain/awf256. [DOI] [PubMed] [Google Scholar]
- Weissleder R, Elizondo G, Wittenberg J, Lee AS, Josephson L, Brady TJ. Ultrasmall superparamagnetic iron oxide: an intravenous contrast agent for assessing lymph nodes with MR imaging. Radiology. 1990;175:494–498. doi: 10.1148/radiology.175.2.2326475. [DOI] [PubMed] [Google Scholar]
- Willenborg DO, Staykova MA, Cowden WB. Our shifting understanding of the role of nitric oxide in autoimmune encephalomyelitis: a review. J Neuroimmunol. 1999;100:21–35. doi: 10.1016/s0165-5728(99)00212-x. [DOI] [PubMed] [Google Scholar]
- Zetterström M, Lundkvist J, Malinowsky D, Eriksson G, Bartfai T. Interleukin-1-mediated febrile responses in mice and interleukin-1 beta activation of NFkappaB in mouse primary astrocytes, involves the interleukin-1 receptor accessory protein. Eur Cytokine Netw. 1998;9:131–138. [PubMed] [Google Scholar]