

Abstract
Vital to motor learning is information about movement error. Using this information, the brain creates neural learning signals that instruct a plasticity mechanism to produce appropriate behavioral learning. Little is known, however, about brain structures that generate learning signals for voluntary movements. Here we show that signals from the superior colliculus (SC) can drive learning in saccadic eye movements in the monkey. Electrical stimulation of the SC deeper layers, subthreshold for evoking saccades, was applied immediately (∼60 ms) after the end of horizontal saccades in one or both directions. The target disappeared during saccades and remained invisible for 1 s to eliminate effects of postsaccadic visual information. Repetitive pairing of saccades with SC stimulation produced a marked, two-dimensional shift in movement endpoint relative to the target location. The elicited endpoint shift took a gradual, approximately exponential course over several hundred saccades as in visually induced saccade adaptation. The shift in movement endpoint remained nearly unchanged after stimulation was discontinued, indicating involvement of neuronal plasticity. When both rightward and leftward saccades were paired with stimulation, their endpoints shifted in similar directions. The endpoint shift was directed contralaterally to the stimulated SC. The direction and size of the endpoint shift depended on the stimulation site in the SC. We propose that the SC, a brainstem structure long known to be crucial for saccade execution, is involved in motor learning and sends signals that dictate the direction of adaptive shift in saccade endpoint.
Introduction
Motor learning ensures the accuracy of our daily movements. Vital to motor learning is information about movement error, from which the brain creates a neural learning signal that instructs a relevant plasticity mechanism to appropriately change the next movement. However, critical questions about this signal remain unanswered. Where in the brain is the learning signal created for voluntary movements? What pathway brings this signal to the site of plasticity?
A good model to address these questions is saccades, voluntary eye movements that rapidly shift the line of sight to a new target (Hopp and Fuchs, 2004). Learning in saccades, called saccade adaptation, maintains movement accuracy throughout life despite changes in mechanical properties of the oculomotor plant resulting from growth, aging, and injury. Saccade adaptation is guided by visual information about movement error that is present immediately after movements (Wallman and Fuchs, 1998; Shafer et al., 2000; Noto and Robinson, 2001; Fujita et al., 2002). Previous studies indicate that the cerebellar oculomotor vermis is a major site of plasticity for saccade adaptation (Barash et al., 1999; Robinson et al., 2002; Robinson and Noto, 2005). Therefore, the oculomotor vermis must receive a saccade learning signal that induces plastic changes. However, little is known about the neural structures that send this learning signal. Recently, we succeeded in eliciting saccade adaptation by electrical stimulation of the midbrain tegmentum and suggested that the stimulated neural element was axons that carry the learning signal (Kojima et al., 2007). The distribution of effective stimulation sites (Kaku, Iwamoto, Yoshida; unpublished observation) and known anatomical data (Frankfurter et al., 1976; Moschovakis et al., 1988) point to a possible origin of these passing fibers, the deeper layers of the superior colliculus (SC). The SC plays a key role in saccade generation by issuing a saccade motor command to the premotor reticular circuitry (Scudder et al., 2002). The SC has indirect access to the oculomotor vermis via two different precerebellar nuclei, the nucleus reticularis tegmenti pontis (Crandall and Keller, 1985; Yamada and Noda, 1987) and the medial accessory nucleus of the inferior olive (Frankfurter et al., 1976; Brodal and Brodal, 1981, 1982). If the SC normally sends the learning signal to the cerebellum, repetitive pairing of saccades with appropriately timed SC stimulation should elicit adaptation even when no information about movement error is available. The present study shows that this prediction was indeed the case.
Materials and Methods
Animal preparations.
Two juvenile rhesus monkeys, H and F (Macaca mulatta, male, 7.0 and 5.0 kg), were prepared for eye movement recording, extracellular recording and electrical stimulation in the superior colliculus. Eye movements were measured by the magnetic search coil method (Fuchs and Robinson, 1966). Anesthesia was introduced with ketamine hydrochloride (15–20 mg/kg, i.m.) and maintained by inhalation of isoflurane. Under aseptic conditions, a coil of Teflon-coated stainless steel wire was implanted beneath the insertions of the four recti of one eye to measure eye movements. Stainless steel tubes were attached to the skull with bone screws and dental acrylic for painless immobilization of the head during the experiment. The ends of the eye coil wire were terminated in a small connector implanted on the surface of the acrylic. The animal was treated with an antibiotic (cefazolin) for 3 d to prevent infections after the surgery. After recovery from the first surgery, the monkeys were trained to follow a small jumping target (a laser spot on the screen) with the eye. After completion of the training, the animal underwent general anesthesia and was fixed to a stereotaxic frame. A cylindrical chamber was centered on the midline and implanted over the posterior part of the skull. To gain access to the SC, the chamber was tilted 30° posteriorly from the stereotaxic vertical in the sagittal plane. At the end of each experiment, and when necessary between experiments, the inside of the chamber was cleaned with povidone iodine and sterile physiological saline. All surgical and experimental protocols were approved by the Animal Care and Use Committee at the University of Tsukuba and by the Animal Care Committee at the Tsukuba Primate Research Center.
Behavioral task.
During experiments, the monkey sat in a primate chair in a darkened booth with its head restrained. The animal was required to make saccades toward a target spot jumping on a screen ∼35 cm away from the eyes. The monkey was given a small amount of apple juice as a reward whenever he fixated the target continuously for 0.6–0.8 s. During a blanking period (see below), the animal could be rewarded by keeping his eye near the location at which the target disappeared. We required the animal to make saccades to horizontal target steps of two amplitudes (8° and 10°) within ± 15° of the straight-ahead position. To discourage anticipatory movements, the size and direction of the target step were altered pseudorandomly. After placing a stimulating electrode in the deeper layers of the SC and characterizing the stimulation site (see below), we first collected ∼50 saccades for each of the target steps (8° left, right; 10° left, right) as prestimulation control data. In the following stimulation session, electrical stimulation was delivered to the SC after every saccade made to the target steps in one or both directions. We continued to pair a saccade with stimulation until the magnitude of the endpoint shift amounted to ∼4° or the number of stimulation-coupled saccades in one direction reached ∼1400. After cessation of stimulation, we collected ∼50 saccades for each of the target steps. Throughout the prestimulation, stimulation and poststimulation sessions, the target disappeared during saccades (∼15 ms after saccade onset) and remained invisible for 1.1 s. After the blanking period, the target reappeared at the location where it disappeared, and the animal made a “corrective” saccade to the target. The target blanking prevented the animal from receiving postsaccadic visual information. Visual information about movement error given 0.75 s after a saccade is still effective in inducing saccade adaptation (Shafer et al., 2000). The blanking period in our study sufficiently covered this time window.
Identification of the deeper layers of the superior colliculus.
A glass-coated tungsten microelectrode was inserted through a guide tube (23 gauge spinal needle). The guide tube was fixed to the chamber with a grid system (Crist Instrument), which allowed electrode penetrations at one of the grid locations that were 0.5 mm apart from one another mediolaterally and anteroposteriorly. In the present study, we made 34 penetrations at 16 grid locations in monkey H and 9 penetrations at 6 grid locations in monkey F. The entry into the SC was indicated by an increase in background neural activity. Visual burst activity occurring at a latency of ∼50 ms from a target step indicated that the electrode tip was in the superficial layer of the SC. We obtained the optimal vector of the receptive field by showing the target at various retinal locations. We then identified the deeper layers of the SC by the presence of high frequency burst activity related to the contralateral saccades, which was often preceded by a visual response. The observed multi-, sometimes single-, unit activity was time-locked to saccades and showed its peak around movement onset. We estimated the optimal vector for the stimulation site by judging the intensity of burst activity for saccades of different sizes and directions as well as by checking saccades evoked by suprathreshold stimulation (Sparks and Hartwich-Young, 1989). According to the grid locations for the guide tube, our stimulation sites were approximately in the area extending mediolaterally by ∼2.5 mm and rostrocaudally by ∼1.0 mm.
Electrical stimulation.
Trains of rectangular cathodal pulses (monopolar; monophasic pulse width, 0.2 ms; rate, 250 Hz; 20 pulses) were delivered from a constant current stimulator. The stimulus train was triggered at a delay of either 80 or 180 ms from the time of saccade detection, which was ∼15 ms from saccade onset. Because the duration of saccades paired with stimulation was ∼30–45 ms in this study, the delay from saccade end was between ∼60 and ∼160 ms. We chose these timings because visual information about movement error present during the first 150 ms after saccade end is most effective for inducing adaptation (Shafer et al., 2000). Before the prestimulation session, we estimated the threshold for evoking saccades. Stimulation was applied >400 ms after the saccade end while the animal was fixating the target. The current level that could evoke saccades at the probability of ∼50% (4–6 of 10) was defined as a movement threshold. The threshold ranged from 5 to 20 μA, comparable to those previously reported for the SC deeper layers (Robinson, 1972). In the stimulation session of the majority of experiments, stimulation delay was ∼60 ms from saccade end. We found that the threshold tested at this delay was often higher than that tested at a delay of >400 ms. Therefore, in some experiments, we were able to use the higher stimulus intensity than the original threshold (estimated at >400 ms) without evoking any eye movements (Fig. 1). The stimulus current used in the stimulation session ranged from 7.5 to 30 μA. We also found that the threshold sometimes showed a gradual increase as we repeatedly applied a stimulus train. Therefore, we checked the threshold for every ∼100th saccade during the stimulation session. When the increase in threshold was observed, we readjusted the stimulus current to ∼80–90% of the new movement threshold. By monitoring eye movement traces on-line and closely examining the eye velocity traces in the off-line analysis for each experiment, we confirmed that SC stimulation did not evoke eye movements during the stimulation session.
Figure 1.

A sample record showing that the SC stimulation evoked no eye movement. Traces indicate, from top to bottom, radial eye velocity, stimulus mark, eye position (red), and target position (blue). Broken lines in the target position traces indicate that the target was blanked. The eye velocity trace during and after stimulation confirms the lack of evoked movements.
Data analysis.
Eye and target positions were digitized online at 1 kHz. Neural activities were sampled at 50 kHz and stored in a hard disk. Data were analyzed off-line on a computer using homemade programs that ran on an analysis software (Spike2; Cambridge Electronic Design). Saccade onset and end were defined by an eye velocity threshold criterion of 20°/s. Visually guided saccades with latencies of <60 and >450 ms were excluded from the analysis. In the current study, we focused on the analysis of eye positions at the start and end of the movement. Because SC stimulation elicited changes in both movement direction and amplitude, the observed change was analyzed as a two-dimensional shift in movement endpoint rather than a change in saccade gain. Although the target moved from different horizontal positions, the endpoint of individual saccades was calculated relative to the position of the target that the monkey fixated just before those saccades, with rightward and upward taken as positive. To quantify the endpoint shift, the shift vector was defined as a difference in average saccade endpoint between poststimulation and prestimulation sessions. As a measure of the direction of the endpoint shift, we calculated the angular deviation of the shift vector from the pure horizontal direction. During the course of the present study, we realized that target blanking alone often resulted in a small endpoint change for saccades that were not paired with SC stimulation (size 0.23° to 0.57°, mean/SD = 0.44°/0.13°, 11 experiments). On the basis of these observations, we set an arbitrary criterion of a shift size of >1° (for saccades to 10° target steps) to judge that an endpoint shift was caused by electrical stimulation.
Results
We investigated whether electrical stimulation of the deeper layers of the SC could elicit saccade adaptation when the visual information about movement error was not given. Data were collected in two male rhesus monkeys trained to follow a small target that jumped along the horizontal meridian. Saccades to both 10° target steps and 8° steps were paired with stimulation. We will describe results mainly for the saccades to 10° target steps. In all 43 experiments, saccade size was normal before the stimulation session. Mean horizontal saccade gain (saccade amplitude divided by target eccentricity) was 0.99 (SD 0.03) for leftward saccades and 1.02 (SD 0.03) for rightward saccades in the prestimulation session.
In one series of experiments, SC stimulation was paired with either leftward or rightward saccades. Figures 2 and 3 show the results of one such experiment, in which saccades made to leftward target steps were repetitively paired with stimulation of the right SC in monkey H. Figure 2 illustrates sample records of both eye and target movements in the prestimulation, stimulation and poststimulation sessions. Saccades in both directions were normometric in the prestimulation session (Fig. 2, pre). The mean gains for leftward and rightward saccades were 0.98 and 1.04, respectively. In the stimulation session (stim), electrical stimulation (20 μA, subthreshold for evoking saccades) was applied after every saccade made to leftward target steps. A stimulus train started ∼60 ms after the end of saccades. By the time ∼400 saccades (to 10° leftward target steps) were paired with stimulation, a clear increase in saccade size was observed (Fig. 2, stim). After stimulation was discontinued, saccade amplitude remained ∼30% larger than in the prestimulation session (Fig. 2, post). A small but significant upward component of leftward saccades was also induced. In contrast, saccades to rightward target steps, not coupled with stimulation, did not show clear changes (Fig. 2, bottom). Throughout the experiment, fixation of the target immediately before saccades was not affected by the stimulation procedure.
Figure 2.

Effect of repetitive coupling of saccades with SC stimulation. Sample records are collected before (pre), during (stim), and after (post) stimulation session in monkey H. Black and gray traces indicate eye and target positions, respectively (horizontal and vertical). Each panel contains traces for 7–9 saccades. Only leftward saccades were coupled with stimulation in this experiment. Striped bars indicate the time over which the target was blanked (broken lines in target traces). Rt, Rightward; Lt, leftward; Up, upward; Dn, downward.
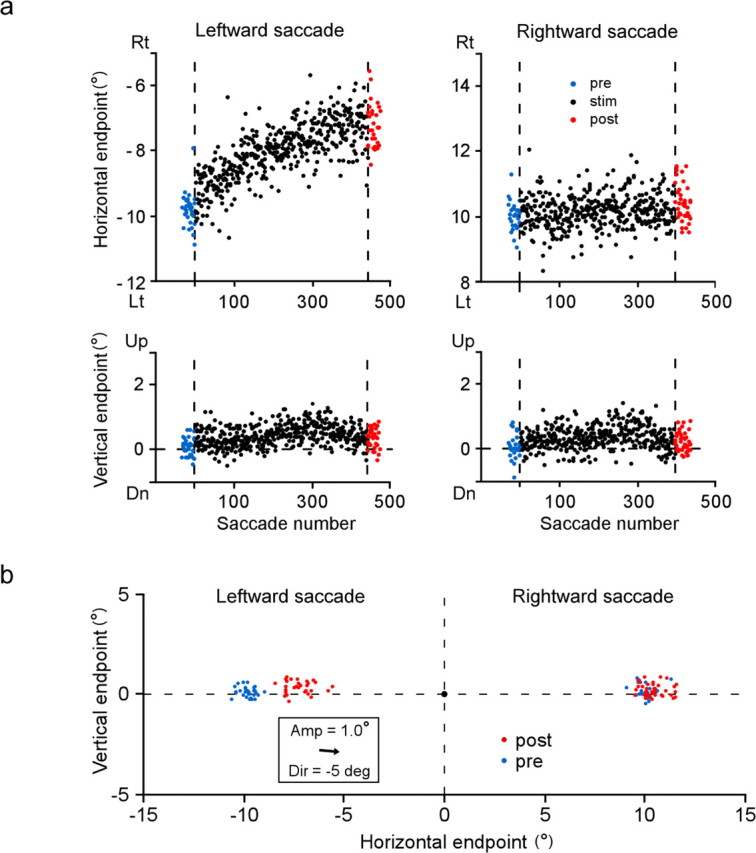
Figure 3.

a, Course of change in saccade endpoints induced by stimulation of the right SC. Same experiment as in Figure 2 (monkey H). Endpoints of individual saccades, expressed relative to location of presaccadic fixation target, are plotted against saccade number. Horizontal positions of saccade target are −10° and 10°. Positive direction of ordinates indicates rightward (Rt) or upward. Blue and red dots indicate saccades in prestimulation and poststimulation sessions, respectively. Vertical broken lines indicate start and end of stimulation session. b, Two-dimensional distribution of saccade endpoint before (blue) and after (red) stimulation session. A black dot at the origin indicates presaccadic position of target. An arrow inside the inset indicates the optimal vector for the stimulation site. Dir, Direction represented by angular deviation from the pure leftward direction; Amp, amplitude; Lt, leftward; Dn, downward; “deg” denotes saccade direction.
We analyzed the elicited changes as a shift in movement endpoint. The endpoint of each saccade was calculated relative to the location of the presaccadic fixation target. To examine the course of stimulation-elicited changes, we plotted the horizontal and vertical components of endpoints of individual saccades as a function of saccade number (Fig. 3a). For stimulation-coupled, leftward saccades, the movement endpoint gradually shifted in the left-up direction (mean horizontal endpoint/SD = −9.8°/0.6° in the prestimulation session and −12.5°/0.7° in the poststimulation session). For rightward saccades, there were no progressive shifts in movement endpoint. The gradual nature of the shift was similar to that of visually induced adaptation (Straube et al., 1997; Hopp and Fuchs, 2004). To illustrate the magnitude and direction of the endpoint shift shown in Figure 3a, we made a two-dimensional plot of the endpoints of prestimulation saccades (blue) and poststimulation saccades (red), the origin indicating the location of the target for presaccadic fixation (Fig. 3b). The optimal vector for the stimulation site was indicated by an arrow in the inset. The cluster of endpoints of leftward saccades clearly shifted with no overlap between pre and poststimulation. The magnitude of the shift, estimated as a two-dimensional distance between their average endpoints, was 3.1°. For rightward saccades, although the difference between prestimulation and poststimulation distributions was statistically significant, the shift size was only 0.4°, far smaller than that for leftward saccades. A similar endpoint shift was elicited in the other animal as well. As shown in Figure 4, the endpoint of leftward saccades, which were paired with the left SC stimulation, exhibited a gradual shift in the right direction.
Figure 4.
a, Course of endpoint change induced by stimulation of the left SC in monkey F. Same format as in Figure 3a. b, Two-dimensional distribution of saccade endpoints before (blue) and after (red) the stimulation session. Same format as in Figure 3b. Note that the direction of the optimal vector for the stimulation site (Dir) is represented by angular deviation from the pure rightward direction. Rt, Rightward; Lt, leftward; Dn, downward; “deg” denotes saccade direction.
In a total of 29 experiments, saccades in one horizontal direction were paired with SC stimulation. We regarded the elicited shift in saccade endpoint as a two-dimensional vector and calculated its size. Data from 21 experiments, in which stimulation-coupled saccades showed endpoint shifts of >1°, were selected for further analysis. Figure 5 summarizes the size of the endpoint shift calculated for both stimulation-coupled (Stim) and noncoupled (No stim) saccades. A pair of circles connected by a line indicates data from the same experiment. Clear shifts in endpoint were seen only in stimulation-coupled saccades whether stimulation was coupled with leftward or rightward saccades. The magnitude of the shift ranged from 1.4° to 4.0° (n = 21). Figure 6 shows a summary of the two-dimensional courses of the endpoint shift in 19 experiments in monkey H. The dots indicate an average endpoint for every 100th saccade. In a given experiment, the endpoint showed a progressive shift in an approximately constant direction. The direction of the shift depended on the side of stimulation. Repetitive coupling of saccades with stimulation of the left colliculus resulted in rightward shifts regardless of saccade direction. Note that these rightward endpoint shifts indicate amplitude increases for rightward saccades and amplitude decreases for leftward saccades. Meanwhile, repeated pairing of saccades with right colliculus stimulation produced leftward shifts in movement endpoint. Finally, the vertical component of endpoint shifts varied across experiments.
Figure 5.

Comparison of the size of endpoint shift between stimulation-coupled and noncoupled saccades. Data are from 21 experiments in which saccades in one horizontal direction were coupled with stimulation. Left (right) panel shows experiments in which leftward (rightward) saccades were coupled with SC stimulation. Ordinates indicate the size of the endpoint shift calculated from the square root of the horizontal and vertical changes in the saccade endpoint. In each panel, two groups of circles aligned vertically indicate stimulation-coupled saccades and noncoupled saccades. A pair of circles connected by a line indicates data from the same experiment. Rt, Rightward; Lt, leftward.
Figure 6.

Course of the endpoint shift represented two-dimensionally. A summary of the 19 experiments in monkey H, shown separately in four panels according to stimulation side and saccade direction. Dots connected with lines indicate one experiment. Each dot indicates the average for 25 consecutive saccades, starting from the first, 100th, 200th, and so on. An asterisk indicates data shown in Figures 2 and 3. The intersection of two broken lines indicates the average endpoint in the prestimulation session. Rt, Rightward; Lt, leftward.
Saccade adaptation induced with intrasaccadic step (ISS) of the target is known to exhibit gradual recovery after ISS is stopped (Hopp and Fuchs, 2004). Therefore, in two experiments, we examined whether the electrical stimulation-induced endpoint shift exhibited recovery after stimulation was discontinued. Figure 7 shows the result of one such experiment, in which rightward saccades were paired with left SC stimulation. After collecting data in the poststimulation session, we stopped blanking the target. The endpoint of the rightward saccades, which had shifted rightward by ∼4° (amplitude increase), gradually returned toward the now visible target over the next ∼400 saccades (Fig. 7).
Figure 7.

An example of recovery of SC stimulation-induced adaptation. Rightward saccades were paired with stimulation of the left SC. In the stimulation session, the endpoint shifted rightward by ∼4°. After the poststimulation session, the target was no longer blanked and the endpoint gradually returned toward the target. An arrow inside the inset indicates the optimal vector for the stimulation site. Rt, Rightward; Lt, leftward; Dir, direction; Amp, amplitude; “deg” denotes saccade direction.
We hypothesized that neural signals created by electrical stimulation of the deeper layers of the SC instruct the direction of endpoint shifts in subsequent saccades. We therefore conducted a second series of experiments, in which the same SC site was stimulated after both leftward and rightward saccades. According to our hypothesis, the direction of endpoint shifts would be the same for the two sets of saccades. Figure 8 shows the results of one such experiment. During the stimulation session, a site in the left colliculus was stimulated ∼60 ms after the end of every saccade made to horizontal target steps. The endpoints of the leftward and rightward saccades exhibited gradual shifts in approximately the same direction, i.e., right-up (Fig. 8a). The similarity in shift direction is clearly seen in a two-dimensional plot (Fig. 8b). Note, again, that leftward and rightward saccades exhibited quite different changes in terms of movement amplitude: leftward saccades became smaller whereas rightward saccades larger.
Figure 8.
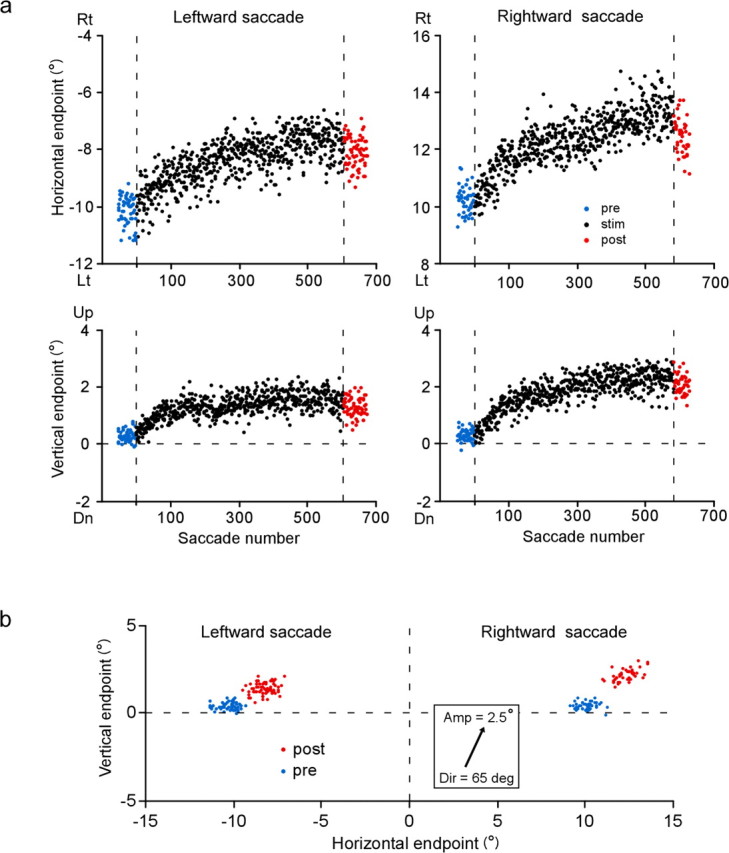
Effect of repetitive coupling of both leftward and rightward saccades with SC stimulation. In this experiment, stimulation was applied to the left SC. a, Course of saccade endpoint shift. b, Two dimensional distribution of saccade endpoints before (blue) and after (red) the stimulation session. Same format as in Figure 4b. Rt, Rightward; Lt, leftward; Dir, direction; Amp, amplitude; “deg” denotes saccade direction.
In 11 experiments, the magnitude of the endpoint shift for both leftward and rightward saccades exceeded 1°. For the left SC stimulation, the direction of the endpoint shift for leftward saccades ranged from 1.2 deg down to 31.5 deg up and that for rightward saccades from 1.5 deg down to 38.3 deg up from the pure rightward direction. For the right SC stimulation, the shift direction for leftward saccades ranged from 10.9 deg up to 38.0 deg up and that for rightward saccades from 9.0 deg up to 41.2 deg up from the pure leftward direction. We compared the shift direction for leftward saccades (ordinate) and that for rightward saccades (abscissa) in each experiment (Fig. 9a). The shift direction for leftward saccades and that for rightward saccades were positively correlated (Pearson's r = 0.86, p < 0.05 for left SC stimulation, and r = 0.99, p < 0.005 for right SC stimulation). The data points were situated close to the line y = x, indicating that, in a given experiment, endpoints of leftward saccades and those of rightward saccades shifted in similar directions. In addition, we examined the relationship between the size of the endpoint shift for leftward saccades and that for rightward saccades. The shift size ranged from 1.3° to 4.3° for leftward saccades and from 1.1° to 4.8° for rightward saccades. The shift size for leftward saccades and that for rightward saccades were positively correlated, although the trend did not reach statistical significance (Pearson's r = 0.73, p = 0.06 for left SC stimulation, and r = 0.95, p = 0.07 for right SC stimulation) (Fig. 9b). When saccades were classified as contraversive or ipsiversive with respect to the side of stimulation, the shift size for contraversive saccades was found to be slightly larger than that for ipsiversive saccades (the regression line formula: y = 1.02x + 0.65; p for trend <0.001) (Fig. 9c).
Figure 9.
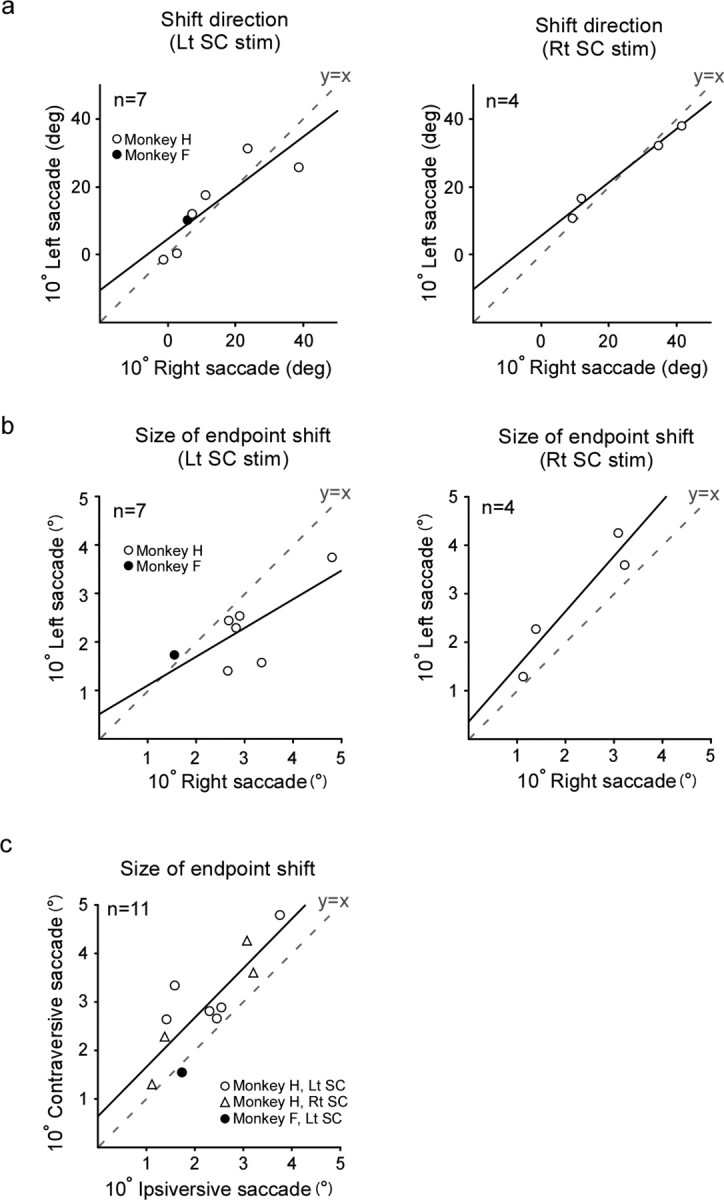
Endpoint shifts elicited in leftward and rightward saccades. Data are from 11 experiments. Open and filled symbols indicate monkeys H and F, respectively. The broken line in each graph indicates y = x. a, Relationship between the direction of the endpoint shift for leftward saccades (ordinate) and that for rightward saccades (abscissa), shown separately for left SC and right SC stimulation. The shift direction is represented by angular deviation from the direction contralateral to the stimulated SC. Zero degrees indicates pure rightward for left SC and pure leftward for right SC. Positive values indicate upward deviation. The regression line formula is y = 0.75x + 4.63, p for trend <0.05 for left SC stimulation, and y = 0.78x + 5.57, p for trend <0.01 for right SC stimulation (simple linear regression). b, Relationship between the size of the endpoint shift for leftward saccades (ordinate) and that for rightward saccades (abscissa). The regression line formula is y = 0.59x – 0.51, p for trend = 0.06 for left SC stimulation, and y = 1.14x + 0.36, p for trend = 0.06 for right SC stimulation (simple linear regression). c, Relationship between the size of the endpoint shift for contraversive saccades (ordinate) and that for ipsiversive saccades (abscissa). Open circles, open triangles, and a filled circle indicate left SC stimulation in monkey H, right SC stimulation in monkey H and left SC stimulation in monkey F, respectively. Rt, Rightward; Lt, leftward; “deg” denotes shift direction.
The results described so far suggest that the direction of the endpoint shift is determined by the stimulation site in the SC deeper layers. To verify this hypothesis, we examined the relationship between the shift direction and the neural characteristics of the SC stimulation site. The deeper layers of the SC are known to have a motor map, each site representing a specific saccade vector (Sparks and Hartwich-Young, 1989), which we call an optimal vector for the site. In the present study, we estimated 32 optimal vectors for effective stimulation sites in the first and second series of experiments. The direction of the optimal vector for left SC sites ranged from 70 deg down to 60 deg up from the pure rightward direction, and that for right SC sites ranged from 32.5 deg down to 55 deg up from the pure leftward direction. As shown in Figure 10a, the direction of the endpoint shift (ordinate) varied systematically with that of the optimal vector (abscissa) for the stimulation site. There was a significant positive correlation between them (Pearson's r = 0.74, p < 0.0005 for left SC stimulation, and r = 0.79, p < 0.001 for right SC stimulation). Thus, the direction of the endpoint shift depended on the spatial characteristics of neural activity at the SC stimulation site.
Figure 10.

a, Relationship between the direction of the endpoint shift (ordinate) and that of the optimal vector for SC stimulation site (abscissa) for 32 experiments, shown separately for left SC and right SC stimulation. Note that in this figure and in Figures 11c and 12a, we adopted the average of shift directions for leftward and rightward saccades as the representative value for each of the 11 experiments in the second series. The regression line formula is y = 0.33x + 7.47, p for trend <0.0005 for left SC stimulation, and y = 0.44x + 10.81, p for trend <0.005 for right SC stimulation (simple linear regression). b, Relationship between the size of the endpoint shift (ordinate) and the amplitude of the optimal vector for the SC stimulation site (abscissa) for 43 experiments. Note that in this figure and in Figures 11d and 12b, we adopted the average of shift sizes for leftward and rightward saccades as the representative value for each experiment in the second series. Rt, Rightward; Lt, leftward; “deg” denotes shift direction and direction of optimal vector.
To examine whether the magnitude of the endpoint shift might be determined by the stimulation site, we next analyzed the relationship between the size of the endpoint shift and that of the optimal vector. For this analysis we added data from 11 experiments in which the size of the endpoint shifts was <1°. The amplitude of the optimal vectors in the 43 experiments ranged from 0.5° to 20.0°. In Figure 10b, we plotted the size of endpoint shift as a function of the amplitude of the optimal vector. For both the left and the right SC, the shift size tends to decrease as the amplitude of the optimal vector increases. In particular, no “significant” endpoint shifts were elicited when the amplitude of the optimal vector was >∼6°. Because the optimal vectors for 32 effective stimulation sites had amplitudes of 0.5–5.5°, we assume that these effective sites were located in the rostral regions of the colliculus.
Saccades to 8° target steps
Changes in saccades to 8° target steps shared all the characteristics described for changes in saccades to 10° target steps: (1) Clear changes in movement endpoint were observed only for stimulation-coupled saccades. The endpoint shifted gradually during the stimulation session and remained nearly unchanged in the poststimulation session. When stimulation was stopped and the target was made visible, the elicited endpoint shift showed a gradual recovery over 300–400 saccades. The shift size ranged from 0.9° to 3.6° in 21 experiments in which either leftward or rightward saccades were paired with stimulation. Note that the shift size of >1.0° for saccades to 10° target steps was used as a criterion for “significant” effect in the present study. In only one experiment, the shift size for saccades to 8° target steps was <1.0° although that for saccades to 10° target steps was >1.0°. In this particular experiment, the endpoint shift for 8° steps was judged as a result of stimulation. (2) When both leftward and rightward saccades were coupled with SC stimulation, these saccades exhibited endpoint shifts in similar directions. There was a significant positive correlation between the shift direction for the leftward saccades and that for the rightward saccades (Fig. 11a) (Pearson's r = 0.91, p < 0.005 for left SC stimulation, and r = 0.96, p < 0.05 for right SC stimulation). The shift size for leftward saccades and that for rightward saccades were also positively correlated (data not shown). Again, the contraversive saccades exhibited slightly larger shifts than did the ipsiversive saccades (the regression line formula: y = 0.998x + 0.46; p for trend <0.005) (Fig. 11b). 3) Both the shift direction and size depended on the optimal vector for the SC stimulation site. There was a significant positive correlation between the direction of the endpoint shift and that of the optimal vector (Pearson's r = 0.69, p < 0.0005 for left SC stimulation, and r = 0.79, p < 0.001 for right SC stimulation) (Fig. 11c). In addition, the shift size for saccades to 8° target steps decreased as the amplitude of the optimal vector increased (Fig. 11d).
Figure 11.
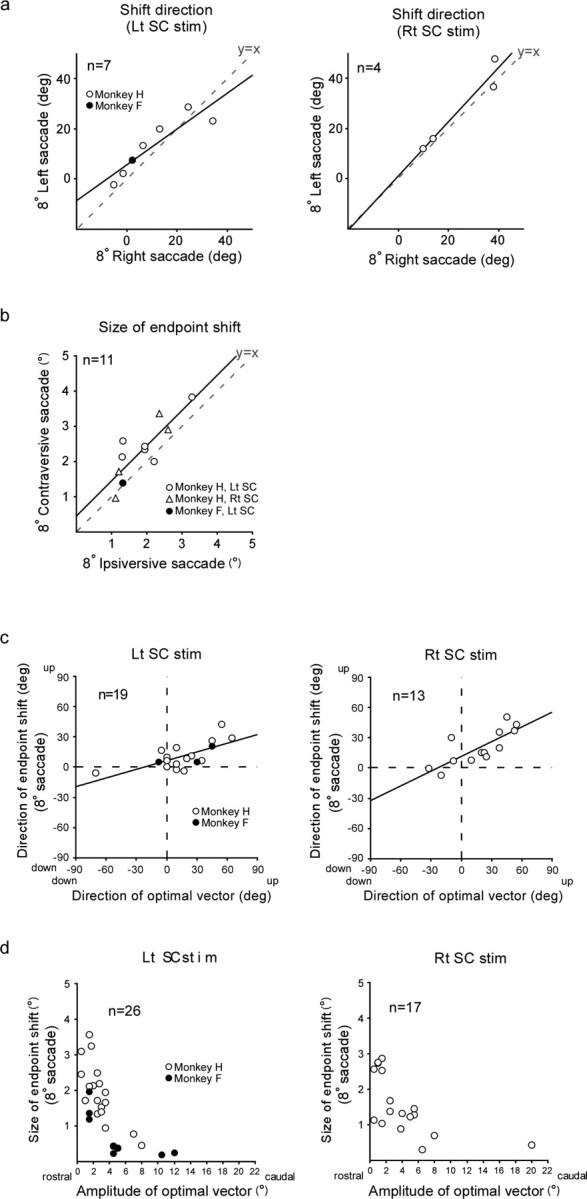
Characteristics of elicited endpoint shifts in saccades to 8° target steps. a, Relationship between the direction of the endpoint shift for leftward saccades (ordinate) and that for rightward saccades (abscissa). Same format as in Figure 9a. The regression line formula is y = 0.72x + 5.62, p for trend <0.005 for left SC stimulation, and y = 1.08x + 1.01, p for trend <0.05 for right SC stimulation (simple linear regression). b, Relationship between the size of the endpoint shift for contraversive saccades (ordinate) and that for ipsiversive saccades (abscissa). Same format as in Figure 9c. c, Relationship between the direction of the endpoint shift and that of the optimal vector for the SC stimulation site. Same format as in Figure 10a. The regression line formula is y = 0.29x + 6.51, p for trend <0.005 for left SC stimulation, and y = 0.49x + 11.60, p for trend <0.005 for right SC stimulation (simple linear regression). d, Relationship between the size of the endpoint shift and the amplitude of the optimal vector. Same format as in Figure 10b. Rt, Rightward; Lt, leftward; “deg” denotes shift direction and direction of optimal vector.
Comparison between 10° and 8° saccades
We examined how saccades to 8° target steps might differ from saccades to 10° steps. We plotted the shift direction for saccades to 8° steps (ordinate) against that for 10° steps (abscissa) (Fig. 12a). There was a highly significant and robust correlation between them (Pearson's r = 0.977, p < 0.0001 for left SC stimulation, and r = 0.998, p < 0.0001 for right SC stimulation). The regression line had a slope close to 1 (0.92 and 1.01 for left and right SC stimulation, respectively) and an intercept close to 0 deg (−0.59 deg and −0.37 deg for left and right SC stimulation, respectively), indicating that the endpoints of saccades to 10° and 8° steps shifted in very similar directions. Figure 12b shows the relation between the shift size for saccades to 8° steps (ordinate) and that for saccades to 10° steps (abscissa). There was a strong linear relation between them (Pearson's r = 0.987, p < 0.0001). It was noteworthy that the magnitude of endpoint shift for saccades to 8° steps was ∼80% of that for saccades to 10° steps as indicated by the slope (∼0.8) and the intercept (∼0°) of the regression line.
Figure 12.

Comparison between saccades to 8° target steps and those to 10° target steps. a, Relationship between the direction of the endpoint shift for saccades to 8° target steps (ordinate) and that for saccades to 10° target steps (abscissa), shown separately for left SC and right SC stimulation. The regression line formula is y = 0.92x – 0.59, p for trend <0.0001 for left SC stimulation, and y = 1.11x – 0.37, p for trend <0.0001 for right SC stimulation (simple linear regression). b, Relationship between the size of the endpoint shift for saccades to 8° target steps (ordinate) and that for saccades to 10° target steps (abscissa). The regression line formula is y = 0.85x – 0.06, p for trend <0.0001 (simple linear regression). Rt, Rightward; Lt, leftward.
Discussion
The present study shows that a marked change in saccade vector can be elicited by repeatedly pairing saccades with electrical stimulation of the deeper layers of the SC. The observed changes show characteristics similar to those of saccade adaptation induced by real visual error (Straube et al., 1997; Hopp and Fuchs, 2004). Endpoints of stimulation-coupled saccades exhibited a gradual course over several hundred saccades, with some saccade-to-saccade variability. The magnitude of the elicited changes is comparable to that of behavioral adaptation (Straube et al., 1997). The observed changes reflect neuronal plasticity because the movement endpoint, which had gradually shifted, remained nearly unchanged over ∼50 saccades after stimulation was stopped (Figs. 3, 4). Furthermore, when we stopped blanking the target, gradual recovery of the endpoint occurred over ∼300–400 saccades (Fig. 6). On the basis of these results, we suggest that the changes in movement vector were elicited by recruiting the adaptation mechanism and that electrical stimulation of the SC created a learning signal which in turn was transmitted to the site of adaptation. It remains to be investigated, however, whether the SC stimulation-induced change shares other characteristics of saccade adaptation induced by real visual error, in particular, spatial transfer to saccades of different sizes and directions (Noto et al., 1999) and the presence of an effective time window for visual error signals (Shafer et al. 2000).
Although the stimulation sites were not verified histologically, the following observations leave little doubt that the electrode tip was in the SC. First, consistent with the layered structure, neurons with visual response were encountered first and those with motor response appeared only after we moved the electrode further down by ∼0.5–1.5 mm. Second, these visual and movement cells had a receptive field and a movement field, respectively, in the contralateral visual hemifield. The optimal vectors for the receptive field and for the movement field were similar. Third, saccades were evoked with relatively low currents by electrical stimulation at sites where saccade-related burst activity was recorded. The vector of the evoked saccades was similar to the optimal vector of the movement field. Finally, the optimal vectors for the stimulation sites, when matched with penetration locations, are consistent with the known SC motor map (Sparks and Hartwich-Young, 1989) for both the left and right colliculi.
Representation of instructions for saccade adaptation in the SC
Our results suggest that the deeper layers of the primate superior colliculus have a capability to generate driving signals for motor learning. If so, what kind of instruction does the SC provide? In the current study, we found that SC stimulation elicited endpoint shifts in contralateral direction to the stimulated SC regardless of movement directions. When both leftward and rightward saccades were paired with stimulation of the same SC site, the shift directions for both leftward and rightward saccades were similar in two dimensions. These findings suggest that the deeper layers of the SC normally generate a signal that instructs the direction of adaptive shift in movement endpoint.
How is the instruction for shift direction represented in the SC? We attempted to address this question, taking advantage of the established motor map in the SC. Although our effective stimulation sites were in the rostral regions of both colliculi, a significant correlation was found between the direction of the endpoint shift and that of the stimulation site's optimal vector (Figs. 10a, 11c). Because different optimal vectors indicate different locations in the SC, the observed correlation further suggests that at least the direction of the endpoint shift that will occur in subsequent saccades may be place-coded in the SC deeper layers. The shift direction did not exactly match the direction of the optimal vector and was found to deviate from the optimal vector toward the horizontal direction (Figs. 10a, 11c). We currently do not have a plausible explanation for this finding.
Is the size of the endpoint shift also encoded as an SC location? When we compare the size of the observed endpoint shift with that of the optimal vector for the stimulation site, the shift size appears to drop when the vector size exceeds ∼5° (Figs. 10b, 11d). If the shift vector was place-coded in the SC, why did stimulation at sites representing errors >5° fail to elicit clear adaptation-like changes? Robinson et al. (2003) examined the effect of error size on saccade adaptation using errors whose size was fixed during adaptation. They found that errors <45% the size of the target step elicited average gain changes of ∼0.3–0.4, whereas error sizes >45% of the target step produced much lesser gain changes. Therefore, our data indicating the lack of clear endpoint shifts for sites representing >5° are consistent with this previous report since we used target steps of 8° and 10°. It should be noted that stimulation at a 9° site, for example, would have elicited a sizable endpoint shift if saccades to 25° target steps had been tested. Thus, our results are consistent with, if not strongly indicative of, the idea that an SC site generates a learning signal that instructs the adaptation system to compensate for movement error of a particular size and direction. Further studies using larger saccades are needed to address this issue.
Nature of a learning signal and its transmission pathway to the cerebellum
The nature of an instructive signal has been a controversial topic in motor learning (Kawato, 1996; Tseng et al., 2007). Is it a sensory error signal or a corrective motor signal that reaches the adaptation site and guides motor learning? For saccade adaptation, there has been behavioral evidence that adaptation takes place in the absence of corrective saccades (Wallman and Fuchs, 1998; Noto and Robinson, 2001). Consistent with these studies, our data show that a progressive endpoint shift could be elicited by SC stimulation that was subthreshold for evoking eye movements. This finding suggests that an overt motor signal, tightly coupled to saccade execution, does not serve as a saccade learning signal. However, these findings do not necessarily indicate that the learning signal is purely visual. For example, as speculated in a recent study (Soetedjo et al., 2008), the “quasi-visual” cells in the deeper layers of the SC (Mays and Sparks, 1980; Sparks and Hartwich-Young, 1989), which exhibit apparent visual response but encode saccadic motor error, might carry an instruction for adaptation.
If the SC normally issues an instructive signal for saccade adaptation and the oculomotor vermis serves as a learning site, then what pathway could bring the collicular signal to this particular part of the cerebellum? The deeper layers of the SC project to the contralateral nucleus reticularis tegmenti pontis, which in turn conveys saccade motor signals to the oculomotor vermis (Harting, 1977; Crandall and Keller, 1985; Yamada and Noda, 1987). The SC deeper layers also have a direct projection to subnucleus b of the medial accessory nucleus of the inferior olive, which houses neurons that send axons to the oculomotor vermis (Frankfurter et al., 1976; Yamada and Noda, 1987). This tecto-olivo-cerebellar pathway has been postulated to transmit a learning signal in modeling studies (Dean et al., 1994; Fujita, 2005) but its function remains to be defined. Recent recording studies have provided strong support for the olivary relay of learning signals (Soetedjo and Fuchs, 2006; Soetedjo et al., 2008). Climbing fiber responses of Purkinje cells in the oculomotor vermis carry error information during saccade adaptation. Specifically, the probability of complex spike occurrence depended on both error direction and size, and all error directions were represented in their sample.
The current results suggest a possibility that the SC deeper layers, long known to be a structure issuing a saccade motor command, may play a key role in motor learning as well. It should be noted, however, that electrical stimulation could activate a variety of neural elements near a stimulation site, including afferent fibers originating from cells outside the SC. The possibility cannot be excluded that activation of noncollicular neurons might have somehow resulted in the adaptation-like changes we observed. More evidence is needed to conclude that the SC normally sends out a saccade learning signal that drives adaptation.
Footnotes
This work was supported by the 21st Century Center of Excellence program (Promotion of Kansei Science) and Grants-in-Aid (16300129 to K.Y., 20500353 to Y.I.) from the Japanese government. We thank Masahiko Fujita for valuable discussion on the data, Kozo Kobayashi for building laboratory facilities, and the veterinary staff at the Tsukuba Primate Research Center for their help in surgery and daily care of the animals. We are grateful to F. Miyamasu for her grammatical revision of this manuscript.
References
- Barash S, Melikyan A, Sivakov A, Zhang M, Glickstein M, Thier P. Saccadic dysmetria and adaptation after lesions of the cerebellar cortex. J Neurosci. 1999;19:10931–10939. doi: 10.1523/JNEUROSCI.19-24-10931.1999. [DOI] [PMC free article] [PubMed] [Google Scholar]
- Brodal P, Brodal A. The olivocerebellar projection in the monkey. Experimental studies with the method of retrograde tracing of horseradish peroxidase. J Comp Neurol. 1981;201:375–393. doi: 10.1002/cne.902010306. [DOI] [PubMed] [Google Scholar]
- Brodal P, Brodal A. Further observations on the olivocerebellar projection in the monkey. Exp Brain Res. 1982;45:71–83. doi: 10.1007/BF00235764. [DOI] [PubMed] [Google Scholar]
- Crandall WF, Keller EL. Visual and oculomotor signals in nucleus reticularis tegmenti pontis in alert monkey. J Neurophysiol. 1985;54:1326–1345. doi: 10.1152/jn.1985.54.5.1326. [DOI] [PubMed] [Google Scholar]
- Dean P, Mayhew JEW, Langdon P. Learning and maintaining saccadic accuracy: a model of brainstem-cerebellar interactions. J Cogn Neurosci. 1994;6:117–138. doi: 10.1162/jocn.1994.6.2.117. [DOI] [PubMed] [Google Scholar]
- Frankfurter A, Weber JT, Royce GJ, Strominger NL, Harting JK. An autoradiographic analysis of the tecto-olivary projection in primates. Brain Res. 1976;118:245–257. doi: 10.1016/0006-8993(76)90710-1. [DOI] [PubMed] [Google Scholar]
- Fuchs AF, Robinson DA. A method for measuring horizontal and vertical eye movement chronically in the monkey. J Appl Physiol. 1966;21:1068–1070. doi: 10.1152/jappl.1966.21.3.1068. [DOI] [PubMed] [Google Scholar]
- Fujita M. Feed-forward associative learning for volitional movement control. Neurosci Res. 2005;52:153–165. doi: 10.1016/j.neures.2005.02.006. [DOI] [PubMed] [Google Scholar]
- Fujita M, Amagai A, Minakawa F, Aoki M. Selective and delay adaptation of human saccades. Brain Res Cogn Brain Res. 2002;13:41–52. doi: 10.1016/s0926-6410(01)00088-x. [DOI] [PubMed] [Google Scholar]
- Harting JK. Descending pathways from the superior collicullus: an autoradiographic analysis in the rhesus monkey (Macaca mulatta) J Comp Neurol. 1977;173:583–612. doi: 10.1002/cne.901730311. [DOI] [PubMed] [Google Scholar]
- Hopp JJ, Fuchs AF. The characteristics and neuronal substrate of saccadic eye movement plasticity. Prog Neurobiol. 2004;72:27–53. doi: 10.1016/j.pneurobio.2003.12.002. [DOI] [PubMed] [Google Scholar]
- Kawato M. Learning internal models of the motor apparatus. In: Bloedel JR, Ebner TJ, Wise SP, editors. The acquisition of motor behaviors in vertebrates. Cambridge, MA: MIT; 1996. pp. 409–430. [Google Scholar]
- Kojima Y, Yoshida K, Iwamoto Y. Microstimulation of the midbrain tegmentum creates learning signals for saccade adaptation. J Neurosci. 2007;27:3759–3767. doi: 10.1523/JNEUROSCI.4958-06.2007. [DOI] [PMC free article] [PubMed] [Google Scholar]
- Mays LE, Sparks DL. Dissociation of visual and saccade-related responses in superior colliculus neurons. J Neurophysiol. 1980;43:207–232. doi: 10.1152/jn.1980.43.1.207. [DOI] [PubMed] [Google Scholar]
- Moschovakis AK, Karabelas AB, Highstein SM. Structure-function relationship in the primate superior SC. I. Morphological classification of efferent neurons. J Neurophysiol. 1988;60:232–262. doi: 10.1152/jn.1988.60.1.232. [DOI] [PubMed] [Google Scholar]
- Noto CT, Robinson FR. Visual error is the stimulus for saccade gain adaptation. Brain Res Cogn Brain Res. 2001;12:301–305. doi: 10.1016/s0926-6410(01)00062-3. [DOI] [PubMed] [Google Scholar]
- Noto CT, Watanabe S, Fuchs AF. Characteristics of simian adaptation fields produced by behavioral changes in saccade size and direction. J Neurophysiol. 1999;81:2798–2813. doi: 10.1152/jn.1999.81.6.2798. [DOI] [PubMed] [Google Scholar]
- Robinson DA. Eye movements evoked by collicular stimulation in the alert monkey. Vision Res. 1972;12:1795–1808. doi: 10.1016/0042-6989(72)90070-3. [DOI] [PubMed] [Google Scholar]
- Robinson FR, Noto CT. Role of the cerebellar oculomotor vermis in saccade adaptation. Soc Neurosci. 2005 Abstr 31.986.984. [Google Scholar]
- Robinson FR, Fuchs AF, Noto CT. Cerebellar influences on saccade plasticity. Ann N Y Acad Sci. 2002;956:155–163. doi: 10.1111/j.1749-6632.2002.tb02816.x. [DOI] [PubMed] [Google Scholar]
- Robinson FR, Noto CT, Bevans SE. Effect of visual error size on saccade adaptation in monkey. J Neurophysiol. 2003;90:1235–1244. doi: 10.1152/jn.00656.2002. [DOI] [PubMed] [Google Scholar]
- Scudder CA, Kaneko CS, Fuchs AF. The brainstem burst generator for saccadic eye movements: a modern synthesis. Exp Brain Res. 2002;142:439–462. doi: 10.1007/s00221-001-0912-9. [DOI] [PubMed] [Google Scholar]
- Shafer JL, Noto CT, Fuchs AF. Temporal characteristics of error signals driving saccadic gain adaptation in the macaque monkey. J Neurophysiol. 2000;84:88–95. doi: 10.1152/jn.2000.84.1.88. [DOI] [PubMed] [Google Scholar]
- Soetedjo R, Fuchs AF. Complex spike activity of Purkinje cells in the oculomotor vermis during behavioral adaptation of monkey saccades. J Neurosci. 2006;26:7741–7755. doi: 10.1523/JNEUROSCI.4658-05.2006. [DOI] [PMC free article] [PubMed] [Google Scholar]
- Soetedjo R, Kojima Y, Fuchs AF. Complex spike activity in the oculomotor vermis of the cerebellum: a vectorial error signal for saccade motor learning? J Neurophysiol. 2008;100:1949–1966. doi: 10.1152/jn.90526.2008. [DOI] [PMC free article] [PubMed] [Google Scholar]
- Sparks DL, Hartwich-Young R. The deep layers of the superior SC. In: Wurtz RH, Goldberg ME, editors. The neurobiology of saccadic eye movements. Amsterdam: Elsevier; 1989. pp. 213–255. [Google Scholar]
- Straube A, Fuchs AF, Usher S, Robinson FR. Characteristics of saccadic gain adaptation in rhesus macaques. J Neurophysiol. 1997;77:874–895. doi: 10.1152/jn.1997.77.2.874. [DOI] [PubMed] [Google Scholar]
- Tseng YW, Diedrichsen J, Krakauer JW, Shadmehr R, Bastian AJ. Sensory prediction errors drive cerebellum-dependent adaptation of reaching. J Neurophysiol. 2007;98:54–62. doi: 10.1152/jn.00266.2007. [DOI] [PubMed] [Google Scholar]
- Wallman J, Fuchs AF. Saccadic gain modification: visual error drives motor adaptation. J Neurophysiol. 1998;80:2405–2416. doi: 10.1152/jn.1998.80.5.2405. [DOI] [PubMed] [Google Scholar]
- Yamada J, Noda H. Afferent and efferent connections of the oculomotor cerebellar vermis in the macaque monkey. J Comp Neurol. 1987;265:224–241. doi: 10.1002/cne.902650207. [DOI] [PubMed] [Google Scholar]