

Abstract
The core molecular clockwork in the suprachiasmatic nucleus (SCN) is based on autoregulatory feedback loops of transcriptional activators (CLOCK/NPAS2 and BMAL1) and inhibitors (mPER1–2 and mCRY1–2). To synchronize the phase of the molecular clockwork to the environmental day and night condition, light at dusk and dawn increases mPer expression. However, the signal transduction pathways differ remarkably between the day/night and the night/day transition. Light during early night leads to intracellular Ca2+ release by neuronal ryanodine receptors (RyRs), resulting in phase delays. Light during late night triggers an increase in guanylyl cyclase activity, resulting in phase advances. To date, it is still unknown how the core molecular clockwork regulates the availability of the respective input pathway components. Therefore, we examined light resetting mechanisms in mice with an impaired molecular clockwork (BMAL1−/−) and the corresponding wild type (BMAL1+/+) using in situ hybridization, real-time PCR, immunohistochemistry, and a luciferase reporter system. In addition, intracellular calcium concentrations (Ca2+i) were measured in SCN slices using two-photon microscopy. In the SCN of BMAL1−/− mice Ryr mRNA and RyR protein levels were reduced, and light-induced mPer expression was selectively impaired during early night. Transcription assays with NIH3T3 fibroblasts showed that Ryr expression was activated by CLOCK::BMAL1 and inhibited by mCRY1. The Ca2+i response of SCN cells to the RyR agonist caffeine was reduced in BMAL1−/− compared with BMAL1+/+ mice. Our findings provide the first evidence that the mammalian molecular clockwork influences Ryr expression and thus controls its own photic input pathway components.
Introduction
Biological rhythms in mammals are controlled by a endogenous rhythm generator located in the suprachiasmatic nucleus (SCN). The molecular clockwork within the SCN consists of autoregulatory feedback loops of clock genes (Reppert and Weaver, 2002). The basic helix–loop–helix (bHLH) transcription factors CLOCK/NPAS2 and BMAL1 activate the transcription of Per1–2 and Cry1–2 and of clock-controlled genes during midday through E-box (like) enhancer elements (Jin et al., 1999; DeBruyne et al., 2007). The transcriptional repressors PER and CRY accumulate during early night and inhibit CLOCK/NPAS2:BMAL1-mediated transcription. The circadian cycle starts again as PER1 and CRY are degraded during late night (Reppert and Weaver, 2002).
Under natural conditions, phase and period length of the molecular clockwork is entrained to the environmental day/night cycle by light. This entrainment is essential to normal physiology because long-term internal temporal desynchronization causes sleep disorders and chronic illnesses, such as cardiovascular disease, metabolic syndrome, and cancer (Hastings et al., 2003). Light during early or late night is a strong stimulus for delaying or advancing the phase of the molecular clockwork, respectively (Reppert and Weaver, 2002). Light information is transmitted to the SCN by glutamate release from specialized retinal ganglion cells projecting into the SCN (Reppert and Weaver, 2002). In turn, the activation of glutamate receptors during early night triggers activation of ryanodine receptors (RyRs), whereas the activation of glutamate receptors during late night leads to an increase in guanylyl cyclase activity (Ding et al., 1998; Gillette and Mitchell, 2002). Both resetting mechanisms converge to the phosphorylation of the transcription factor Ca2+/cAMP-responsive element binding protein (CREB) (Gau et al., 2002), which activates the expression of mPer1 and mPer2 in the SCN (Albrecht et al., 1997; Shearman et al., 1997; Gau et al., 2002) by binding to CREs in their promoter regions (Travnickova-Bendova et al., 2002). In addition, the mitogen-activated protein kinase pathway is also activated by nocturnal light pulses (Obrietan et al., 1998), and the extracellular signal-regulated kinase is involved in photic activation of mPer1 promoter activity (Nomura et al., 2006). The photic induction of Per expression is crucial for the daily adjustment of the endogenous rhythm of the molecular clockwork because light during early night delays the rhythm by activating Per in its declining phase, whereas light during late night leads to a precocious increase in Per expression, resulting in a phase advance (Hastings et al., 2003).
Light-induced mPer expression during early night is impaired in Clock mutant mice (Shearman and Weaver, 1999), indicating that CLOCK is involved in the SCN responsiveness to photic input. However, it is unknown how the molecular clockwork influences signal transduction pathways of the photic entrainment. To address this question, we compared light resetting mechanisms during early and late night in the SCN of mice with an impaired molecular clockwork (BMAL1−/−) (Bunger et al., 2000) with the corresponding wild-type (BMAL1+/+) mice. Notably, BMAL1−/− mice are behaviorally arrhythmic in constant darkness, do not show circadian rhythms in mPer mRNA levels (Bunger et al., 2000), and also lack nuclear CLOCK protein (Kondratov et al., 2003).
Materials and Methods
Animals.
All experiments with animals reported in this manuscript were conducted in accordance with the policy on the use of Animals in Neuroscience Research and the Policy on Ethics as approved by the Society for Neuroscience and by the European Communities Council Directive (89/609 EEC).
BMAL1-deficient mice (BMAL1−/−) and wild-type littermates (BMAL1+/+) were obtained by breeding BMAL1+/− mice (generously provided by C. Bradfield, University of Wisconsin Medical School, Madison, WI) in our animal facility, and the genotype was confirmed as described previously (Bunger et al., 2000). Mice (8–12 weeks old) were housed in individual cages equipped with infrared detectors (Mouse-E-Motion) at constant room temperature with food and water available ad libitum. Locomotor activity was recorded continuously in 6 min intervals. Actograms, activity onset, and χ2 periodograms were analyzed using Clocklab software (Actimetrics). Mice were adapted to a 12 h light (L)/dark(D) [light phase, 230 μW/cm2; dark phase (dim red light), <5 μW/cm2] for at least 2 weeks before experimentation with access to food and water ad libitum. Lights off was defined as Zeitgeber time 12 (ZT12). For analysis of locomotor activity rhythms, mice were kept for another 6 d in 12 h LD and then transferred to constant darkness (DD) for 10 d (n = 4 animals of each genotype). For analysis of diurnal rhythms of mPer1 and mPer2 in the SCN, BMAL1−/− and BMAL1+/+ mice were killed every 4 h during the light phase (ZT02, ZT06, and ZT10) or during the dark phase (ZT14, ZT18, and ZT22) (n = 3 animals of each genotype per time point). For light pulse experiments in LD, animals were exposed to a light pulse (300 μW/cm2) in the early night at ZT14 or in the late night at ZT22. For light pulse experiments during mid-subjective day [circadian time 6 (CT06)] in DD, animals were kept for 12 h in L and for 42 h in D and then exposed to a light pulse (300 μW/cm2). Two hours after the respective light pulses, animals were killed by decapitation (n = 5 animals of each genotype per time point). Brains were removed and immediately frozen at −80°C for in situ hybridization. Control mice were handled similarly but without light exposure.
For RNA isolation, animals were kept under the previously described 12 h light/dark regimen. One day before the experiments, mice were kept under constant red dim light. Animals were killed at CT02, CT06, CT10, CT14, CT18, and CT22. CT00 is defined as lights on in the previous LD schedule. Brains were removed and hypothalamic slices were cut on a vibratome. The SCN region was punched out bilaterally using a gauge needle with an inner diameter of 200 μm. Successful dissection of the SCN was verified by cutting the slices into sections of 14 μm thickness that were stained with hematoxylin. The tissue was immediately frozen and kept at −80°C until additional use.
For immunohistochemistry, animals were anesthetized (chloral hydrate, 360 mg/kg body weight; Sigma) and transcardially perfused with sodium chloride solution (0.9%) for 1 min, followed by 4% paraformaldehyde in 0.02 m PBS for 3 min. The tissue was postfixed in 4% paraformaldehyde for 2 h and cryoprotected with 20% sucrose.
In situ hybridization.
Probes were made by terminal transferation of [α-33P]dATP (100 μCi; Hartmann Analytic) onto 45mer oligo probe (see below) according to the instructions of the manufacturer (Invitrogen): mPer1 antisense, 5′-TGCTTGTATGGCTGCTCTGACTGCTGCGGGTGATGCTGGCTGAGG-3′; mPer1 sense, 5′-CCTCAGCCAGCATCACCCGCAGCAGTCAGAGCAGCCATACAAGCA-3′; mPer2 antisense, 5′-GCTCCTTCAGGGTCCTTATCAGTTCTTTGTGTGCGTCAGCTTTGG-3′; mPer2 sense, 5′-CCAAAGCTGACGCACACAAAGAACTGATAAGGACCCTGAAGGAGC-3′.
Brains were cut in a cryostat into coronal, 14-μm-thick sections. Slides were fixed with 4% paraformaldehyde for 30 min and deproteinated with 0.2 N HCl, and unspecific binding sides were blocked by use of 0.1 m triethanolamine and 0.25% acetic anhydride. Slides were hybridized with 75 μl of hybridization buffer containing 50% deionized formamide, 0.03 m Tris HCl, pH 8, 0.2 mg/ml yeast tRNA, 1× Denhardt's solution, 0.6 m NaCl, 0.25% SDS, 250 μm EDTA, pH 8, and probe at a concentration of 6 × 10⁵ cpm/ml at 42°C overnight. Subsequently, sections were washed with a final stringency of 0.1× SSC for two times for 30 min at 55°C and exposed to x-ray film (Kodak BioMax MR; Sigma). Sections were stained with hematoxylin to confirm the presence of the SCN. No signals could be observed in sections incubated with the sense probes for either mPer1 or mPer2 (data not shown). A light pulse at ZT10 did not induce Per1 or Per2 mRNA in either BMAL1+/+ or BMAL1−/− mice (data not shown). Densitometry was performed as described previously (Jilg et al., 2005).
Quantitative real-time PCR.
SCN tissue (n = 4 per time point) was homogenized, and total RNA was isolated using TRI Reagent (Sigma). Total RNA (∼1 μg) was reverse transcribed using iScript Select cDNA Synthesis kit (Bio-Rad) according to the instructions of the manufacturer. Two microliters of cDNA of the 20 μl of reaction volume were used for real-time PCR. Real-time PCR reactions were performed using a MyiQ cycler (Bio-Rad) and a SYBRGreen PCR kit (Bio-Rad). Primers used for Ryr1, Ryr2, and Hprt are given with their base pair number [forward (F); reverse (R)] and were designed with the help of Primer3 software, based on reported mouse sequences in GenBank (accession numbers given in brackets): Ryr1 (X83932), F, 1102–1122, 5′-CCG GCG ATG AAT ATG AAC TT- 3′; R, 1195–1215, 5′-GCT CCC CAA AAG CAT CAA TA-3′; Ryr2 (X83933), F, 2303–2323, 5′-CAC AAC CTG GCC AAC TAC CT-3′; R, 2404–2424, 5′-GGG AAA AAT TCC CAA CAC CT-3′; Hprt (BC004686.1), F, 76–94: 5′-TCC CAG CGT CGT GAT TAG C-3′; R, 203–226, 5′-CTT′CAT GAC ATC TCG AGC AAG TCT-3′.
Each PCR reaction contained SYBRGreen PCR Mix, 2 μl of reverse transcription cDNA template or standard cDNA, and 0.3 μm forward and reverse primer each. The initial denaturation (5 min) was followed by 40 amplification cycles of 15 s denaturation at 95°C, 1 min annealing, and elongation at 56°C. To ensure the specificity of the PCR amplicons, a melting curve analysis was performed as a last step of the PCR reaction. As expected, the melting curve analysis revealed a single peak for each PCR product (data not shown). Additionally, the specificity of the PCR reaction was controlled by separation of PCR products on ethidium bromide-stained 2% agarose gels, and single bands with the expected molecular sizes of 113 bp (Ryr1), 121 bp (Ryr2), and 150 bp (mHprt) were seen for each transcript (data not shown). Hprt served as internal control. Quantitative calculations of the initial number of mRNA molecules in each sample for each investigated gene in each PCR experiment was performed by using serial dilution standards with a known number of molecules (between 107 and 103). Standards for each investigated gene were made from their PCR products, which were cleaned and extracted from agarose gel. Samples were measured in duplicate and obtained values averaged. Data analysis was performed using the 2(−ΔΔC(T)) method with the supplied Genex program (Bio-Rad).
Immunohistochemistry.
Brains of BMAL1−/− and BMAL1+/+ mice killed at ZT00, ZT06, ZT12, and ZT18 were cut in a cryostat into coronal, 14-μm-thick sections. Immunohistochemistry was performed with a primary anti-ryanodine receptor antibody (ab2868; Abcam) in a dilution of 1:100. This antibody detects both RyR1 and RyR2 isoforms (Airey et al., 1990). Immunoreaction (IR) was visualized by using a standard avidin–biotin labeling method, with diaminobenzidine as the chromogen (Jilg et al., 2005). Omission of the first antibody was used to rule out false positives, e.g., stained sites that appear as a result of a reaction with components of the immunohistochemical procedure other than the primary antibody.
Quantitative analysis of IR was accomplished using NIH ImageJ software in a blind manner. The relative optical density of nonspecific background staining in neuropil areas devoid of cell nuclei was used to define a threshold that was kept constant for all analyses. The measurement for the area of IR above background was determined, and the data are expressed as percentage of the total area of one SCN or one supraoptic nucleus (SON), respectively. Four SCN/SON sections per mouse were analyzed for each genotype and time point and averaged to give a single value for each animal.
DNA constructs.
The Ryr2 promoter regions (see Fig. 2c) were amplified by PCR from genomic DNA isolated from the mice tail. The Ryr2 regions spans from −765 to −104 (+1 being the putative transcription start site) and was chosen based on promoter studies of the rabbit Ryr2 gene (Nishida et al., 1996). A functional analysis of the Ryr2 promoter was performed using the following truncated Ryr2 promoter constructs: Mut1 (−632 to −104), Mut2 (−523 to −104), and Mut3 (−409 to −104). The Ryr2 XhoI/SpeI fragments were cloned into the pGL4.10-Basic luciferase reporter vector (Promega) and verified by sequencing.
Figure 2.
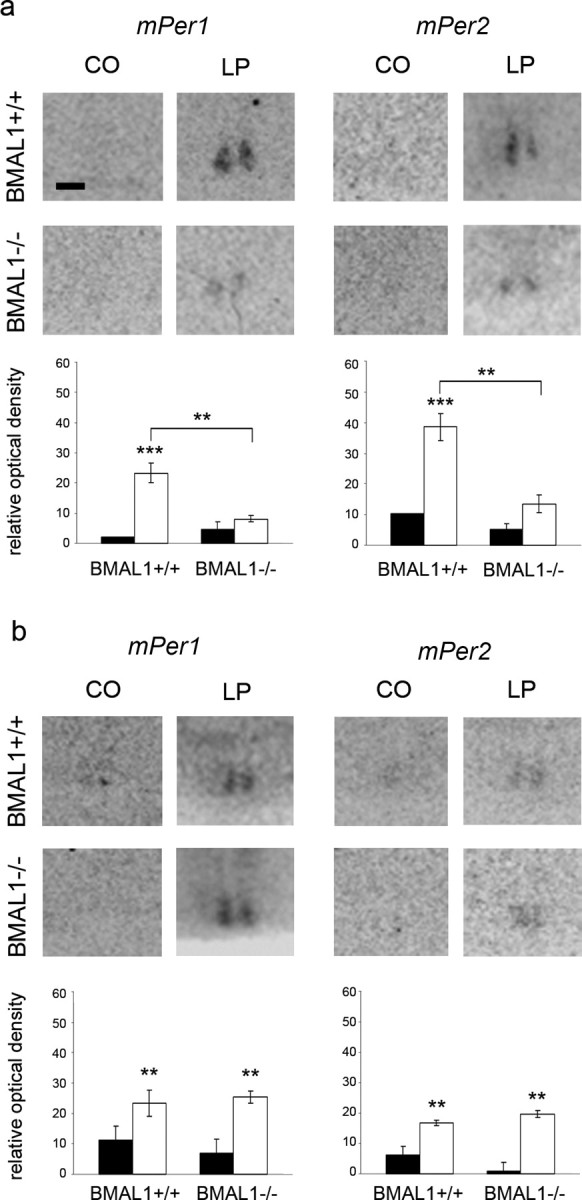
Diurnal rhythm of mPer and effect of light at CT06 on mPer expression in the SCN of BMAL1+/+ and BMAL1−/− mice. a, Diurnal rhythm of mPer1 and mPer2 in the SCN of BMAL1+/+ and BMAL1−/− mice. Scale bar, 400 μm. Symbols represent mean ± SEM relative optical density of Per in situ hybridization signals within the SCN (n = 3). KO, Knock-out; WT, wild type. *p = 0.05; **p = 0.01; ***p = 0.001. b, mPer1 and mPer2 mRNA levels in the SCN of BMAL1+/+ and BMAL1−/− mice 2 h after a 15 min light pulse (LP) or dark control (CO) in the middle of the subjective day (CT06) determined by in situ hybridization. Top, Representative autoradiographs of the SCN region. Scale bar, 200 μm. Bottom, Black (CO) and white (LP) bars represent mean ± SEM relative optical density of Per in situ hybridization signals within the SCN (n = 5). **p < 0.01; ***p < 0.001.
Cell culture and transient transfections.
NIH3T3 fibroblasts were grown in DMEM supplemented with 10% FCS. For transfections, Lipofecamine 2000 (Invitrogen) was used according to the protocol of the manufacturer. Cells were plated the day before transfection at 2 × 10⁵ cells per 35 mm Petri dish and transfected with 0.15 μg of reporter plasmid and with 1 μg of Clock, Bmal1, and mCry1 pcDNA3.1 expression plasmids (kindly provided by D. R. Weaver, University of Massachusetts Medical School, Worchester, MA) (Jin et al., 1999). The total amount of DNA per dish was adjusted to 4 μg by adding pcDNA 3.1 (+) vector as carrier. At 48 h after transfection, the medium was replaced with new medium containing 0.1 mm luciferin (Promega). Bioluminescence of living cells was measured using GloMax 20/20 Luminometer (Promega).
Two-photon calcium imaging in acute slices.
Calcium imaging was performed in acute slices from a total of 14 adult mice (BMAL1+/+, n = 7; BMAL1−/−, n = 7). Animals were kept in a 12 h light/dark cycle before the experiments and killed within 1 h before lights off (ZT12).
Animals were killed by an intraperitoneal injection of pentobarbital (Narcoren, 750 mg/kg bodyweight) and immediately perfused transcardially with ice-cold sucrose–artificial CSF (ACSF) (in mm: 75 NaCl, 25 NaHCO3, 1.25 NaH2PO4, 4 KCl, 25 glucose, 100 sucrose, 0.5 CaCl, and 3 MgCl) maintained at pH 7.4 by carbogen bubbling (sucrose–ACSF according to Aghajanian and Rasmussen, 1989). Brains were dissected, and coronal sections (400 μm) were cut on a vibratome (VT 1000S; Leica). For sectioning and subsequent storage of slices, we used sucrose–ACSF. After sectioning, slices were warmed to 35°C for 45 min and subsequently stored at room temperature.
Slices were bulk loaded with AM of the calcium indicator Oregon Green-BAPTA-1 (OGB1) (Invitrogen) according to the method described by Garaschuk et al. (2006). For dye injection, slices were transferred to a porous membrane (Millicell-CM; Millipore) at an ACSF/carbogen interface and mounted on the stage of an upright microscope. OGB1-AM was dissolved in DMSO containing 20% Pluronic F-127 at a concentration of 10 mm and further diluted with buffered saline (in mm: 150 NaCl, 2.5 KCl, and 10 HEPES, pH 7.4) to give a final concentration of 1 mm. Pressure injection of the dye was achieved by loading the tip of a microelectrode (5 μm tip diameter) with 2 μl of dye solution, lowering the electrode dorsolateral to the SCN with a manual micromanipulator and ejecting the dye for a period of 1 min by applying pressure (0.1–0.3 bar) to the electrode. Subsequently, slices were maintained in a submerged-type chamber for at least 1 h before starting the imaging procedure.
For calcium imaging, slices were transferred to a submerged-type chamber mounted on the stage of a two-photon microscope and continuously superfused (2 ml/min) with warmed ACSF [in mm: 125 NaCl, 25 NaHCO3, 1.25 NaH2PO4, 2.5 KCl, 25 glucose, 2 CaCl, and 1 MgCl, pH 7.4 (32°C)]. Two-photon laser microscopy was performed by coupling the beam of a mode-locked titanium:sapphire laser (MaiTai; Spectra Physics) into a movable objective microscope (MOM) (Sutter Instruments) as described previously (Denk and Detwiler, 1999). The excitation path of the microscope consisted of a pair of galvanometer mirrors (Cambridge Technology), a scan lens, and a tube lens projecting the scanning beam to the back aperture of a 20× water-immersion objective (Olympus XLUMPFL W IR; 0.95 numerical aperture). The fluorescence emission was deflected by a dichroic filter to a detection path consisting of lenses focusing the back aperture of the objective onto a photomultiplier (R6357; Hamamatsu) detecting the emission spectrum of OGB1 (510/50 bandpass; Chroma Technology). Center wavelengths of the laser beam were set to 805 nm. Laser intensity was attenuated to 50–70 mW as measured at the entrance port of the microscope.
Laser scanning and data acquisition were controlled with MPScope software (Nguyen et al., 2006) and analyzed offline using NIH ImageJ (Rasband, 2008). Data acquisition was performed at a rate of 3 Hz with a resolution of 512 × 512 pixels, covering a maximum area of 400 × 400 μm. Analysis included calculation of averaged fluorescence over selected time periods (f), normalization of fluorescence emission by subtracting and dividing the data by the baseline fluorescence averaged over a baseline period (Δf/f = dff), and evaluation of the time course of fluorescence intensities in selected regions of interest.
Rapid drug application was performed via two cannulas placed lateral of the front optics of the water-immersion objective. Glutamate (100 μm; Sigma), caffeine (10 mm; Sigma), or ryanodine (50 μm; Tocris Cookson) were diluted in ACSF and applied into the ACSF superfusion stream at a rate of 0.5 ml/min. Osmolarity of the caffeine solution was adjusted by omitting an isomolar amount of glucose from the ASCF.
Statistical analysis.
Values are reported as means ± SEM. All datasets were analyzed for statistically significant differences by BIAS (version 8.6.3; Epsilon) using one-way ANOVA with Bonferroni's multiple comparison test, if not indicated otherwise. Values were considered significantly different with p < 0.05.
Results
Both BMAL1+/+ and BMAL1−/− mice kept in LD showed low locomotor activity during the light phase (masking) and high locomotor activity during the dark phase (supplemental Fig. 1, available at www.jneurosci.org as supplemental material). There was no significant difference in the period length of the locomotor activity rhythm between BMAL1+/+ (24 ± 0.05 h) and BMAL1−/− (23.975 ± 0.06 h) mice (unpaired t test) in LD. In DD, BMAL1+/+ mice expressed robust circadian rhythms of locomotor activity with a period length of 23.625 ± 0.02 h. In contrast, BMAL1−/− mice showed no circadian rhythm of locomotor activity in DD (supplemental Fig. 1, available at www.jneurosci.org as supplemental material) as it has also been shown previously (Bunger et al., 2000).
To test whether the molecular clockwork influences signal transduction pathways of the photic entrainment, we analyzed mPer1 and mPer2 mRNA levels 2 h after 15 min light pulses or dark controls during early night (ZT14), late night (ZT22), or during mid-subjective day (CT06) in the SCN of wild-type (BMAL1+/+) and BMAL1−/− mice by in situ hybridization.
During early night (ZT14), there was a significant difference in the levels of mPer1 (F(3,16) = 20.9; p < 0.0001) and mPer2 (F(3,16) = 40.9; p < 0.0001) mRNA between the SCN of BMAL1+/+ and BMAL1−/− treated with a 15 min light pulse or just handled (control). A light pulse during early night resulted in a significant increase in mPer1 (p < 0.001) and mPer2 (p < 0.001) mRNA levels in the SCN of BMAL1+/+ mice compared with controls (Fig. 1a). This is consistent with previous studies (Albrecht et al., 1997; Shearman et al., 1997). In contrast, this light pulse did not induce a significant increase in mPer1 and mPer2 mRNA levels in the SCN of BMAL1−/− mice compared with controls (Fig. 1a). Two-way ANOVA revealed a strong effect of light on mPer1 (F(1,16) = 35.41; p < 0.0001) and on mPer2 (F(1,16) = 74.6; p = 0.0001), a strong effect of genotype on mPer1 (F(1,16) = 9.4; p = 0.007) and on mPer2 (F(1,16) = 69.2; p < 0.0001), and a strong interaction between genotype and light treatment for mPer1 (F(1,16) = 18.1; p = 0.006) and for mPer2 (F(1,16) = 40.7; p < 0.0001).
Figure 1.
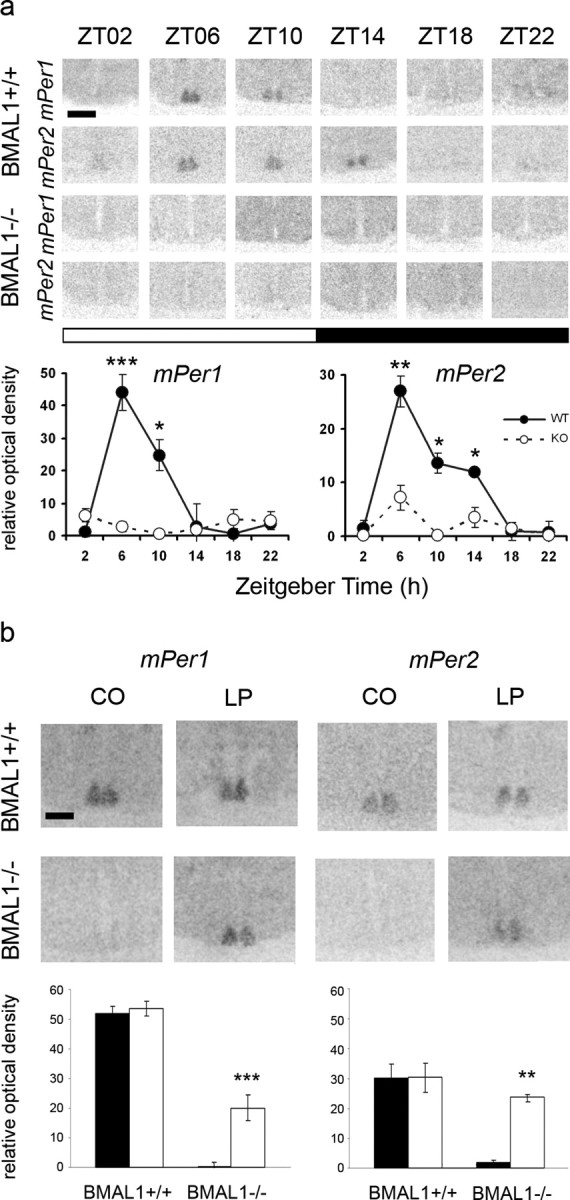
mPer1 and mPer2 mRNA levels in the SCN of BMAL1+/+ and BMAL1−/− mice 2 h after a 15 min light pulse (LP) or dark control (CO) in the early (ZT14) (a) or the late (ZT22) (b) night determined by in situ hybridization. Top, Representative autoradiographs of the SCN region. Scale bar, 200 μm. Bottom, Black (CO) and white (LP) bars represent mean ± SEM relative optical density of Per in situ hybridization signals within the SCN (n = 5). **p < 0.01; ***p < 0.001.
During late night (ZT22), there was a significant difference in the levels of mPer1 (F(3,16) = 19.3; p < 0.0001) and mPer2 (F(3,16) = 20.9; p < 0.0001) mRNA between the SCN of BMAL1+/+ and BMAL1−/− treated with a 15 min light pulse or just handled (control). A light pulse during late night resulted in a significant increase in mPer1 (p < 0.01) and mPer2 (p < 0.01) mRNA levels in the SCN of BMAL1+/+ mice compared with controls (Fig. 1b). Importantly, this light pulse resulted also in a significant increase of mPer1 (p < 0.01) and mPer2 (p < 0.01) mRNA levels in the SCN of BMAL1−/− mice compared with controls (Fig. 1b). Two-way ANOVA revealed a strong effect of light on mPer1 (F(1,16) = 38.3; p < 0.0001) and on mPer2 (F(1,16) = 52.1; p < 0.0001), but no effect of genotype on mPer1 or mPer2 and no interaction between genotype and light treatment for mPer1 or mPer2.
In the SCN of BMAL1+/+ mice, mPer1 (F(5,12) = 15.4; p < 0.0001) and mPer2 (F(5,12) = 9.9; p = 0.0006) showed a diurnal rhythm (Fig. 2a). Levels of mPer1 mRNA were significantly elevated at ZT06 (p < 0.001) and ZT10 (p < 0.05) compared with any night time point. Levels of mPer2 mRNA were elevated at ZT06 (p < 0.01), ZT10 (p < 0.05), and ZT14 (p < 0.05) compared with ZT18, ZT22, or ZT02. In contrast, in the SCN of BMAL1−/− mice, levels of mPer1 and mPer2 were constitutively low (Fig. 2a) as it has also been shown previously (Bunger et al., 2000). Two-way ANOVA revealed a strong effect of Zeitgeber time on mPer1 (F(5,24) = 11.3; p < 0.0001) and on mPer2 (F(5,24) = 10.3; p < 0.001), a strong effect of genotype on mPer1 (F(5,24) = 21.6; p = 0.0001) and on mPer2 (F(5,24) = 19.2; p = 0.0002) and a strong interaction between Zeitgeber time and genotype for mPer1 (F(5,24) = 14.8; p < 0.0001) and for mPer2 (F(5,24) = 4.2; p = 0.007).
During mid-subjective day (after 42 h of darkness, CT06), there was a significant difference in the levels of mPer1 (F(3,8) = 16.8; p = 0.0008) and mPer2 (F(3,8) = 13.1; p = 0.0019) mRNA between the SCN of BMAL1+/+ and BMAL1−/− treated with a 15 min light pulse or just handled (control). In the SCN of BMAL1−/− mice, a light pulse at mid-subjective day resulted in a significant increase mPer1 (p < 0.001) and mPer2 (p < 0.01) mRNA levels compared with controls (Fig. 2b). In contrast, mPer1 and mPer2 mRNA levels in the SCN of BMAL1+/+ mice 2 h after a 15 min light pulse given at CT06 were as high as in the controls (Fig. 2b). Two-way ANOVA revealed a strong effect of genotype on the induction of mPer1 (F(1,8) = 45.6; p = 0.0001) and for mPer2 (F(1,8) = 23.1; p = 0.0014) mRNA by light at CT06.
These results indicate that the molecular clockwork plays a significant role for light-induced mPer1 and mPer2 expression in the SCN selectively during early night. Light-induced phase delays after a light pulse during early night are mediated by the release of intracellular Ca2+ via RyRs (Ding et al., 1998). Therefore, we tested the hypothesis whether the molecular clockwork is involved in the regulation of Ryr gene expression. For this purpose, mRNA levels of the two Ryr1 and Ryr2 isoforms in the SCN of both genotypes were compared by real-time PCR. Comparison of Ryr levels in the SCN of BMAL1+/+ mice showed much higher Ryr2 than Ryr1 levels (Fig. 3a). In the SCN of BMAL1+/+ mice, Ryr2 mRNAs showed significant differences among time points (F(5,12) = 8.01; p = 0.0015). Levels of Ryr2 mRNA were significantly elevated at CT02 compared with CT10, CT14, or CT18 (p < 0.01). Ryr2 mRNA levels were much lower and not rhythmic in the SCN of BMAL1−/− mice compared with BMAL1+/+ mice (Fig. 3a). Two-way ANOVA of Ryr2 mRNA levels revealed a strong effect of time (F(5,24) = 6.5; p = 0.0006), a strong effect of genotype (F(5,24) = 120.5; p < 0.001), and a strong interaction between genotype and time (F(5,24) = 6.6; p = 0.0005).
Figure 3.
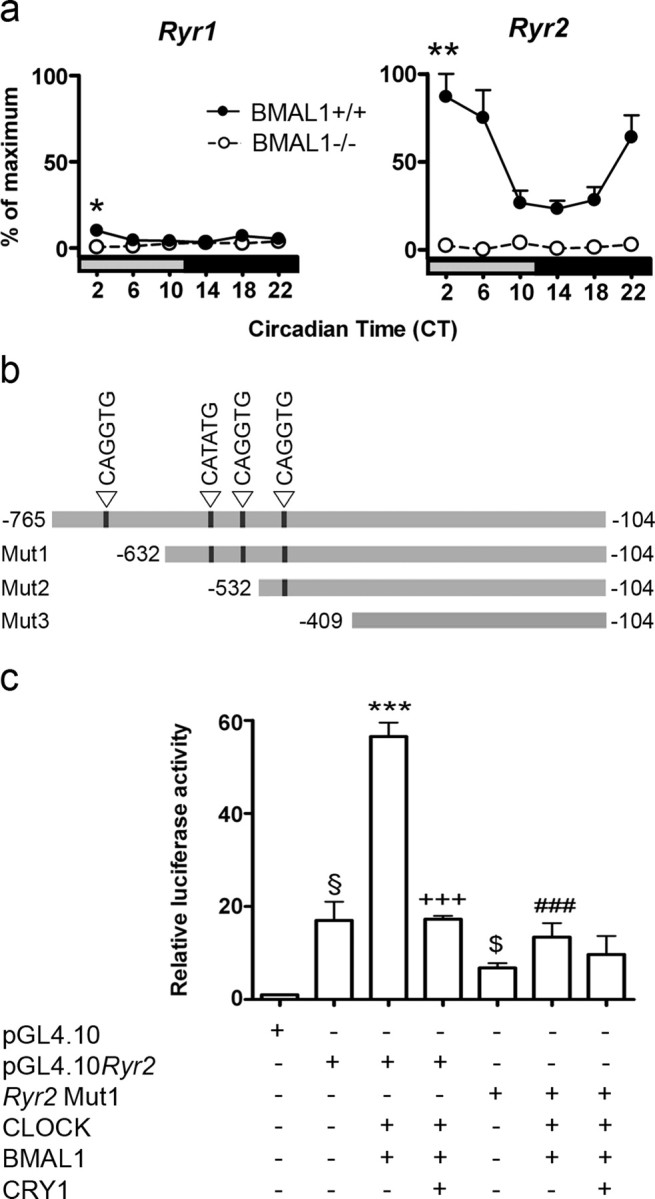
Analysis of Ryr expression in the SCN and Ryr promoter activity in vitro. a, Circadian rhythm of Ryr1 and Ryr2 mRNA levels in the SCN of BMAL1+/+ and BMAL1−/− mice determined by real-time PCR. Data points represent mean ± SEM (n = 4) relative to highest Ryr2 mRNA levels. One-way ANOVA revealed circadian rhythms only in BMAL1+/+ mice. One-way ANOVA, *p < 0.05, **p < 0.01 versus CT14. b, Location of E-box-like elements and sequences of the 5′ flanking regions in the Ryr genes used for luciferase reporter assay. Truncated versions of the Ryr2 promoter are indicated with Mut1–3. c, Transcriptional activation of the luciferase reporter without (pGL4.10) or with the full-length Ryr promoter region (pGL4.10Ryr2) or with the first truncated promoter region (Ryr2Mut1) and in the presence and absence of CLOCK, BMAL1, and CRY1 expression vectors. Bars represent mean ± SEM of three independent experiments (§p < 0.01 vs the first bar; ***p < 0.01 vs the second bar; +++p < 0.001 vs the third bar; $p < 0.01 vs the second bar; ###p < 0.01 vs the third bar).
To test whether the components of the molecular clockwork were able to control Ryr2 promoter activity, we used a luciferase reporter gene assay. NIH3T3 cell lines were cotransfected with expression plasmids for CLOCK, BMAL1, and mCRY1 and with a luciferase reporter vector containing the 5′ flanking region promoter region of the Ryr2 gene, including four E-box like elements (pGL4.10Ryr2) (Fig. 3b). There was a significant differences among the different transfections (F(6,14) = 45.1; p < 0.0001). CLOCK and BMAL1 together induced a large increase in Ryr2 transcriptional activity compared with baseline (pGL4.10Ryr2) (p < 0.001). The CLOCK::BMAL1-mediated activation of Ryr2 transcriptional activity was significantly attenuated by mCRY1 (p < 0.001) (Fig. 3c). A deletion of the first 133 bp including the first E-box-like element in the Ryr2 promoter (Ryr2Mut1) (Fig. 3b) resulted in a significantly reduced CLOCK:BMAL1-induced transcriptional activity compared with full-length pGL4.10Ryr2 (p < 0.001) (Fig. 3c). Additional truncation of the Ryr2 promoter (Mut2 and Mut3) did not further reduce the CLOCK:BMAL1-induced transcriptional activity of the Ryr2 gene (data not shown).
Immunohistochemistry showed that there were significant differences in RyR-IR in the SCN of BMAL1+/+ mice among time points (F(3,8) = 51.93; p < 0.0001) and significantly higher levels of RyR-IR in the SCN of BMAL1+/+ mice at ZT06 (p < 0.01) and ZT12 (p < 0.001) compared with ZT00. In contrast, there were no differences in RyR-IR in the SCN of BMAL1−/− mice (Fig. 4a) or in the SON of either BMAL1+/+ or BMAL1−/− mice (Fig. 4b). RyR protein levels were dramatically reduced in the SCN (Fig. 4a) but not in the SON of BMAL1−/− mice compared with BMAL1+/+ mice (Fig. 4b). Two-way ANOVA revealed a strong effect of time (F(3,16) = 49.01; p < 0.0001) and genotype (F(1,16) = 144.7; p < 0.0001) on RyR-IR in the SCN and a strong interaction between time and genotype (F(3,16) = 50.8; p < 0.0001).
Figure 4.

Ryanodine receptor immunoreaction in the SCN and the SON of WT and BMAL1−/− mice. a, Representative microphotographs and quantification of the RyR-IR in the SCN of BMAL1+/+ (black circles) and BMAL1−/− (white circles) mice determined every 6 h during a 12 h L/D schedule. Scale bar, 100 μm. oc, Optic chiasm; 3V, third ventricle. **p = 0.01; ***p = 0.001. b, Representative microphotographs and quantification of the RyR-IR in the SON of BMAL1+/+ (black bars) and BMAL1−/− (white bars) mice determined every 6 h during a 12 h L/D schedule. Scale bar, 50 μm. oc, Optic chiasm.
Functional analyses of ryanodine receptors in SCN neurons of BMAL1+/+ and BMAL1−/− mice were performed by determining intracellular calcium concentrations in acute SCN slice preparations using a two-photon microscope. Application of glutamate and caffeine induced reproducible increases in intracellular calcium in BMAL1+/+ SCN cells (Fig. 5). Response amplitudes did not differ significantly with respect to the sequence of application (Fig. 5a).
Figure 5.
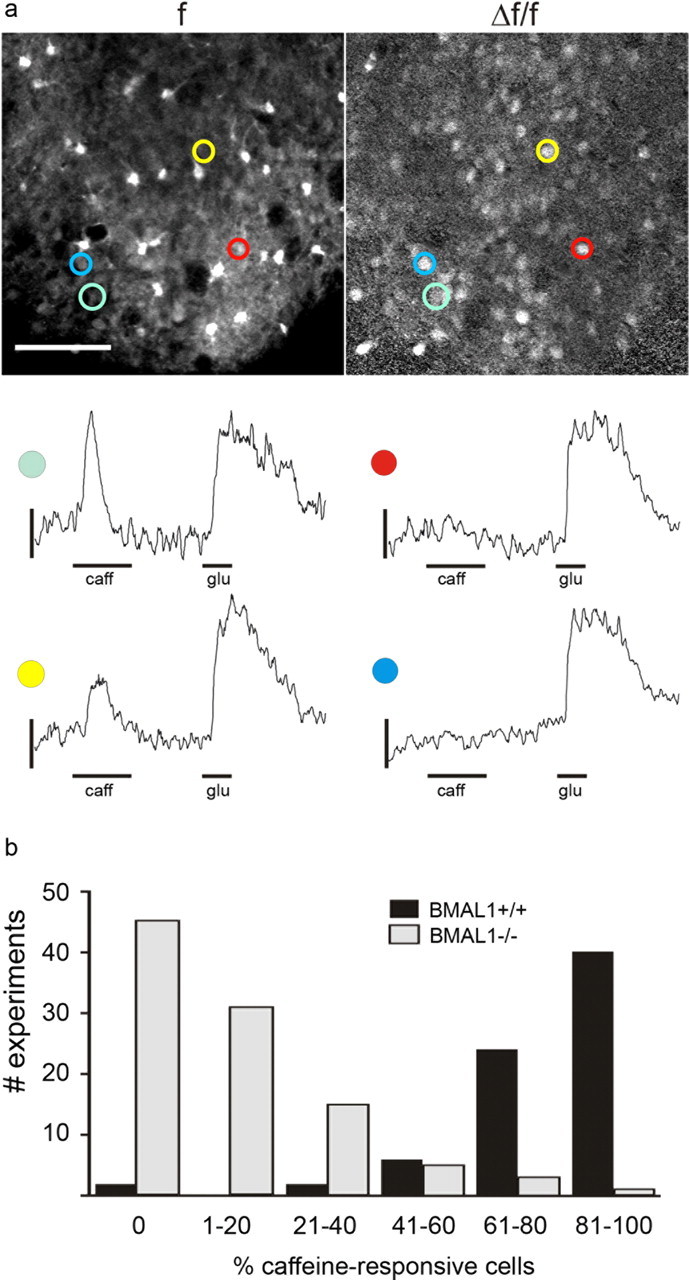
Functionality of ryanodine receptors in the SCN of BMAL1+/+ and BMAL1−/− mice. a, Top, Representative two-photon microphotographs of a BMAL1+/+ SCN slice loaded with the calcium-sensitive dye Oregon Green-BAPTA-1. f, Averaged baseline fluorescence; Δf/f, relative fluorescence increase during stimulation with glutamate (100 μm, glu). Colors highlight four SCN cells responding to glu. Scale bar, 50 μm. Bottom, Time courses of relative fluorescence changes in the four SCN neurons highlighted above responding either to both glutamate (glu) and the ryanodine receptor agonist caffeine (10 mm, caff) or to glutamate only. b, Percentage of caffeine-responsive SCN cells in BMAL1+/+ and BMAL1−/− mice. The percentage of caffeine-responsive SCN cells is significantly lower in BMAL1−/− slices compared with BMAL1+/+ slices. Data were gathered from 74 measurements (938 glutamate-responsive cells) in BMAL1+/+ and 100 measurements (1241 glutamate-responsive cells) from BMAL1−/− slices. Although in BMAL1+/+ most measurements revealed >60% caffeine-responsive SCN cells, most measurements in BMAL1−/− slices revealed <40% caffeine-responsive cells.
Although glutamate application induced prolonged calcium elevations, exceeding the application time, caffeine responses were transient and often decayed within the application period (Fig. 5a). In an attempt to quantify the presence of caffeine-responsive cells in BMAL1+/+ and BMAL1−/− SCN, the percentage of caffeine-responsive cells from all glutamate-responsive cells was determined in each field of view. In both BMAL1+/+ and BMAL1−/− SCN slices, a comparable number of glutamate-responsive cells was observed. In almost every measurement in BMAL1+/+ SCN slices, we observed caffeine responses in >50% of the glutamate-responsive cells. In contrast, the majority of observations in BMAL1−/− slices revealed no or only a small percentage of caffeine-responsive cells (Fig. 5b). Cells were rated as caffeine responsive if the peak signal of the calcium measurement exceeded 10% of the maximum glutamate-induced response. We observed significantly less caffeine-responsive cells (14.1%) in the SCN of BMAL1−/− mice (Mann–Whitney test, p < 0.0001) compared with the SCN of BMAL1+/+ mice (79.2%). Furthermore, the remaining caffeine responses observed in BMAL1−/− SCN were of significantly lower amplitude, when compared with the peak amplitudes to glutamate, than those observed in BMAL1+/+ slices (BMAL1−/−, 18.1 ± 5.2 vs BMAL1+/+, 42.9 ± 18.6; p < 0.0001, Mann–Whitney test).
To verify that caffeine-induced calcium elevations were mediated via ryanodine receptors, we measured these responses before and after a 5 min incubation with 50 μm ryanodine, blocking ryanodine receptors irreversibly (Meissner, 1994). As shown in Figure 6, the caffeine-induced calcium elevations were fully inhibited after preincubation with ryanodine, whereas the glutamate response was unaffected. Identical results were obtained in three independent experiments.
Figure 6.

Caffeine-induced calcium elevations are mediated via ryanodine receptors. Calcium signals in SCN neurons of BMAL1+/+ mice in response to caffeine (10 mm, caff) or glutamate (100 μm, glu) before (control) and 45 min after a 5 min incubation with the ryanodine receptor antagonist ryanodine (50 μm). Caffeine-induced calcium elevations were fully inhibited after preincubation with ryanodine, whereas the glutamate response was unaffected. Averaged data from five cells in one field of view.
Discussion
Photic entrainment of the circadian pacemaker in the SCN is essential for timely optimized body functions and relies on the ability of the core molecular clockwork to be adjusted by light. Light during dusk and dawn resets the molecular clockwork by increasing mPer expression in the SCN. However, the signal transduction pathways differ remarkably between dusk and dawn. Light during early or late night leads to phase delays or phase advances by activating RyRs or guanylyl cyclases, respectively (Ding et al., 1998; Gillette and Mitchell., 2002). However, it is unknown how the core molecular clockwork within the SCN controls the availability of the respective input pathway components. Therefore, we examined light resetting mechanisms in mice with an impaired molecular clockwork (BMAL1−/−). We found that, in the SCN of BMAL1−/− mice, light-induced mPer expression was selectively impaired during early night. Ryr mRNA/RyR protein levels were reduced compared with BMAL1+/+ mice. A luciferase assay showed that the transcriptional activity of the Ryr promoter was dependent on the first 133 bp including a E-box-like element (CAGGTG) and could be controlled by molecular clockwork components. Moreover, the increase in Ca2+i in SCN cells in response to the RyR agonist caffeine was reduced in BMAL1−/− compared with BMAL1+/+ mice. These findings show that the core molecular clockwork regulates the expression of Ryrs and thus controls its own sensitivity to incoming photic signals.
During the light phase under LD conditions, levels of mPer1 and mPer2 were high in the SCN of BMAL1+/+ mice but low in the SCN of BMAL1−/− mice (this study; Bunger et al., 2000). This is consistent with low levels of c-fos in the SCN of Vipr2−/− mice during the light phase (Hughes et al., 2004). The absence of rhythmicity in mPer and c-fos expression is obviously attributable to a disruption of the molecular clockwork in the respective genetically altered mice. Nevertheless, both c-fos (Abe and Rusak, 1994) and mPer (Albrecht et al., 1997; Shearman et al., 1997) have been shown to be robust markers of SCN neuronal activation by photic stimuli. However, there is no increase in c-fos and mPer expression in the SCN of Vipr2−/− and BMAL1−/− mice during the day (e.g., 2 h after lights on, ZT02). Although BMAL1 is important for inner retinal processing of visual stimuli (Storch et al., 2007), we observed a strong suppressive effect of light (masking) on the locomotor behavior in BMAL1−/− mice and an increase in mPer expression in the SCN of BMAL1−/− mice after a light pulse during the night (ZT22). This shows that the photoperception of the SCN per se is intact in BMAL1−/− mice. Our data rather indicate that the light/dark cycle controls gating of sensitivity of the circadian system to light preventing the activation of photic input signal transduction pathways during the day time domain. To date, little is known about whether this gating is determined at the level of the retina or at the level of the SCN. Importantly, many genes in the retina show diurnal rhythms in LD conditions that are fully preserved in BMAL1−/− mice (Storch et al., 2007), which might be involved in retinal gating of photic input into the circadian system. Although the cGMP–PKG pathway (Tischkau et al., 2003) is intact in the SCN of BMAL1−/− mice, as indicated by light induction of Per mRNA during late night, there is obviously a refractory period during daytime and during early night for this pathway. This refractory period might be a possible mechanism for gating within the SCN.
During the subjective day phase under DD conditions (e.g., CT06), light activates c-fos (Hughes et al., 2004) and mPer in the SCN of BMAL1−/− mice (this study) and Vipr2−/− mice (Hughes et al., 2004) but not in the corresponding wild types. This demonstrates that, in mice with an impaired molecular clockwork, the gating of photic input into the circadian system is ceased as soon as the animals are transferred to constant darkness. Importantly, locomotor activity as well as mPer expression in SCN (Bunger et al., 2000) and retina (Storch et al., 2007) become arrhythmic immediately in DD.
Surprisingly, light during early night in LD (ZT14) did not lead to an induction of mPer in the SCN of BMAL1−/− mice. This is consistent with a previous study showing reduced Per induction in the SCN of Clock mutant mice after light during early night (Shearman and Weaver, 1999). In contrast, light during late night in LD (ZT22) resulted in an increase of mPer mRNA levels in the SCN of BMAL1−/− mice. Thus, an important role of BMAL1 in the CRE-mediated Per1 induction (Travnickova-Bendova et al., 2002) could be ruled out. In fact, our data suggest that release of intracellular Ca2+ through neuronal RyRs mediating light during early night (Ding et al., 1998) is selectively disturbed in the SCN of BMAL1−/− mice (Fig. 7). Therefore, we tested the hypothesis that Ryr expression in the SCN of BMAL1−/− mice is affected as a result of disturbances in the molecular clockwork.
Figure 7.
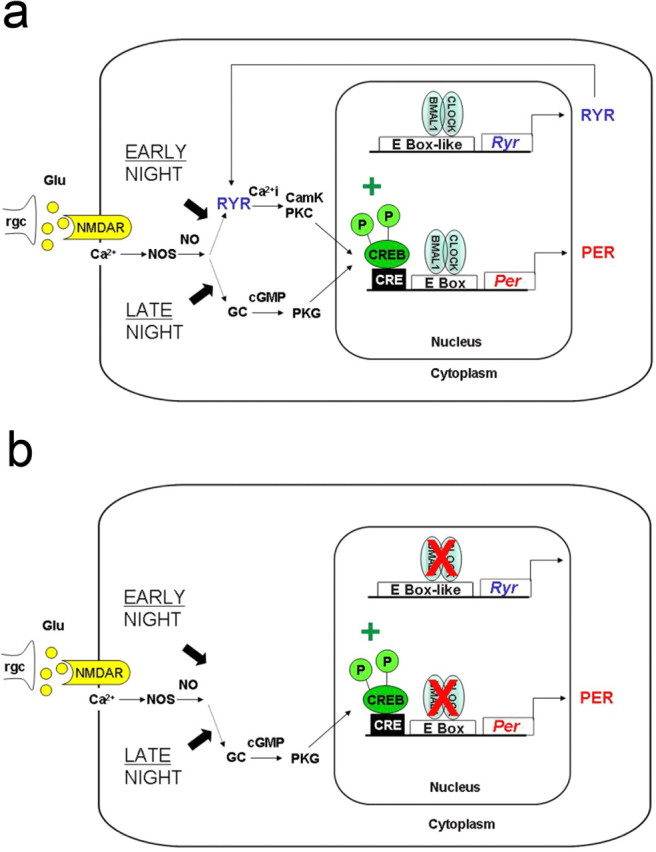
Model depicting the signal transduction pathways of photic entrainment of the SCN during early and late night. a, Light during night leads to the release of glutamate from specialized retinal ganglion cells (rgc). The activation of NMDA receptors (NMDAR) leads to an influx of calcium (Ca2+), the activation of nitric oxide synthase (NOS), and the production of nitric oxide (NO). During early night, NO triggers the activation of RyRs, an increase of Ca2+i, and the activation of Ca2+-sensitive protein kinases such as calmodulin kinase (CamK) or protein kinase C (PKC). During late night NO triggers the activation of guanylyl cyclase, an increase in cGMP, and the activation of protein kinase G (PKG). Both signal transduction pathways converge to the phosphorylation of the transcription factor CREB, which activates the expression of Per by binding to CREs in their promoter regions. Our data show that the expression of Ryrs are regulated by the core molecular clockwork and activated by the bHLH transcription factors CLOCK and BMAL1. b, BMAL1−/− mice lack RyRs, and thus a light pulse during early night cannot induce Per expression.
All three ryanodine receptor isoforms (RyR1, RyR2, and RyR3) have been identified in the rodent brain (Furuichi et al., 1994; Giannini et al., 1995). However, RyR2 is the most abundant isoform in the brain (Furuichi et al., 1994; Giannini et al., 1995) and could also be detected in the rat (Díaz-Muñoz et al., 1999) and the mouse (this study) SCN. In the SCN of BMAL1+/+ mice, Ryr2 mRNA levels showed circadian rhythms with a peak during early subjective day. Thus, the circadian rhythm in Ryr expression resembles the temporal expression profile of clock-controlled genes (Reppert and Weaver, 2002), suggesting a regulation of Ryr expression by the molecular clockwork. This has also been proposed by Aguilar-Roblero et al. (2007) who showed that RyRs produce circadian rhythms in intracellular calcium levels in SCN cells. The rhythm of the RyR2 protein levels follows the Ryr2 mRNA with a temporal delay of 4–6 h. This large delay between mRNA and protein levels has also been reported for other clock-controlled genes such as the Pers (Hastings et al., 1999). The peak of RyR protein levels in the SCN during early night is consistent with its function in mediating light responses during this time (Ding et al., 1998). An increase of RyR2 protein levels during midday is consistent with reported high ryanodine binding at this time (Díaz-Muñoz et al., 1999).
In the SCN of BMAL1−/− mice, Ryr mRNAs levels were not rhythmic and dramatically reduced, which was also reflected by diminished RyR protein levels. However, this effect was highly tissue specific because RyR-IR was not affected in the SON of BMAL1−/− mice. A similar tissue specificity has been observed for other clock-controlled genes such as vasopressin (Jin et al., 1999). The absence of RyR in the SCN of BMAL1−/− mice may account for the lack of photic mPer induction during early night. To establish whether the Ryr promoter can be controlled by molecular clockwork components, the 5′ flanking region of the mouse Ryr2 gene including four E-box-like elements, which are potential binding sites for the CLOCK::BMAL1 complex, was cloned into a promoterless luciferase vector. The transcriptional activity of the full-length Ryr2 promoter was activated by the CLOCK::BMAL1 complex and inhibited by CRY1. This confirms that the core molecular clockwork components are able to control Ryr2 expression. A deletion of the first 133 bp of the Ryr2 promoter including the first E-box-like element (CAGGTG) resulted in a dramatically reduced CLOCK::BMAL1-mediated transcriptional activity, suggesting that this region contains the most important regulatory sequences. Importantly, a CAGGTG motif is also present in the most active regulatory region of the Ryr2 promoter in rabbit (Nishida et al., 1996).
Ryanodine receptors represent calcium-dependent intracellular calcium channels in various tissues including neurons. SCN cells of BMAL1+/+ and BMAL1−/− mice showed comparable increases of Ca2+i in response to glutamate, indicating that the BMAL1-deficiency does not affect expression of glutamate receptors. However, significantly fewer BMAL1−/− SCN cells responded to the ryanodine receptor agonist caffeine. This shows that functionality of RyR mediated calcium signaling is impaired in BMAL1−/− SCN cells. RyR-mediated release of Ca2+ from internal stores is not only involved in input pathways conveying environmental time cues to the molecular clockwork (Ding et al., 1998) but also in output pathways such as rhythmic changes of the membrane potential of SCN neurons (Ikeda et al., 2003; Aguilar-Roblero et al., 2007). In addition, neurotransmitter release is highly dependent on Ca2+i. Thus, it can be envisioned that RyRs play an important role in the neuronal and humoral communication of the SCN with its target regions (Tousson and Meissl, 2004). Consequently, the loss of rhythmic output in BMAL1−/− mice (Bunger et al., 2000) could be attributable to dysfunctional RyR-mediated calcium signaling in the SCN.
In summary, the present study provides evidence for dysfunctional RyR calcium signaling in the SCN of BMAL1−/− mice, leading to a disturbed light-input pathway selectively during early night. Our data imply that the molecular clockwork in the mammalian SCN directly controls at least one of its own input pathway components.
Footnotes
This work was supported by Deutsche Forschungsgemeinschaft Grants GA 737/5-1 (C.v.G.) and DE 551/8-1 (T.D.) and the Paul und Cilli Weill-Stiftung (N.A.). We thank David R. Weaver, Hugh Piggins, and Erik Maronde for helpful discussions, Doris Evers for technical support, and Hanns Ackermann for help with statistical analysis.
References
- Abe H, Rusak B. Physiological mechanisms regulating photic induction of Fos-like protein in hamster suprachiasmatic nucleus. Neurosci Biobehav Rev. 1994;18:531–536. doi: 10.1016/0149-7634(94)90007-8. [DOI] [PubMed] [Google Scholar]
- Aghajanian GK, Rasmussen K. Intracellular studies in the facial nucleus illustrating a simple new method for obtaining viable motoneurons in adult rat brain slices. Synapse. 1989;3:331–338. doi: 10.1002/syn.890030406. [DOI] [PubMed] [Google Scholar]
- Aguilar-Roblero R, Mercado C, Alamilla J, Laville A, Díaz-Muñoz M. Ryanodine receptor Ca2+-release channels are an output pathway for the circadian clock in the rat suprachiasmatic nuclei. Eur J Neurosci. 2007;26:575–582. doi: 10.1111/j.1460-9568.2007.05679.x. [DOI] [PubMed] [Google Scholar]
- Airey JA, Beck CF, Murakami K, Tanksley SJ, Deerinck TJ, Ellisman MH, Sutko JL. Identification and localization of two triad junctional foot protein isoforms in mature avian fast twitch skeletal muscle. J Biol Chem. 1990;265:14187–14194. [PubMed] [Google Scholar]
- Albrecht U, Sun ZS, Eichele G, Lee CC. A differential response of two putative mammalian circadian regulators, mper1 and mper2, to light. Cell. 1997;91:1055–1064. doi: 10.1016/s0092-8674(00)80495-x. [DOI] [PubMed] [Google Scholar]
- Bunger MK, Wilsbacher LD, Moran SM, Clendenin C, Radcliffe LA, Hogenesch JB, Simon MC, Takahashi JS, Bradfield CA. Mop3 is an essential component of the master circadian pacemaker in mammals. Cell. 2000;103:1009–1017. doi: 10.1016/s0092-8674(00)00205-1. [DOI] [PMC free article] [PubMed] [Google Scholar]
- DeBruyne JP, Weaver DR, Reppert SM. Peripheral circadian oscillators require CLOCK. Nat Neurosci. 2007;10:543–545. doi: 10.1016/j.cub.2007.05.067. [DOI] [PubMed] [Google Scholar]
- Denk W, Detwiler PB. Optical recording of light-evoked calcium signals in the functionally intact retina. Proc Natl Acad Sci U S A. 1999;96:7035–7040. doi: 10.1073/pnas.96.12.7035. [DOI] [PMC free article] [PubMed] [Google Scholar]
- Díaz-Muñoz M, Dent MA, Granados-Fuentes D, Hall AC, Hernández-Cruz A, Harrington ME, Aguilar-Roblero R. Circadian modulation of the ryanodine receptor type 2 in the SCN of rodents. Neuroreport. 1999;10:481–486. doi: 10.1097/00001756-199902250-00007. [DOI] [PubMed] [Google Scholar]
- Ding JM, Buchanan GF, Tischkau SA, Chen D, Kuriashkina L, Faiman LE, Alster JM, McPherson PS, Campbell KP, Gillette MU. A neuronal ryanodine receptor mediates light-induced phase delays of the circadian clock. Nature. 1998;394:381–384. doi: 10.1038/28639. [DOI] [PubMed] [Google Scholar]
- Furuichi T, Furutama D, Hakamata Y, Nakai J, Takeshima H, Mikoshiba K. Multiple types of ryanodine receptor/Ca2+ release channels are differentially expressed in rabbit brain. J Neurosci. 1994;14:4794–4805. doi: 10.1523/JNEUROSCI.14-08-04794.1994. [DOI] [PMC free article] [PubMed] [Google Scholar]
- Garaschuk O, Milos RI, Konnerth A. Targeted bulk-loading of fluorescent indicators for two-photon brain imaging in vivo. Nat Protoc. 2006;1:380–386. doi: 10.1038/nprot.2006.58. [DOI] [PubMed] [Google Scholar]
- Gau D, Lemberger T, von Gall C, Kretz O, Le Minh N, Gass P, Schmid W, Schibler U, Korf HW, Schütz G. Phosphorylation of CREB Ser142 regulates light-induced phase shifts of the circadian clock. Neuron. 2002;34:245–253. doi: 10.1016/s0896-6273(02)00656-6. [DOI] [PubMed] [Google Scholar]
- Giannini G, Conti A, Mammarella S, Scrobogna M, Sorrentino V. The ryanodine receptor/calcium channel genes are widely and differentially expressed in murine brain and peripheral tissues. J Cell Biol. 1995;128:893–904. doi: 10.1083/jcb.128.5.893. [DOI] [PMC free article] [PubMed] [Google Scholar]
- Gillette MU, Mitchell JW. Signaling in the suprachiasmatic nucleus: selectively responsive and integrative. Cell Tissue Res. 2002;309:99–107. doi: 10.1007/s00441-002-0576-1. [DOI] [PubMed] [Google Scholar]
- Hastings MH, Field MD, Maywood ES, Weaver DR, Reppert SM. Differential regulation of mPER1 and mTIM proteins in the mouse suprachiasmatic nuclei: new insights into a core clock mechanism. J Neurosci. 1999;19(RC11):1–7. doi: 10.1523/JNEUROSCI.19-12-j0001.1999. [DOI] [PMC free article] [PubMed] [Google Scholar]
- Hastings MH, Reddy AB, Maywood ES. A clockwork web: circadian timing in brain and periphery, in health and disease. Nat Rev Neurosci. 2003;4:649–661. doi: 10.1038/nrn1177. [DOI] [PubMed] [Google Scholar]
- Hughes AT, Fahey B, Cutler DJ, Coogan AN, Piggins HD. Aberrant gating of photic input to the suprachiasmatic circadian pacemaker of mice lacking the VPAC2 receptor. J Neurosci. 2004;24:3522–3526. doi: 10.1523/JNEUROSCI.5345-03.2004. [DOI] [PMC free article] [PubMed] [Google Scholar]
- Ikeda M, Sugiyama T, Wallace CS, Gompf HS, Yoshioka T, Miyawaki A, Allen CN. Circadian dynamics of cytosolic and nuclear Ca2+ in single suprachiasmatic nucleus neurons. Neuron. 2003;38:253–263. doi: 10.1016/s0896-6273(03)00164-8. [DOI] [PubMed] [Google Scholar]
- Jilg A, Moek J, Weaver DR, Korf HW, Stehle JH, von Gall C. Rhythms in clock proteins in the mouse pars tuberalis depend on MT1 melatonin receptor signalling. Eur J Neurosci. 2005;22:2845–2854. doi: 10.1111/j.1460-9568.2005.04485.x. [DOI] [PubMed] [Google Scholar]
- Jin X, Shearman LP, Weaver DR, Zylka MJ, de Vries GJ, Reppert SM. A molecular mechanism regulating rhythmic output from the suprachiasmatic circadian clock. Cell. 1999;96:57–68. doi: 10.1016/s0092-8674(00)80959-9. [DOI] [PubMed] [Google Scholar]
- Kondratov RV, Chernov MV, Kondratova AA, Gorbacheva VY, Gudkov AV, Antoch MP. BMAL1-dependent circadian oscillation of nuclear CLOCK: posttranslational events induced by dimerization of transcriptional activators of the mammalian clock system. Genes Dev. 2003;17:1921–1932. doi: 10.1101/gad.1099503. [DOI] [PMC free article] [PubMed] [Google Scholar]
- Meissner G. Ryanidine receptor/ Ca2+ release channels and their regulation by endogenous effectors. Annu Rev Physiol. 1994;56:485–508. doi: 10.1146/annurev.ph.56.030194.002413. [DOI] [PubMed] [Google Scholar]
- Nguyen QT, Tsai PS, Kleinfeld D. MPScope: a versatile software suite for multiphoton microscopy. J Neurosci Methods. 2006;156:351–359. doi: 10.1016/j.jneumeth.2006.03.001. [DOI] [PubMed] [Google Scholar]
- Nishida K, Otsu K, Hori M, Kuzuya T, Tada M. Cloning and characterization of the 5′-upstream regulatory region of the Ca2+-release channel gene of cardiac sarcoplasmic reticulum. Eur J Biochem. 1996;240:408–415. doi: 10.1111/j.1432-1033.1996.0408h.x. [DOI] [PubMed] [Google Scholar]
- Nomura K, Takeuchi Y, Fukunaga K. MAP kinase additively activates the mouse Per1 gene promoter with CaM kinase II. Brain Res. 2006;1118:25–33. doi: 10.1016/j.brainres.2006.08.087. [DOI] [PubMed] [Google Scholar]
- Obrietan K, Impey S, Storm DR. Light and circadian rhythmicity regulate MAP kinase activation in the suprachiasmatic nuclei. Nat Neurosci. 1998;1:693–700. doi: 10.1038/3695. [DOI] [PubMed] [Google Scholar]
- Rasband W. Image J 1997–2008. Bethesda, MD: National Institutes of Health; 2008. [Google Scholar]
- Reppert SM, Weaver DR. Coordination of circadian timing in mammals. Nature. 2002;418:935–941. doi: 10.1038/nature00965. [DOI] [PubMed] [Google Scholar]
- Shearman LP, Weaver DR. Photic induction of Period gene expression is reduced in Clock mutant mice. Neuroreport. 1999;10:613–618. doi: 10.1097/00001756-199902250-00031. [DOI] [PubMed] [Google Scholar]
- Shearman LP, Zylka MJ, Weaver DR, Kolakowski LF, Jr, Reppert SM. Two period homologs: circadian expression and photic regulation in the suprachiasmatic nuclei. Neuron. 1997;19:1261–1269. doi: 10.1016/s0896-6273(00)80417-1. [DOI] [PubMed] [Google Scholar]
- Storch KF, Paz C, Signorovitch J, Raviola E, Pawlyk B, Li T, Weitz CJ. Intrinsic circadian clock of the mammalian retina: importance for retinal processing of visual information. Cell. 2007;130:730–741. doi: 10.1016/j.cell.2007.06.045. [DOI] [PMC free article] [PubMed] [Google Scholar]
- Tischkau SA, Mitchell JW, Tyan SH, Buchanan GF, Gillette MU. Ca2+/cAMP response element-binding protein (CREB)-dependent activation of Per1 is required for light-induced signaling in the suprachiasmatic nucleus circadian clock. J Biol Chem. 2003;278:718–723. doi: 10.1074/jbc.M209241200. [DOI] [PubMed] [Google Scholar]
- Tousson E, Meissl H. Suprachiasmatic nuclei grafts restore the circadian rhythm in the paraventricular nucleus of the hypothalamus. J Neurosci. 2004;24:2983–2988. doi: 10.1523/JNEUROSCI.5044-03.2004. [DOI] [PMC free article] [PubMed] [Google Scholar]
- Travnickova-Bendova Z, Cermakian N, Reppert SM, Sassone-Corsi P. Bimodal regulation of mPeriod promoters by CREB-dependent signaling and CLOCK/BMAL1 activity. Proc Natl Acad Sci U S A. 2002;99:7728–7733. doi: 10.1073/pnas.102075599. [DOI] [PMC free article] [PubMed] [Google Scholar]