

Abstract
Genetic factors are important in the etiology of bipolar disorder (BD). However, first-degree relatives of BD patients are at risk for a number of psychiatric conditions, most commonly major depressive disorder (MDD), although the majority remain well. The purpose of the present study was to identify potential brain structural correlates for risk and resilience to mood disorders in patients with BD, type I (BD-I) and their relatives. Structural magnetic resonance imaging scans were acquired from 30 patients with BD-I, 50 of their first-degree relatives (28 had no Axis I disorder, while 14 had MDD) and 52 controls. We used voxel-based morphometry, implemented in SPM5 to identify group differences in regional gray matter volume. From the identified clusters, potential differences were further examined based on diagnostic status (BD-I patients, MDD relatives, healthy relatives, controls). Whole-brain voxel-based analysis identified group differences in the left hemisphere in the insula, cerebellum, and substantia nigra. Increased left insula volume was associated with genetic preposition to BD-I independent of clinical phenotype. In contrast, increased left substantia nigra volume was observed in those with the clinical phenotype of BD-I. Changes uniquely associated with the absence of a clinical diagnosis in BD relatives were observed in the left cerebellum. Our data suggest that in BD, genetic and phenotype-related influences on brain structure are dissociable; if replicated, these findings may help with early identification of high-risk individuals who are more likely to transition to syndromal states.
Introduction
Genetic factors contribute to >80% of the liability to develop bipolar disorder (BD) (Cardno et al., 1999). However, the relationship between genetic risk and clinical phenotypes is complex; the majority (∼60%) of individuals with genetic predisposition to BD will not develop any psychiatric disorder, while the remainder may present not only with BD but also with other psychiatric conditions associated with affective morbidity, most commonly major depressive disorder (MDD) (Shih et al., 2004). This suggests that genetic predisposition to BD implicates brain networks involved in emotional processing. Therefore, neuroimaging studies have attempted to identify brain structural changes associated with genetic predisposition and disease expression in BD. As shown in our meta-analysis (Kempton et al., 2008), disease expression is associated with subtle brain volume changes (with effect sizes <0.6) with the exception of the left anterior cingulate, where an effect size of 1.17 was found. Between-study heterogeneity was very high with an average I2 index of 50.6% and 36.9% for cortical and subcortical gray matter respectively. Data from structural brain imaging studies of unaffected first-degree relatives of BD patients show marked divergence. McDonald et al. (2004) reported a negative association between genetic risk for BD and gray matter volume in the right medial frontal gyrus, anterior cingulate gyrus, and striatum. However, McIntosh et al. (2006) did not find any effect of genetic liability in relatives from families multiply affected with BD. Both research groups conducted further analyses on their samples. McDonald et al. (2006) used a region of interest (ROI) approach focusing on ventricular and hippocampal volumes but did not find significant differences between BD relatives and controls. Similarly, McIntosh et al. (2004) did not find any difference between relatives and controls using a voxel-based analysis; however, following small volume correction, they reported reduced gray matter density in the anterior thalamus bilaterally extending into the caudate on the left in relatives. These findings contrast with the report by Noga et al. (2001) of increased caudate volume in healthy cotwins of BD patients compared with controls. Finally, no volume changes in the subgenual anterior cingulate cortex but larger hippocampal volume were reported by Hajek et al. (2008) and Ladouceur et al. (2008), respectively, in two independent ROI studies of unaffected offspring of BD patients. It would therefore appear that both the degree and direction of brain structural changes in individuals at risk for BD remain unclear. In most studies of “unaffected” relatives, some of the individuals had non-BD clinical diagnoses but not in sufficient numbers to allow for the examination of the interaction between genetic diathesis and specific clinical phenotypes.
Therefore the aim of this study is threefold: (1) to expand the current evidence base on brain structural correlates of genetic predisposition to BD, (2) to identify potential diagnosis-specific brain structural changes differentiating patients with BD from their relatives with MDD, and (3) to explore brain structural correlates of resilience to BD in individuals at high risk for the disorder who remain psychiatrically well.
Materials and Methods
Participants.
Patients were identified by clinicians' referrals and were included if they (1) were aged between 17 and 65 years, (2) fulfilled Diagnostic and Statistical Manual of Mental Disorders, fourth edition, revised (DSM-IV) criteria for bipolar disorder, type I (BD-I), (3) had at least one first-degree relative unaffected by BD, and (4) had no family history (up to spectrum disorders. Their siblings and offspring were invited to participate, with the patients' consent, if aged 17–65 and without a personal history of bipolar-spectrum disorders.
Healthy volunteers were recruited through advertisement in the local press and were enrolled if they (1) were aged 17–65 years and (2) had no personal or family history of any Axis I or II DSM-IV disorder. Healthy volunteers were selected so that they matched both patients and relatives in gender and level of education. Level of education was rated on a five-point scale ranging from 1 (no educational qualification) to 5 (postgraduate university level qualifications).
Exclusion criteria for the entire sample (patients, relatives, and controls) included (1) head trauma resulting in loss of consciousness, (2) personal history of neurological or medical disorders, (3) family history of hereditary neurological disorders, and (4) fulfilling DSM-IV criteria for lifetime drug or alcohol dependence and drug or alcohol abuse in the preceding 6 months. The study was approved by the Ethics Committee of the Institute of Psychiatry. Written informed consent was obtained from all participants.
Assessment.
Diagnostic assessments for all participants were conducted by personal interview by two trained psychiatrists, who were initially blind to diagnostic but not family status (BD family member or unrelated control). Interviews were conducted using the Structured Clinical Interview for DSM-IV (SCID) for Axis I (First et al., 2001) and the SCID-II Personality Questionnaire for Axis II diagnoses (First et al., 1997). Interrater reliability was κ > 0.92 for both instruments. Where applicable, further information about age of onset, number and polarity of previous episodes, number of hospital admissions, and current medication (type, dose, and duration) was collected from medical notes. Family history of psychiatric disorders was assessed using the Family Interview for Genetic Studies (FIGS) (Maxwell, 1992) supplemented by medical notes as necessary. All participants were rated using the Hamilton Depression Rating Scale (HDRS) (Hamilton, 1960), the Young Mania Rating Scale (YMRS) (Young et al., 1978), and the Brief Psychiatric Rating Scale (BPRS) (Overall and Gorham, 1962). All three scales were highly correlated (r > 0.733, p < 0.0001). The 24-item BPRS was chosen to allow meaningful comparisons between patient and nonpatient groups within our sample because it can be used to rate both nonpathological (item ratings <3) and pathological experiences (item ratings of 4–7).
Before scanning, all participants with an Axis I disorder were assessed weekly over a minimum period of 1 month to ensure that (1) they scored <7 in the HDRS and YMRS, and (2) there had been no change to their medication status.
For all participants an estimate of current full-scale intelligence quotient (FSIQ) was obtained on the day of scanning using the Wechsler Adult Intelligence Scale-Revised (WAIS-R) (Wechsler, 1981).
Sample.
Ninety-two BD-I patients from an equal number of families were screened by telephone interview for eligibility by a trained psychiatrist. Families of 53 BD patients were enrolled in the study; these yielded 47 BD-I patients (6 patients were further excluded because they did not meet remission criteria throughout the study period) and 75 first-degree relatives. For the current analysis, 17 BD patients were excluded (11 because they were >60 years of age and 6 because of motion artifacts in their brain scans). A detailed flow chart of study sample recruitment is shown in Figure 1. The sample included in this analysis consisted of 30 BD patients, 50 relatives, and 52 controls. The 50 relatives comprised of 27 offspring (mean age = 24.9 ± 4.8, 23 females) and 23 siblings (mean age = 44.2 ± 10.8, 17 females). Twenty-eight relatives had no Axis I or II disorders, and 14 had a diagnosis of MDD. Full demographic characteristics are shown in Table 1.
Figure 1.
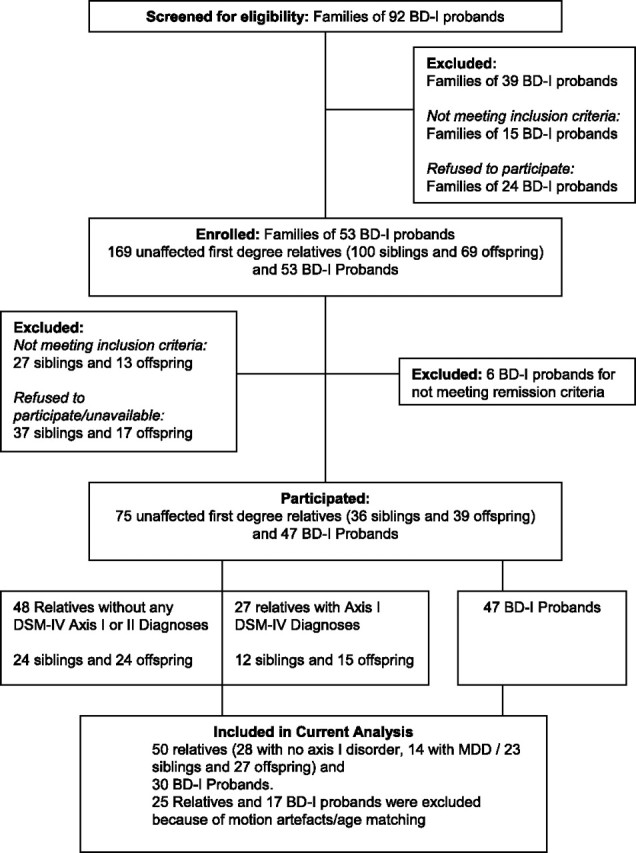
Identification and recruitment of families of BD-I probands.
Table 1.
Sample characteristics
| Controls (n = 52) | BD probands (n = 30) | All relatives (n = 50) | MDD relatives (n = 14) | Statistical testa | |
|---|---|---|---|---|---|
| Age (years) | 35.2 (13.0) | 39.4 (9.8) | 33.8 (12.7) | 31.4 (10.3) | F(1,129) = 2.1; p = 0.13 |
| Gender (male to female ratio) | 27:25 | 15:15 | 24:26 | 5:9 | χ(2)2 = 0.16; p = 0.93 |
| Educational level score | 3.58 (0.98) | 3.47 (0.97) | 3.72 (0.88) | 3.86 (0.95) | F(1,129) = 0.72; p = 0.49 |
| BPRS | 24.4 (0.7) | 27.5 (4.2) | 24.7 (1.5) | 25.5 (2.0) | F(1,129) = 20.0; p < 0.001b |
| Total intracranial volume (ml) | 1596 (170) | 1582 (178) | 1653 (189) | 1611 (206) | F(1,129) = 1.9; p = 0.15 |
| Mean age of onset | 23.5 (6.7) | 23.6 (8.2) | |||
| Illness duration | 16.6 (8.7) | 5.6 (6.0) | |||
| Number of affective episodes | 7.5 (3.9) | 1.5 (0.7) |
Values are mean (SD).
aControls versus patients versus all relatives.
bBD patients had higher scores than relatives and controls (both p < 0.003), while the two latter groups did not differ.
All but 1 BD patient were on psychotropic medication; 12 on antipsychotics (7 on atypicals, 2 on typical, and 3 on both), 19 on mood stabilizers, 13 on antidepressants, and 2 on hypnotics. The most common mood stabilizer prescribed was lithium (n = 12), followed by lamotrigine (n = 4), carbamazepine (n = 3), and sodium valproate (n = 3). Eighteen of the BD patients received two or more psychotropics, and three were on lithium monotherapy. Both BD patients and MDD relatives were in remission during the study, and none of the MDD relatives were on medication at the time of testing.
Magnetic resonance imaging scanning.
Structural images were acquired using a 1.5 T General Electric Signa System scanner at the Maudsley Hospital, London. Images were acquired in the axial plane using a T1-weighted, three-dimensional spoiled gradient recalled echo protocol (echo time = 5.1 ms, repetition time = 18 ms, flip angle = 20°, slice thickness = 1.5 mm, in plane resolution = 0.9375 × 0.9375 mm, number of excitations = 1).
Analysis.
All images were checked manually for gross structural abnormalities before analysis. Analysis was performed using voxel-based morphometry (VBM) with unified segmentation in SPM5 (www.fil.ion.ucl.ac.uk/spm/software/spm5) (Ashburner and Friston, 2005). Unified segmentation performs image registration, magnetic resonance imaging bias field correction, and tissue segmentation in one generative model; although more complex, this integrative method is likely to be more accurate than sequential processing steps such as “optimized VBM” (Good et al., 2001). We used the standard segmentation option in SPM5 with Clean up partitions set to “Thorough Clean” to ensure nonbrain tissue was excluded from the gray matter segmentations. Normalized and modulated gray matter segmented images were produced for each subject and smoothed using a Gaussian isotropic kernel of 12 mm full width half maximum.
To calculate total intracranial volume (TIV), modulated white matter and CSF images were also produced for each subject, and intracranial volume was calculated by summing the total gray matter, white matter, and CSF fractions. There was no significant difference in TIV between the groups (F(1,129) = 1.9, p = 0.15); however, relatives had numerically higher TIV means by 3.6% and 4.5% compared with healthy controls and BD patients, respectively. Therefore, TIV was included as a covariate in further analyses as appropriate.
We used both a voxel-based whole-brain and an ROI analysis, the former to ensure we captured all regional group differences and the latter to allow for hypothesis-driven exploration of our dataset. For the ROI analysis, we selected cortical regions where the effect size of the differences between BD patients and healthy controls was >0.3 based on our previous meta-analysis (Kempton et al., 2008). As 15 relatives were diagnosed with MDD, we selected the hippocampus as an additional ROI, based on meta-analytic evidence for reduced hippocampal volume in MDD (approximate effect size = −0.35) (Campbell et al., 2004; Videbech and Ravnkilde, 2004). Effect sizes <0.3 are considered minimal and of questionable biological significance. Both for the VBM and ROI analysis we first examined the effect of group (BD patients, all relatives, controls) to maintain compatibility with the approach used in all other studies of relatives of BD patients; any significant results were then further analyzed with respect to diagnosis (BD patients, MDD relatives, healthy relatives, controls).
Voxel-based whole-brain analysis.
We used an analysis of covariance (ANCOVA) model in SPM with TIV as a covariate to examine the effect of group (BD patients, relatives, controls) on regional gray matter volume. Suprathreshold clusters were identified using a threshold of p < 0.001 (uncorrected) (Thirion et al., 2007) with a cluster threshold of ≥5, and MNI coordinates produced by SPM5 were converted to Talairach coordinates (Duncan et al., 2000). In regions where there were significant group differences, we used MarsBaR (Brett et al., 2002) to extract gray matter volumes from each subject; these were subsequently used in an ANCOVA model implemented in SPSS 15.0, to investigate potential differences between BD patients (n = 30), relatives with no Axis I or II disorders (n = 28), MDD relatives (n = 14), and controls (n = 52). TIV was used as a covariate and post hoc pairwise comparisons used Bonferroni correction.
Region of interest analysis.
There were five regions that met our selection criterion: the amygdala, the anterior cingulate [Brodmann area 24 (BA24)/BA32], the posterior cingulate (BA23), subgenual prefrontal cortex (BA25), and hippocampus. ROIs were created with the WFU Pick Atlas toolbox (Maldjian et al., 2003) and nonsmoothed gray matter volumes were extracted with the Marsbar toolbox for further analyses in SPSS 15.0. Initially we examined the effect of group (BD patients, relatives, controls) in an ANCOVA model with TIV as a covariate. Regions were further analyzed to examine the effect of diagnosis (BD patients, relatives without Axis I disorders, MDD relatives, controls).
We also conducted two subanalyses: (1) We explored the effect of lithium and antipsychotic medication on brain structure in BD patients only. We used two multivariate ANOVAs with medication status (lithium vs nonlithium or antipsychotic vs nonantipsychotics) as independent factors, volume of the three brain regions identified via the VBM analysis as dependent variables, and TIV as a nuisance covariate. (2) Using a whole-brain VBM analysis, we examined potential differences between siblings and offspring, since the latter have a theoretical higher risk for developing BD by virtue of their younger mean age. In this analysis, age was entered as an additional covariate, as it was significantly different between siblings and offspring.
Results
BD patients, their relatives, and controls were matched for age, gender, and educational level (p > 0.13 for all comparisons, Table 1). Although the level of symptomatology in the sample was very low (range of BPRS scores was 24–39), BD patients had higher scores than their relatives (regardless of diagnosis) and healthy controls (both comparisons p < 0.003). No other comparisons were significant.
VBM whole-brain analysis
We identified a main effect of group (BD patients, all relatives, controls) on gray matter volume in the left insula (Talairach coordinates −44, −40, 19, BA13, Z-score = 3.40, cluster size = 17), left cerebellum (Talairach coordinates −2, −85, −26, Z-score = 3.32, cluster size = 23 voxels), and left substantia nigra (Talairach coordinates −18, −18, −4, Z-score = 3.32, cluster size = 9) (Fig. 2).
Figure 2.

Significant group differences in gray matter volume between BD patients, their relatives, and controls were observed in the left insula, left cerebellum, and left substantia nigra (p < 0.01 uncorrected). Images were created with MRIcro, for illustration purposes.
Structural changes associated with familial predisposition to BD regardless of clinical phenotype (i.e., present in BD patients, MDD relatives, and healthy relatives) were seen in the left insula. Compared with controls, the mean volume of the left insula was statistically higher in BD patients (p = 0.008, Cohen's d = 0.6), MDD relatives (p = 0.088, d = 0.73), and healthy relatives (p = 0.013, d = 0.86), while all other pairwise comparisons were nonsignificant (all p = 1, d = 0.09–0.23).
Structural changes uniquely associated with the clinical phenotype of BD were observed in the substantia nigra. The mean volume of this region was higher in BD patients compared with healthy controls (p = 0.04, d = 0.39), MDD relatives (p = 0.01, d = 0.59), and healthy relatives (p = 0.007, d = 0.35). All other pairwise comparisons were not statistically significant (all p = 1, d = 0.07–0.37).
Structural changes uniquely associated with the absence of a clinical diagnosis in relatives were present in the left cerebellum. In this region, healthy relatives had higher mean volumes compared with healthy controls (all p = 0.004, d = 0.90) and with BD patients (p = 0.005, d = 0.98), while MDD relatives and BD patients did not differ from each other or controls (p > 0.26, d = 0.09–0.63).
Multivariate ANOVA showed no effect of lithium (F(3,25) = 1.9, p = 0.15) or antipsychotics (F(3,23) = 1.22, p = 0.32) on brain structure in BD patients. Within the group of relatives, multivariate analysis showed no significant volumetric difference between siblings (n = 23) and offspring (n = 27), in the gray matter regions identified in the VBM analysis (F(3,44) = 2.0, p = 0.13).
In BD patients, we examined correlations between age of onset, age of first manic and first depressive episode, illness duration, and the volume of the three regions identified from the whole-brain analysis. We also examined correlations between BPRS scores and the volume of the three regions identified from the whole-brain analysis in BD patients and MDD relatives. None of these correlations were significant (all p > 0.01, which was above the Bonferroni corrected threshold of p < 0.001). We note, however, the correlation between the volume of the substantia nigra and age at first manic episode (r = 0.47, p = 0.03) as well as age of onset (r = 0.44, p = 0.02), which supports the notion that this region is uniquely implicated in mania.
ROI analysis
No significant differences were identified in the cortical regions selected from the meta-analysis between BD patients, their relatives and controls (p > 0.12, partial η2 range = 0.001–0.032). Similarly, examination of potential group differences between BD patients, MDD relatives, healthy relatives, and controls did not yield any significant results (p > 0.13, partial η2 range = 0.005–0.045).
Discussion
We found that (1) increased volume of the left insula was associated with genetic preposition to BD, regardless of phenotype; (2) larger volume of the left substantia nigra was associated with the clinical phenotype of BD; and (3) increased left cerebellar (vermal) volume may be a potential indicator of resilience. There were no group differences in the volume of any of the preselected ROIs in the cingulate cortex, amygdala, and hippocampus.
Brain structural changes associated with genetic predisposition to BD
In this study, increased insular volume was associated with genetic predisposition to BD but not with disease expression. Increased left insular volume in BD patients has also been reported by Lochhead et al. (2004) in their sample of BD patients who had been medication free for 14 d when scanned. Although changes in the volume of the insula in relatives have not been previously reported our finding resonates with reports of increased insular activation in BD patients and their healthy relatives during sad affective induction (Krüger et al., 2006). The insula is integral to the network of brain regions involved in emotional recall and self-generation of affect (Dolan, 2002; Phan et al., 2002) regardless of valence (Reiman et al., 1997; Damasio et al., 2000). In addition, due to its connections to the cingulate cortex and the brainstem, the insula is considered important in maintaining homeostasis and in representing internal emotional states (Reiman et al., 1997; Damasio et al., 2000). In this context, changes in insular volume could be interpreted as a marker of emotional dysregulation associated with the genetic diathesis to BD.
Brain structural changes associated with the diagnosis of BD
Patients with BD had larger volumes within the substantia nigra than all other groups. Although unexpected, this finding is supported by the association between the volume of the substantia nigra and age at first manic episode (as well as age at onset). Mania has been described as a hyperdopaminergic state (Berk et al., 2007) and the association between the changes in substantia nigra and manic symptoms may be mediated by the high concentration of D2 receptors in this region. This was substantiated by Basselin et al. (2006), who demonstrated that lithium reduced D2-like-receptor-initiated signaling in a number of brain regions, including the substantia nigra. Additionally, genetic expression studies have linked the vesicular monoamine transporter gene, which is associated with BD, to the substantia nigra, where it is expressed at higher levels than any other brain region (Lohoff et al., 2006). Thus our results suggest a link between brain structural and dopaminergic changes associated with mania. McGuffin et al. (2003) have previously proposed that despite substantial genetic correlation between depression and mania, ∼71% of the genetic liability to mania was distinct from that to depression. One could argue that the increased volume of the substantia nigra reported here may represent a brain morphological expression of these distinct processes associated with syndromal expression of mania.
Brain structural changes associated with resilience
The finding of increased cerebellar (vermal) volume in healthy relatives of BD patients compared with all other groups was unexpected, particularly since cerebellar involvement is not a prominent feature of BD (Kempton et al., 2008) despite early reports of cerebellar atrophy in BD (Nasrallah et al., 1981, 1982).
However, current models of cerebellar function highlight its “homeostatic” role in affective processing independent of motor control (Schmahmann and Caplan, 2006); in humans, activations within midcerebellar regions have been associated with the experience of primal emotions engendered by changes in interoceptive conditions or vegetative functions (Parsons et al., 2000; Craig, 2002; Singer et al., 2004). Animal lesion and stimulation studies suggest cerebellar involvement in the control of autonomic and metabolic functions as well as behavior (Reis and Golanov, 1997). Based on this evidence, it is proposed that the cerebellum monitors the acquisition of sensory information and forms models representing the internal state of the organism; these are then used for the adaptive control of complex behavior in concert with higher cortical regions (Schmahmann, 2004; Ramnani, 2006). Considered in this context, it is plausible that the larger vermal volume seen in healthy relatives may indicate improved affective regulation and hence resilience to disease expression. Alternatively it is possible that another yet unidentified latent factor is associated both with resilience and increased cerebellar volume.
ROI analysis
We did not find any significant statistical difference between BD patients, relatives, and controls in any of the preselected ROIs. We wanted to exclude the possibility that this finding was due to potentially atypical features of our sample. As the literature regarding differences between relatives of BD patients and controls is very limited, we focused our examination on the effect size of differences between BD patients and controls, for which there is a substantial body of evidence. The Cohen's effect sizes observed for the preselected ROIs ranged from 0.01 to 0.23, which is in line with the range previously reported in individual studies (see www.bipolardatabase.org for details). Based on power calculations, group sizes ranging from 298 to 156,979 would be required for sufficient power to detect these differences. At the same time, if the effect size of 1.17 (as reported in our meta-analysis) for the left anterior cingulate was a consistent feature of BD, then a sample size of 13 per group would have been sufficient.
Conclusions
Although BD is highly heritable (Cardno et al., 1999), the spectrum of behavioral and psychiatric abnormalities associated with predisposition to BD is very wide (Sadovnick et al., 1994). The biological mechanisms that translate genetic predisposition to BD-I into specific clinical outcomes are still unclear. Shared brain morphological changes in BD, MDD, and healthy relatives are likely to reflect processes that confer vulnerability to affective morbidity. In this study, increased volume of the left insula appeared to be such a marker of vulnerability. In contrast, abnormalities observed in individuals with BD or MDD but not their healthy relatives are probably associated with genetic or nongenetic factors involved in disease expression or its treatment. We did not find any brain structural changes associated with MDD, but a personal history of mania, the diagnostic hallmark of BD, was associated with increased volume in the substantia nigra. Finally, increased left vermal volume was associated with absence of syndromal disease expression. While we found dissociable brain structural changes in BD associated with genetic predisposition, disease expression, and resilience, prospective studies are needed to determine their predictive validity.
Footnotes
We are grateful to all the participants who took part in this study.
References
- Ashburner J, Friston KJ. Unified segmentation. Neuroimage. 2005;26:839–851. doi: 10.1016/j.neuroimage.2005.02.018. [DOI] [PubMed] [Google Scholar]
- Basselin M, Chang L, Bell JM, Rapoport SI. Chronic lithium chloride administration attenuates brain NMDA receptor-initiated signaling via arachidonic acid in unanesthetized rats. Neuropsychopharmacology. 2006;31:1659–1674. doi: 10.1038/sj.npp.1300920. [DOI] [PubMed] [Google Scholar]
- Berk M, Dodd S, Kauer-Sant'anna M, Malhi GS, Bourin M, Kapczinski F, Norman T. Dopamine dysregulation syndrome: implications for a dopamine hypothesis of bipolar disorder. Acta Psychiatr Scand Suppl. 2007;2007:41–49. doi: 10.1111/j.1600-0447.2007.01058.x. [DOI] [PubMed] [Google Scholar]
- Brett M, Anton J, Valabregue R, Poline JB. Region of interest analysis using an SPM toolbox [abstract]. Presented at the 8th International Conference on Functional Mapping of the Human Brain; June; Sendai, Japan. 2002. [Google Scholar]
- Campbell S, Marriott M, Nahmias C, MacQueen GM. Lower hippocampal volume in patients suffering from depression: a meta-analysis. Am J Psychiatry. 2004;161:598–607. doi: 10.1176/appi.ajp.161.4.598. [DOI] [PubMed] [Google Scholar]
- Cardno AG, Marshall EJ, Coid B, Macdonald AM, Ribchester TR, Davies NJ, Venturi P, Jones LA, Lewis SW, Sham PC, Gottesman II, Farmer AE, McGuffin P, Reveley AM, Murray RM. Heritability estimates for psychotic disorders: the Maudsley twin psychosis series. Arch Gen Psychiatry. 1999;56:162–168. doi: 10.1001/archpsyc.56.2.162. [DOI] [PubMed] [Google Scholar]
- Craig AD. How do you feel? Interoception: the sense of the physiological condition of the body. Nat Rev Neurosci. 2002;3:655–666. doi: 10.1038/nrn894. [DOI] [PubMed] [Google Scholar]
- Damasio AR, Grabowski TJ, Bechara A, Damasio H, Ponto LL, Parvizi J, Hichwa RD. Subcortical and cortical brain activity during the feeling of self-generated emotions. Nat Neurosci. 2000;3:1049–1056. doi: 10.1038/79871. [DOI] [PubMed] [Google Scholar]
- Dolan RJ. Emotion, cognition, and behavior. Science. 2002;298:1191–1194. doi: 10.1126/science.1076358. [DOI] [PubMed] [Google Scholar]
- Duncan J, Seitz RJ, Kolodny J, Bor D, Herzog H, Ahmed A, Newell FN, Emslie H. A neural basis for general intelligence. Science. 2000;289:457–460. doi: 10.1126/science.289.5478.457. [DOI] [PubMed] [Google Scholar]
- First MB, Gibbon M, Spitzer RL, Williams JBW, Benjamin LS. Washington, DC: American Psychiatric; 1997. Structured clinical interview for DSM-IV Axis II personality disorders (SCID-II) [Google Scholar]
- First MB, Spitzer RL, Gibbon M, Williams JBW. New York: Biometrics Research, New York State Psychiatric Institute; 2001. Structured clinical interview for DSM-IV-TR Axis I disorders, research version, patient edition (SCID-I/P) [Google Scholar]
- Good CD, Johnsrude IS, Ashburner J, Henson RN, Friston KJ, Frackowiak RS. A voxel-based morphometric study of ageing in 465 normal adult human brains. Neuroimage. 2001;14:21–36. doi: 10.1006/nimg.2001.0786. [DOI] [PubMed] [Google Scholar]
- Hajek T, Gunde E, Bernier D, Slaney C, Propper L, Grof P, Macqueen G, Duffy A, Alda M. Subgenual cingulate volumes in affected and unaffected offspring of bipolar parents. J Affect Disord. 2008;108:263–269. doi: 10.1016/j.jad.2007.10.024. [DOI] [PMC free article] [PubMed] [Google Scholar]
- Hamilton M. A rating scale for depression. J Neurol Neurosurg Psychiatry. 1960;23:56–62. doi: 10.1136/jnnp.23.1.56. [DOI] [PMC free article] [PubMed] [Google Scholar]
- Kempton MJ, Geddes JR, Ettinger U, Williams SC, Grasby PM. Meta-analysis, database, and meta-regression of 98 structural imaging studies in bipolar disorder. Arch Gen Psychiatry. 2008;65:1017–1032. doi: 10.1001/archpsyc.65.9.1017. [DOI] [PubMed] [Google Scholar]
- Krüger S, Alda M, Young LT, Goldapple K, Parikh S, Mayberg HS. Risk and resilience markers in bipolar disorder: brain responses to emotional challenge in bipolar patients and their healthy siblings. Am J Psychiatry. 2006;163:257–264. doi: 10.1176/appi.ajp.163.2.257. [DOI] [PubMed] [Google Scholar]
- Ladouceur CD, Almeida JR, Birmaher B, Axelson DA, Nau S, Kalas C, Monk K, Kupfer DJ, Phillips ML. Subcortical gray matter volume abnormalities in healthy bipolar offspring: potential neuroanatomical risk marker for bipolar disorder? J Am Acad Child Adolesc Psychiatry. 2008;47:532–539. doi: 10.1097/CHI.0b013e318167656e. [DOI] [PMC free article] [PubMed] [Google Scholar]
- Lochhead RA, Parsey RV, Oquendo MA, Mann JJ. Regional brain gray matter volume differences in patients with bipolar disorder as assessed by optimized voxel-based morphometry. Biol Psychiatry. 2004;55:1154–1162. doi: 10.1016/j.biopsych.2004.02.026. [DOI] [PubMed] [Google Scholar]
- Lohoff FW, Dahl JP, Ferraro TN, Arnold SE, Gallinat J, Sander T, Berrettini WH. Variations in the vesicular monoamine transporter 1 gene (VMAT1/SLC18A1) are associated with bipolar i disorder. Neuropsychopharmacology. 2006;31:2739–2747. doi: 10.1038/sj.npp.1301196. [DOI] [PMC free article] [PubMed] [Google Scholar]
- Maldjian JA, Laurienti PJ, Kraft RA, Burdette JH. An automated method for neuroanatomic and cytoarchitectonic atlas-based interrogation of fMRI data sets. Neuroimage. 2003;19:1233–1239. doi: 10.1016/s1053-8119(03)00169-1. [DOI] [PubMed] [Google Scholar]
- Maxwell ME. Bethesda, MD: Clinical Neurogenetics Branch, Intramural Research Program, National Institute of Mental Health; 1992. Family interview for genetic studies (FIGS): manual for FIGS. [Google Scholar]
- McDonald C, Bullmore ET, Sham PC, Chitnis X, Wickham H, Bramon E, Murray RM. Association of genetic risks for schizophrenia and bipolar disorder with specific and generic brain structural endophenotypes. Arch Gen Psychiatry. 2004;61:974–984. doi: 10.1001/archpsyc.61.10.974. [DOI] [PubMed] [Google Scholar]
- McDonald C, Marshall N, Sham PC, Bullmore ET, Schulze K, Chapple B, Bramon E, Filbey F, Quraishi S, Walshe M, Murray RM. Regional brain morphometry in patients with schizophrenia or bipolar disorder and their unaffected relatives. Am J Psychiatry. 2006;163:478–487. doi: 10.1176/appi.ajp.163.3.478. [DOI] [PubMed] [Google Scholar]
- McGuffin P, Rijsdijk F, Andrew M, Sham P, Katz R, Cardno A. The heritability of bipolar affective disorder and the genetic relationship to unipolar depression. Arch Gen Psychiatry. 2003;60:497–502. doi: 10.1001/archpsyc.60.5.497. [DOI] [PubMed] [Google Scholar]
- McIntosh AM, Job DE, Moorhead TW, Harrison LK, Forrester K, Lawrie SM, Johnstone EC. Voxel-based morphometry of patients with schizophrenia or bipolar disorder and their unaffected relatives. Biol Psychiatry. 2004;56:544–552. doi: 10.1016/j.biopsych.2004.07.020. [DOI] [PubMed] [Google Scholar]
- McIntosh AM, Job DE, Moorhead WJ, Harrison LK, Whalley HC, Johnstone EC, Lawrie SM. Genetic liability to schizophrenia or bipolar disorder and its relationship to brain structure. Am J Med Genet B Neuropsychiatr Genet. 2006;141B:76–83. doi: 10.1002/ajmg.b.30254. [DOI] [PubMed] [Google Scholar]
- Nasrallah HA, Jacoby CG, McCalley-Whitters M. Cerebellar atrophy in schizophrenia and mania. Lancet. 1981;1:1102. doi: 10.1016/s0140-6736(81)92266-2. [DOI] [PubMed] [Google Scholar]
- Nasrallah HA, McCalley-Whitters M, Jacoby CG. Cerebral ventricular enlargement in young manic males. A controlled CT study. J Affect Disord. 1982;4:15–19. doi: 10.1016/0165-0327(82)90014-3. [DOI] [PubMed] [Google Scholar]
- Noga JT, Vladar K, Torrey EF. A volumetric magnetic resonance imaging study of monozygotic twins discordant for bipolar disorder. Psychiatr Res. 2001;106:25–34. doi: 10.1016/s0925-4927(00)00084-6. [DOI] [PubMed] [Google Scholar]
- Overall JE, Gorham DR. The brief psychiatric rating scale. Psychol Rep. 1962;10:799–812. [Google Scholar]
- Parsons LM, Denton D, Egan G, McKinley M, Shade R, Lancaster J, Fox PT. Neuroimaging evidence implicating cerebellum in support of sensory/cognitive processes associated with thirst. Proc Natl Acad Sci U S A. 2000;97:2332–2336. doi: 10.1073/pnas.040555497. [DOI] [PMC free article] [PubMed] [Google Scholar]
- Phan KL, Wager T, Taylor SF, Liberzon I. Functional neuroanatomy of emotion: a meta-analysis of emotion activation studies in PET and fMRI. Neuroimage. 2002;16:331–348. doi: 10.1006/nimg.2002.1087. [DOI] [PubMed] [Google Scholar]
- Ramnani N. The primate cortico-cerebellar system: anatomy and function. Nat Rev Neurosci. 2006;7:511–522. doi: 10.1038/nrn1953. [DOI] [PubMed] [Google Scholar]
- Reiman EM, Lane RD, Ahern GL, Schwartz GE, Davidson RJ, Friston KJ, Yun LS, Chen K. Neuroanatomical correlates of externally and internally generated human emotion. Am J Psychiatry. 1997;154:918–925. doi: 10.1176/ajp.154.7.918. [DOI] [PubMed] [Google Scholar]
- Reis DJ, Golanov EV. Autonomic and vasomotor regulation. In: Schmahmann JD, editor. The cerebellum and cognition. New York: Academic; 1997. pp. 122–151. [Google Scholar]
- Sadovnick AD, Remick RA, Lam R, Zis AP, Yee IM, Huggins MJ, Baird PA. Mood Disorder Service Genetic Database: morbidity risks for mood disorders in 3,942 first-degree relatives of 671 index cases with single depression, recurrent depression, bipolar I, or bipolar II. Am J Med Genet. 1994;54:132–140. doi: 10.1002/ajmg.1320540208. [DOI] [PubMed] [Google Scholar]
- Schmahmann JD. Disorders of the cerebellum: ataxia, dysmetria of thought, and the cerebellar cognitive affective syndrome. J Neuropsychiatry Clin Neurosci. 2004;16:367–378. doi: 10.1176/jnp.16.3.367. [DOI] [PubMed] [Google Scholar]
- Schmahmann JD, Caplan D. Cognition, emotion and the cerebellum. Brain. 2006;129:290–292. doi: 10.1093/brain/awh729. [DOI] [PubMed] [Google Scholar]
- Shih RA, Belmonte PL, Zandi PP. A review of the evidence from family, twin and adoption studies for a genetic contribution to adult psychiatric disorders. Int Rev Psychiatry. 2004;16:260–283. doi: 10.1080/09540260400014401. [DOI] [PubMed] [Google Scholar]
- Singer T, Seymour B, O'Doherty J, Kaube H, Dolan RJ, Frith CD. Empathy for pain involves the affective but not sensory components of pain. Science. 2004;303:1157–1162. doi: 10.1126/science.1093535. [DOI] [PubMed] [Google Scholar]
- Thirion B, Pinel P, Mériaux S, Roche A, Dehaene S, Poline JB. Analysis of a large fMRI cohort: statistical and methodological issues for group analyses. Neuroimage. 2007;35:105–120. doi: 10.1016/j.neuroimage.2006.11.054. [DOI] [PubMed] [Google Scholar]
- Videbech P, Ravnkilde B. Hippocampal volume and depression: a meta-analysis of MRI studies. Am J Psychiatry. 2004;161:1957–1966. doi: 10.1176/appi.ajp.161.11.1957. [DOI] [PubMed] [Google Scholar]
- Wechsler D. New York: Psychological Corporation; 1981. Wechsler adult intelligence scale-revised (WAIS-R) manual. [Google Scholar]
- Young RC, Biggs JT, Ziegler VE, Meyer DA. A rating scale for mania: reliability, validity and sensitivity. Br J Psychiatry. 1978;133:429–435. doi: 10.1192/bjp.133.5.429. [DOI] [PubMed] [Google Scholar]