

Abstract
Individual patterns of the electroencephalogram (EEG) in wakefulness and sleep are among the most heritable traits in humans, yet distinct genetic and neurochemical mechanisms underlying EEG phenotypes are largely unknown. A functional polymorphism in the gene encoding catechol-O-methyltransferase (COMT), an enzyme playing an important role in cortical dopamine metabolism, causes a common substitution of methionine (Met) for valine (Val) at codon 158 of COMT protein. Val allele homozygotes exhibit higher COMT activity and lower dopaminergic signaling in prefrontal cortex than Met/Met homozygotes. Evidence suggests that this polymorphism affects executive functions in healthy individuals. We hypothesized that it also modulates functional aspects of EEG in wakefulness and sleep. EEG recordings were conducted twice on separate occasions in 10 Val/Val and 12 Met/Met allele carriers (all men) in wakefulness, and in baseline and recovery sleep before and after 40 h prolonged waking. During sleep deprivation, subjects received placebo and modafinil in randomized, cross-over manner. We show that the Val158Met polymorphism predicts stable and frequency-specific, interindividual variation in brain α oscillations. α peak frequency in wakefulness was 1.4 Hz slower in Val/Val genotype than in Met/Met genotype. Moreover, Val/Val allele carriers exhibited less 11–13 Hz activity than Met/Met homozygotes in wakefulness, rapid-eye-movement (REM) sleep, and non-REM sleep. This difference was resistant against the effects of sleep deprivation and modafinil. The data demonstrate that mechanisms involving COMT contribute to interindividual differences in brain α oscillations, which are functionally related to executive performance such as counting tendency on a random number generation task in young adults.
Introduction
With the electroencephalogram (EEG) brain electric activity can be measured repeatedly and with high temporal resolution. Distinct EEG patterns in healthy individuals such as resting activity in the α range (∼8–13 Hz) are genetically determined with heritability estimates of up to 90% (van Beijsterveldt et al., 1996). Individual differences in EEG α activity may be related to interindividual differences in cognitive functions (Klimesch, 1999).
A normal variation of the EEG is the low-voltage α (LVA) trait characterized by absence (or clear reduction) of a pronounced α rhythm in wakefulness (Vogel, 1970). Early linkage studies identified a genetic locus on chromosome 20q contributing to the LVA trait (Anokhin et al., 1992). In addition, a functional polymorphism in the gene encoding catechol-O-methyltransferase (COMT) leading to a Val158Met amino-acid substitution was also associated with an LVA phenotype (Enoch et al., 2003). This polymorphism causes drastic reduction in enzymatic activity of COMT protein in prefrontal cortex (Chen et al., 2004), enhances dopamine D1 receptors availability in corticolimbic structures (Slifstein et al., 2008), and modifies gray matter volume in hippocampus and dorsolateral prefrontal cortex (Honea et al., 2009).
Not only the waking EEG, but also the sleep EEG shows distinct trait-like, interindividual differences (Buckelmüller et al., 2006; Tinguely et al., 2006). The magnitude of these differences is even larger than the pronounced effects of prolonged wakefulness (Tucker et al., 2007). Sleep deprivation increases sleep pressure and gives rise to reliable, state-specific EEG changes in waking and sleep (Borbély and Achermann, 2005). Independent of sleep pressure, heritability in the 8–16 Hz EEG band in non-rapid-eye-movement (non-REM) sleep may be as high as 96% (De Gennaro et al., 2008). This finding corroborates the notion that the sleep EEG is one of the most heritable traits in humans.
Only two studies are currently available that examined the effects of allelic variation in candidate genes on both the waking and sleep EEG. A distinct 1083T>C polymorphism in the adenosine A2A receptor gene (ADORA2A) alters EEG activity in the 7–10 Hz range independently of vigilance/sleep state (Rétey et al., 2005). In contrast, a functional 22G>A substitution in the adenosine deaminase gene (ADA) and a variable-number tandem-repeat (VNTR) polymorphism in the PERIOD3 gene (PER3) affect the EEG primarily in the θ/α range (∼4–11 Hz) in wakefulness and REM sleep, and in the δ range (∼0.5–2 Hz) in non-REM sleep (Rétey et al., 2005; Viola et al., 2007).
Here, we examined the effects of the functional Val158Met polymorphism of COMT on waking and sleep EEG, and whether they are modulated by sleep deprivation and the stimulant modafinil. We found in Val/Val homozygotes compared with Met/Met homozygotes that individual α peak frequency in waking is slower, and EEG activity specifically in the 11–13 Hz range is reduced independently of vigilance/sleep state. The variation in upper-α activity is present in baseline and after sleep deprivation, and, in baseline wakefulness, inversely related to a measure of executive function. The data demonstrate that genetic variation of COMT predicts robust interindividual differences in functional aspects of the EEG. They suggest that mechanisms involving dopamine contribute to brain α oscillations in wakefulness and sleep.
Materials and Methods
Study participants.
The study protocol and all experimental procedures were reviewed and approved by the local ethics committees for research on human subjects, and performed in accordance with the Declaration of Helsinki.
Recruitment and demographic characteristics of study participants, genetic analyses, and all pre-experimental and experimental procedures are described in a previous report (Bodenmann et al., 2009). In brief, 88 respondents to public advertisements looking for participants in this study were genotyped for the Val158Met single nucleotide polymorphism of COMT (NCBI SNP-ID: rs4680). Twenty-two young men were prospectively selected based on their genotypes, 10 homozygous Val/Val allele carriers and 12 homozygous Met/Met allele carriers. Because COMT enzyme activity differs between male and female individuals and is downregulated by estrogen (Boudíková et al., 1990; Jiang et al., 2003), only men were studied. They were matched for age, body-mass-index, trait anxiety, subjective daytime sleepiness, and diurnal preference (Bodenmann et al., 2009). All were nonsmokers and moderate consumers of alcohol and caffeine (Bodenmann et al., 2009). They reported having no medical history of neurological and psychiatric disease, being in good health and not taking any medication or having consumed illicit drugs at least 2 months before the study. Questionnaires revealed that they were good sleepers with regular bedtimes and had no subjective sleep disturbances. After reception of written informed consent, they were polysomnographically screened in the sleep laboratory to exclude poor sleep efficiency and unrecognized sleep disorders, such as sleep apnea and nocturnal myoclonus.
Pre-experimental procedures.
During 2 weeks before the study, participants were asked to abstain from all sources of caffeine, to wear a wrist activity monitor on the nondominant arm, and to keep a sleep-wake and caffeine diary. For 3 d before and during the experiment, they were instructed to abstain from alcohol and to maintain regular 8 h sleep/16 h wake cycles. Bed times were scheduled from 12:00 A.M. to 8:00 A.M. The timing of bed and rise times was not allowed to deviate for >1 h from these times. Compliance with these instructions was verified by inspection of rest-activity plots and sleep-wake diaries. After arrival in the sleep laboratory, saliva samples for caffeine determination were taken, and the breath ethanol concentration was measured.
Study protocol.
Each subject performed two experimental blocks separated by 1 week. Each block consisted of 4 nights and 2 d in the sleep laboratory. After two consecutive 8 h sleep recordings (adaptation and baseline nights: 12:00 A.M.–8:00 A.M.), subjects were kept awake for 40 h (constant supervision by members of the research team). During sleep deprivation, two doses of 100 mg of modafinil and placebo were administered to each subject in randomized, double-blind, cross-over manner. The first dose was given 11 h (at 7:00 P.M.) and the second dose 23 h (at 7:00 A.M.) after waking from the baseline night. A 10 h recovery night (12:00 A.M.–10:00 A.M.) concluded each experimental block.
Waking EEG.
The waking EEG was recorded intermittently in 14 sessions at 3 h intervals. The first recording started 15 min after lights-on from the baseline nights. To record the waking EEG, the participants were instructed to relax comfortably in a chair and to place their chin on an individually adjusted head-rest. Each recording consisted of a 3 min period with eyes closed, followed by a 5 min period with eyes open while fixating a black dot at a distance of 3 m attached to the wall. When signs of drowsiness were detected (e.g., reduced EEG α activity or rolling eye movements), subjects were alerted by addressing them over the intercom. One hour before each waking EEG, subjects had to stay in the laboratory (constant temperature, light intensity <150 lux), and 15 min before all recordings they were by themselves in their bedroom. The bioelectric signals [including EEG, bipolar electrooculogram (EOG), mental electromyogram (EMG), and electrocardiogram (ECG)] were recorded with Rembrandt Datalab (Version 8; Embla Systems) and the polygraphic amplifier Artisan (Micromed). Analog signals were conditioned by a high-pass filter (EEG: −3 dB at 0.15 Hz; EMG: 10 Hz; ECG: 1 Hz) and an antialiasing low-pass filter (-3 dB at 67.2 Hz), digitized and transmitted via fiber-optic cables to a personal computer. Data were sampled with a frequency of 256 Hz.
The EEG signal was recorded from 1 referential (C3A2) and 8 bipolar derivations along the left and right anteroposterior axes. Artifacts in all derivations were visually identified (< 1% of all data had to be excluded). The power spectra (Fast Fourier Transform, Hanning window) of artifact-free, 50%-overlapping 2 s epochs were computed with MATLAB (The MathWorks). To compute anteroposterior power gradients, the spectral values between 0 and 20 Hz (0.5 Hz resolution) were averaged over homologous frontocentral (F3C3 and F4C4), centroparietal (C3P3 and C4P4), and parieto-occipital (P3O1 and P4O2) derivations. The mean power spectra of the 5 min periods with eyes open are reported. To compare the waking EEG in baseline and after sleep deprivation, mean values recorded at 8:00 A.M., 11:00 A.M., 2:00 P.M., and 5:00 P.M. on Day 1 and 2, respectively, of prolonged waking were analyzed.
Determination of α peak frequency.
To determine individual α peak frequency in the waking EEG, the recordings at 8:00 A.M., 11:00 A.M., 2:00 P.M., and 5:00 P.M. of Day 1 of prolonged waking were averaged for each subject and experimental condition (placebo and modafinil). Representative 5 s epochs of Fourier bandpass (6–12 Hz) filtered EEG in two individuals with Val/Val and Met/Met genotype in wakefulness are illustrated in Figure 1A. The frequency bin with maximal power between 6 and 12 Hz was visually determined from the average spectra (0.5 Hz resolution).
Figure 1.

Val158Met genotype of COMT predicts α peak frequency in waking EEG. A, Representative 5 s examples of bandpass (6–12 Hz) filtered EEG traces in wakefulness in two matched individuals with Val/Val and Met/Met genotype (C3A2-derivation). The traces were selected from the waking EEG recording at 14:00 h on day 1 of prolonged waking in the first experimental week. Different dominant frequencies in α bursts are apparent. B, α peak frequency was defined in each individual as the frequency bin with maximum power between 6 and 12 Hz (C3A2-derivation; average of 5 min waking EEG recordings at 0.25, 3, 6, and 9 h waking; 0.5 Hz resolution). Data represent means + SEM in Val/Val (open and filled black bars, n = 9) and Met/Met (open and filled gray bars, n = 12) genotypes. α peak frequency was highly stable within COMT genotype (Val/Val: placebo condition, 8.6 ± 0.5 Hz, modafinil condition, 8.6 ± 0.5 Hz; Met/Met: placebo condition, 10.0 ± 0.3 Hz, modafinil condition: 10.0 ± 0.3 Hz). Two-way mixed-model ANOVA: genotype: F(1,19) = 6.75, *p < 0.02; treatment: F(1,19) = 0.74, p > 0.4; genotype × treatment: F(1,19) = 0.74, p > 0.4.
Peak frequency could not be unambiguously determined in one individual with Val/Val genotype.
Sleep EEG.
Continuous recording of EEG, EOG, EMG, and ECG was performed during all experimental nights in the same way as during wakefulness. Standard sleep stages (Rechtschaffen and Kales, 1968) were visually scored for 20 s epochs (C3A2 derivation) with Rembrandt Analysis Manager (Version 8; Embla Systems). Four second EEG spectra (FFT routine, Hanning window, 0.25 Hz resolution) of all derivations were calculated with MATLAB (The MathWorks), averaged over consecutive 5 epochs, and matched with the sleep scores. Twenty second epochs with movement- and arousal-related artifacts were visually identified and eliminated. To compute all-night power spectra in non-REM sleep (stages 1, 2, 3 and 4) and REM sleep, all artifact-free 20 s values were averaged. The values derived from homologous derivations along the anteroposterior axis were averaged over the left and right hemispheres. Non-REM and REM sleep spectra of the two baseline nights did not differ significantly and were averaged for all analyses. In recovery nights, data analysis was restricted to the first 8 h of the 10 h sleep opportunities.
Random number generation task.
Performance on a random number generation (RNG) task relies on the subjects' ability to suppress stereotyped responses such as counting and to keep track of recent responses (Miyake et al., 2000). The outcome variable “adjacency” is thought to reflect executive functioning including “inhibition” and information “updating.”
All participants completed during prolonged waking 14 sessions of an RNG task at 3 h intervals (Gottselig et al., 2006). They orally generated at each of two paces two random sequences of 225 numbers using the response alternatives 0, 1, 2, 3, 4, 5, 6, 7, 8, 9. The pace was set by a tone generated by the computer (slow pace: one number each 1800 ms; fast pace: one number each 750 ms). The slow portion of the task always preceded the fast portion. The entire task lasted for ∼10 min. Responses were recorded on a dictation machine and transcribed after completion of the study. Adjacency on the RNG is reported here. This score reflects the mean number of ascending and descending response pairs expressed as a percentage of the total number of generated response pairs at slow and fast pace. To minimize learning bias (Gottselig et al., 2006), adjacency was quantified in each individual in the first experimental RNG session occurring at 08:30 h after the baseline night in block 1 (the task was practiced once before the baseline night).
Data analysis and statistics.
EEG spectral power in wakefulness and sleep was computed for consecutive frequency bins and specific frequency bands. The bins and bands are indicated by the encompassing frequency range (i.e., the 11–13 Hz band encompasses 10.75–13.25 Hz in waking and 10.875–13.125 Hz in sleep).
Because the Val158Met polymorphism of COMT invariably affected EEG activity within the 11–13 Hz range, this report focuses on this frequency band. To estimate possible correlations between 11 and 13 Hz activity in wakefulness, REM sleep and non-REM sleep, and between upper-α activity and cognitive performance, Pearson's product–moment and Spearman rank correlation coefficients were calculated. Significant effects of genotype, elevated sleep pressure, modafinil, and EEG derivation were tested with SAS 9.1 software (SAS Institute). To approximate a normal distribution, absolute EEG power densities were log-transformed before statistical testing. Two- and three-way mixed-model ANOVA with the between-subject factor “genotype” (Val/Val vs Met/Met), the within-subject factors “condition” (baseline, SD-placebo, SD-modafinil), “treatment” (modafinil, placebo), “session” (14 assessments during prolonged waking), and “derivation” (FC, CP, PO), as well as their interactions were performed. The significance level was set at α < 0.05. Only significant effects of factors and interactions are reported. Two-tailed, paired and unpaired t tests to localize differences within and between subjects were only performed, if respective main effects or interactions of the ANOVA were significant.
Results
Val158Met polymorphism of COMT predicts difference in α peak frequency in waking EEG
Not only the presence or absence of α oscillations, but also the frequency in the waking EEG at which highest α activity occurs (“α peak frequency”) shows high interindividual variation and is strongly determined by genetic factors (Smit et al., 2005, 2006). We found that the Val158Met polymorphism of COMT predicts a difference in α peak frequency by as much as 1.4 Hz (Fig. 1). The EEG differences were restricted to the α range and invariably present in two independent baseline recordings 1 week apart. In wakefulness, centering the power spectra at each individual's peak frequency removed the genotype-dependent difference in absolute α activity (data not shown), indicating that the differences in α peak frequency and upper α power are not independent.
Val158Met polymorphism of COMT affects the EEG in frequency-specific manner
To examine whether the Val158Met polymorphism of COMT affects the EEG, baseline recordings in wakefulness, REM sleep and non-REM sleep were compared between homozygous Val/Val and Met/Met allele carriers. The brain oscillations showed the typical vigilance/sleep state-dependent modulation in both genotypes (Landolt, 2008). However, the genetic variation of COMT affected the EEG in frequency-specific manner. Thus, independent of state, the Val allele carriers invariably showed lower power than the Met allele carriers within the upper α range in wakefulness, REM sleep and non-REM sleep (Figs. 1F, 2A). On average, the α peak occurred at 8.6 ± 0.5 Hz (n = 9) in Val/Val allele carriers and at 10.0 ± 0.3 Hz (n = 12) in Met/Met allele carriers. Centering the power spectra at each individual's peak frequency removed the genotype-dependent difference in absolute α activity (data not shown), indicating that the differences in α peak frequency and upper α power are not independent.
Figure 2.

Val158Met polymorphism of COMT modulates EEG 11–13 Hz activity in wakefulness and sleep. A–C, Absolute EEG power densities (C3A2-derivation) in baseline of the placebo condition in wakefulness (A, average of 5-min recordings at 0.25, 3, 6, and 9 h waking), REM sleep (B, all-night power spectrum), and non-REM sleep (C, all-night power spectrum of stages 1–4). D–F, Corresponding values in the modafinil condition. Placebo and modafinil conditions occurred in random order, 1 week apart. Triangles at the bottom of the panels indicate frequency bins, which differed significantly between Val/Val (n = 10, black lines) and Met/Met (n = 12, gray lines) genotypes (p < 0.05, unpaired, two-tailed t tests). G–I, Relationships in 11–13 Hz activity between wakefulness and REM sleep (G), REM sleep and non-REM sleep (H), and non-REM sleep and wakefulness (I). Linear regression lines were fitted to log-transformed mean absolute power density values in homozygous Val/Val (black circles, n = 10) and Met/Met (gray triangles, n = 12) allele carriers. rp, Pearson's product–moment correlation coefficient. Very similar correlation coefficients were obtained by computing Spearman rank-correlation analyses (data not shown).
To find out whether the difference in the upper α range was inter-related between wakefulness and sleep, correlation analyses of absolute 11–13 Hz power values were performed. These analyses revealed associations between wakefulness and REM sleep (Fig. 2G), and between REM sleep and non-REM sleep (Fig. 2H). These data demonstrate that the Val158Met polymorphism of COMT predicts interindividual differences in EEG upper α power, not only in wakefulness but also in sleep, and that activity in this frequency range is correlated between wakefulness and sleep states.
Genotype-dependent difference in 11–13 Hz activity is independent of sleep pressure and modafinil
Given that α activity in the waking EEG is affected by time of day, elevated sleep pressure and the stimulant modafinil (Aeschbach et al., 1999; Dumont et al., 1999; Cajochen et al., 2002; Chapotot et al., 2003), we investigated the evolution of 11–13 Hz power in Val/Val and Met/Met genotypes during 40 h prolonged wakefulness. Upper α activity was invariably lower in Val/Val allele carriers than in Met/Met allele carriers throughout extended wakefulness (Fig. 3). Independent of genotype, 11–13 Hz activity showed a diurnal modulation (session: F(13,192) = 13.79, p < 0.0001; genotype × session: F(13,192) = 0.54, p > 0.9), and was slightly increased especially after the second dose of modafinil administration (treatment: F(1,70.5) = 11.04, p < 0.002; genotype × treatment: F(1,70.5) = 0.0, p > 0.9).
Figure 3.

Val158Met genotype of COMT predicts EEG 11–13 Hz activity in waking during 40 h prolonged wakefulness. Starting 15 min after wakening from the baseline nights, 14 waking EEG recordings at 3 h intervals were completed in each individual. Ticks on the x-axis are rounded to the nearest hour. Dashed vertical lines indicate 100 mg of modafinil or placebo administration. Val/Val genotype (n = 10): black circles, placebo condition; black dots, modafinil condition. Met/Met genotype (n = 12): gray circles, placebo condition; gray dots, modafinil condition. EEG activity in the 11–13 Hz range was consistently lower in Val/Val than Met/Met allele carriers (genotype: F(1,20) = 7.58, p = 0.012).
To further examine the effects of sleep loss and modafinil on the genotype-dependent difference in 11–13 Hz power in wakefulness, REM sleep and non-REM sleep, the EEG in baseline and after sleep deprivation was compared. Upper α activity in wakefulness at analogous times of day (Fig. 4A) and in non-REM sleep (Fig. 4C) differed among the conditions (baseline, SD-placebo, SD-modafinil). However, ANOVA disclosed no significant genotype × condition interactions (F(2,40) < 2.8, p > 0.07 in all vigilance/sleep states), indicating that COMT genotype modulates upper α activity regardless of elevated sleep pressure and modafinil intake during sleep deprivation.
Figure 4.
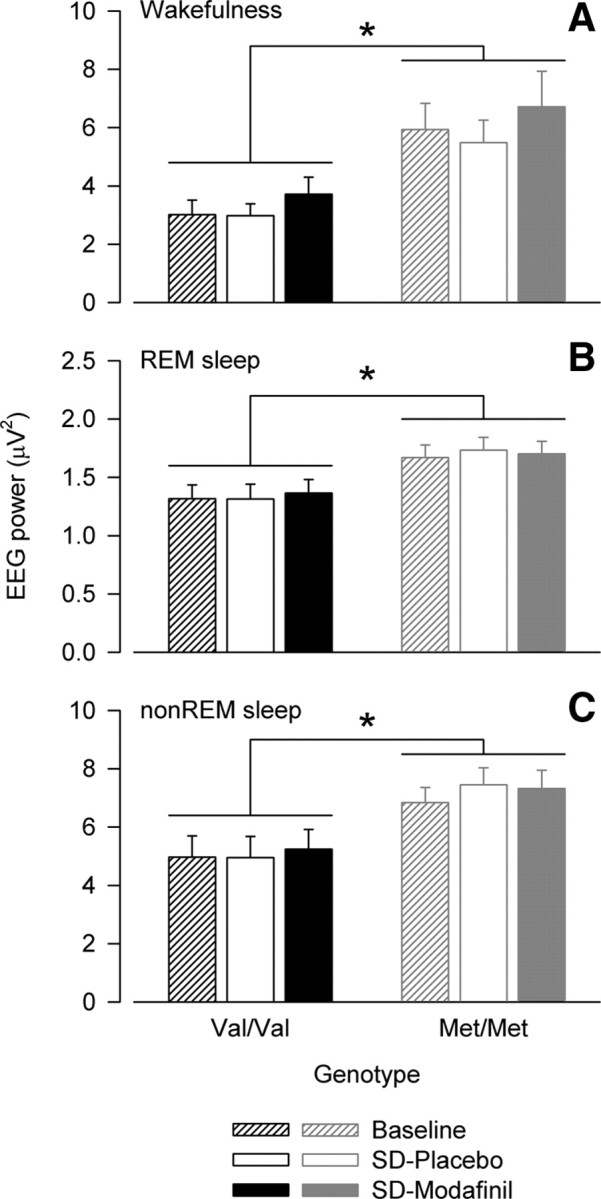
Genotype-dependent difference in 11–13 Hz activity is independent of vigilance state, sleep pressure, and modafinil. A–C, EEG activity in 11–13 Hz band in wakefulness (A), REM sleep (B), and non-REM sleep (C) (C3A2-derivation). Values in wakefulness represent an average of 5 min waking EEG recordings at 0.25, 3, 6, and 9 h waking (Baseline, mean of placebo and modafinil condition) and at 24, 27, 30, and 33 h waking with prior 2 × placebo (SD-Placebo) or 2 × 100 mg of modafinil intake (SD-Modafinil). Values in REM sleep and non-REM sleep (stages 1–4) represent all-night values in Baseline (mean of two baseline nights), and in recovery nights after 40 h prolonged wakefulness with 2 × placebo (SD-Placebo) or 2 × 100 mg of modafinil intake (SD-Modafinil). Means + SEM in Val/Val (black bars, n = 10) and Met/Met (gray bars, n = 12) genotypes. *p < 0.03 (ANOVA: genotype: F(1,20) ≥ 6.18). Activity in the 11–13 Hz range differed among the conditions in waking (condition: F(2,40) = 6.65, p < 0.004) and non-REM sleep (condition: F(2,40) = 4.82, p < 0.02).
Genotype-dependent difference in 11–13 Hz activity is independent of EEG location
Because of the regionally different expression patterns of COMT in the CNS, the Val158Met polymorphism is thought to modulate dopaminergic neurotransmission most prominently in frontal cortex (Akil et al., 2003; Chen et al., 2004). Moreover, the distribution of EEG α activity is not uniform over the scalp and differs between wakefulness and sleep (Tinguely et al., 2006). To investigate whether the genotype-dependent difference between Val/Val and Met/Met allele carriers varies with scalp location, we analyzed upper α activity in frontocentral, centroparietal, and parieto-occipital bipolar derivations. In baseline, EEG 11–13 Hz power showed posterior predominance in REM sleep (derivation: F(2,38.9) = 4.76, p < 0.02), and frontal predominance in non-REM sleep (derivation: F(2,39.6) = 30.81, p < 0.0001) (Fig. 5). The anteroposterior difference in non-REM sleep was also present in the recovery night after sleep deprivation, regardless of placebo and modafinil intake during preceding wakefulness (derivation: F(2,25.5) = 21.34, p < 0.0001 and F(2,28.6) = 38.32, p < 0.0001, respectively). The regional power distribution was independent of genotype (genotype × derivation: p > 0.25 in all vigilance/sleep states and conditions). In other words, the Val158Met polymorphism of COMT affects 11–13 Hz activity in wakefulness, REM sleep and non-REM independently of EEG location.
Figure 5.

Genotype-dependent difference in 11–13 Hz activity is independent of EEG location along the anteroposterior axis of the cortex. EEG activity in 11–13 Hz band in wakefulness (top panels), REM sleep (middle panels), and non-REM sleep (bottom panels). Values in wakefulness represent an average of 5 min waking EEG recordings at 0.25, 3, 6, and 9 h waking (Baseline, mean of placebo and modafinil condition) and at 24, 27, 30, and 33 h waking with prior 2 × placebo (SD-Placebo) or 2 × 100 mg of modafinil intake (SD-Modafinil). Values in REM sleep and non-REM sleep (stages 1–4) represent all-night values in Baseline (mean of two baseline nights), and in recovery nights after 40 h prolonged wakefulness with 2 × placebo (SD-Placebo) or 2 × 100 mg of modafinil intake (SD-Modafinil). Means + SEM in Val/Val (black bars, n = 10) and Met/Met (gray bars, n = 12) genotypes. Striped bars, Frontocentral derivation (FC). Open bars, Centroparietal derivation (CP). Filled bars, Parieto-occipital derivation (PO). EEG 11–13 Hz activity was lower in Val/Val than in Met/Met allele carriers in all vigilance states, as well as sleep pressure and treatment conditions (genotype: F(1,19.6) ≥ 5.21, p < 0.04). Values were lower in FC than CP and PO in REM sleep in baseline, and higher in FC than CP and PO in non-REM sleep regardless of sleep deprivation and drug intake (derivation: F(2,38.9) ≥ 4.76, p < 0.02). #p < 0.05, ##p < 0.01, ###p < 0.0001 (paired, two-tailed t tests).
Waking 11–13 Hz activity and RNG task performance are correlated
Previous work suggests that dopamine levels in the prefrontal cortex and the Val158Met polymorphism of COMT modulate executive functions in healthy individuals (Tunbridge et al., 2006; Diamond, 2007). In accordance with this view, Val/Val homozygotes tended to perform worse than Met/Met homozygotes on an RNG task, which requires to inhibit stereotyped responses such as counting (percentage of adjacent response pairs: 27.1 ± 2.3 vs 21.9 ± 1.4; p < 0.06, two-tailed, unpaired t test). Moreover, 11–13 Hz activity in the waking EEG and counting tendency on the RNG were negatively correlated (Fig. 6). This finding indicates that subjects with relatively higher EEG upper-α activity in rested wakefulness show relatively better performance on the RNG task.
Figure 6.

Relationship between the EEG power in the 11–13 Hz range in wakefulness and adjacency on a RNG task in homozygous Val/Val (n = 10, black dots) and Met/Met (n = 12, gray dots) allele carriers of COMT. To minimize a possible learning bias, EEG power and RNG performance in the first administration of EEG and RNG testing after the baseline night in block 1 were considered. A linear regression line was fitted through 22 individual data points. Pearson product–moment and Spearman rank correlation analyses suggest an association: rp = −0.42, p = 0.053 and rs = −0.45, p < 0.04. Note that adjacency values are plotted on an inverse scale (low adjacency, better performance; high adjacency, worse performance).
Discussion
Here we show that the functional Val158Met polymorphism of COMT predicts stable interindividual variation in brain α oscillations in wakefulness and sleep. α peak frequency in the waking EEG is 1.4 Hz lower in Val/Val genotype than in Met/Met genotype. Moreover, homozygous Val/Val allele carriers invariably exhibit less EEG power in the 11–13 Hz band than individuals with Met/Met genotype in wakefulness, REM sleep, and non-REM sleep. This difference is stable in two recordings 1 week apart and resistant against experimental interventions such as sleep deprivation and modafinil. The data support a role for COMT in modulating the generation of α oscillations in healthy men.
The importance of genetic factors for individual patterns of spontaneous waking EEG is emphasized by a large amount of findings. Twin studies suggest that individual α frequency (IAF) is genetically determined and shows high heritability (Posthuma et al., 2001; Smit et al., 2006). Our study identified the first genetic marker contributing to differences in IAF. It revealed that a functional genetic variation of COMT causes a large and stable difference in α peak frequency between two groups of homozygous Met/Met and Val/Val genotypes (Figs. 1A, 2). In addition, the genotypes also showed a robust difference in absolute upper-α activity in the 11–13 Hz range. When adjusting the power spectra with respect to each individual's α peak frequency, EEG power in θ/α range did no longer vary between the genotypes. This finding suggests that genetic influences on IAF and absolute α activity are not independent.
Although twin studies have long shown that heritability of EEG δ, θ, α, and β oscillations in waking is substantial (Stassen et al., 1987; van Beijsterveldt et al., 1996; Smit et al., 2006; Enoch et al., 2008), very little is know about the genes underlying distinct EEG traits. Early linkage analyses identified a genetic locus on the distal part of chromosome 20q to modulate α activity (Anokhin et al., 1992; Steinlein et al., 1992). It is likely, however, that multiple genes contribute to “α phenotypes,” and a few candidate genes were indeed found to affect α oscillations. One recent study indicated that the gene on chromosome 5q13-14 of corticotrophin releasing hormone-binding protein (CRH-BP) modulates α activity in isolated Plains American Indians and Caucasians (Enoch et al., 2008). Moreover, a functional variation in exon 7 of the gene on chromosome 6 encoding the human GABAB receptor (GABABR1) also influences EEG voltage in the α range (Winterer et al., 2003).
Our group previously observed that genetic variation in ADORA2A affects high-θ/low-α oscillations in frequencies encompassing the 7–9.5 Hz band (Rétey et al., 2005). Human genome sequencing has shown that this gene is located on chromosome 22q11.2, in proximity to COMT. The Val158Met polymorphism of COMT is in linkage-disequilibrium with other COMT polymorphisms and immediately flanking DNA (Mukherjee et al., 2008). It may, therefore, be more than a simple coincidence that also the Val158Met polymorphism was associated with a low-voltage α (LVA) phenotype (Enoch et al., 2003). These authors found in middle-aged women that LVA was more prevalent in Met/Met genotype than in Met/Val and Val/Val genotypes. In contrast, we observed in the present study that Met/Met allele carriers exhibit higher 11–13 Hz activity than Val/Val allele carriers. The disagreement between the studies may reflect differences in sex and age of study participants, EEG acquisition and analyses, definition of α frequency band, time-of-day of and time-awake preceding the EEG recordings. It was previously suggested that sex, age, and disease states modulate the effects of the Val158Met polymorphism of COMT on cortical functions (Diamond, 2007; Bodenmann et al., 2009; Prata et al., 2009). Our findings in young men may, thus, not be generalizable to other populations.
The difference in 11–13 Hz activity between the COMT genotypes was not only present in wakefulness, but also in REM sleep and non-REM sleep. Moreover, individual power values in this frequency range were significantly correlated between wakefulness and REM sleep, and REM sleep and non-REM sleep, but not between non-REM sleep and waking (Fig. 1G–I). These associations support the notion obtained from multichannel EEG recordings that REM sleep is an intermediate state between wakefulness and non-REM sleep (Tinguely et al., 2006). The regional power distributions in these vigilance/sleep states before and after sleep deprivation suggest that three broad frequency bands (1–8 Hz, 9–15 Hz, 16–24 Hz) are largely independent of state and sleep pressure (Tinguely et al., 2006). In accordance with this view, we found a state-independent difference in 11–13 Hz activity in a single C3A2-derivation, in baseline, and after prolonged wakefulness (Fig. 4), as well as after extension of our analyses to multiple locations along the anteroposterior axis (Fig. 5). An occipital predominance in upper-α activity in wakefulness and REM sleep, in contrast to frontocentral α in non-REM sleep, is well documented. These state-related differences were previously interpreted to hint to different underlying processes (Tinguely et al., 2006). Our genetic data also support the hypothesis that common mechanisms also contribute to 11–13 Hz oscillations despite different EEG topography in distinct vigilance/sleep states.
The enzyme COMT plays an important role in metabolizing cortical dopamine (Karoum et al., 1994). The functional Val158Met polymorphism in the gene encoding COMT leads to three to fourfold reduction in enzyme activity, and is associated with altered cortical dopamine (Lachman et al., 1996; Chen et al., 2004), dopamine D1 receptors availability in corticolimbic regions (Slifstein et al., 2008), and gray matter volume in hippocampus and dorsolateral prefrontal cortex (DLPFC) (Honea et al., 2009). Because “induced” (eyes open vs eyes closed) and “spontaneous” EEG α activity is correlated with fMRI-BOLD signal changes in distributed networks including hippocampus and DLPFC (Ben-Simon et al., 2008), our findings may be compatible with the notion that genetically induced changes in dopaminergic signaling contribute to the variation in α oscillations associated with the Val158Met polymorphism of COMT. The stimulant modafinil also interferes with dopaminergic neurotransmission (Qu et al., 2008; Volkow et al., 2009). Consistent with our data, the only other study investigating modafinil-induced EEG changes in sleep-deprived humans found no change in upper-α activity during wakefulness (Chapotot et al., 2003). To better understand the roles for dopamine and COMT in modulating functional brain activity, changes in waking and sleep EEG after interaction with dopamine and COMT activity should be further investigated in genetically characterized individuals.
Healthy carriers of the 158Val allele of COMT were previously found to less efficiently avoid perseverative errors than carriers of the Met allele on tasks of executive functioning (Egan et al., 2001; Malhotra et al., 2002). In accordance with these data, we observed slightly higher counting tendency in Val/Val homozygotes than in Met/Met homozygotes on a task, in which subjects are instructed to generate random sequences of numbers and avoid counting. Because individuals with faster IAF and higher upper-α activity may show better cognitive and memory performance than individuals with relatively slower IAF and less α activity (Klimesch, 1999), we investigated the association between 11 and 13 Hz activity in waking and the proportion of adjacent response pairs, i.e., counting, on the RNG task. Based on the observed negative correlation, it may be speculated that individual differences in upper-α EEG activity could reflect individual differences in executive function. Such associations need to be interpreted with caution (Posthuma et al., 2001). Nevertheless, it is interesting to note that a VNTR in PER3 not only affects (low-frequency) α activity in REM sleep (Viola et al., 2007), but also moderates early morning executive functioning after sleep deprivation (Groeger et al., 2008).
Together, our study demonstrates that the Val158Met polymorphism of COMT predicts robust interindividual differences in α peak frequency in wakefulness, and 11–13 Hz EEG activity in wakefulness and sleep. These findings suggest that mechanisms involving dopamine contribute to brain α oscillations in healthy individuals. The same genetic variation of COMT plays a role in individual differences in cognitive performance and was previously associated with neuropsychiatric disease (Tunbridge et al., 2006). Future studies may investigate whether α EEG alterations in patient populations constitute endophenotypes of distinct neuropsychiatric disorders.
Footnotes
This research was supported by Swiss National Science Foundation Grants 3100A0-107874 and 310000-120377 and European Union Marie-Curie Grant MCRTN-CT-2004-512362. We thank Dr. R. Khatami, Dr. U. F. O. Luhmann, N. Schäfer, Prof. W. Berger, Dr. H. H. Jung, S. Xu, and Dr. S. Regel for their help with genotyping, isolation of DNA, and data collection and analyses, and Dr. C. Kopp and Prof. A. Borbély for discussion and comments on this manuscript.
The authors declare no competing interests, financial or otherwise.
References
- Aeschbach D, Matthews JR, Postolache TT, Jackson MA, Giesen HA, Wehr TA. Two circadian rhythms in the human electroencephalogram during wakefulness. Am J Physiol. 1999;277:R1771–R1779. doi: 10.1152/ajpregu.1999.277.6.R1771. [DOI] [PubMed] [Google Scholar]
- Akil M, Kolachana BS, Rothmond DA, Hyde TM, Weinberger DR, Kleinman JE. Catechol-O-methyltransferase genotype and dopamine regulation in the human brain. J Neurosci. 2003;23:2008–2013. doi: 10.1523/JNEUROSCI.23-06-02008.2003. [DOI] [PMC free article] [PubMed] [Google Scholar]
- Anokhin A, Steinlein O, Fischer C, Mao Y, Vogt P, Schalt E, Vogel F. A genetic study of the human low-voltage electroencephalogram. Hum Genet. 1992;90:99–112. doi: 10.1007/BF00210751. [DOI] [PubMed] [Google Scholar]
- Ben-Simon E, Podlipsky I, Arieli A, Zhdanov A, Hendler T. Never resting brain: simultaneous representation of two alpha related processes in humans. PLoS ONE. 2008;3:e3984. doi: 10.1371/journal.pone.0003984. [DOI] [PMC free article] [PubMed] [Google Scholar]
- Bodenmann S, Xu S, Luhmann UF, Arand M, Berger W, Jung HH, Landolt HP. Pharmacogenetics of modafinil after sleep loss: catechol-O-methyltransferase genotype modulates waking functions but not recovery sleep. Clin Pharmacol Ther. 2009;85:296–304. doi: 10.1038/clpt.2008.222. [DOI] [PubMed] [Google Scholar]
- Borbély AA, Achermann P. Sleep homeostasis and models of sleep regulation. In: Kryger MH, Roth T, Dement WC, editors. Principles and practice of sleep medicine. Ed 4. Philadelphia: Elsevier Saunders; 2005. pp. 405–417. [Google Scholar]
- Boudíková B, Szumlanski C, Maidak B, Weinshilboum R. Human liver catechol-O-methyltransferase pharmacogenetics. Clin Pharmacol Ther. 1990;48:381–389. doi: 10.1038/clpt.1990.166. [DOI] [PubMed] [Google Scholar]
- Buckelmüller J, Landolt HP, Stassen HH, Achermann P. Trait-like individual differences in the human sleep electroencephalogram. Neuroscience. 2006;138:351–356. doi: 10.1016/j.neuroscience.2005.11.005. [DOI] [PubMed] [Google Scholar]
- Cajochen C, Wyatt JK, Czeisler CA, Dijk DJ. Separation of circadian and wake duration-dependent modulation of EEG activation during wakefulness. Neuroscience. 2002;114:1047–1060. doi: 10.1016/s0306-4522(02)00209-9. [DOI] [PubMed] [Google Scholar]
- Chapotot F, Pigeau R, Canini F, Bourdon L, Buguet A. Distinctive effects of modafinil and d-amphetamine on the homeostatic and circadian modulation of the human waking EEG. Psychopharmacology. 2003;166:127–138. doi: 10.1007/s00213-002-1315-8. [DOI] [PubMed] [Google Scholar]
- Chen J, Lipska BK, Halim N, Ma QD, Matsumoto M, Melhem S, Kolachana BS, Hyde TM, Herman MM, Apud J, Egan MF, Kleinman JE, Weinberger DR. Functional analysis of genetic variation in catechol-o-methyltransferase (COMT): effects on mRNA, protein, and enzyme activity in postmortem human brain. Am J Hum Genet. 2004;75:807–821. doi: 10.1086/425589. [DOI] [PMC free article] [PubMed] [Google Scholar]
- De Gennaro L, Marzano C, Fratello F, Moroni F, Pellicciari MC, Ferlazzo F, Costa S, Couyoumdjian A, Curcio G, Sforza E, Malafosse A, Finelli LA, Pasqualetti P, Ferrara M, Bertini M, Rossini PM. The electroencephalographic fingerprint of sleep is genetically determined: a twin study. Ann Neurol. 2008;64:455–460. doi: 10.1002/ana.21434. [DOI] [PubMed] [Google Scholar]
- Diamond A. Consequences of variations in genes that affect dopamine in prefrontal cortex. Cereb Cortex. 2007;17(Suppl 1):i161–i170. doi: 10.1093/cercor/bhm082. [DOI] [PMC free article] [PubMed] [Google Scholar]
- Dumont M, Macchi MM, Carrier J, Lafrance C, Hebert M. Time course of narrow frequency bands in the waking EEG during sleep deprivation. Neuroreport. 1999;10:403–407. doi: 10.1097/00001756-199902050-00035. [DOI] [PubMed] [Google Scholar]
- Egan MF, Goldberg TE, Kolachana BS, Callicott JH, Mazzanti CM, Straub RE, Goldman D, Weinberger DR. Effect of COMT Val108/158 Met genotype on frontal lobe function and risk for schizophrenia. Proc Natl Acad Sci U S A. 2001;98:6917–6922. doi: 10.1073/pnas.111134598. [DOI] [PMC free article] [PubMed] [Google Scholar]
- Enoch MA, Xu K, Ferro E, Harris CR, Goldman D. Genetic origins of anxiety in women: a role for a functional catechol-O-methyltransferase polymorphism. Psychiatr Genet. 2003;13:33–41. doi: 10.1097/00041444-200303000-00006. [DOI] [PubMed] [Google Scholar]
- Enoch MA, Shen PH, Ducci F, Yuan Q, Liu J, White KV, Albaugh B, Hodgkinson CA, Goldman D. Common genetic origins for EEG, alcoholism and anxiety: the role of CRH-BP. PLoS ONE. 2008;3:e3620. doi: 10.1371/journal.pone.0003620. [DOI] [PMC free article] [PubMed] [Google Scholar]
- Gottselig JM, Adam M, Rétey JV, Khatami R, Achermann P, Landolt HP. Random number generation during sleep deprivation: effects of caffeine on response maintenance and stereotypy. J Sleep Res. 2006;15:31–40. doi: 10.1111/j.1365-2869.2006.00497.x. [DOI] [PubMed] [Google Scholar]
- Groeger JA, Viola AU, Lo JC, von Schantz M, Archer SN, Dijk DJ. Early morning executive functioning during sleep deprivation is compromised by a PERIOD3 polymorphism. Sleep. 2008;31:1159–1167. [PMC free article] [PubMed] [Google Scholar]
- Honea R, Verchinski BA, Pezawas L, Kolachana BS, Callicott JH, Mattay VS, Weinberger DR, Meyer-Lindenberg A. Impact of interacting functional variants in COMT on regional grey matter volume in human brain. Neuroimage. 2009;45:44–51. doi: 10.1016/j.neuroimage.2008.10.064. [DOI] [PMC free article] [PubMed] [Google Scholar]
- Jiang H, Xie T, Ramsden DB, Ho SL. Human catechol-O-methyltransferase down-regulation by estradiol. Neuropharmacology. 2003;45:1011–1018. doi: 10.1016/s0028-3908(03)00286-7. [DOI] [PubMed] [Google Scholar]
- Karoum F, Chrapusta SJ, Egan MF. 3-Methoxytyramine is the major metabolite of released dopamine in the rat frontal cortex: reassessment of the effects of antipsychotics on the dynamics of dopamine release and metabolism in the frontal cortex, nucleus accumbens, and striatum by a simple two pool model. J Neurochem. 1994;63:972–979. doi: 10.1046/j.1471-4159.1994.63030972.x. [DOI] [PubMed] [Google Scholar]
- Klimesch W. EEG alpha and theta oscillations reflect cognitive and memory performance: a review and analysis. Brain Res Rev. 1999;29:169–195. doi: 10.1016/s0165-0173(98)00056-3. [DOI] [PubMed] [Google Scholar]
- Lachman HM, Papolos DF, Saito T, Yu YM, Szumlanski CL, Weinshilboum RM. Human catechol-O-methyltransferase pharmacogenetics: description of a functional polymorphism and its potential application to neuropsychiatric disorders. Pharmacogenetics. 1996;6:243–250. doi: 10.1097/00008571-199606000-00007. [DOI] [PubMed] [Google Scholar]
- Landolt HP. Genotype-dependent differences in sleep, vigilance, and response to stimulants. Curr Pharm Des. 2008;14:3396–3407. doi: 10.2174/138161208786549344. [DOI] [PubMed] [Google Scholar]
- Malhotra AK, Kestler LJ, Mazzanti C, Bates JA, Goldberg T, Goldman D. A functional polymorphism in the COMT gene and performance on a test of prefrontal cognition. Am J Psychiatry. 2002;159:652–654. doi: 10.1176/appi.ajp.159.4.652. [DOI] [PubMed] [Google Scholar]
- Miyake A, Friedman NP, Emerson MJ, Witzki AH, Howerter A, Wager TD. The unity and diversity of executive functions and their contributions to complex “frontal lobe” tasks: a latent variable analysis. Cogn Psychol. 2000;41:49–100. doi: 10.1006/cogp.1999.0734. [DOI] [PubMed] [Google Scholar]
- Mukherjee N, Kidd KK, Pakstis AJ, Speed WC, Li H, Tarnok Z, Barta C, Kajuna SL, Kidd JR. The complex global pattern of genetic variation and linkage disequilibrium at catechol-O-methyltransferase. Mol Psychiatry. Advance online publication. 2008 doi: 10.1038/mp.2008.64. Retrieved August 20, 2009. doi: 10.1038/mp.2008.64. [DOI] [PMC free article] [PubMed] [Google Scholar]
- Posthuma D, Neale MC, Boomsma DI, de Geus EJ. Are smarter brains running faster? Heritability of alpha peak frequency, IQ, and their interrelation. Behav Genet. 2001;31:567–579. doi: 10.1023/a:1013345411774. [DOI] [PubMed] [Google Scholar]
- Prata DP, Mechelli A, Fu CH, Picchioni M, Kane F, Kalidindi S, McDonald C, Howes O, Kravariti E, Demjaha A, Toulopoulou T, Diforti M, Murray RM, Collier DA, McGuire PK. Opposite effects of catechol-O-methyltransferase Val158Met on cortical function in healthy subjects and patients with schizophrenia. Biol Psychiatry. 2009;65:473–480. doi: 10.1016/j.biopsych.2008.09.027. [DOI] [PubMed] [Google Scholar]
- Qu WM, Huang ZL, Xu XH, Matsumoto N, Urade Y. Dopaminergic D1 and D2 receptors are essential for the arousal effect of modafinil. J Neurosci. 2008;28:8462–8469. doi: 10.1523/JNEUROSCI.1819-08.2008. [DOI] [PMC free article] [PubMed] [Google Scholar]
- Rechtschaffen A, Kales A. Bethesda, MD: National Institutes of Health; 1968. A manual of standardized terminology, techniques and scoring system for sleep stages of human subjects. [Google Scholar]
- Rétey JV, Adam M, Honegger E, Khatami R, Luhmann UF, Jung HH, Berger W, Landolt HP. A functional genetic variation of adenosine deaminase affects the duration and intensity of deep sleep in humans. Proc Natl Acad Sci U S A. 2005;102:15676–15681. doi: 10.1073/pnas.0505414102. [DOI] [PMC free article] [PubMed] [Google Scholar]
- Slifstein M, Kolachana B, Simpson EH, Tabares P, Cheng B, Duvall M, Frankle WG, Weinberger DR, Laruelle M, Abi-Dargham A. COMT genotype predicts cortical-limbic D1 receptor availability measured with [11C]NNC112 and PET. Mol Psychiatry. 2008;13:821–827. doi: 10.1038/mp.2008.19. [DOI] [PubMed] [Google Scholar]
- Smit CM, Wright MJ, Hansell NK, Geffen GM, Martin NG. Genetic variation of individual alpha frequency (IAF) and alpha power in a large adolescent twin sample. Int J Psychophysiol. 2006;61:235–243. doi: 10.1016/j.ijpsycho.2005.10.004. [DOI] [PubMed] [Google Scholar]
- Smit DJ, Posthuma D, Boomsma DI, Geus EJ. Heritability of background EEG across the power spectrum. Psychophysiology. 2005;42:691–697. doi: 10.1111/j.1469-8986.2005.00352.x. [DOI] [PubMed] [Google Scholar]
- Stassen HH, Bomben G, Propping P. Genetic aspects of the EEG: an investigation into the within-pair similarity of monozygotic and dizygotic twins with a new method of analysis. Electroencephalogr Clin Neurophysiol. 1987;66:489–501. doi: 10.1016/0013-4694(87)90095-2. [DOI] [PubMed] [Google Scholar]
- Steinlein O, Anokhin A, Yping M, Schalt E, Vogel F. Localization of a gene for the human low-voltage EEG on 20q and genetic heterogeneity. Genomics. 1992;12:69–73. doi: 10.1016/0888-7543(92)90408-k. [DOI] [PubMed] [Google Scholar]
- Tinguely G, Finelli LA, Landolt HP, Borbély AA, Achermann P. Functional EEG topography in sleep and waking: state-dependent and state-independent features. Neuroimage. 2006;32:283–292. doi: 10.1016/j.neuroimage.2006.03.017. [DOI] [PubMed] [Google Scholar]
- Tucker AM, Dinges DF, Van Dongen HP. Trait interindividual differences in the sleep physiology of healthy young adults. J Sleep Res. 2007;16:170–180. doi: 10.1111/j.1365-2869.2007.00594.x. [DOI] [PubMed] [Google Scholar]
- Tunbridge EM, Harrison PJ, Weinberger DR. Catechol-o-methyltransferase, cognition, and psychosis: Val(158)Met and beyond. Biol Psychiatry. 2006;60:141–151. doi: 10.1016/j.biopsych.2005.10.024. [DOI] [PubMed] [Google Scholar]
- van Beijsterveldt CE, Molenaar PC, de Geus EJ, Boomsma DI. Heritability of human brain functioning as assessed by electroencephalography. Am J Hum Genet. 1996;58:562–573. [PMC free article] [PubMed] [Google Scholar]
- Viola AU, Archer SN, James LM, Groeger JA, Lo JC, Skene DJ, von Schantz M, Dijk DJ. PER3 polymorphism predicts sleep structure and waking performance. Curr Biol. 2007;17:613–618. doi: 10.1016/j.cub.2007.01.073. [DOI] [PubMed] [Google Scholar]
- Vogel F. The genetic basis of the normal human electroencephalogram (EEG) Humangenetik. 1970;10:91–114. doi: 10.1007/BF00295509. [DOI] [PubMed] [Google Scholar]
- Volkow ND, Fowler JS, Logan J, Alexoff D, Zhu W, Telang F, Wang GJ, Jayne M, Hooker JM, Wong C, Hubbard B, Carter P, Warner D, King P, Shea C, Xu Y, Muench L, Apelskog-Torres K. Effects of modafinil on dopamine and dopamine transporters in the male human brain. JAMA. 2009;301:1148–1154. doi: 10.1001/jama.2009.351. [DOI] [PMC free article] [PubMed] [Google Scholar]
- Winterer G, Mahlberg R, Smolka MN, Samochowiec J, Ziller M, Rommelspacher HP, Herrmann WM, Schmidt LG, Sander T. Association analysis of exonic variants of the GABA(B)-receptor gene and alpha electroencephalogram voltage in normal subjects and alcohol-dependent patients. Behav Genet. 2003;33:7–15. doi: 10.1023/a:1021043315012. [DOI] [PubMed] [Google Scholar]