

Abstract
Little is known about the generation of slow rhythms in brain neuronal circuits. Nevertheless, a few studies, both from reconstituted systems and from hippocampal slices, indicate that activation of metabotropic glutamate receptors (mGluRs) could generate such rhythms. Here we show in rat cerebellar slices that after either release of glutamate by repetitive stimulation, or direct stimulation of type 1 mGluRs, molecular layer interneurons exhibit repetitive slow Ca2+ transients. By combining cell-attached patch-clamp recording with Ca2+ imaging, we show that the regular Ca2+ transients (mean frequency, 35 mHz induced by 2 μm quisqualate in the presence of ionotropic glutamate receptor blockers) are locked with bursts of action potentials. Nevertheless, the Ca2+ transients are not blocked by tetrodotoxin, indicating that firing is not necessary to entrain oscillations. The first Ca2+ transient within a train is different in several ways from subsequent transients. It is broader than the subsequent transients, displays a different phase relationship to associated spike bursts, and exhibits a distinct sensitivity to ionic and pharmacological manipulations. Whereas the first transient appears to involve entry of Ca2+ ions through transient receptor potential channel-like channels and secondarily activated L-type Ca2+ channels, subsequent transients rely mostly on an exchange of Ca2+ ions between the cytosol and d-myo-inositol-1,4,5-triphosphate-sensitive intracellular Ca2+ stores. The slow, highly regular oscillations observed in the present work are likely to drive pauses in postsynaptic Purkinje cells, and could play a role in coordinating slow oscillations involving the cerebello-olivar circuit loop.
Introduction
Interneuron networks in the hippocampus and cortex are able to generate rhythms with frequencies ranging from a few tens of Hertz to a few hundreds of Hertz, which are believed to play a key role in information processing in these brain areas (McBain and Fisahn, 2001). The conditions under which these networks can generate rhythms in a slower time domain remain unclear. In heterologous systems, it has been shown that activation of group I metabotropic glutamate receptors (mGluRs) (mGluR1 and mGluR5) can lead to regular Ca2+signals with a period on the order of tens of seconds (Kawabata et al., 1996, 1998). These signals depend on the recruitment of intracellular Ca2+ stores. In certain hippocampal interneurons, mGluR activation leads to an oscillatory inward current response (McBain et al., 1994) which correlates with periodic Ca2+ waves and action potential bursts (Woodhall et al., 1999). Thus, activation of mGluRs located on hippocampal interneurons is able to generate slow neuronal rhythms. However, much remains to be known concerning the sources, underlying cellular mechanisms, and functional consequences of such rhythms.
In the cerebellar cortex, Karakossian and Otis (2004) reported that stimulation of parallel fibers (PFs) under conditions in which ionotropic glutamate receptors are inhibited, or application of a specific agonist of mGluR1 generate a synaptic current in molecular layer interneurons (MLIs). These authors also showed that activation of group I mGluRs leads to increased MLI spiking and subsequent enhancement of the frequency of spontaneous synaptic currents recorded from Purkinje cells (PCs), in accord with previous data obtained using a broad spectrum agonist (Llano and Marty, 1995). Interestingly, mGluR1 has been identified in MLIs at postsynaptic locations by immunogold staining (Baude et al., 1993). These data prompted us to search for the presence of periodic changes in MLI behavior linked to mGluR activation and to dissect the cellular mechanisms underlying these changes. Here we report that glutamate release resulting from stimulation of glutamatergic fibers produces Ca2+ transients in MLI somata, through activation of mGluR1. Long-lasting activation of these receptors leads to robust Ca2+ oscillations that last for the entire duration of agonist application. Each Ca2+ transient is accompanied by a burst of action potentials, which correlates with the onset of the transient. A pharmacological study of the signal suggests that phospholipase C-mediated production of d-myo-inositol-1,4,5-triphosphate (InsP3) is not necessary to produce the first Ca2+ transient but is critical for maintaining the subsequent Ca2+ transients during prolonged administration of the agonist. Together, our results show that sustained mGluR1 activation leads to a dramatic switch in MLI spike pattern, from a slow tonic mode to a rapid burst mode, and that these changes in electrical activity correlate with Ca2+ oscillations.
Materials and Methods
Recording conditions.
Cerebellar slices (200 μm thick) were prepared from rats aged 13–17 d, decapitated after cervical dislocation in accordance with the animal care and use guidelines of the host institution. Slices were cut using a Leica VT1200S vibratome, from tissue submerged in ice-cold bicarbonate-buffered saline (BBS) containing (in mm): 125 NaCl, 2.5 KCl, 1.25 NaH2PO4, 26 NaHCO3, 2 CaCl2, 1 MgCl2, and 10 glucose, bubbled with carbogen (95% O2, 5% CO2). Sagittal slices were used in all experiments except those dealing with synaptic activation of mGluRs, for which coronal slices were preferred because parallel fibers are better preserved. The slices were maintained in carbogen-bubbled BBS at 35°C for 1 h before transfer to the recording setup. During experiments, the slices were perfused (1.5 ml/min) with BBS. Experiments were performed at room temperature (20–24°C) unless otherwise indicated.
Ca2+ imaging and electrophysiology.
Either wide-field imaging or two-photon laser scanning microscopy (2PLSM) was used, as detailed in previous publications (Collin et al., 2005 and references therein). In most experiments, images were formed at dwell times of 100–500 ms. Electrical recordings were based on an EPC-10 patch-clamp amplifier (HEKA Electronik) synchronized with the digital imaging system or the 2PLSM system by a TTL trigger. In a subset of experiments designed to assess the temporal relation between spike bursts and Ca2+ rises, the standard scanning routines used in the homemade 2PLSM setup (Tan et al., 1999) were replaced by a procedure which maintains the laser beam at the center of the MLI soma throughout the recording. In this “laser pointing” protocol, photodetector signals were acquired at 100 μs/point in parallel with electrical signals from the patch-clamp amplifier (see Fig. 2B). Fluorescence signals were analyzed in terms of the changes in fluorescence relative to prestimulus values (ΔF/Fo, expressed as percentage) with software written in the IGOR-Pro programming environment (Wavemetric). When illustrating examples of images constructed from 2PLSM experiments, the pseudocolor bar codes for fluorescence in Hertz, which is calculated from the number of photons acquired with an avalanche photodiode during 10 μs sampling intervals.
Figure 2.

Synchronized oscillations in MLI spiking and Ca2+ rises induced by mGluR1 activation. A, ΔF/Fo signals from the soma of a preloaded MLI (top trace) were acquired in parallel with the membrane currents recorded by a patch pipette in the cell-attached configuration (bottom trace). This MLI showed no spiking activity at rest; bath application of 2 μm quisqualate induced spike bursts and oscillatory changes in Ca2+. The gap in the current record corresponds to a short pause in the acquisition of the electrophysiological signal. B, Analysis of the ΔF/Fo signals and of the instantaneous action potential frequency from another MLI during the first (B1) and second (B2) transients of an oscillatory response to bath applied quisqualate. Note that the first transient exhibits less adaptation for both, the Ca2+ transient and the spike frequency increase.
Most of the experiments used the preloaded condition, described previously for MLIs (Conti et al., 2004). Briefly, whole cell recordings (WCRs) were established in MLIs with pipette solutions containing (in mm): 140 K-gluconate, 5.4 KCl, 4.1 MgCl2, 9.9 HEPES-K, 0.36 Na-GTP, and 3.6 Na-ATP and 100 μm the Ca2+-sensitive indicator Oregon Green 488 BAPTA-1 (OG1) (Invitrogen). Pipette input resistances were in the 8–10 MΩ range. MLΙ identification was confirmed by the observation of large (0.8–1.7 nA), transient inward currents when the membrane potential was stepped for −70 mV to −10 mV for 2 ms (Collin et al., 2005). The pipette solution was allowed to equilibrate with the cytosol for 30–45 s and the pipette was then removed. If a high-resistance (>1 GΩ) outside-out membrane patch was obtained, the preloaded MLI was considered suitable for Ca2+ imaging.
For simultaneous recordings of Ca2+ transients and spike activity, a new patch pipette was approached to a preloaded MLI. A high resistance seal was established and currents were monitored, maintaining the pipette potential at 0 mV. Analysis of the electrical signals for spike detection was conducted in IGOR-Pro (Wavemetric).
Experiments on mGluR-evoked currents in conjunction with Ca2+ transients were done in the WCR configuration, with the same pipette solution as that used for preloading experiments. For the recording of the current–voltage relation of the mGluR-activated current, a K+-free solution was used to eliminate the contribution of voltage-gated K+ channels. This solution contained, in mm: 140 Cs methanesulfonate, 10 BAPTA-Cs, 10 HEPES-Cs, 2 MgCl2, 5 CaCl2, 0.4 Na-GTP, and 4 Na-ATP.
Unless otherwise stated, BBS contained blockers of ionotropic GABAA (20 μm bicuculline methochloride) and glutamate receptors: 20 μm 2,3-dioxo-6-nitro-1,2,3,4-tetrahydrobenzo[f]quinoxaline-7-sulfonamide (NBQX) and 100 μm d-(−)-2-amino-5-phosphonopentanoic acid (d-APV). The high concentration of NBQX used ensured that the block was effective during sustained agonist application. These compounds, as well as 1-aminoindan-1,5-dicarboxylic acid (AIDA), l-quisqualic acid (Quis), (S)-3,5-dihydroxyphenylglycine (DHPG), and 7- (hydroxyimino)cyclopropa[b]chromen-1a-carboxylate ethyl ester (CPCCOEt), were purchased from Tocris Bioscience. Ryanodine was purchased from Ascent Scientific. All other chemicals were purchased from Sigma/Calbiochem. Stocks of ryanodine, CPCCOEt, U73122, 2-amino phenyl borate (2-APB), and nimodipine were prepared in DMSO at concentrations of 100, 100, 2, 90, and 100 mm, respectively. All other stocks were prepared in H2O. For experiments in which extracellular Ca2+ was removed, 100 μm EGTA was added to a Ca2+-free BBS.
Extracellular stimulation of glutamatergic inputs was performed in coronal slices by applying trains of voltage pulses (100 μs duration; 40–60 V amplitude) between a reference platinum electrode and another platinum electrode carried by a 2-μm-tip-diameter glass pipette filled with a HEPES-buffered solution (HBS) containing (in mm): 145 NaCl, 2.5 KCl, 2 CaCl2, 1 MgCl2, 10 HEPES-Na; input resistance of 2–3 MΩ. This pipette was repositioned in the molecular layer until a stable Ca2+ rise response was evoked. Stimulus trains at frequencies of 25–50 Hz gave responses with peak ΔF/Fo amplitude and duration which did not differ significantly. Results have been pooled together. In preliminary experiments, we verified using WCRs that this type of electrical stimulation elicited synaptic currents consistent with those described previously for PF-MLI synapses (Carter and Regehr, 2000; Rossi et al., 2008).
To study agonist-evoked responses, puffs (1 s duration) of group I mGluR agonists were applied with a puffer pipette (2 μm tip opening, located 20–30 μm from the MLI soma) connected to a Picospritzer (General Valve) set at 5–7 psi. The pipette was filled with HBS plus either 2 μm Quis, 20 μm NBQX, and 100 μm d-APV, or 50 μm DHPG.
Statistical values are given as mean ± SEM; n refers to the number of cells. Unless otherwise noted, the paired Student's t test was used to evaluate statistical differences. Results were considered significantly different if p ≤ 0.05.
Results
Repetitive stimulation of glutamatergic fibers induces an mGluR1-mediated Ca2+ increase in MLIs
In the cerebellar cortex, PFs form tightly knit bundles of axons that fill a large fraction of the space of the molecular layer. Consequently, concerted stimulation of a bundle of PFs results in a homogeneous elevated glutamate concentration in the molecular layer that decreases relatively slowly because of the inefficiency of removal by diffusion (Barbour and Häusser, 1997). This elevated glutamate generated by repetitive stimulation of PFs has been shown to stimulate various ionotropic receptors in MLIs (Carter and Regehr, 2000; Rossi et al., 2008). Repetitive PF stimulation also can induce an inward current in these neurons, with a pharmacological profile consistent with the activation of mGluR1 (Karakossian and Otis, 2004). Whether such activation can lead to changes in intracellular Ca2+ in MLIs, however, has not been investigated despite the importance of Ca2+ homeostasis in multiple aspects of neuronal function.
To investigate the relationship between activation of mGluRs and Ca2+ signals, we first preloaded individual MLIs with the Ca2+ sensitive indicator OG1 using a short WCR (preloaded MLI; Conti et al., 2004; Rengifo et al., 2007) (see Materials and Methods), and then followed the fluorescence signals in response to stimulation of glutamatergic fibers. As shown in Figure 1, A1 and A2, a 40 Hz train of stimuli, in the presence of the ionotropic receptor blockers NBQX, d-APV, and bicuculline, led to an increase in somatic fluorescence, with peak ΔF/Fo values of 108.5 ± 8.9% (average of 10 experiments with stimuli trains of 1–2 min duration). When cells were repetitively stimulated over a period of >40 min, the magnitude of the response was maintained (Fig. 1A3). The response was strongly inhibited or, in several cases, totally abolished by application of the selective mGluR1 antagonist CPCCOEt (100 μm) (Fig. 1A1, A2). On average, the response decreased to 26.6 ± 8.9% of the control value in six cells (p < 0.0002), and after washout of the antagonist, the response recovered to 48.7 ± 16.0% of the control value (n = 3). In view of recent reports on actions of CPCCOEt unrelated to mGluRs (Fukunaga et al., 2007; Shin et al., 2009), we tested AIDA, a selective mGluR1a antagonist that is not structurally related to CPCCOEt (Moroni et al., 1997; Otani et al., 1999). Fluorescencesignals elicited by trains of extracellular stimulation were decreased to 50% of their control value after 8–11 min of exposure to this drug (n = 4; p < 0.003). The smaller degree of block of AIDA compared with CPCCOEt is attributable to the competitive nature of this blocker (Moroni et al., 1997).
Figure 1.

Stimulation of glutamatergic fibers induces mGluR1-dependent Ca2+ rises in MLI somata. A1, Pseudocolor images from a MLI soma preloaded with the Ca2+-dependent indicator OG1 taken at rest and at the peak of the response to a 1.5-min-long train of stimuli at 40 Hz. Images are shown in control solution (first and second images) and in the presence of a 100 μm concentration of the mGluR1 antagonist CPCCOEt (third and fourth images). A2, Time course for the ΔF/Fo signals. A3, Evolution of the peak ΔF/Fo values as a function of time in WCR before and during exposure to CPCCOEt. Experiment conducted at 22°C. B, In another preloaded MLI soma, extracellular stimulation (25 Hz, 1.6 min duration) evoked oscillatory changes in Ca2+. Experiment conducted at 36°C. C, Time course of the somatic Ca2+ signals elicited in another MLI by a 0.4 s train of 25 Hz stimuli at 22°C and 36°C. In this and subsequent figures, the pseudocolor bar for images from 2PLSM is expressed in Hz, calculated from the number of photons acquired during 10 μs sampling intervals. Note that in all experiments, ionotropic GABA and glutamate receptors were blocked by a mixture of antagonists, as specified in Materials and Methods.
The fluorescence signals displayed a first transient that lasted, on average, 37.6 ± 8.1 s (n = 10), and were followed by later transients in 5 of 10 recordings (Fig. 1B, see example). Although Ca2+ responses having a single peak could be elicited by short trains of extracellular stimulation (Fig. 1C, see example), the later transients were obtained only if the electrical stimulation was maintained, suggesting that agonist binding by mGluRs is a prerequisite for the generation of repetitive Ca2+ rises. Another feature of the responses to electrical stimulation was their weak temperature sensitivity. That is, the first transient was similar in amplitude and time course at 22°C and at physiological temperature (Fig. 1C, see example). The ratio of peak ΔF/Fo values at 36°C over values at 22°C was 0.94 ± 0.10, and the corresponding ratio for the duration of the first transient was 0.95 ± 0.21 (n = 4). In summary, our results show that after glutamate release resulting from stimulation of glutamatergic fibers, MLI somata produce Ca2+ transients in response to activation of mGluR1 and that this process does not have a strong temperature sensitivity.
Rhythmic Ca2+ signals in response to mGluR activation
To study more directly the Ca2+ signals elicited by stimulation of glutamatergic fibers, we then directly applied the potent agonist of group I mGluRs, quisqualate (2 μm), in the presence of ionotropic blockers. Addition of quisqualate elicited a series of Ca2+ transients which, as illustrated in Figure 2A, lasted for the entire duration of agonist application (up to 10 min) and stopped after the agonist was removed from the bath. In preloaded MLIs, mGluR-induced Ca2+ responses had an average frequency of 35.2 ± 2.3 mHz (n = 82) and were quite robust, with only 13% of the cells failing to show the oscillatory Ca2+ signals. These Ca2+ signals had similar features whether they were recorded from MLIs with somata located within 20 μm of the Purkinje cell layer, presumably basket cells, or from MLIs with somata located in the middle and upper molecular layer, presumably stellate cells. Thus, average values for the peak amplitude and oscillation frequency were 106 ± 4.8% and 33.5 ± 2.3 mHz for stellate cells (n = 71), whereas values for basket cells were 92 ± 10.5% and 46.2 ± 8.2 mHz (n = 11); p > 0.24 for peak amplitude and p > 0.16 for oscillation frequency (nonpaired Student's t test).
For a given MLI, there was little variation in the peak amplitude of the transients throughout the response (Fig. 2A). Furthermore, the frequency of the transients was also remarkably constant throughout the response, as documented below. Finally, there was little variation when comparing responses to separate agonist application in a given cell.
First versus subsequent Ca2+ transients
We found that the first transient is consistently broader than the subsequent transients, whereas all subsequent transients are remarkably similar in shape (Fig. 2; further examples may be seen in Figs. 3 and 4 and, below, in Fig. 8). This difference in duration between the first and subsequent transients translated into a highly significant difference for their areas (%ΔF/Fo · s values were 1918 ± 171 and 648 ± 87 for the first and the secondary areas, respectively; ratio of the average of the secondary area to the first area, for the same cells: 0.34 ± 0.03, n = 23; p < 0.0002 for paired Student's t test). The mean value for the areas under the first agonist-induced Ca2+ transient is not statistically different from that of the Ca2+ response to extracellular stimulation (2602 ± 655%ΔF/Fo · s; n = 10; p > 0.34, nonpaired Student's t test). The peak amplitude of the first transient for the same cells (110.3 ± 9.1%, n = 23) is also comparable to that elicited by extracellular stimulation [average peak value of 108.5% in 10 experiments (see Repetitive stimulation of glutamatergic fibers induces an mGluR1-mediated Ca2+ increase in MLIs); p > 0.24, nonpaired Student's t test]. Thus, the two responses share similar magnitudes and temporal course.
Figure 3.
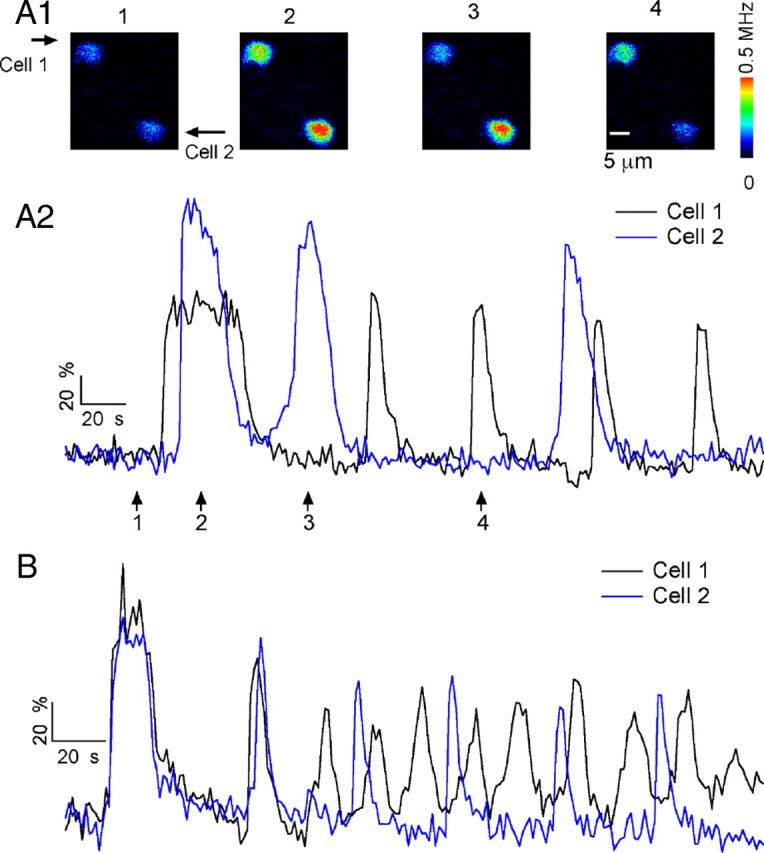
Oscillations recorded from pairs of adjacent MLIs. A1, Pseudocolor images from a pair of preloaded MLIs at rest (1) and at succeeding times during exposure to 2 μm quisqualate (2–4). A2, Time course of ΔF/Fo signals for the 2 MLIs that oscillate out of synchrony. The arrows indicate the time for the images shown in A1. B shows the ΔF/Fo time course from a different pair of MLIs. In this case, the fluorescent transients show evidence of synchronization.
Figure 4.

Action potentials are not required for the generation of mGluR1-induced Ca2+ oscillations. Left, ΔF/Fo image of a portion of the somatodendritic compartment of a preloaded MLI at the peak of the response to bath-applied quisqualate (2 μm) in TTX containing BBS. Right, Time course of the ΔF/Fo signals measured in a region of interest (ROI) over the soma center (black trace) and another ROI on the proximal dendrite (blue trace).
Figure 8.

Pharmacological manipulation of InsP3 and ryanodine receptor signaling disturbs the Ca2+ oscillations. A, Pooled data (n = 4) for the effect of the phospholipase C inhibitor U73122 on quisqualate-evoked Ca2+ oscillations in preloaded MLIs. For each MLI, the responses to bath-applied 2 μm quisqualate were analyzed in the control condition and 10 min after adding U73122 (2 μm) to the bath perfusion solution. The treatment did not significantly affect the oscillation frequency or the area under the first Ca2+ transient (first area), but it decreased the area under the subsequent oscillations (Subs. area). B, Oscillatory Ca2+ signals in a preloaded MLI in control condition (top) and 10 min after addition of 100 μm ryanodine to the bath perfusion solution (bottom). C, Pooled data (n = 6) for the effects of ryanodine on quisqualate-evoked Ca2+ oscillations in preloaded MLIs. For each MLI, the responses to bath-applied 2 μm quisqualate were analyzed in the control condition and 10–12 min after ryanodine treatment. Block of RyRs did not affect the oscillation frequency, but it significantly decreased the area under the first transient. D, Oscillatory Ca2+ signals in a preloaded MLI in the control condition (top), 5 min after addition of 10 mm caffeine to the bath perfusion solution (middle), and 10 min after washing out the caffeine (bottom). E, Pooled data (n = 10) for the effects of caffeine on quisqualate-evoked Ca2+ oscillations in preloaded MLIs. For each MLI, the responses to bath-applied 2 μm quisqualate were analyzed in the control condition and 4–5 min after caffeine treatment. Caffeine drastically reduced the oscillation frequency as well as the amplitude of the response, as indicated by the decrease in areas for both the first transient (first area) and the subsequent oscillations (Subs. area). In A, C, and E, oscillation parameters are expressed as the ratio between the value in the test condition over the value obtained in control saline for the same MLI. * indicates groups in which p was ≤0.05 using the paired Student's t test.
Once the first transient was past, areas under Ca2+ transients calculated for subsequent transients displayed a remarkably small coefficient of variation (0.159 ± 0.017; n = 23), indicating a high degree of reproducibility for these transients. These results suggest that there are two different types of Ca2+ transients generated by quisqualate application, and that a distinction must be made between the first transient and all subsequent transients. Note, however, that the late transients elicited by prolonged extracellular stimulation (as in Fig. 1) were less regular and reproducible than those elicited by quisqualate. Finding the reason for this difference would presumably require further investigation of the specific effects of various extracellular stimulation parameters on the late calcium fluctuations.
Relation between Ca2+ transients and spike firing
To correlate the electrical activity of the cell with the Ca2+ signals, we performed experiments in which the preloaded MLI was subjected to a cell-attached patch-clamp recording in parallel to Ca2+ imaging (Fig. 2A). Under these conditions, the spontaneous firing rate of MLIs was 0.83 ± 0.42 Hz (n = 6). This value is lower than that published by Häusser and Clark (1997) from recordings from older rats (postnatal day 18–32) or by Mann-Metzer and Yarom (1999) for work in adult guinea pigs, both of which obtain average firing rates around 12 Hz. For juvenile MLIs, spontaneous spike rates were reported for the presynaptic partner of MLI-MLI pair recordings (Kondo and Marty, 1998, their Table 1). Their higher average value (3.2 Hz) compared with ours is likely to arise from the fact that in their work, silent MLIs would have been discarded, because the aim was to obtain a synaptically connected pair.
The experiments revealed that each Ca2+ transient was accompanied by a burst of action potentials. We analyzed the electrical activity in terms of the burst duration and the instantaneous spike frequency. As with the Ca2+ response, the first burst of action potentials was distinct from the following bursts. In six cells, the duration of the first spike burst was 15.9 ± 3.9 s, whereas the second burst lasted 4.6 ± 0.7 s. The ratio between spike durations for the first versus subsequent bursts (0.32 ± 0.13) corresponds to the ratio between the areas of the respective Ca2+ transients in the same recordings (0.39 ± 0.11). The temporal pattern of firing within a burst also depended on the burst number. This is illustrated in Figure 2B, from an experiment in which laser pointing was used to attain a fast sampling of the fluorescence signals (see Materials and Methods). To compare the first (Fig. 2B1) and the second (Fig. 2B2) transient, they have been illustrated in terms of the changes in fluorescence (black traces) and the time-locked action potential frequency (blue traces). Note that, although the peak of firing frequency occurred at the peak of the Ca2+ response for the first wave, maximum spiking frequency is reached at the onset of the Ca2+ response for the subsequent transients. The spike frequency reached higher levels during the second burst (70.1 ± 6.1 Hz, averaged for 6 cells) than during the first burst (30.8 ± 4.0 Hz, averaged for the same 6 cells). The ability to maintain a high spike frequency during the burst also differed when comparing the first and subsequent bursts. A measure of the spike frequency sag over the duration of the burst is the ratio of the spike frequency at the end of the burst divided by the peak spike frequency. This parameter, the spike frequency sag, shows that the second burst decayed to a greater extent than the first burst (the spike frequency sag was 0.61 ± 0.09 for the first burst and 0.27 ± 0.06 for the second burst; n = 6) despite the longer duration of the first burst.
Neighboring MLIs have been shown to couple via gap junctions in the adult guinea pig cerebellum (Mann-Metzer and Yarom, 1999). The influence of gap junctions on cell synchrony is heavily frequency dependent. Thus, although gap junctions are too weak in juvenile rats to induce a marked coupling between individual spikes (Vincent and Marty, 1996), it seemed plausible that it would be sufficient to synchronize quisqualate-induced bursts among neighboring MLIs. Therefore, we investigated the possibility that electrical coupling contributes to the oscillatory behavior induced by mGluR activation, by simultaneously recording the Ca2+ signals in pairs of preloaded MLIs whose somas were placed within 50 μm of each other. In 5 of 10 simultaneous recordings, as illustrated in Figure 3A, the cells were totally out of synchrony. In the other five recordings, evidence of synchronization was obtained, but the waves were not entirely in phase. An example of such a hybrid case is displayed in Figure 3B. In this case, the two first waves coincide in time for the two recorded cells; later, the waves occur out of synchrony, but one of the cells (black trace) adopts a frequency that is exactly twice that of the other cell (blue trace), and during each blue cycle, the two peaks of the black trace occur with a fixed phase delay with regard to the blue trace. Such behavior is unlikely to occur by chance and suggests that on quisqualate application, the gap junctions in the MLI network induce, first, synchrony and, later, a phase-locked harmonic coupling between the two recorded cells. Together, the results show that in the present preparation, there is either no coupling or incomplete coupling between quisqualate-induced bursts in adjacent neurons. However, it should be kept in mind that, for reasons that are still unclear, the degree of electrical coupling is weak in slices from juvenile rats, and it can be surmised that in conditions in which the coupling is stronger (e.g., adult guinea pigs) (Mann-Metzer and Yarom, 1999), synchrony may be much more extensive than that illustrated in Figure 3.
Given the concerted changes in spike pattern and Ca2+ signaling, the question arises as to whether depolarization-induced Ca2+ influx is sufficient to explain the Ca2+ transients. To address this issue, quisqualate responses were analyzed in neurons bathed in TTX to eliminate action potentials. Under these conditions, robust Ca2+ oscillations were obtained (Fig. 4) with amplitude and frequency parameters comparable to those obtained in the absence of TTX (control peak amplitude and frequency: 105.7 ± 5.1% and 30.6 ± 2.6 mHz, n = 66; respective values in TTX: 149.4 ± 13.4% and 21.4 ± 2.4 mHz, n = 8). Similar results were obtained when the Ca2+ responses to the specific group I mGluR agonist DHPG were studied. Thus, the peak amplitude and frequency of responses to this agonist in the absence of TTX were 96.2 ± 25.3% and 33.3 ± 14.8 mHz (n = 4), and the corresponding values in TTX were 104.3 ± 28.0% and 27.8 ± 5.5 mHz (n = 3).
In MLIs, sustained application of GABAAR agonists has been previously shown to elicit Ca2+ signals that are caused by the accumulation of Cl− ions in the cytosol (Chavas et al., 2004). Because mGluR- and GABAAR-mediated signals are superficially similar, we compared several aspects of the two responses with the aim to discover whether they share a common cellular mechanism. We found that, whereas GABAAR-mediated Ca2+ signals are initiated in dendrites and then travel as Ca2+ waves toward the cell soma (Chavas et al., 2004), mGluR-mediated Ca2+ signals rose simultaneously in the soma and in dendrites (Fig. 4). Furthermore, contrary to GABAAR-mediated Ca2+ signals, which are larger in dendrites than in the soma (Chavas et al., 2004), the mGluR-mediated signals were either smaller in dendrites than in the soma (Fig. 4, see example) or had similar sizes in both compartments (Fig. 6, see example). On average, the ratios of peak dendritic signal to peak somatic signal were 0.66 ± 0.25 in TTX (n = 4) and 0.91 ± 0.04 in the absence of TTX (n = 6).
Figure 6.

Pharmacological profile of the metabotropic Ca2+ transients. A1, ΔF/Fo images corresponding to the peak of the Ca2+ response to a 1 s puff of 100 μm DHPG in a preloaded MLI in control conditions (first panel), and at different times after the extracellular solution was changed to a Ca2+-free BBS containing 100 μm EGTA. The response disappears in the absence of extracellular Ca2+ and recovers when Ca2+ is reintroduced (last panel). A2 and A3 show the time course for the signals analyzed in the soma and in a dendritic ROI in the control period (black traces), 4.5 min after Ca2+ removal (red traces), and 9 min after Ca2+ readmission (blue traces). B, Pooled data on the effects of Ca2+ removal (n = 4; Ca2+ was removed 4–5 min before the test puff), U73122 (n = 5 with 5 min treatment at 2 μm), and 2-APB (n = 7 with 5–7 min treatment at 90 μm). The y-axis denotes the ratio between the peak ΔF/Fo responses to 1 s puffs of DHPG in the test condition over the value obtained in control for the same MLI. * indicates groups in which p was ≤0.05 using the paired Student's t test.
Together, these data show that sustained activation of group I mGluRs leads to a dramatic switch in MLI spike pattern, from a slow tonic mode to a rapid burst mode, and the changes in spiking pattern correlate with Ca2+ oscillations. However, the spikes are not necessary to sustain the Ca2+ oscillations.
Ionic currents linked to activation of group I mGluRs
The results described in the previous section were conducted in MLIs subjected to preloading, an experimental protocol which we developed to minimize alterations in the cell's intracellular environment (Conti et al., 2004; Chavas et al., 2004; Rengifo et al., 2007). Because previous reports (Karakossian and Otis, 2004) showed that mGluR1 activation in MLIs after either repetitive PF stimulation or direct agonist application elicits a cationic current, we next investigated the ionic counterpart of the mGluR responses. To our surprise, when MLIs were maintained in WCRs and challenged with puffs of agonists (either quisqualate or DHPG), Ca2+ transients were obtained in only 9 of 34 trials. This contrasted with results obtained with the preloading procedure in which puffs elicited a Ca2+ transient in all MLIs tested. There was a strict correlation between the existence of a Ca2+ rise and that of an ionic current. In all WCR cases in which inward currents were recorded at −70 mV, Ca2+ responses were obtained in parallel. In most responding MLIs, the amplitude of both the current and the Ca2+ transients decreased rapidly during recording, reflecting washout of an unknown cell constituent. Washout occurred with a similar time course for the two responses so that, within a single experiment, the two responses were in synchrony.
To determine the relationship between the currents and the Ca2+ responses, we collected measurements in the first minutes of WCR. Both current and Ca2+ transients started with a delay of ∼1 s after a puff application of agonist, presumably reflecting the slow activation kinetics of the receptors, and the response decayed back to baseline within 4–8 s (Fig. 5A,B). The Ca2+ and current transients had similar temporal courses, with slower currents corresponding to slower Ca2+ transients. In the two examples shown, the time constants of decay for the DHPG-activated currents differ by a factor of 3 (Fig. 5A, B, lower traces); the same factor describes the difference in the time constant of decay of the Ca2+ transients (Fig. 5A, B, upper traces). Average values for the DHPG-induced currents at −70 mV were 18 ± 5 pA, with corresponding peak ΔF/Fo signals of 87 ± 4.5% (n = 4), and averaged values for quisqualate (at 2 μm)-induced currents were 64 ± 11 pA with peak ΔF/Fo values of 103 ± 26% (n = 5).
Figure 5.

Membrane currents induced by a group I mGluR agonist. A, Left, ΔF/Fo image of a portion of the somatodendritic compartment of an MLI at the peak of the response to a 1 s puff of the specific group I mGluR agonist DHPG (100 μm). Right, Time course of the agonist-induced ΔF/Fo signals and the corresponding membrane current. Membrane potential, −70 mV. DHPG was applied at the time indicated by the bar above the ΔF/Fo trace. B, In a different MLI, DHPG (100 μm) elicits a briefer ΔF/Fo signal that correlates with a shorter-lived membrane current. The left panel displays the ΔF/Fo image at the peak of the DHPG response for this MLI. C, Voltage dependence of the mGluR1-induced current: currents elicited by 100 μm DHPG in a MLI recorded with Cs methanesulfonate solutions are shown for two membrane potentials (C1). Note the strong outward rectification, evident in the current-to-voltage relation for this MLI (C2).
These data show that the metabotropic currents and the initial Ca2+ rise are tightly linked, which strongly suggests a causal relation. Canonical transient receptor potential channels (TRPCs), first demonstrated to be present in brain tissue and susceptible to be activated by Gq-coupled receptors by Strübing et al. (2001), are attractive candidates to underlie the measured currents because they have been shown to link to group I mGluRs in neuronal cells (Gee et al., 2003; Bengtson et al., 2004; Berg et al., 2007; Ene et al., 2007; Wang et al., 2007) and are present in the rodent cerebellar cortex (Huang et al., 2007; Hartmann et al., 2008). In the cerebellar cortex, mGluR1-TRPC coupling has been described for PCs (Kim et al., 2003; Hartmann et al., 2008) (for a recent review, see Hartmann and Konnerth, 2009). We therefore investigated whether the single-channel properties of the DHPG-activated current are compatible with a TRPC conductance. To obtain the value of the elementary current associated with the mGluR-induced responses, variance analysis of the DHPG-induced currents was performed on currents measured at early times in WCRs, in MLIs dialyzed with a Cs methanesulfonate solution, which minimizes the contribution of K+ currents. In the six MLIs, this value was 1.25 ± 0.24 pA at −70 mV. The corresponding single-channel conductance of 16 pS compares to values for TRPC1 [16–20 pS; Vaca and Sampieri (2002)], TRPC3 [23 pS; Kamouchi et al. (1999)], and TRPC4 [18 pS; Walker et al. (2002)], when comparing values obtained from WCR measurements in cells bathed in saline containing 2 mm extracellular Ca2+. Generally, the single-channel conductance of other TRP channels is larger than the value obtained for TRPC1, 3, and 4.
To further characterize the mGluR-induced currents, we determined the current–voltage relationship using Cs methanesulfonate-loaded MLIs, as done by Karakossian and Otis (2004) for the recording of mGluR-mediated EPSCs in these neurons. Under these conditions, the proportion of WCR trials in which mGluR agonist elicited an ionic current was also quite low. The reason for the strong washout of mGluR responses in the present experiments remains unknown. In 3 MLIs of 32 trials, the DHPG-induced currents were maintained long enough during the WCR to measure the voltage dependence of the current (Fig. 5C1, C2). We found a very strong outward rectification (Fig. 5C2), which is similar to that seen for TRPC3 channels (Kamouchi et al., 1999; Dietrich et al., 2003) but unlike the current–voltage relationship for TRPC1 and 4 (Pedersen et al., 2005; Owsianik et al., 2006; Ramsey et al., 2006; Clapham, 2009). The rectification found in the MLIs also differs from that seen in hippocampal CA3 pyramidal cells (Gee et al., 2003).
Together, our data suggest that TRPCs underlie the mGluR-mediated currents in MLIs.
What is the source of Ca2+ during the mGluR-mediated responses?
To determine the source of Ca2+ during mGluR-mediated responses, we tested various pharmacological and ionic conditions on MLIs preloaded with Ca2+ indicator. Responses were initiated by puff application of quisqualate. We found that Ca2+ removal from the bath for a few minutes eliminated the Ca2+ transients in a reversible manner (Fig. 6A) and that preincubation with 2-APB (90 μm), a nonspecific potent blocker of TRPC3, TRPC4, TRPC5, and TRPC6 (van Rossum et al., 2000; Xu et al., 2005), strongly inhibited the response (Fig. 6B, summary). However, preincubation with U73122, an inhibitor of phospholipase C (PLC), did not affect the initial Ca2+ rise (Fig. 6B). Note that Ca2+ removal abolishes the response in both soma and dendrites (Fig. 6A2, A3), as expected from the similarity of the responses in these two regions (Fig. 4). We conclude from these results that the source of Ca2+ during the first phase of the response is extracellular, and that PLC activation is unnecessary. The effects of 2-APB suggest that the current associated with mGluR activation is responsible for Ca2+ entry. The receptor responsible for these responses is mGluR1, since CPCCOEt eliminated the agonist-evoked Ca2+ rises (n = 3; data not shown).
A very different set of results was found when investigating the Ca2+ response during prolonged quisqualate application. As in the case of the Ca2+ responses to puff application of mGluR agonists described above, prolonged bath application of agonist was only efficient in initiating a Ca2+ response if Ca2+ was present in the bath (Fig. 7A; summary in Fig. 7D). However, once the quisqualate-induced response was initiated, removal of Ca2+ did not prevent the generation of subsequent Ca2+ oscillations (Fig. 7B). Indeed, Ca2+ removal affected neither the amplitude nor the frequency of ongoing oscillations (Fig. 7D, summary). However, on Ca2+ readmission, the cell often went to a high Ca2+ plateau (Fig. 7B). To estimate the speed of Ca2+ removal from the extracellular space in these experiments, we stimulated the cells extracellularly to elicit action potential-induced Ca2+ rises. We found that these responses were totally eliminated after <2 min of Ca2+ removal (Fig. 7C). This result clearly demonstrates that the lack of effect of Ca2+ removal is not caused by Ca2+ remaining in the extracellular domain because of diffusion delays.
Figure 7.

Effects of interfering with Ca2+ influx on the Ca2+ oscillations. A, In a preloaded MLI, a 2 μm quisqualate bath applied during the time indicated by the black bar above the trace fails to elicit any change in Ca2+ when extracellular Ca2+ is absent (as indicated by the discontinuous gray bar above the trace). A small response to the agonist develops within 2.5 min after Ca2+ is readmitted (as indicated by the gray solid bar above the traces). B, In a different MLI, in which the oscillatory response to quisqualate is initiated in the presence of Ca2+, removal of this cation does not stop the oscillations. When the agonist is removed and Ca2+ is readmitted, there is a 2-min-long Ca2+ plateau. C, Time course for the effects of extracellular Ca2+ removal (during the bar above the data points) on the peak ΔF/Fo rises obtained from a MLI dendrite on direct extracellular stimulation of the dendrite. The MLI is the same as used for the experiment shown in B. D, Pooled data from preloaded MLIs on the effects of Ca2+ removal and of block of L-type channels by 20 μm nimodipine (Nimo). Data were analyzed in terms of the peak of the ΔF/Fo signals induced by quisqualate (top) and their oscillation frequency (bottom). The notation “before Quis” refers to experiments in which Ca2+ removal or nimodipine treatment were started 5 min before quisqualate was applied (example in A). The notation “during Quis” refers to experiments in which Ca2+ removal or nimodipine treatment was performed during the oscillatory response (example in B). In the “during Quis” condition, peak ΔF/Fo values were measured 3–5 min after Ca2+ removal or nimodipine treatment, and the frequency of oscillations was calculated from the ensuing 2–3 min of recording. n = 4 for groups Ctl vs 0 Ca before Quis and Ctl vs Nimo before Quis, and n = 6 for the Ctl vs 0 Ca during Quis and the Ctl vs Nimo during Quis groups. * indicates groups in which p was ≤0.05 using the paired Student's t test.
Because high-threshold L-type Ca2+ channels were previously shown to contribute to somatodendritic Ca2+ rises in MLIs (Chavas et al., 2004), we next asked whether the depolarization that is associated with the activation of the mGluR-mediated currents is sufficient to activate these channels, which could then contribute to the resulting Ca2+ signal. We found that addition of the L-type Ca2+ channel blocker nimodipine had effects similar to those of Ca2+ removal from the extracellular media. Whereas nimodipine (20 μm) applied before addition of the agonist resulted in a very strong inhibition of the entire response, nimodipine application after the initial agonist induced Ca2+ transient but, during an ongoing oscillation, only resulted in a modest inhibition of the amplitude of each Ca2+ wave, without disrupting the overall pattern of the response (Fig. 7D, summary).
The above results indicate that the previously noted differences between the first and subsequent Ca2+ transients correspond to profound differences concerning generation mechanism for each class of transients. Whereas the first transient depends on Ca2+ influx and is amplified by depolarization-induced activation of L-type Ca2+ channels, subsequent transients do not require extracellular Ca2+ or activation of L-type Ca2+ channels. Therefore, the first transient must be generated by Ca2+ entry, but the subsequent transients reflect primarily release from intracellular stores. Finally, it is important to note that the entire Ca2+ oscillatory response is abolished if the generation of the first transient has been prevented by previous Ca2+ removal. Thus, the first transient provides a signal that is necessary for the generation of subsequent oscillations.
Involvement of intracellular Ca2+ stores during prolonged mGluR activation
mGluR1 receptors are classically coupled to PLC, and activation of this lipase is essential for production of InsP3 in many systems. In cerebellar MLIs, the existence of InsP3-sensitive Ca2+ stores was recently demonstrated (Rengifo et al., 2007). As detailed above, the Ca2+ responses to puff application of quisqualate did not depend on PLC activation (Fig. 6). However, in view of the lack of effect of Ca2+ removal on ongoing oscillations, we asked whether PLC activation could be involved in the recruitment of intracellular Ca2+ stores after the initial response, during the subsequent Ca2+ transients. We therefore compared, in experiments using preloaded cells, the responses to prolonged applications of quisqualate before and after 10 min exposure to the PLC blocker U73122. On average, there was no change in the oscillation frequency in the presence of the inhibitor (Fig. 8A). Analysis of the areas under the first and subsequent phases of the oscillations shows that the first transient is unaffected, whereas the amplitude of subsequent transients is significantly diminished (Fig. 8A). Control experiments in which two applications of quisqualate were performed at 10 min intervals in MLIs maintained in control saline showed that neither the area nor the frequency of the oscillations changed during the 10 min period (data not shown; n = 5). These results suggest that PLC-mediated InsP3 production contributes to the maintenance of the Ca2+ oscillations.
To further test the involvement of InsP3Rs, responses to quisqualate were analyzed before and after the addition of caffeine (10 mm) to the bath. At this concentration, caffeine will inhibit InsP3Rs and can also activate ryanodine receptors (RyRs) (Bezprozvanny et al., 1994; Hernández-Cruz et al., 1997; Zucchi and Ronca-Testoni, 1997). We observed caffeine-induced Ca2+ transients, presumably caused by RyR activation, in only 1 of 10 MLIs. This suggests that RyR-mediated Ca2+ signals are modest in the somatodendritic compartment of MLIs, even though these receptors are located in MLI axons where they generate spontaneous Ca2+ transients (Llano et al., 2000). In accord with this interpretation, exposure to a dose of ryanodine (100 μm) expected to fully block RyRs had a small effect on the oscillations, as shown in Figure 8B. Oscillation frequency was the same before and after exposure to ryanodine, although the area under the first transient is decreased by the drug (Fig. 8C shows pooled results from 6 cells). On the other hand, responses to quisqualate were strongly inhibited by caffeine, an effect that reversed on washout to the drug (Fig. 8D). On average, the peak amplitude, the area under the first transient, and the oscillation frequency were significantly decreased by caffeine (Fig. 8E). These results suggest that release of Ca2+ via RyRs contributes to the magnitude of the first transient, whereas InsP3Rs are critical for maintaining the subsequent Ca2+ transients during prolonged administration of mGluR agonist.
Discussion
Cellular mechanisms underlying mGluR1-induced bursting
Our results show that the firing pattern of MLIs changes dramatically from silence or irregular occasional firing in control conditions to highly regular periodic bursting on activation of mGluR1s. Furthermore, our analysis suggests that in the presence of mGluR1 agonists, periods of spiking are locked to changes in Ca2+. Thus, it is the slow Ca2+ oscillations, with a period of ∼30 s, that entrain the bursts of action potentials. Finally, the present results indicate that the first Ca2+ transient has distinctive properties and that this early transient plays an essential functional role in initiating the overall Ca2+ oscillation.
During the initial phase of the response, two synergistic pathways for Ca2+ influx, L-type Ca2+ channels and TRPC-like channels, are engaged by the activation of mGluR1. In preloaded conditions, in which the membrane potential of MLIs can change as a function of the activity of various conductances, the depolarization caused by the cationic current flowing through TRPC-like channels is likely to provide the gating for L-type Ca2+ channels. The Ca2+ influx through these two plasma membrane proteins would sensitize the PLC and the intracellular Ca2+ release channels, creating optimal conditions for an oscillating Ca2+ signal. L-type Ca2+ channels participate in Ca2+ rises elicited in hippocampal CA3 neurons by mossy fiber stimulation, thought to involve group I mGluRs and InsP3-dependent Ca2+ release (Kapur et al., 2001).
Concerning TRPCs, our results add to the growing list of cellular processes in which these proteins participate (for review, see Moran et al., 2004; Owsianik et al., 2006; Gerber et al., 2007). It has been reported that antibodies for TRPC6, but no other types of TRPCs, stain cells in the molecular layer that could be MLIs (Huang et al., 2007). However, immunostaining by Hartmann et al. (2008) shows TRPC3-positive cell bodies in the molecular layer. The properties we obtain for the DHPG-induced currents in MLIs (single-channel conductance of 16 pS; current–voltage relation with strong outward rectification) argue for a TRPC3-like conductance. However, the lack of pharmacological tools prevents us from dissecting the contribution of specific TRPCs to our responses.
Subsequent Ca2+ oscillations do not require action potentials (Fig. 4) or Ca2+ influx (Fig. 7), but they depend on the activation of InsP3Rs (Fig. 8). Thus, the most likely scenario for these transients is a succession of emptying of InsP3-sensitive stores into the cytosol, followed by recapture of cytosolic Ca2+ into the stores. Because blockade of PLC does not abolish the mGluR1-induced response, it appears that the basal InsP3 concentration is sufficient to initiate the response. Nevertheless, blockade of PLC does inhibit the secondary Ca2+ transients, suggesting that activation of mGluR1s and Ca2+ elevation both contribute to activate PLC. Additionally, it is important to note that the continuous presence of agonist is a prerequisite for the generation of the repetitive Ca2+ signals. The reason for such a requirement is likely to be attributable to the fact that InsP3 is continuously degraded in the cytosol, and its speed of degradation increases with cytosolic Ca2+ (Sims and Allbritton, 1998). Therefore, to sustain an InsP3-dependent oscillation, continuous production of InsP3 is required, and this necessitates continuous binding of agonist by the mGluRs.
A full elucidation of the mechanisms underlying the secondary Ca2+ transients will await further investigation. However, the exact synchrony between firing and the onset of Ca2+ transients during this phase of the response (Fig. 2B2) suggests that one effect of mGluR1 activation (perhaps via TRPCs) is to allow the start of each transient by depolarizing the cell.
Upstream signaling: potential stimulation mechanisms
Although the results show that electrical stimulation in the molecular layer can release enough glutamate to trigger mGluR1-induced oscillations, they leave open possibilities of both a PF- and/or a climbing fiber (CF)-mediated stimulation in physiological conditions. In favor of the former possibility, we note that rat cerebellar granule cells (GCs) in vivo spike at high frequency on whisker stimulation (Chadderton et al., 2004). This bursting behavior is well suited to activate mGluRs at PF-MLI synapses. However, the latter option is also attractive for two reasons. First, recent results indicate that CF stimulation activates MLIs by a spillover mechanism, a type of stimulus that preferentially targets mGluRs (Szapiro and Barbour, 2007). Second, work in vivo revealed that MLIs and CFs fire together when animals are subject to tactile (Ekerot and Jörntell, 2001) or to vestibular (Barmack and Yakhnitsa, 2008) stimuli.
As discussed above, the maintenance of oscillations requires continuous binding of agonists by mGluRs. The question then arises as to whether glutamate release on MLIs will ever last sufficiently long to produce oscillatory phenomena. A first glimpse into this issue is provided by GC recordings in nonanesthetized cats in vivo, showing that during cutaneous stimulation, the evoked GC spikes last as long as the stimulus is present (Jörntell and Ekerot, 2006) (these spikes occur at frequencies up to 900 Hz). We would then expect that, in a behaving animal subject to continuous tactile stimulation, GCs receiving information from cutaneous inputs will sustain firing for periods of minutes and that such firing will lead to mGluR-mediated oscillatory signals. Determining the exact physiological conditions that may produce Ca2+ oscillations in MLIs will require further investigation.
Downstream signaling: potential functional consequences of Ca2+ waves in MLI bursts
The PF-stellate synapse displays long-term plasticity involving group I and II postsynaptic mGluRs (Rancillac and Crépel, 2004). The present results suggest that one of the underlying mechanisms for this plasticity is mGluR1-dependent Ca2+ elevation. Furthermore, when mGluR1 activation and subsequent signaling cascades are activated for a sufficiently long period to produce oscillatory signals, profound changes in the mode of firing of MLIs are produced. Such changes could have far-reaching functional consequences. A plausible outcome is a long-term modification in the size of receptive fields, because such a change is induced in vivo by high-frequency trains of PF stimulation applied repeatedly during several minutes (Jörntell and Ekerot, 2002). The possibility that mGluRs are involved in the long-term plasticity of receptive fields has already been discussed by Karakossian and Otis (2004).
PCs fire bursts of action potentials that are inhibited by the stimulation of complex spikes by CFs (Tank et al., 1988; Cerminara and Rawson, 2004; Womack and Khodakhah, 2004). The present demonstration, that in certain conditions MLIs can similarly adopt a periodic bursting pattern, raises the possibility that in these conditions, MLIs and postsynaptic PCs could oscillate in phase opposition. Because PCs form a recurrent network together with deep cerebellar nuclei and the inferior olive (Llinas et al., 2004), MLI bursting could participate in an overall oscillation pattern involving all of these structures. Such oscillations have already been considered on a much faster time base; here we are pointing out the possibility of a similar scheme with an approximately 1000 times slower period.
Comparison of the effects of mGluR1 activation in interneurons and in principal cells
In hippocampal CA1 pyramidal neurons, local application of mGluR agonists (Jaffe and Brown, 1994) and synaptic activation of mGluRs (Nakamura et al., 1999) lead to Ca2+ rises that propagate throughout the dendritic arbor and can reach the neuronal soma (Nakamura et al., 1999). In contrast, interneurons exhibit oscillations both of electrical activity (McBain et al., 1994) and Ca2+ levels (Woodhall et al., 1999). The demonstration of robust oscillating signals implicating spike bursts and Ca2+ rises in MLIs raises the possibility of a specific propensity of interneurons to generate slow oscillations in response to mGluR1 activation.
Abnormal motor behavior has been reported in mGluR1 knock-out mice (Aiba et al., 1994; Conquet et al., 1994). Also, mGluR1 is important for synapse elimination during development (Ichise et al., 2000). To date, most of the work on the underlying mechanisms concerns metabotropic signaling in PCs, where group I mGluRs have been extensively studied (for review, see Hartmann and Konnerth, 2009). Activation of PC mGluRs induces slow synaptic potentials, initially described by Batchelor and Garthwaite (1993), for which several molecular substrates have been considered, including Ca2+-permeable small-conductance channels (Canepari et al., 2004) and TRPCs (type C1, Kim et al., 2003; type C3, Hartmann et al., 2008). Additionally, PCs respond to PF stimulation with mGluR-mediated Ca2+ rises engaging PLC-dependent InsP3 production and subsequent Ca2+ release from intracellular stores (Finch and Augustine, 1998; Takechi et al., 1998). In juvenile PCs, mGluRs are also activated on stimulation of CFs, and the ensuing responses play a key role in the pruning of multiple CFs (Dzubay and Otis, 2002). It is presently unclear to which extent the phenotype associated with mGluR1 deficit should be ascribed to MLIs. A major difference between PCs and MLIs concerns the role of PLC, which is directly responsible for the Ca2+ elevation in the former case, but has only a marginal role in the latter case. In addition, whereas InsP3-linked Ca2+ rises in PCs are restricted to small areas of the dendritic arbor (Finch and Augustine, 1998; Takechi et al., 1998), the responses to mGluR activation that we report for MLIs concern the somatodendritic domain.
In summary, we show that sustained mGluR1 activation leads to a dramatic switch in the spike pattern and Ca2+ oscillations in MLIs. The mechanistic explanation of these changes is explored and roles for both plasma membrane and intracellular channels are described. The slow, highly regular oscillations revealed by the present work are likely to drive pauses in postsynaptic PCs, and could play a role in coordinating slow oscillations involving the cerebello-olivar circuit loop.
Footnotes
This work was supported by the Centre National de la Recherche Scientifique, by a grant from the Agence Nationale de la Recherche, and by a fellowship from the Fondation pour la Recherche Médicale to R.F. We thank Dr. Alain Marty for valuable discussions and for his comments on this manuscript.
References
- Aiba A, Kano M, Chen C, Stanton ME, Fox GD, Herrup K, Zwingman TA, Tonegawa S. Deficient cerebellar long-term depression and impaired motor learning in mGluR1 mutant mice. Cell. 1994;79:377–388. [PubMed] [Google Scholar]
- Barbour B, Häusser M. Intersynaptic diffusion of neurotransmitter. Trends Neurosci. 1997;20:377–384. doi: 10.1016/s0166-2236(96)20050-5. [DOI] [PubMed] [Google Scholar]
- Barmack NH, Yakhnitsa V. Functions of interneurons in mouse cerebellum. J Neurosci. 2008;28:1140–1152. doi: 10.1523/JNEUROSCI.3942-07.2008. [DOI] [PMC free article] [PubMed] [Google Scholar]
- Batchelor AM, Garthwaite J. Novel synaptic potentials in cerebellar Purkinje cells: probable mediation by metabotropic glutamate receptors. Neuropharmacology. 1993;32:11–20. doi: 10.1016/0028-3908(93)90124-l. [DOI] [PubMed] [Google Scholar]
- Baude A, Nusser Z, Roberts JD, Mulvihill E, McIlhinney RA, Somogyi P. The metabotropic glutamate receptor (mGluR1 alpha) is concentrated at perisynaptic membrane of neuronal subpopulations as detected by immunogold reaction. Neuron. 1993;11:771–787. doi: 10.1016/0896-6273(93)90086-7. [DOI] [PubMed] [Google Scholar]
- Bengtson CP, Tozzi A, Bernardi G, Mercuri NB. Transient receptor potential-like channels mediate metabotropic glutamate receptor EPSCs in rat dopamine neurones. J Physiol. 2004;555:323–330. doi: 10.1113/jphysiol.2003.060061. [DOI] [PMC free article] [PubMed] [Google Scholar]
- Berg AP, Sen N, Bayliss DA. TrpC3/C7 and Slo2.1 are molecular targets for metabotropic glutamate receptor signaling in rat striatal cholinergic interneurons. J Neurosci. 2007;27:8845–8856. doi: 10.1523/JNEUROSCI.0551-07.2007. [DOI] [PMC free article] [PubMed] [Google Scholar]
- Bezprozvanny I, Bezprozvannaya S, Ehrlich BE. Caffeine-induced inhibition of inositol(1,4,5)-trisphosphate-gated calcium channels from cerebellum. Mol Biol Cell. 1994;5:97–103. doi: 10.1091/mbc.5.1.97. [DOI] [PMC free article] [PubMed] [Google Scholar]
- Canepari M, Auger C, Ogden D. Ca2+ ion permeability and single-channel properties of the metabotropic slow EPSC of rat Purkinje neurons. J Neurosci. 2004;24:3563–3573. doi: 10.1523/JNEUROSCI.5374-03.2004. [DOI] [PMC free article] [PubMed] [Google Scholar]
- Carter AG, Regehr WG. Prolonged synaptic currents and glutamate spillover at the parallel fiber to stellate cell synapse. J Neurosci. 2000;20:4423–4434. doi: 10.1523/JNEUROSCI.20-12-04423.2000. [DOI] [PMC free article] [PubMed] [Google Scholar]
- Cerminara NL, Rawson JA. Evidence that climbing fibers control an intrinsic spike generator in cerebellar Purkinje cells. J Neurosci. 2004;24:4510–4517. doi: 10.1523/JNEUROSCI.4530-03.2004. [DOI] [PMC free article] [PubMed] [Google Scholar]
- Chadderton P, Margrie TW, Häusser M. Integration of quanta in cerebellar granule cells during sensory processing. Nature. 2004;428:856–860. doi: 10.1038/nature02442. [DOI] [PubMed] [Google Scholar]
- Chavas J, Forero ME, Collin T, Llano I, Marty A. Osmotic tension as a possible link between GABA(A) receptor activation and intracellular calcium elevation. Neuron. 2004;44:701–713. doi: 10.1016/j.neuron.2004.11.002. [DOI] [PubMed] [Google Scholar]
- Clapham DE. Clapham Lab Publications. 2009. http://clapham.tch.harvard.edu.
- Collin T, Chat M, Lucas MG, Moreno H, Racay P, Schwaller B, Marty A, Llano I. Developmental changes in parvalbumin regulate presynaptic Ca2+ signaling. J Neurosci. 2005;25:96–107. doi: 10.1523/JNEUROSCI.3748-04.2005. [DOI] [PMC free article] [PubMed] [Google Scholar]
- Conquet F, Bashir ZI, Davies CH, Daniel H, Ferraguti F, Bordi F, Franz-Bacon K, Reggiani A, Matarese V, Condé F, Collingridge GL, Crépel F. Motor deficit and impairment of synaptic plasticity in mice lacking mGluR1. Nature. 1994;372:237–243. doi: 10.1038/372237a0. [DOI] [PubMed] [Google Scholar]
- Conti R, Tan YP, Llano I. Action potential-evoked and ryanodine-sensitive spontaneous Ca2+ transients at the presynaptic terminal of a developing CNS inhibitory synapse. J Neurosci. 2004;24:6946–6957. doi: 10.1523/JNEUROSCI.1397-04.2004. [DOI] [PMC free article] [PubMed] [Google Scholar]
- Dietrich A, Mederos y Schnitzler M, Emmel J, Kalwa H, Hofmann T, Gudermann T. N-linked protein glycosylation is a major determinant for basal TRPC3 and TRPC6 channel activity. J Biol Chem. 2003;278:47842–47852. doi: 10.1074/jbc.M302983200. [DOI] [PubMed] [Google Scholar]
- Dzubay JA, Otis TS. Climbing fiber activation of metabotropic glutamate receptors on cerebellar Purkinje neurons. Neuron. 2002;36:1159–1167. doi: 10.1016/s0896-6273(02)01052-8. [DOI] [PubMed] [Google Scholar]
- Ekerot CF, Jörntell H. Parallel fibre receptive fields of Purkinje cells and interneurons are climbing fibre-specific. Eur J Neurosci. 2001;13:1303–1310. doi: 10.1046/j.0953-816x.2001.01499.x. [DOI] [PubMed] [Google Scholar]
- Ene FA, Kalmbach A, Kandler K. Metabotropic glutamate receptors in the lateral superior olive activate TRP-like channels: age- and experience-dependent regulation. J Neurophysiol. 2007;97:3365–3375. doi: 10.1152/jn.00686.2006. [DOI] [PMC free article] [PubMed] [Google Scholar]
- Finch EA, Augustine GJ. Local calcium signaling by inositiol-1,4,5-trisphosphate in Purkinje cell dendrites. Nature. 1998;396:753–756. doi: 10.1038/25541. [DOI] [PubMed] [Google Scholar]
- Fukunaga I, Yeo CH, Batchelor AM. The mGlu1 antagonist CPCCOEt enhances the climbing fibre response in Purkinje neurones independently of glutamate receptors. Neuropharmacology. 2007;52:450–458. doi: 10.1016/j.neuropharm.2006.08.014. [DOI] [PubMed] [Google Scholar]
- Gee CE, Benquet P, Gerber U. Group I metabotropic glutamate receptors activate a calcium-sensitive transient receptor potential-like conductance in rat hippocampus. J Physiol. 2003;546:655–664. doi: 10.1113/jphysiol.2002.032961. [DOI] [PMC free article] [PubMed] [Google Scholar]
- Gerber U, Gee CE, Benquet P. Metabotropic glutamate receptors: intracellular signaling pathways. Curr Opin Pharmacol. 2007;7:56–61. doi: 10.1016/j.coph.2006.08.008. [DOI] [PubMed] [Google Scholar]
- Hartmann J, Konnerth A. Mechanisms of metabotropic glutamate receptor-mediated synaptic signaling in cerebellar Purkinje cells. Acta Physiol. 2009;195:79–90. [Google Scholar]
- Hartmann J, Dragicevic E, Adelsberger H, Henning HA, Sumser M, Abramowitz J, Blum R, Dietrich A, Freichel M, Flockerzi V, Birnbaumer L, Konnerth A. TRPC3 channels are required for synaptic transmission and motor coordination. Neuron. 2008;59:392–398. doi: 10.1016/j.neuron.2008.06.009. [DOI] [PMC free article] [PubMed] [Google Scholar]
- Häusser M, Clark BA. Tonic synaptic inhibition modulates neuronal output pattern and spatiotemporal synaptic integration. Neuron. 1997;19:665–678. doi: 10.1016/s0896-6273(00)80379-7. [DOI] [PubMed] [Google Scholar]
- Hernández-Cruz A, Escobar AL, Jiménez N. Ca2+-induced Ca2+ release phenomena in mammalian sympathetic neurons are critically dependent on the rate of rise of trigger Ca2+ J Gen Physiol. 1997;109:147–167. doi: 10.1085/jgp.109.2.147. [DOI] [PMC free article] [PubMed] [Google Scholar]
- Huang WC, Young JS, Glitsch MD. Changes in TRPC channel expression during postnatal development of cerebellar neurons. Cell Calcium. 2007;42:1–10. doi: 10.1016/j.ceca.2006.11.002. [DOI] [PubMed] [Google Scholar]
- Ichise T, Kano M, Hashimoto K, Yanagihara D, Nakao K, Shigemoto R, Katsuki M, Aiba A. mGluR1 in cerebellar Purkinje cells essential for long-term depression, synapse elimination, and motor coordination. Science. 2000;288:1832–1835. doi: 10.1126/science.288.5472.1832. [DOI] [PubMed] [Google Scholar]
- Jaffe DB, Brown TH. Metabotropic glutamate receptor activation induces calcium waves within hippocampal dendrites. J Neurophysiol. 1994;72:471–474. doi: 10.1152/jn.1994.72.1.471. [DOI] [PubMed] [Google Scholar]
- Jörntell H, Ekerot CF. Reciprocal bidirectional plasticity of parallel fibre receptive fields in cerebellar Purkinje cells and their afferent interneurons. Neuron. 2002;34:797–806. doi: 10.1016/s0896-6273(02)00713-4. [DOI] [PubMed] [Google Scholar]
- Jörntell H, Ekerot CF. Properties of somatosensory integration in cerebellar granule cells in vivo. J Neurosci. 2006;26:11786–11797. doi: 10.1523/JNEUROSCI.2939-06.2006. [DOI] [PMC free article] [PubMed] [Google Scholar]
- Kamouchi M, Philipp S, Flockerzi V, Wissenbach U, Mamin A, Raeymaekers L, Eggermont J, Droogmans G, Nilius B. Properties of heterologously expressed hTRP3 channels in bovine pulmonary artery endothelial cells. J Physiol. 1999;518:345–358. doi: 10.1111/j.1469-7793.1999.0345p.x. [DOI] [PMC free article] [PubMed] [Google Scholar]
- Kapur A, Yeckel M, Johnston D. Hippocampal mossy fiber activity evokes Ca2+ release in CA3 pyramidal neurons via a metabotropic glutamate receptor pathway. Neuroscience. 2001;107:59–69. doi: 10.1016/s0306-4522(01)00293-7. [DOI] [PMC free article] [PubMed] [Google Scholar]
- Karakossian MH, Otis TS. Excitation of cerebellar interneurones by group I metabotropic glutamate receptors. J Neurophysiol. 2004;92:1558–1565. doi: 10.1152/jn.00300.2004. [DOI] [PMC free article] [PubMed] [Google Scholar]
- Kawabata S, Tsutsumi R, Kohara A, Yamaguchi T, Nakanishi S, Okada M. Control of calcium oscillations by phosphorylation of metabotropic glutamate receptors. Nature. 1996;383:89–92. doi: 10.1038/383089a0. [DOI] [PubMed] [Google Scholar]
- Kawabata S, Kohara A, Tsutsumi R, Itahana H, Hayashibe S, Yamaguchi T, Okada M. Diversity of calcium signaling by metabotropic glutamate receptors. J Biol Chem. 1998;273:17381–17385. doi: 10.1074/jbc.273.28.17381. [DOI] [PubMed] [Google Scholar]
- Kim SJ, Kim YS, Yuan JP, Petralia RS, Worley PF, Linden DJ. Activation of the TRPC1 cation channel by metabotropic glutamate receptor mGluR1. Nature. 2003;426:285–291. doi: 10.1038/nature02162. [DOI] [PubMed] [Google Scholar]
- Kondo S, Marty A. Synaptic currents at individual connections among stellate cells in rat cerebellar slices. J Physiol. 1998;509:221–232. doi: 10.1111/j.1469-7793.1998.221bo.x. [DOI] [PMC free article] [PubMed] [Google Scholar]
- Llano I, Marty A. Presynaptic metabotropic glutamate regulation of inhibitory synapses in rat cerebellar slices. J Physiol. 1995;486:163–176. doi: 10.1113/jphysiol.1995.sp020800. [DOI] [PMC free article] [PubMed] [Google Scholar]
- Llano I, González J, Caputo C, Lai AF, Blayney LM, Tan YP, Marty A. Ryanodine-sensitive Ca2+ stores underlie large amplitude miniature IPSCs and spontaneous presynaptic Ca2+ transients at Purkinje cell synapses. Nat Neurosci. 2000;3:1256–1265. doi: 10.1038/81781. [DOI] [PubMed] [Google Scholar]
- Llinas RR, Walton KD, Lang EJ. Cerebellum. In: Shepherd GM, editor. The synaptic organization of the brain. New York: Oxford UP; 2004. pp. 271–309. [Google Scholar]
- Mann-Metzer P, Yarom Y. Electrotonic coupling interacts with intrinsic properties to generate synchronized activity in cerebellar networks of inhibitory interneurons. J Neurosci. 1999;19:3298–3306. doi: 10.1523/JNEUROSCI.19-09-03298.1999. [DOI] [PMC free article] [PubMed] [Google Scholar]
- McBain CJ, Fisahn A. Interneurons unbound. Nat Rev Neurosci. 2001;2:11–23. doi: 10.1038/35049047. [DOI] [PubMed] [Google Scholar]
- McBain CJ, DiChiara TJ, Kauer JA. Activation of metabotropic glutamate receptors differentially affects two classes of hippocampal interneurons and potentiates excitatory synaptic transmission. J Neurosci. 1994;14:4433–4445. doi: 10.1523/JNEUROSCI.14-07-04433.1994. [DOI] [PMC free article] [PubMed] [Google Scholar]
- Moran MM, Xu H, Clapham DE. TRP ion channels in the nervous system. Curr Opin Neurobiol. 2004;14:362–369. doi: 10.1016/j.conb.2004.05.003. [DOI] [PubMed] [Google Scholar]
- Moroni F, Lombardi G, Thomsen C, Leonardi P, Attucci S, Peruginelli F, Torregrossa SA, Pellegrini-Giampietro DE, Luneia R, Pellicciari R. Pharmacological characterization of 1-aminoindan-1,5-dicarboxylic acid, a potent mGluR1 antagonist. J Pharmacol Exp Ther. 1997;281:721–729. [PubMed] [Google Scholar]
- Nakamura T, Barbara JG, Nakamura K, Ross WN. Synergistic release of Ca2+ from IP3-sensitive stores evoked by synaptic activation of mGluRs paired with backpropagating action potentials. Neuron. 1999;24:727–737. doi: 10.1016/s0896-6273(00)81125-3. [DOI] [PubMed] [Google Scholar]
- Otani S, Auclair N, Desce JM, Roisin MP, Crépel F. Dopamine receptors and groups I and II mGluRs cooperate for long-term depression induction in rat prefrontal cortex through converging postsynaptic activation of MAP kinases. J Neurosci. 1999;19:9788–97802. doi: 10.1523/JNEUROSCI.19-22-09788.1999. [DOI] [PMC free article] [PubMed] [Google Scholar]
- Owsianik G, Talavera K, Voets T, Nilius B. Permeation and selectivity of TRP channels. Annu Rev Physiol. 2006;68:685–717. doi: 10.1146/annurev.physiol.68.040204.101406. [DOI] [PubMed] [Google Scholar]
- Pedersen SF, Owsianik G, Nilius B. TRP channels: an overview. Cell Calcium. 2005;38:233–252. doi: 10.1016/j.ceca.2005.06.028. [DOI] [PubMed] [Google Scholar]
- Ramsey IS, Delling M, Clapham DE. An introduction to TRP channels. Annu Rev Physiol. 2006;68:619–647. doi: 10.1146/annurev.physiol.68.040204.100431. [DOI] [PubMed] [Google Scholar]
- Rancillac A, Crépel F. Synapses between parallel fibres and stellate cells express long-term changes in synaptic efficacy in rat cerebellum. J Physiol. 2004;554:707–720. doi: 10.1113/jphysiol.2003.055871. [DOI] [PMC free article] [PubMed] [Google Scholar]
- Rengifo J, Gibson CJ, Winkler E, Collin T, Ehrlich BE. Regulation of the inositol 1,4,5-trisphosphate receptor type I by O-GlcNAc glycosylation. J Neurosci. 2007;27:13813–13821. doi: 10.1523/JNEUROSCI.2069-07.2007. [DOI] [PMC free article] [PubMed] [Google Scholar]
- Rossi B, Maton G, Collin T. Calcium-permeable presynaptic AMPA receptors in cerebellar molecular layer interneurones. J Physiol. 2008;586:5129–5145. doi: 10.1113/jphysiol.2008.159921. [DOI] [PMC free article] [PubMed] [Google Scholar]
- Shin JH, Kim YS, Worley PF, Linden DJ. Depolarization induced slow current in cerebellar Purkinje cells does not require mGluR1. Neuroscience. 2009 doi: 10.1016/j.neuroscience.2009.01.044. [DOI] [PMC free article] [PubMed] [Google Scholar]
- Sims CE, Allbritton NL. Metabolism of inositol 1,4,5-trisphosphate and inositol 1,3,4,5-tetrakisphosphate by the oocytes of Xenopus laevis. J Biol Chem. 1998;13:4052–4058. doi: 10.1074/jbc.273.7.4052. [DOI] [PubMed] [Google Scholar]
- Strübing C, Krapivinsky G, Krapivinsky L, Clapham DE. TRPC1 and TRPC5 form a novel cation channel in mammalian brain. Neuron. 2001;29:645–655. doi: 10.1016/s0896-6273(01)00240-9. [DOI] [PubMed] [Google Scholar]
- Szapiro G, Barbour B. Multiple climbing fibers signal to molecular layer interneurons exclusively via glutamate spillover. Nat Neurosci. 2007;10:735–742. doi: 10.1038/nn1907. [DOI] [PubMed] [Google Scholar]
- Takechi H, Eilers J, Konnerth A. A new class of synaptic response involving calcium release in dendritic spines. Nature. 1998;396:757–760. doi: 10.1038/25547. [DOI] [PubMed] [Google Scholar]
- Tan YP, Llano I, Hopt A, Würriehausen F, Neher E. Fast scanning and efficient photodetection in a simple two-photon microscope. J Neurosci Methods. 1999;92:123–135. doi: 10.1016/s0165-0270(99)00103-x. [DOI] [PubMed] [Google Scholar]
- Tank DW, Sugimori M, Connor JA, Llinás RR. Spatially resolved calcium dynamics of mammalian Purkinje cells in cerebellar slice. Science. 1988;242:773–777. doi: 10.1126/science.2847315. [DOI] [PubMed] [Google Scholar]
- Vaca L, Sampieri A. Calmodulin modulates the delay period between release of calcium from internal stores and activation of calcium influx via endogenous TRP1 channels. J Biol Chem. 2002;277:42178–42187. doi: 10.1074/jbc.M204531200. [DOI] [PubMed] [Google Scholar]
- van Rossum DB, Patterson RL, Ma HT, Gill DL. Ca2+ entry mediated by store depletion, S-nitrosylation, and TRP3 channels. Comparison of coupling and function. J Biol Chem. 2000;275:28562–28568. doi: 10.1074/jbc.M003147200. [DOI] [PubMed] [Google Scholar]
- Vincent P, Marty A. Fluctuations of inhibitory post-synaptic currents in Purkinje cells from rat cerebellar slices. J Physiol. 1996;494:183–199. doi: 10.1113/jphysiol.1996.sp021484. [DOI] [PMC free article] [PubMed] [Google Scholar]
- Walker RL, Koh SD, Sergeant GP, Sanders KM, Horowitz B. TRPC4 currents have properties similar to the pacemaker current in interstitial cells of Cajal. Am J Physiol Cell Physiol. 2002;283:C1637–C1645. doi: 10.1152/ajpcell.00266.2002. [DOI] [PubMed] [Google Scholar]
- Wang M, Bianchi R, Chuang SC, Zhao W, Wong RK. Group I metabotropic glutamate receptor-dependent TRPC channel trafficking in hippocampal neurons. J Neurochem. 2007;101:411–421. doi: 10.1111/j.1471-4159.2006.04377.x. [DOI] [PubMed] [Google Scholar]
- Womack MD, Khodakhah K. Dendritic control of spontaneous bursting in cerebellar Purkinje cells. J Neurosci. 2004;24:3511–3521. doi: 10.1523/JNEUROSCI.0290-04.2004. [DOI] [PMC free article] [PubMed] [Google Scholar]
- Woodhall G, Gee CE, Robitaille R, Lacaille JC. Membrane potential and intracellular Ca2+ oscillations activated by mGluRs in hippocampal stratum oriens/alveus interneurons. J Neurophysiol. 1999;81:371–382. doi: 10.1152/jn.1999.81.1.371. [DOI] [PubMed] [Google Scholar]
- Xu SZ, Zeng F, Boulay G, Grimm C, Harteneck C, Beech DJ. Block of TRPC5 channels by 2-aminoethoxydiphenyl borate: a differential, extracellular and voltage-dependent effect. Br J Pharmacol. 2005;145:405–414. doi: 10.1038/sj.bjp.0706197. [DOI] [PMC free article] [PubMed] [Google Scholar]
- Zucchi R, Ronca-Testoni S. The sarcoplasmic reticulum Ca2+ channel/ryanodine receptor: modulation by endogenous effectors, drugs and disease states. Pharmacol Rev. 1997;49:1–51. [PubMed] [Google Scholar]