

Abstract
Retrieval of word meaning from the semantic system and its integration with context are often assumed to be shared by spoken and written words. How is modality-independent semantic processing manifested in the brain, spatially and temporally? Time-sensitive neuroimaging allows tracking of neural activation sequences. Use of semantically related versus unrelated word pairs or sentences ending with a semantically highly or less plausible word, in separate studies of the auditory and visual modality, has associated lexical-semantic analysis with sustained activation at ∼200–800 ms. Magnetoencephalography (MEG) studies have further identified the superior temporal cortex as a main locus of the semantic effect. Nevertheless, a direct comparison of the spatiotemporal neural correlates of visual and auditory word comprehension in the same brain is lacking. We used MEG to compare lexical-semantic analysis in the visual and auditory domain in the same individuals, and contrasted it with phonological analysis that, according to models of language perception, should occur at a different time with respect to semantic analysis in reading and speech perception. The stimuli were lists of four words that were either semantically or phonologically related, or with the final word unrelated to the preceding context. Superior temporal activation reflecting semantic processing occurred similarly in the two modalities, left-lateralized at 300–450 ms and thereafter bilaterally, generated in close-by areas. Effect of phonology preceded the semantic effect in speech perception but not in reading. The present data indicate involvement of the middle superior temporal cortex in semantic processing from ∼300 ms onwards, regardless of input modality.
Introduction
The processing of written and spoken words starts with modality-specific analysis of visual features or acoustic signals. These stages are assumed to be followed by further modality-specific processing, i.e., analysis of graphemes of written words and phonetic features of spoken words. When entering core linguistic processes, such as semantic analysis, the question arises at what point, if ever, neural processing becomes independent of the input modality. In models of language processing, and based on the secondary status of reading in language development, retrieval of word meaning from a semantic system and its integration with the context are often assumed to be common for spoken and written words (Patterson and Shewell, 1987).
Magnetoencephalography (MEG) studies that provide information of both timing and location of cortical activation have associated lexical-semantic processing most consistently with sustained activation of the middle superior temporal cortex at ∼200–800 ms, both in the case of written (Simos et al., 1997; Helenius et al., 1998; Halgren et al., 2002; Pylkkänen et al., 2006) and spoken words (Helenius et al., 2002; Uusvuori et al., 2008). However, these studies have focused on either the visual or auditory input modality.
In the present study, we directly compared neural correlates of lexical-semantic processing for written and spoken words in the same individuals using MEG. The specific functional manipulation was realized with semantic priming that has been widely used in behavioral and neuroimaging experiments. In typical semantic priming experiments, the target word is preceded by a prime word that has related meaning (Nobre and McCarthy, 1994). Electroencephalography (EEG) and MEG studies have also used sentences that end with the expected word or a semantically inappropriate one (Kutas and Hillyard, 1980; Connolly et al., 1995; Helenius et al., 1998). To build a strong semantic expectation of the target word, while avoiding contamination by expectation of sound form present in sentence tasks, we used lists of four words. The first three words of the list were semantically related, and the final word either agreed with that context or was semantically unrelated. The areas and time-windows that show suppression of activation over the course of the first three words and increase of activation to a semantically unrelated list-final word may be interpreted as reflecting sensitivity to semantic information. The semantic content of the word must be available in the time window in which the suppression/increase occurs.
Semantic processing was contrasted with phonological analysis that is assumed to precede semantic analysis in speech perception (Patterson and Shewell, 1987) and co-occur with it in reading (Coltheart et al., 1993; Harm and Seidenberg, 2004). In typical phonological priming experiments, the prime and the target share phonemes (Rugg and Barrett, 1987). Our study included phonological lists in which the words had the same initial phonemes but were not related semantically. If suppression/increase is specific to semantic processing, it should not appear in the phonological lists.
Materials and Methods
Subjects.
Ten right-handed Finnish-speaking subjects (5 females; 21–29 years, mean 25 years) participated in the experiment. The subjects had normal or corrected-to-normal vision and normal hearing, and none of them reported a history of neurological abnormalities. Informed consent was obtained from all subjects, in agreement with the prior approval of the Helsinki and Uusimaa Ethics Committee.
Stimuli and experimental design.
Stimuli were lists of four words. The first three words had either a related meaning or began with the same two letters/phonemes (the Finnish language has a one-to-one correspondence between letters and phonemes). The final word of the list either matched the framework set by the first three words or differed from it semantically or phonologically. The lists thus fell into four categories, according to the type of the final word: (1) semantically related, (2) semantically unrelated, (3) phonologically related, and (4) phonologically unrelated. Figure 1 gives an example of each list type (actual stimuli in Finnish). There were 87 word lists per category and 348 lists in total. The subject's task was to press a button when s/he detected a word list in which one word appeared twice (detection rate on average 85%). The probability of these target lists was 6% (20 lists). The target lists were not included in the analysis.
Figure 1.
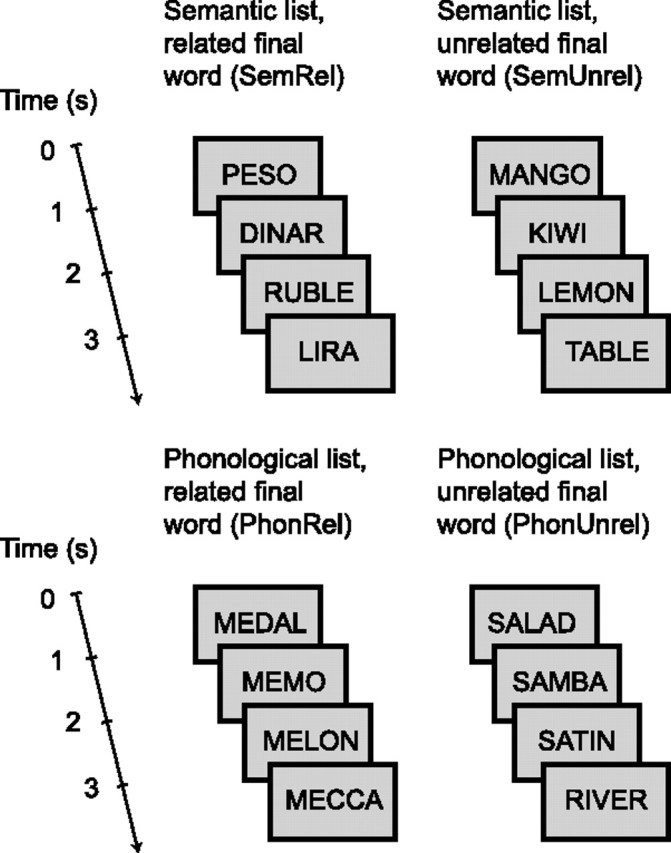
Examples of the word-list stimuli. In addition to the four list types, there were target lists in which one word appeared twice (probability 6%; data not shown). The actual stimuli were in Finnish. In the earlier auditory version of this experiment (Uusvuori et al., 2008), the same word lists were presented aurally.
The words were bisyllabic 4- to 5-letter common Finnish nouns beginning with a consonant, chosen from a Finnish newspaper corpus (WordMill Lexical Search Program) (Laine and Virtanen, 1999; Uusvuori et al., 2008). Each word (1392 in total) appeared in the experiment once. Semantic lists were created by selecting from the corpus word groups that had a clearly related meaning. In semantic word lists the first phoneme of every word differed from that of every other word more than by voicing only. Most semantic lists included both concrete and abstract words, but in case all the prime words were concrete/abstract the list-final word was also concrete/abstract. There was a 1000 ms interval between the onsets of the successive words in a list. Interval between the onset of the list-final word and the initial word of the next list was 2100 ms.
The auditory data set had been recorded previously (Uusvuori et al., 2008). In the present visual experiment, the words were displayed on a back-projection screen placed at a distance of 1 m from the subject's eyes (visual angle <4°). The MEG response timing was corrected for the 34 ms delay from the stimulus trigger (Presentation software, Neurobehavioral Systems) to picture a display by the projector (VistaPro, Electrohome Limited). The words were written in black Helvetica font on gray background. Each word was shown for 300 ms. The word-list stimuli were presented in a pseudo-randomized order, i.e., neither phonological nor semantic lists appeared more than three times in a row. The subjects were informed about the four types of word lists and instructed to read the lists carefully and detect the targets. The total measurement time was ∼35 min.
MEG recording and data analysis.
MEG recording was conducted in a magnetically shielded room with a vector-view whole-head MEG device (Elekta Neuromag). The system contains 102 triple sensor elements composed of two orthogonal planar gradiometers and one magnetometer. The gradiometers detect the maximum signal directly above an active cortical area. The signals were bandpass filtered at 0.03–200 Hz and digitized at 600 Hz. Horizontal and vertical eye movements were monitored [electro-oculogram (EOG)].
The MEG data were averaged off-line across trials from −0.2 s to 4.2 s relative to the onset of the list-initial word. The averaged MEG responses were baseline corrected to the 200 ms interval immediately preceding the list onset and low-pass filtered at 40 Hz. Trials with MEG amplitude exceeding 3000 fT/cm during the presentation of the list-final word were discarded automatically; thereafter, trials during which major disturbances remained (∼10%) were removed from the data manually. In addition, artifactual, slow ∼0.1 Hz shifts were detected in the data. The disturbances were removed by applying a high-pass filter to the nonaveraged data (center 0.15 Hz, width 0.1 Hz); the high-pass filtering did not affect the experimental effects but removed noise from sensors at the edge of the sensor helmet. Artifacts resulting from eye movements were removed from the data by rejecting trials during which the subject blinked (EOG >150 μV). Additionally, principal component analysis (PCA) (Uusitalo and Ilmoniemi, 1997) was performed on MEG signals averaged off-line with respect to eye movements, and the PCA component that contained artifacts was removed from the responses to the word stimuli.
The experiment yielded on average 65 (at least 48) artifact-free trials for each list type in all subjects. For source modeling, the signal-to-noise ratio for the response to the first word was enhanced by additionally averaging the data across the four word lists. This procedure increased the number of trials to 261 on average (at least 204 trials). Furthermore, the responses to the second and third words were averaged for the two semantic lists and for the two phonological lists, amounting to on average 131 (at least 99) trials.
Sensor-level analysis.
To obtain an initial overview of the data, areal mean signals were calculated over seven areas of interest: left and right frontal, temporal, and occipital areas, and the parietal area. First, vector sums of each gradiometer pair were computed by squaring the two MEG signals, summing them together, and calculating the square root of this sum. The areal mean signals were obtained by averaging these vector sums for each area of interest, individually for each subject. Finally, the areal mean signals were averaged across subjects. Because of the way the sensor-level areal mean signals are calculated (square root of sum of squared signals) they always have a positive value (>0). The areal mean signals were characterized by measuring, for each of the seven areas, the mean amplitude in three time windows, 50–250 ms, 250–400 ms, and 400–650 ms after the onset of each word in the list.
Equivalent current dipole analysis.
An equivalent current dipole (ECD) represents the center of an active cortical patch, and the mean orientation and strength of electric current in that area (Hämäläinen et al., 1993). The ECD analysis was done with the Elekta Neuromag software package, and proceeded as described previously (Salmelin et al., 1996; Helenius et al., 1998; Wydell et al., 2003). ECDs were localized individually in each subject. The whole-head magnetic field patterns were visually inspected for dipolar field patterns, and the ECDs were identified one by one at time points at which the specific field patterns were clearest. ECDs were determined from a subset of planar gradiometers that covered the spatially and/or temporally distinct magnetic field patterns. The 95% confidence volume of source location, a measure reflecting the signal-to-noise-ratio, was automatically obtained for each source. Thereafter, time courses of activation in those brain areas (source waveforms) were estimated by including the ECDs simultaneously in a multidipole model: The locations and orientations of the ECDs were fixed, whereas their amplitudes were allowed to vary to best account for the measured data in each condition with the selected model. The final multidipole models typically accounted for >85% (at least 75%) of the total magnetic field variance at the activation peak in each condition. In each subject, the cortical activation evoked by all words in the four types of lists was well represented by the same set of ECDs. The final models were composed of 10–13 ECDs (mean 12).
The location of the ECDs was defined in the head coordinate system that was set by the nasion and two reference points anterior to the ear canals. Before the MEG recording, four head position indicator (HPI) coils were attached to the subject's head and their locations were measured with a three-dimensional digitizer (Polhemus). At the beginning of the recording, the HPI coils were briefly energized to determine their location with respect to the MEG helmet. For visualization and comparison of the sources between subjects, the ECDs were transformed to a standard brain (Roland and Zilles, 1996) using elastic transformation (Schormann et al., 1996; Woods et al., 1998).
Neural activation within the first 300 ms was typically transient and was adequately characterized by the maximum level of activation and the time at which it was reached (peak amplitude and peak latency of the source waveforms); when more sustained activation in the posterior brain areas was detected after 300 ms it was described by measuring the mean amplitude between 300 and 600 ms post stimulus. Sustained activation in the temporal areas, of particular interest for the research question in the present study, was characterized with a number of measures. Its time course was described by the peak latency and the time points at which the waveform reached 50% of the peak amplitude in the ascending and descending slopes (onset and offset latencies). As for the activation strength, the peak amplitude was measured and the mean amplitude was calculated separately for the ascending and descending slopes, over 200 ms intervals before and after the group mean peak latency. The signal-to-noise ratio of the temporal activation in the right hemisphere was too low to allow definition of peak latency; the left-hemisphere time windows were used for the right hemisphere as well. All measures were collected individually for each subject and separately for each condition.
Minimum current estimates.
Source locations were additionally determined using minimum current estimates (MCEs) to verify the spatial distribution of activity obtained with ECD modeling and to enable comparison with MEG experiments that have used distributed modeling approaches (Halgren et al., 2002; Marinkovic et al., 2003). The minimum current estimate (Uutela et al., 1999) is an implementation of the minimum L1-norm estimate (Matsuura and Okabe, 1995). The measured signals are accounted for by a distribution of electric current that has the minimum total amplitude. MCEs were computed separately for each subject's data and, thereafter, averaged across subjects.
Statistical tests.
The following statistical tests were conducted on the sensor level data and on the ECD source waveforms. The effects on the strength and timing of activation in the different areas were tested using two separate tests, one for the first three words of the list and the other for the list-final word: The buildup of semantic or phonological context was investigated during the first three words of the list using a repeated-measures ANOVA with within-subjects factors Condition (semantic list, phonological list) and Position (first word, second word, third word). When a significant main effect of Position was detected, contrasts (linear and quadratic trend) were evaluated. When an interaction Condition × Position was detected, contrasts (linear and quadratic trend) were evaluated separately for semantic and phonological lists to detect possible effects specific to semantic or phonological manipulation. For the list-final word, the effects were tested using a repeated-measures ANOVA with within-subjects factors Condition (semantic, phonological) and Congruence (related, unrelated). When the sphericity assumption was violated (Mauchly's test of sphericity), Greenhouse–Geisser correction was used.
When the visual data set showed activation in approximately the same brain area and time window as the previously measured auditory data set (Uusvuori et al., 2008), activation strength and timing of the ECDs were evaluated using a repeated-measures ANOVA with Modality (auditory, visual) and Hemisphere (left, right) as within-subjects factors. When data from only one hemisphere was available, the repeated-measures ANOVA was conducted with the within-subjects factor Modality (auditory, visual). The ECD source locations were compared between the auditory and visual experiment in the anterior–posterior, superior–inferior, and left–right directions using t test. To check whether neural priming occurred in the same individuals in both the visual and auditory modality, the significance of the semantic and phonological priming effects was evaluated separately in each subject. A permutation test (Holmes et al., 1996; Nichols and Holmes, 2002; Laaksonen et al., 2008) was applied to the mean activation strength in the time window extending from 200 ms before to 200 ms after the group mean peak latency. Separately for the left and right temporal source areas, the activation strengths in the single trials corresponding to semantically related (SemRel) and unrelated (SemUnrel) list-final words were randomly shuffled 3000 times, and after each shuffle, the trials were divided into two samples that were compared using a t test. The t value of the original comparison of SemRel versus SemUnrel samples was compared against the distribution of t values derived from the permutations, and the SemRel and SemUnrel samples were considered significantly different if the original t value was not contained within 95% of the shuffled t values (p < 0.05). A similar test was conducted for the phonologically related versus unrelated trials.
Results
Sequence of cortical activation in reading
Figure 2 displays the areal mean signals for the different word-list types, averaged across all subjects. The strongest signals were detected over the occipital and left temporal areas. Each word of the list elicited a response at ∼100 ms after the stimulus onset over the occipital area followed by a more sustained response over the left temporal area that reached the maximum at ∼400 ms after the stimulus onset. Salient stimulus effects occurred between 300 and 600 ms over the left temporal area.
Figure 2.

Group averaged areal mean signals in reading. Group averaged areal mean signals calculated over the left and right occipital, temporal, and frontal cortex, and the parietal cortex. Note the marked effect of stimulus type over the left temporal cortex.
Figure 3 illustrates the active areas that were found consistently (in at least six subjects) and their mean time course of activation, as modeled by equivalent current dipoles (ECDs). Occipital activation at ∼100 ms poststimulus was followed by left occipitotemporal activation at ∼150 ms. Right occipital cortex showed a transient response at ∼150–200 ms and a more sustained signal at ∼400–800 ms after each word. Sources around the parieto–occipital midline displayed a similar sequence of transient and sustained activation. The only sources that systematically demonstrated meaningful stimulus effects, i.e., priming-induced suppression over the first three words and stronger activation to unrelated than related final words, were located in the superior temporal cortex, with the sustained activity peaking at ∼400–500 ms. The time course of the strong activation in the left temporal cortex was practically identical to the areal mean signal recorded over the left temporal lobe (Fig. 2). The right-hemisphere activation showed similar stimulus effects but was relatively weak. The location, orientation, and time course of the superior temporal ECDs suggest that they correspond to the N400m sources described in earlier MEG studies of reading (Simos et al., 1997; Helenius et al., 1998). In the following, we refer to the sustained activity peaking at ∼400–500 ms as the N400m response.
Figure 3.
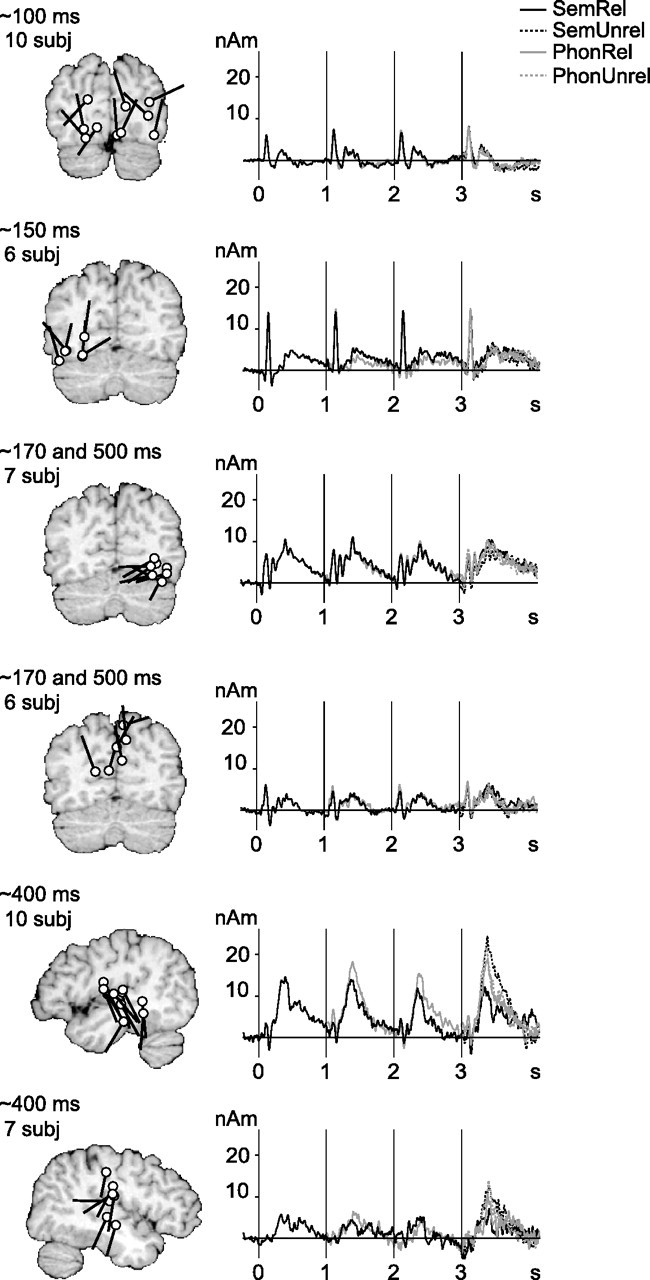
Source clusters in reading. Clusters were formed on the basis of location and timing and include data from at least six subjects. White dots and black tails indicate the individual source locations and directions of current flow, respectively. The curves show the mean time course of activation for each source cluster. For the list-initial word, the response was averaged over all word lists, and for the second and third word, over semantic or phonological lists (see Materials and Methods). For the list-final word, all four categories are plotted separately. In the auditory experiment (data not shown), clusters of active areas were detected in the temporal lobes only. subj, Subjects.
The sequence of activation observed using MCEs agreed with that detected using ECDs and confirmed the dominant role of the superior temporal activation (Fig. 4A; supplemental Figs. S1, S2, available at www.jneurosci.org as supplemental material). The group-level MCE additionally suggested activation in the left and right temporal pole or anterior medial temporal cortex, directly behind the eyes. However, inspection at the individual level revealed that activation in this area was typically either very short-lived (<50 ms) or it was localized outside of the brain, in or near the extraocular muscles.
Figure 4.

Superior temporal activation in the visual versus auditory modality and effect of semantic and phonological manipulation. A, Minimum current estimate of the response to the list-initial word in the visual (top) and auditory (bottom) experiment. The top row in each set shows the MCE for a single subject and the bottom row MCE averaged across 10 subjects. Distribution of electric current was projected on a triangle mesh representing the brain surface and integrated over the time interval of interest (400–500 ms after the stimulus onset). The encircled colored areas denote the surface projection of the regions of interest with the maximum activation in the left and right hemisphere. In the visual modality, large interindividual variability in source location led to a weak and blurred group-level estimate, as opposed to the concise source cluster and strong group-level MCE in the auditory modality. B, N400m source locations in the visual and auditory experiment, as revealed by ECD analysis (compare Fig. 3). C, The relative locations of the left-hemisphere N400m sources in the visual (triangles) and auditory (circles) experiment, with a line connecting the two sources of each subject. The inset shows the relative locations when the auditory N400m sources were placed at the origin. D, N400m source waveforms for the four types of list-final words in the two modalities. The gray horizontal bar indicates the noise level (±2 SD of the signal level during the 200 ms period immediately preceding the list onset).
Effects of semantic and phonological priming in reading
Sensor-level effects
Effects of semantic and phonological manipulation were most marked over the left temporal region (Fig. 2; Tables 1, 3). In the list-final word, the response was increased to a semantically incongruent word at 250–650 ms (250–400 ms: Condition × Congruence F(1,9) = 9.0, p < 0.05, semantic lists: Congruence F(1,9) = 38.1, p < 0.001; 400–650 ms: Condition × Congruence F(1,9) = 6.4, p < 0.05, semantic lists: Congruence F(1,9) = 16.7, p < 0.005). During the first three words, the responses were weaker to the semantic than phonological lists (400–650 ms: Condition F(1,9) = 7.7, p < 0.05). For phonological list-final words, an increase to a phonologically incongruent word approached significance (250–400 ms, phonological lists: Congruence F(1,9) = 4.2, p = 0.070; 400–650 ms, phonological lists: Congruence F(1,9) = 3.4, p = 0.096). Over the left frontal region, the response was increased to incongruent list-final words, regardless of the list type (semantic or phonological) (250–400 ms: Congruence F(1,9) = 12.6, p < 0.01; 400–650 ms: Congruence F(1,9) = 7.9, p < 0.05).
Table 1.
Statistically significant effects in the visual experiment: sensor-level analysis
| Condition (semantic, phonological) × Position (1st, 2nd, 3rd word) ANOVA for the first three words | |||||||
|---|---|---|---|---|---|---|---|
| Region | Time window (ms) | Significant main effect or interaction | F | p < | Significant contrast | F(1,9) | p < |
| Left frontal | 50–250 | Position | F(2,18)=3.7 | 0.05 | Quadratic trend | 7.1 | 0.05 |
| Right frontal | 50–250 | Position | F(2,18)=4.3 | 0.05 | Quadratic trend | 8.0 | 0.05 |
| 250–400 | Position | F(2,18)=3.6 | 0.05 | Quadratic trend | 8.0 | 0.05 | |
| Left temporal | 50–250 | Position | F(2,18)=7.4 | 0.005 | Quadratic trend | 18.1 | 0.005 |
| 400–650 | Condition | F(1,9)=7.7 | 0.05 | ||||
| Left occipital | 400–650 | Position | F(2,18)=4.2 | 0.05 | Quadratic trend | 6.0 | 0.05 |
Results reflecting semantic and/or phonological priming are shown in bold. See Results (Sensor-level effects) for details.
Table 3.
Statistically significant effects in the visual experiment: sensor-level analysis
| Condition (semantic, phonological) × Congruence (related, unrelated) ANOVA for the list-final word | |||||||
|---|---|---|---|---|---|---|---|
| Region | Time window (ms) | Significant main effect or interaction | F(1,9) | p < | Significant effect for semantic or phonological lists | F(1,9) | p < |
| Left frontal | 250–400 | Congruence | 12.6 | 0.01 | |||
| 400–650 | Congruence | 7.9 | 0.05 | ||||
| Left temporal | 250–400 | Condition × Congruence | 9.0 | 0.05 | Semantic lists, congruence | 38.1 | 0.001 |
| Phonological lists, congruence | 4.2 | p = 0.070 | |||||
| 400–650 | Condition × Congruence | 6.4 | 0.05 | Semantic lists, congruence | 16.7 | 0.005 | |
| Phonological lists, congruence | 3.4 | p = 0.096 | |||||
All results reflect semantic and/or phonological priming. See Results (Sensor-level effects) for details.
In addition to the semantic and phonological priming effects relevant for the present research question, general effects of word position in the list were detected as well. The response was increased when advancing from the first to the second word of the list and thereafter diminished when advancing from the second to the third word, regardless of the list type (semantic or phonological). These effects (main effect of Position and quadratic trend) were significant in several time windows over all the left-hemisphere regions, and right frontal region (Table 1).
Source-level effects
Stimulus effects were observed in the superior temporal cortex bilaterally (Fig. 3; Tables 2, 4). Suppression of activity by semantic or phonological priming over the course of the first three words and enhanced activation to an unrelated list-final word were detected as follows:
Table 2.
Statistically significant effects in the visual experiment: source-level analysis
| Condition (semantic, phonological) × Position (1st, 2nd, 3rd word) ANOVA for the first three words | |||||||
|---|---|---|---|---|---|---|---|
| ECD cluster | Measure tested | Significant main effect or interaction | F | p < | Significant contrast | F(1,9) | p < |
| Occipital at 100 ms | Peak latency | Position | F(1.2,10.9)=9.3a | 0.01 | Linear trend | 10.6 | 0.05 |
| Left N400m | Peak amplitude | Condition | F(1,9)=10.1 | 0.05 | |||
| Condition × Position | F(2,18)=5.6 | 0.05 | Semantic lists, linear trend | 7.2 | 0.05 | ||
| Mean amplitude, descending slope | Condition | F(1,9)=7.7 | 0.05 | ||||
| Condition × Position | F(2,18)=5.2 | 0.05 | Semantic lists, linear trend | 8.6 | 0.05 | ||
| Right N400m | Mean amplitude, descending slope | Condition | F(1,6)=7.1b | 0.05 | |||
| Condition × Position | F(2,12)=5.6b | 0.05 | |||||
Results reflecting semantic and/or phonological priming are shown in bold. See text for details.
aGreenhouse–Geisser 0.6.
bSeven ECDs in the cluster, compare Figure 3.
Table 4.
Statistically significant effects in the visual experiment: source-level analysis
| Condition (semantic, phonological) × Congruence (related, unrelated) ANOVA for the list-final word | |||||||
|---|---|---|---|---|---|---|---|
| ECD cluster | Measure tested | Significant main effect or interaction | F(1,9) | p < | Significant effect for semantic or phonological lists | F(1,9) | p < |
| Left N400m | Mean amplitude, ascending slope | Congruence | 5.9 | 0.05 | |||
| Peak amplitude | Condition × Congruence | 15.1 | 0.005 | Semantic lists, congruence | 46.2 | 0.001 | |
| Mean amplitude, descending slope | Condition × Congruence | 10.1 | 0.05 | Semantic lists, congruence | 33.7 | 0.001 | |
| Peak latency | Condition × Congruence | 11.5 | 0.01 | Phonological lists, congruence | 8.3 | 0.05 | |
| Offset latency | Condition × Congruence | 12.7 | 0.01 | Semantic lists, congruence | 15.7 | 0.005 | |
| Right N400m | Peak amplitude | Congruence | 9.3 | 0.05 | |||
| Mean amplitude, descending slope | Congruence | 9.7 | 0.05 | ||||
All results reflect semantic and/or phonological priming. See Results (Sensor-level effects) for details.
Effects of semantic manipulation emerged in the left hemisphere. The N400m activation was attenuated over the course of the first three words for the semantic lists but not for the phonological lists [peak amplitude: Condition F(1,9) = 10.1, p < 0.05, Condition × Position F(2,18) = 5.6, p < 0.05, semantic lists: linear trend F(1,9) = 7.2, p < 0.05, phonological lists: all contrasts not significant (n.s.); mean amplitude in the descending slope: Condition F(1,9) = 7.7, p < 0.05, Condition × Position F(2,18) = 5.2, p < 0.05, semantic lists: linear trend F(1,9) = 8.6, p < 0.05, phonological lists: all contrasts n.s.]. In the list-final word, the left-hemisphere N400m activation was increased to a semantically incongruent word, both during the ascending and descending slope (mean amplitude in the ascending slope: Congruence F(1,9) = 5.9, p < 0.05; peak amplitude: Condition × Congruence F(1,9) = 15.1, p < 0.005, semantic lists: Congruence F(1,9) = 46.2, p < 0.001; mean amplitude in the descending slope: Condition × Congruence F(1,9) = 10.1, p < 0.05, semantic lists: Congruence F(1,9) = 33.7, p < 0.001). Semantic effects were detected also in the duration of the response: The shortest duration was observed for the semantically related list-final word (offset earlier than for the other word types) (Condition × Congruence F(1,9) = 12.7, p < 0.01, semantic lists: Congruence F(1,9) = 15.7, p < 0.005). Phonological effect was observed in the ascending slope of the left-hemisphere N400m activation as increased mean amplitude to an incongruent list-final word (Congruence F(1,9) = 5.9, p < 0.05). The N400m response also reached the maximum earlier for the phonologically unrelated than related list-final words (Condition × Congruence F(1,9) = 11.5, p < 0.01, phonological lists: Congruence F(1,9) = 8.3, p < 0.05).
In the right hemisphere, a main effect of Condition (F(1,6) = 7.1, p < 0.05) and an interaction Condition × Position (F(2,12) = 5.6, p < 0.05) were detected in the descending slope but contrasts did not reach significance for either the semantic or phonological lists. In the list-final word, both semantic and phonological priming effects were significant; the peak amplitude and the descending slope of the N400m activation were weaker to the related than unrelated final words regardless of the list type (peak amplitude: Congruence F(1,6) = 9.3, p < 0.05, mean amplitude in the descending slope: Congruence F(1,6) = 9.7, p < 0.05).
In addition to the superior temporal priming effects, an effect of word position in the list was detected in the timing of the occipital activation peaking at ∼100 ms. This response reached the maximum earlier when advancing in the word list, regardless of the list type (semantic or phonological) (Position F(1.2,10.9, Greenhouse–Geisser ε 0.6) = 9.3, p < 0.01, linear trend F(1,9) = 10.6, p < 0.05).
Written versus spoken words
Auditory version of the experiment
MEG data of auditory word-list processing was collected with the same device and the data were analyzed similarly as in the present visual experiment (Uusvuori et al., 2008). In the auditory data, activation was concentrated to the left and right superior temporal cortex. These areas were involved in both analysis of sound form and meaning but the role of each hemisphere varied over time. Sensitivity to sound form was observed at ∼100 ms after word onset, followed by sensitivity to semantic aspects from ∼250 ms onwards, in the left hemisphere. From ∼450 ms onwards, the picture was changed, with semantic effects present bilaterally, accompanied by a late effect of sound form in the right hemisphere. These results obtained with ECD analysis (Uusvuori et al., 2008) (supplemental Text S1, available at www.jneurosci.org as supplemental material) were corroborated by minimum current estimates (supplemental Figs. S3, S4, available at www.jneurosci.org as supplemental material).
Comparison of the visual and auditory data
The left superior temporal cortex showed activation in both the visual and auditory tasks in all 10 subjects (Fig. 4). The right superior temporal cortex was active in all subjects during speech perception; in reading, corresponding activation in the right hemisphere was detected in seven subjects (auditory–visual difference: p = 0.25, n.s., nonparametric McNemar test).
At the group level, the N400m source location (Fig. 4C) was not statistically significantly different in the visual and auditory modalities (left hemisphere, anterior–posterior t(9) = 0.9, p = 0.4, n.s, inferior–superior t(9) = 1.8, p = 0.1, n.s, lateral–medial t(9) = 0.1, p = 0.9, n.s.). However, the N400m sources were tightly clustered in the auditory experiment (SD, 10, 6, and 5 mm in the anterior–posterior, inferior–superior, and lateral–medial direction) but somewhat more scattered in the visual experiment (SD, 12, 9, and 6 mm). The distance between the left auditory and visual N400m sources of the same subject was 6 ± 1 mm on average, and in 8 out of 10 subjects the 95% confidence volumes of the two ECDs did not overlap. The larger interindividual variability of source location (reflecting the center of an active cortical patch) in the visual than auditory task was also evident in the MCE (Fig. 4A). At the level of a single subject, there was clear focal activation of the left temporal cortex both in the visual and auditory experiment. At the group level, however, the picture remained salient in the auditory task but became blurred in the visual task.
The ECDs, representing the centers of the active cortical patches in the individual subjects, typically fell on the STG (left hemisphere: auditory six subjects, visual five subjects; right hemisphere: auditory four subjects) or in the neighboring sulci (left hemisphere: auditory four subjects, visual two subjects; right hemisphere: auditory four subjects). In the visual experiment, a right-hemisphere N400m source was detected in seven individuals, but its location was quite variable because of the relatively low signal-to-noise ratio. MEG detects the center of an active cortical patch but does not provide direct information of its extent or shape, regardless of the analysis method. The localization is most accurate perpendicular to the direction of current flow (here anterior–posterior) and least accurate along it (here inferior–superior). Furthermore, because of the orientation of the apical dendrites of the pyramidal cells that mainly generate the MEG signal and the high sensitivity of MEG to current flow oriented tangential to the brain surface, MEG is most sensitive to activation in the sulci (Hämäläinen et al., 1993). Within the spatial accuracy of the MEG method, the present data thus point to activation of the middle section of the STG and the flanking sulci (superior temporal sulcus and Sylvian fissure) as the most consistent neural source of the N400m response.
Figure 4d illustrates the mean time course of activation to the list-final words in the left and right hemisphere, for the visual and auditory modality. The left-hemisphere N400m semantic priming effect on the list-final word was an extremely robust finding as it was evident also in the responses of each individual subject. A permutation test for stronger activation to unrelated than related list-final words (see Materials and Methods) confirmed a robust left-hemisphere semantic effect in the visual (auditory) experiment that was significant (p < 0.05) in seven (six) subjects and approached significance (p < 0.09) in two (three) subjects. In one subject, the semantic effect did not reach significance in either modality. The effects of semantics in the right hemisphere and of phonology in either hemisphere were each significant in up to five individuals.
The superior temporal activation was overall significantly stronger to the auditory than visual words, regardless of the hemisphere (N400m peak amplitude: Modality F(1,6) = 13.7, p < 0.05). In the visual experiment, the N400m activation seemed weaker in the right than left hemisphere, with poorer signal-to-noise ratio (Fig. 4D). Such differences would tend to suggest stronger lateralization in the visual task than in the auditory task in which the activation appeared more bilateral. The hemisphere difference, however, did not reach significance (N400m peak amplitude: Modality × Hemisphere F(1,6) = 0.2, p = 0.7, Hemisphere F(1,6) = 1.8, p = 0.2).
The duration of the left-hemisphere N400m response was longer in the auditory experiment (∼450 ms, full width at half maximum) than in the visual experiment (∼150 ms). This difference resulted from significantly earlier onset latencies (Modality F(1,9) = 6.1, p < 0.05) and delayed offset latencies (Modality F(1,9) = 242.7, p < 0.001) in the auditory than visual experiment (average onset and offset latencies across subjects, list types and words in the list: auditory 285 ± 3 ms and 720 ± 7 ms, visual 326 ± 5 ms and 471 ± 7 ms). The left N400m response reached the maximum ∼80 ms earlier for visual (393 ± 5 ms) than auditory presentation (471 ± 5 ms) (F(1,9) = 39.3, p < 0.001). In the right hemisphere, the N400m response to auditorily presented words peaked at 448 ± 9 ms (left vs right hemisphere n.s.); in the visual experiment no latency values were extracted in the right hemisphere because of the poor signal-to-noise ratio.
Discussion
The pattern of activation evoked by visually presented words indicated that, following initial modality-specific analysis, activation reflecting semantic processing converged on that evoked by spoken words, left-lateralized at 300–450 ms and thereafter bilaterally, generated in close-by areas in the superior temporal cortex (Fig. 5). The left-hemisphere semantic effect was an extremely robust finding both at the group and individual level, and it emerged at the sensor and source level. Analysis of sound form, although manifested in activation of the same general area, displayed modality-specific differences in timing. For written words, phonological priming influenced the left-hemisphere responses at ∼300–450 ms, whereas for spoken words, phonological priming effect was detected at ∼100 ms. From ∼450 ms onwards, phonological priming effect was observed in the right hemisphere in both modalities. Effects specific to semantic and phonological manipulation and auditory and visual modality were thus concentrated primarily to the left hemisphere, whereas general effects of priming were seen in the right hemisphere from ∼450 ms onwards.
Figure 5.

Summary of the main results. Schematic representation of the time windows and hemispheric interplay of phonological and semantic effects, overlaid on the N100m/N400m source waveforms. The dark and light gray bars indicate the time windows in which phonological and semantic priming, respectively, influenced the response. The areas and time windows that showed increased activation to semantically (phonologically) unrelated list-final words were interpreted to reflect sensitivity to semantic (phonological) information. These effects were corroborated by suppression of activation over the course of the first three words of the semantically (phonologically) related lists.
The overall spatiotemporal sequence of cortical activation for written words is in line with previous MEG reports (for review, see Salmelin, 2007). Activation in the occipital cortex at ∼100 ms was observed in all subjects, presumably reflecting visual feature analysis (Tarkiainen et al., 1999). This response was followed by activation in the left inferior occipitotemporal cortex at ∼150 ms in 6/10 subjects, closely resembling the letter-string specific response described earlier (Tarkiainen et al., 1999). We also detected sources in the right inferior occipitotemporal cortex (7/10 subjects) at ∼150–200 ms; activation in this area and time window has been previously reported in reading tasks, equally strong to letter and symbol strings but sensitive to vertical shifts in the letter positions (Salmelin et al., 1996; Tarkiainen et al., 1999; Cornelissen et al., 2003). From 200–300 ms onwards, processing of written and spoken words converged to superior temporal cortex bilaterally (N400m response), but with more individuals showing activation in the left than right hemisphere in the visual modality.
Semantic priming effects for written and spoken words, when measured in the same individuals in the two modalities, were similar in function, timing, general location, and lateralization. This result is consistent with information obtained from EEG and MEG experiments that have separately investigated lexical-semantic processing of written or spoken words and detected semantic effects in the N400 time window (∼200–800 ms) in the visual (Kutas and Hillyard, 1980; Helenius et al., 1998) and auditory (Connolly and Phillips, 1994; Helenius et al., 2002) modality. The data thus point to shared neural representation of word meaning between the two modalities that has been suggested by word-processing models (Patterson and Shewell, 1987).
The relative locations of the source areas in the visual and auditory modality were evaluated in the left hemisphere where all participants had salient N400m responses in both modalities. The locations were highly similar although not identical in individual subjects. Neurophysiological imaging methods (MEG, EEG) detect the center of an active brain area but do not provide direct information about its extent or shape, regardless of the analysis method. The observed small differences in source location between the two modalities thus suggest a relative shift in the centers of the active areas, which may, overall, be largely overlapping. There was no systematic direction of the shift across individuals. Based on the present MEG data, therefore, it is not possible to define a neuroanatomical distinction between the two modalities. The data thus support a view of a largely shared semantic system in auditory and visual language perception, in line with several hemodynamic studies on language comprehension that have found overlapping activation between modalities (Booth et al., 2002; Spitsyna et al., 2006) [meta-analysis of Vigneau et al. (2006)].
In the present experiment, activation associated with semantic processing was found in the superior temporal cortex, with the center of activation most consistently falling on the middle section of the superior temporal gyrus and in the neighboring sulci, in line with previous MEG findings (Simos et al., 1997; Helenius et al., 1998; Pylkkänen et al., 2006) and lesion work (Hagoort et al., 1996; Friederici et al., 1998) (for review, see Van Petten and Luka, 2006). The present findings are in general agreement also with hemodynamic studies that have typically indicated activation in the anterior, posterior, and inferior parts of the temporal cortex (Chee et al., 1999; Booth et al., 2002; Jobard et al., 2003; Spitsyna et al., 2006; Vandenbulcke et al., 2007; Lau et al., 2008).
We found no effects of semantic manipulation in the frontal cortex, in contrast with hemodynamic data that typically show overlap between modalities in semantic tasks in this region, particularly in the left inferior frontal gyrus (Chee et al., 1999; Booth et al., 2002). The lack of systematic semantic activation in the frontal lobe in the present study is, however, in agreement with hemodynamic studies that have investigated implicit semantic processing (Crinion et al., 2003; Spitsyna et al., 2006). Based on hemodynamic measurements and lesion data that show severe semantic impairments mainly resulting from temporal lesions (for review, see Thompson-Schill et al., 1998), it has been suggested that the left inferior frontal cortex is involved in semantic processing when selection or manipulation of such information is required, whereas temporal areas, in particular the middle and inferior temporal cortex, would be the primary store of semantic representations (Fiez, 1997; Poldrack et al., 1999; Rissman et al., 2003; Heim et al., 2005). Such a division of labor could explain the lack of frontal activation in the current experiment in which the semantic manipulation was built in the stimulus set but the task itself was nonsemantic (detection of words that were presented twice within a word list).
In contrast to semantic priming effects, the effect of phonological priming differed between the modalities. In line with previous EEG/MEG data gathered separately in the auditory (Näätänen et al., 1997; Parviainen et al., 2005) and visual modality (Rugg, 1984; Wydell et al., 2003), the analysis of sound form began clearly later for written words (at ∼300 ms) than for spoken words (at ∼100 ms after the word onset). However, it should be noted that whereas sensitivity to auditory phonological priming in our experimental design indicates processing at acoustic, phonetic, and/or phonological level, in the visual modality phonological priming effect should reflect visual, orthographic, or phonological analysis. As analysis of visual features and graphemes is reflected in cortical responses at ∼100–200 ms (Tarkiainen et al., 1999), the effects of phonological priming from ∼300 ms onwards imply analysis of phonological information.
Because of its long duration (from ∼200 to ∼800 ms), the N400m activation is unlikely to reflect a single uniform processing stage of written and spoken words. Indeed, the present data revealed two functionally distinct phases. This result is in line with previous auditory data indicating unequal sensitivity to experimental manipulations in the ascending and descending slopes of the N400m response (Bonte et al., 2006) or two functionally distinct EEG responses within this time window (Connolly and Phillips, 1994; Hagoort and Brown, 2000). Based on those results, it has been suggested that the memory representations of words are activated and selected within ∼300 ms from the word onset, and that the activation at ∼400 ms reflects postlexical integration of the retrieved semantic information to the context (Connolly and Phillips, 1994). This issue is not resolved, however, as other authors have suggested that the N400 response mainly reflects lexical access (Lau et al., 2008), or that both access and integration occur within ∼200 ms from the word recognition point (Hauk et al., 2006; Pulvermüller et al., 2006). In the visual modality, it has been proposed that the monophasic N400 response measured using EEG and the superior temporal activation detected with MEG reflect both lexical access and postlexical integration (Anderson and Holcomb, 1995; Hagoort and Brown, 2000; Kiefer, 2002; Pylkkänen and Marantz, 2003). The present data support the interpretation that at least two different processing stages are reflected in the N400m activation as evoked by both auditory and visual words. The ascending slope of the N400m response (∼200–450 ms) lies in the time window when lexical-semantic information of written and spoken words is likely to be accessed (Lau et al., 2008). However, as behavioral data indicate that both written and spoken words can be recognized within ∼500 ms or less (for review, see Tyler et al., 2002; Balota et al., 2004), the effects of both meaning and sound form from 450 ms onwards are likely to reflect postlexical integration of all available information in the context created by the preceding words that may well occur similarly for written and spoken words.
The present MEG data indicate involvement of the middle part of the superior temporal cortex in semantic processing from ∼300 ms onwards, regardless of input modality. The superior temporal cortex was involved in the analysis of phonological structure as well but with clearly different timing between modalities, in concordance with theoretical models of language perception.
Footnotes
This study was financially supported by the Finnish Cultural Foundation, the Academy of Finland (National Centres of Excellence Programme 2006–2011, Grant 129160), the Sigrid Juselius Foundation, and the Finnish Ministry of Education (Finnish Graduate School of Neuroscience). We thank Kimmo Uutela and Lauri Parkkonen for valuable advice on data analysis, and Hannu Laaksonen for supplying us with the permutation test.
References
- Anderson JE, Holcomb PJ. Auditory and visual semantic priming using different stimulus onset asynchronies: an event-related brain potential study. Psychophysiology. 1995;32:177–190. doi: 10.1111/j.1469-8986.1995.tb03310.x. [DOI] [PubMed] [Google Scholar]
- Balota DA, Cortese MJ, Sergent-Marshall SD, Spieler DH, Yap M. Visual word recognition of single-syllable words. J Exp Psychol Gen. 2004;133:283–316. doi: 10.1037/0096-3445.133.2.283. [DOI] [PubMed] [Google Scholar]
- Bonte M, Parviainen T, Hytönen K, Salmelin R. Time course of top-down and bottom-up influences on syllable processing in the auditory cortex. Cereb Cortex. 2006;16:115–123. doi: 10.1093/cercor/bhi091. [DOI] [PubMed] [Google Scholar]
- Booth JR, Burman DD, Meyer JR, Gitelman DR, Parrish TB, Mesulam MM. Modality independence of word comprehension. Hum Brain Mapp. 2002;16:251–261. doi: 10.1002/hbm.10054. [DOI] [PMC free article] [PubMed] [Google Scholar]
- Chee MW, O'Craven KM, Bergida R, Rosen BR, Savoy RL. Auditory and visual word processing studied with fMRI. Hum Brain Mapp. 1999;7:15–28. doi: 10.1002/(SICI)1097-0193(1999)7:1<15::AID-HBM2>3.0.CO;2-6. [DOI] [PMC free article] [PubMed] [Google Scholar]
- Coltheart M, Curtis B, Atkins P, Haller M. Models of reading aloud: dual-route and parallel-distributed-processing approaches. Psychol Rev. 1993;100:589–608. [Google Scholar]
- Connolly J, Phillips N. Event-related potential components reflect phonological and semantic processing of the terminal word of spoken sentences. J Cogn Neurosci. 1994;6:256–266. doi: 10.1162/jocn.1994.6.3.256. [DOI] [PubMed] [Google Scholar]
- Connolly JF, Phillips NA, Forbes KA. The effects of phonological and semantic features of sentence-ending words on visual event-related brain potentials. Electroencephalogr Clin Neurophysiol. 1995;94:276–287. doi: 10.1016/0013-4694(95)98479-r. [DOI] [PubMed] [Google Scholar]
- Cornelissen P, Tarkiainen A, Helenius P, Salmelin R. Cortical effects of shifting letter position in letter strings of varying length. J Cogn Neurosci. 2003;15:731–746. doi: 10.1162/089892903322307447. [DOI] [PubMed] [Google Scholar]
- Crinion JT, Lambon-Ralph MA, Warburton EA, Howard D, Wise RJ. Temporal lobe regions engaged during normal speech comprehension. Brain. 2003;126:1193–1201. doi: 10.1093/brain/awg104. [DOI] [PubMed] [Google Scholar]
- Fiez JA. Phonology, semantics, and the role of the left inferior prefrontal cortex. Hum Brain Mapp. 1997;5:79–83. [PubMed] [Google Scholar]
- Friederici AD, Hahne A, von Cramon DY. First-pass versus second-pass parsing processes in a Wernicke's and a Broca's aphasic: electrophysiological evidence for a double dissociation. Brain Lang. 1998;62:311–341. doi: 10.1006/brln.1997.1906. [DOI] [PubMed] [Google Scholar]
- Hagoort P, Brown CM. ERP effects of listening to speech: semantic ERP effects. Neuropsychologia. 2000;38:1518–1530. doi: 10.1016/s0028-3932(00)00052-x. [DOI] [PubMed] [Google Scholar]
- Hagoort P, Brown CM, Swaab TY. Lexical-semantic event-related potential effects in patients with left hemisphere lesions and aphasia, and patients with right hemisphere lesions without aphasia. Brain. 1996;119:627–649. doi: 10.1093/brain/119.2.627. [DOI] [PubMed] [Google Scholar]
- Halgren E, Dhond RP, Christensen N, Van Petten C, Marinkovic K, Lewine JD, Dale AM. N400-like magnetoencephalography responses modulated by semantic context, word frequency, and lexical class in sentences. Neuroimage. 2002;17:1101–1116. doi: 10.1006/nimg.2002.1268. [DOI] [PubMed] [Google Scholar]
- Hämäläinen M, Hari R, Ilmoniemi R, Knuutila J, Lounasmaa O. Magnetoencephalography - theory, instrumentation, and applications to noninvasive studies of the working human brain. Rev Mod Phys. 1993;65:413–497. [Google Scholar]
- Harm MW, Seidenberg MS. Computing the meanings of words in reading: cooperative division of labor between visual and phonological processes. Psychol Rev. 2004;111:662–720. doi: 10.1037/0033-295X.111.3.662. [DOI] [PubMed] [Google Scholar]
- Hauk O, Davis MH, Ford M, Pulvermüller F, Marslen-Wilson WD. The time course of visual word recognition as revealed by linear regression analysis of ERP data. Neuroimage. 2006;30:1383–1400. doi: 10.1016/j.neuroimage.2005.11.048. [DOI] [PubMed] [Google Scholar]
- Heim S, Alter K, Ischebeck AK, Amunts K, Eickhoff SB, Mohlberg H, Zilles K, von Cramon DY, Friederici AD. The role of the left Brodmann's areas 44 and 45 in reading words and pseudowords. Brain Res Cogn Brain Res. 2005;25:982–993. doi: 10.1016/j.cogbrainres.2005.09.022. [DOI] [PubMed] [Google Scholar]
- Helenius P, Salmelin R, Service E, Connolly JF. Distinct time courses of word and context comprehension in the left temporal cortex. Brain. 1998;121:1133–1142. doi: 10.1093/brain/121.6.1133. [DOI] [PubMed] [Google Scholar]
- Helenius P, Salmelin R, Service E, Connolly JF, Leinonen S, Lyytinen H. Cortical activation during spoken-word segmentation in nonreading-impaired and dyslexic adults. J Neurosci. 2002;22:2936–2944. doi: 10.1523/JNEUROSCI.22-07-02936.2002. [DOI] [PMC free article] [PubMed] [Google Scholar]
- Holmes AP, Blair RC, Watson JD, Ford I. Nonparametric analysis of statistic images from functional mapping experiments. J Cereb Blood Flow Metab. 1996;16:7–22. doi: 10.1097/00004647-199601000-00002. [DOI] [PubMed] [Google Scholar]
- Jobard G, Crivello F, Tzourio-Mazoyer N. Evaluation of the dual route theory of reading: a metanalysis of 35 neuroimaging studies. Neuroimage. 2003;20:693–712. doi: 10.1016/S1053-8119(03)00343-4. [DOI] [PubMed] [Google Scholar]
- Kiefer M. The N400 is modulated by unconsciously perceived masked words: further evidence for an automatic spreading activation account of N400 priming effects. Brain Res Cogn Brain Res. 2002;13:27–39. doi: 10.1016/s0926-6410(01)00085-4. [DOI] [PubMed] [Google Scholar]
- Kutas M, Hillyard SA. Reading senseless sentences: brain potentials reflect semantic incongruity. Science. 1980;207:203–205. doi: 10.1126/science.7350657. [DOI] [PubMed] [Google Scholar]
- Laaksonen H, Kujala J, Salmelin R. A method for spatiotemporal mapping of event-related modulation of cortical rhythmic activity. Neuroimage. 2008;42:207–217. doi: 10.1016/j.neuroimage.2008.04.175. [DOI] [PubMed] [Google Scholar]
- Laine M, Virtanen P. WordMill Lexical Search Program. (Ed. 2.2) 1999 [Google Scholar]
- Lau EF, Phillips C, Poeppel D. A cortical network for semantics: (de)constructing the N400. Nat Rev Neurosci. 2008;9:920–933. doi: 10.1038/nrn2532. [DOI] [PubMed] [Google Scholar]
- Marinkovic K, Dhond RP, Dale AM, Glessner M, Carr V, Halgren E. Spatiotemporal dynamics of modality-specific and supramodal word processing. Neuron. 2003;38:487–497. doi: 10.1016/s0896-6273(03)00197-1. [DOI] [PMC free article] [PubMed] [Google Scholar]
- Matsuura K, Okabe Y. Selective minimum-norm solution of the biomagnetic inverse problem. IEEE Trans Biomed Eng. 1995;42:608–615. doi: 10.1109/10.387200. [DOI] [PubMed] [Google Scholar]
- Näätänen R, Lehtokoski A, Lennes M, Cheour M, Huotilainen M, Iivonen A, Vainio M, Alku P, Ilmoniemi RJ, Luuk A, Allik J, Sinkkonen J, Alho K. Language-specific phoneme representations revealed by electric and magnetic brain responses. Nature. 1997;385:432–434. doi: 10.1038/385432a0. [DOI] [PubMed] [Google Scholar]
- Nichols TE, Holmes AP. Nonparametric permutation tests for functional neuroimaging: a primer with examples. Hum Brain Mapp. 2002;15:1–25. doi: 10.1002/hbm.1058. [DOI] [PMC free article] [PubMed] [Google Scholar]
- Nobre AC, McCarthy G. Language-related ERPs: scalp distributions and modulation by word type and semantic priming. J Cogn Neurosci. 1994;6:233–255. doi: 10.1162/jocn.1994.6.3.233. [DOI] [PubMed] [Google Scholar]
- Parviainen T, Helenius P, Salmelin R. Cortical differentiation of speech and nonspeech sounds at 100 ms: implications for dyslexia. Cereb Cortex. 2005;15:1054–1063. doi: 10.1093/cercor/bhh206. [DOI] [PubMed] [Google Scholar]
- Patterson K, Shewell C. Speak and spell: dissociations and word class effects. In: Coltheart M, Sartori G, Job R, editors. The cognitive neuropsychology of language. London: Erlbaum; 1987. pp. 273–294. [Google Scholar]
- Poldrack RA, Wagner AD, Prull MW, Desmond JE, Glover GH, Gabrieli JD. Functional specialization for semantic and phonological processing in the left inferior prefrontal cortex. Neuroimage. 1999;10:15–35. doi: 10.1006/nimg.1999.0441. [DOI] [PubMed] [Google Scholar]
- Pulvermüller F, Shtyrov Y, Ilmoniemi RJ, Marslen-Wilson WD. Tracking speech comprehension in space and time. Neuroimage. 2006;31:1297–1305. doi: 10.1016/j.neuroimage.2006.01.030. [DOI] [PubMed] [Google Scholar]
- Pylkkänen L, Marantz A. Tracking the time course of word recognition with MEG. Trends Cogn Sci. 2003;7:187–189. doi: 10.1016/s1364-6613(03)00092-5. [DOI] [PubMed] [Google Scholar]
- Pylkkänen L, Llinás R, Murphy GL. The representation of polysemy: MEG evidence. J Cogn Neurosci. 2006;18:97–109. doi: 10.1162/089892906775250003. [DOI] [PMC free article] [PubMed] [Google Scholar]
- Rissman J, Eliassen JC, Blumstein SE. An event-related fMRI investigation of implicit semantic priming. J Cogn Neurosci. 2003;15:1160–1175. doi: 10.1162/089892903322598120. [DOI] [PubMed] [Google Scholar]
- Roland PE, Zilles K. The developing European computerized human brain database for all imaging modalities. Neuroimage. 1996;4:39–47. doi: 10.1006/nimg.1996.0050. [DOI] [PubMed] [Google Scholar]
- Rugg MD. Event-related potentials in phonological matching tasks. Brain Lang. 1984;23:225–240. doi: 10.1016/0093-934x(84)90065-8. [DOI] [PubMed] [Google Scholar]
- Rugg MD, Barrett SE. Event-related potentials and the interaction between orthographic and phonological information in a rhyme-judgment task. Brain Lang. 1987;32:336–361. doi: 10.1016/0093-934x(87)90132-5. [DOI] [PubMed] [Google Scholar]
- Salmelin R. Clinical neurophysiology of language: The MEG approach. Clin Neurophysiol. 2007;118:237–254. doi: 10.1016/j.clinph.2006.07.316. [DOI] [PubMed] [Google Scholar]
- Salmelin R, Service E, Kiesilä P, Uutela K, Salonen O. Impaired visual word processing in dyslexia revealed with magnetoencephalography. Ann Neurol. 1996;40:157–162. doi: 10.1002/ana.410400206. [DOI] [PubMed] [Google Scholar]
- Schormann T, Henn S, Zilles K. A new approach to fast elastic alignment with applications to human brains. Lect Notes Comput Sci. 1996;1131:337–342. [Google Scholar]
- Simos PG, Basile LF, Papanicolaou AC. Source localization of the N400 response in a sentence-reading paradigm using evoked magnetic fields and magnetic resonance imaging. Brain Res. 1997;762:29–39. doi: 10.1016/s0006-8993(97)00349-1. [DOI] [PubMed] [Google Scholar]
- Spitsyna G, Warren JE, Scott SK, Turkheimer FE, Wise RJ. Converging language streams in the human temporal lobe. J Neurosci. 2006;26:7328–7336. doi: 10.1523/JNEUROSCI.0559-06.2006. [DOI] [PMC free article] [PubMed] [Google Scholar]
- Tarkiainen A, Helenius P, Hansen PC, Cornelissen PL, Salmelin R. Dynamics of letter string perception in the human occipitotemporal cortex. Brain. 1999;122:2119–2132. doi: 10.1093/brain/122.11.2119. [DOI] [PubMed] [Google Scholar]
- Thompson-Schill SL, Swick D, Farah MJ, D'Esposito M, Kan IP, Knight RT. Verb generation in patients with focal frontal lesions: a neuropsychological test of neuroimaging findings. Proc Natl Acad Sci U S A. 1998;95:15855–15860. doi: 10.1073/pnas.95.26.15855. [DOI] [PMC free article] [PubMed] [Google Scholar]
- Tyler LK, Moss HE, Galpin A, Voice JK. Activating meaning in time: the role of imageability and form-class. Lang Cogn Proc. 2002;17:471–502. [Google Scholar]
- Uusitalo MA, Ilmoniemi RJ. Signal-space projection method for separating MEG or EEG into components. Med Biol Eng Comput. 1997;35:135–140. doi: 10.1007/BF02534144. [DOI] [PubMed] [Google Scholar]
- Uusvuori J, Parviainen T, Inkinen M, Salmelin R. Spatiotemporal interaction between sound form and meaning during spoken word perception. Cereb Cortex. 2008;18:456–466. doi: 10.1093/cercor/bhm076. [DOI] [PubMed] [Google Scholar]
- Uutela K, Hämäläinen M, Somersalo E. Visualization of magnetoencephalographic data using minimum current estimates. Neuroimage. 1999;10:173–180. doi: 10.1006/nimg.1999.0454. [DOI] [PubMed] [Google Scholar]
- Vandenbulcke M, Peeters R, Dupont P, Van Hecke P, Vandenberghe R. Word reading and posterior temporal dysfunction in amnestic mild cognitive impairment. Cereb Cortex. 2007;17:542–551. doi: 10.1093/cercor/bhj179. [DOI] [PubMed] [Google Scholar]
- Van Petten C, Luka BJ. Neural localization of semantic context effects in electromagnetic and hemodynamic studies. Brain Lang. 2006;97:279–293. doi: 10.1016/j.bandl.2005.11.003. [DOI] [PubMed] [Google Scholar]
- Vigneau M, Beaucousin V, Hervé PY, Duffau H, Crivello F, Houdé O, Mazoyer B, Tzourio-Mazoyer N. Meta-analyzing left hemisphere language areas: phonology, semantics, and sentence processing. Neuroimage. 2006;30:1414–1432. doi: 10.1016/j.neuroimage.2005.11.002. [DOI] [PubMed] [Google Scholar]
- Woods RP, Grafton ST, Watson JD, Sicotte NL, Mazziotta JC. Automated image registration: II. Intersubject validation of linear and nonlinear models. J Comput Assist Tomogr. 1998;22:153–165. doi: 10.1097/00004728-199801000-00028. [DOI] [PubMed] [Google Scholar]
- Wydell TN, Vuorinen T, Helenius P, Salmelin R. Neural correlates of letter-string length and lexicality during reading in a regular orthography. J Cogn Neurosci. 2003;15:1052–1062. doi: 10.1162/089892903770007434. [DOI] [PubMed] [Google Scholar]