

Abstract
Amygdala dysfunction has been implicated in numerous neurodevelopmental disorders, including autism spectrum disorder (ASD). Previous studies in mice and humans, respectively, have linked Pac1r/PAC1R function to social behavior and PTSD-susceptibility. Based on this connection to social and emotional processing and the central role played by the amygdala in ASD, we examined a putative role for PAC1R in social deficits in ASD and determined the pattern of gene expression in the developing mouse and human amygdala. We reveal that Pac1r/PAC1R is expressed in both mouse and human amygdala from mid-neurogenesis through early postnatal stages, critical time points when altered brain trajectories are hypothesized to unfold in ASD. We further find that parents of autistic children carrying a previously identified PTSD-risk genotype (CC) report greater reciprocal social deficits compared to those carrying the non-risk GC genotype. Additionally, by exploring resting-state functional connectivity differences in a sub-sample of the larger behavioral sample, we find higher functional connectivity between the amygdala and right middle temporal gyrus in individuals with the CC risk genotype. Thus, using multimodal approaches, our data reveal that the amygdala-expressed PAC1R gene may be linked to severity of ASD social phenotype and possible alterations in brain connectivity, therefore potentially acting as a modifier of amygdala-related phenotypes.
Keywords: PAC1R, amygdala, autism, genetic modifier, neuroimaging
Lay Summary
In this multimodal study across mouse and human, we examined expression patterns of Pac1r/PAC1R, a gene implicated in social behavior, and further explored whether a previously identified human PTSD-linked mutation in PAC1R can predict brain connectivity and social deficits in ASD. We find that PAC1R is highly expressed in the both the mouse and human amygdala. Furthermore, our human data suggest that PAC1R genotype is linked to severity of social deficits and functional amygdala connectivity in ASD.
Introduction
The amygdala, among a number of other brain structures such as the prefrontal cortex and cerebellum, is central for social and emotional processing (LeDoux, 2007; Barak & Feng, 2016). It is widely connected to a large number of brain regions including those that are known to be associated with social processing (e.g., ventromedial prefrontal cortex) as well as those that are generally involved in attentional (e.g., parietal regions) and visual (e.g., primary visual cortex) functions (Roy et al., 2009). A combination of anatomical and imaging studies supports the amygdala, as well as other brain regions of the social-cognitive network, as a key site of pathophysiology in ASD (Baron-Cohen et al., 2000; Mundy, 2018). In addition, amygdala dysfunction has been implicated in numerous other neurodevelopmental and psychological disorders involving socio-emotional impairments (Kennedy & Adolphs, 2012; Mier & Kirsch, 2015).
Although high quality post mortem studies are limited, two well conducted studies have revealed fewer, smaller and more densely compacted neurons in the amygdala of individuals with ASD compared to controls (Kemper & Bauman, 1998; Schumann & Amaral, 2006). Volumetric studies have revealed enlarged amygdalae earlier in childhood in ASD relative to typically-developing children (Schumann, 2004). fMRI studies have revealed decreased or increased activation during social-emotional tasks and aberrant functional connectivity of the amygdala in individuals with ASD compared to typically-developing controls (Baron-Cohen et al., 2000; Green et al., 2016; Guo et al., 2016; Kliemann et al., 2012). Although the source of abnormalities in amygdala processing in ASD is not currently well understood, these studies clearly implicate alteration of amygdala circuitry, structure, and function in ASD.
ASD is a complex genetic disorder, with greater than 90% of cases likely due to mutations in a number of genes that affect brain development (Bozzi et al., 2018; Ramaswami & Geschwind, 2018). While genome-wide association studies (GWAS) have begun to uncover genes that contribute to ASD susceptibility, there are likely other non-causal cohorts of genes that act as modifiers of core ASD behavioral phenotypes (Mullins et al., 2016). Based on previous studies in mice and humans, we focused on PAC1R (also known as ADCYAP1R1) as a potential modifier of ASD phenotypes. PAC1R encodes a receptor for pituitary adenylate cyclase activating polypeptide (PACAP), a member of the vasoactive intestinal polypeptide (VIP) family. PACAP, via PAC1R binding, regulates a number of diverse biological processes including neural development, cellular stress response, glucose metabolism and feeding, promotion of neuroendocrine secretion in pituitary cells, and modulation of the circadian clock (Falluel-Morel et al., 2008; Ghzili et al., 2008; Harmar & Lutz, 1994; Hashimoto, 2006; Mounien et al., 2009; Stroth et al., 2011).
Our interest in PAC1R in relation to ASD stems from previous work in both mouse and humans. Pac1r mutant mice display altered social behaviors but normal non-social behaviors (Nicot et al., 2004). This finding suggests that Pac1r may be involved in neural signaling processes essential for social function. Pac1r also appears to have a role in emotional processing as rodents show increased Pac1r expression in the amygdala after fear conditioning (Dias et al., 2012). In humans, a single nucleotide polymorphism (SNP) (rs2267735) occurring within a putative estrogen response element (ERE) of PAC1R has been linked to PTSD susceptibility in females (Breslau et al., 1998; Kessler et al., 1995). Specifically, females carrying two copies of the C allele at this locus have decreased PAC1R expression, which is predictive of PTSD diagnosis and increased severity of symptoms (Ressler et al., 2011). At the functional level, the CC risk genotype in the ERE sequence compromises ERα binding, inhibiting activation of PAC1R transcription and resulting in reduced gene expression (Mercer et al., 2016; Ressler et al., 2011). As amygdala dysfunction is a hallmark feature of PTSD (Davis, 1992; Diener et al., 2016; Giustino & Maren, 2015; Shin, 2006), these findings suggest that reduced PAC1R expression is linked to a phenotype stemming from disrupted amygdala functioning. Although mutations in PAC1R have yet to be found in ASD GWAS screens, the above described findings nevertheless suggest that PAC1R may act as a genetic modifier in psychiatric disorders characterized by social deficits, such as ASD. To further investigate this putative link, we employed a multi-modal, integrated approach to test the hypotheses that: 1) Pac1r/PAC1R is expressed during amygdala development in both mouse and human and 2) carrying the PSTD-risk genotype in PAC1R is predictive of behavioral functional brain alterations in ASD. Our studies reveal: 1) Pac1R/ PAC1R is expressed during key developmental stages in both mouse and human, and 2) PAC1R genotype status is correlated with both social deficits and altered brain connectivity in ASD. Thus, our results suggest that PAC1R may act as a genetic modifier in ASD, and if confirmed in larger cohorts, may provide a unique biomarker to stratify individuals with ASD.
Methods
Investigation of PAC1R expression
Animals
C57BL/6J mice obtained from Jackson Laboratories were housed and bred in the temperature and light controlled animal care facilities at Children’s National Medical Center. All animal procedures were approved by Children’s National Medical Center’s Institutional Animal Care and Utilization Committee (IACUC) and conformed to NIH guidelines for animal use.
In-situ hybridization
In-situ hybridization (ISH) was performed on C57BL/6J mouse tissue at embryonic (E) days 13.5 and 18.5 and postnatal day (P) 7. Three separate embryos/mice were analyzed at each age group. For E13.5, embryos were dissected and brains post-fixed in 4% paraformaldehyde (PFA) in PBS overnight. For E18.5 and P7, embryos or mice were perfused and brains post-fixed overnight in 4% PFA. After fixation, brains were cryoprotected in 30% sucrose, embedded in OCT, cryostat sectioned at 20μm and mounted on charged Superfrost Plus microscope slides. Slides were stored at −80°C until used for ISH. ISH was performed using probes and reagents obtained from RNAscope 2.5 (Advanced Cell Diagnostics, Newark, California, USA). Tissue sections were dehydrated and pre-treated with hydrogen peroxide and protease IV according to RNAscope recommendations. Amplification and detection steps were performed according to the RNAscope protocol using detection kit reagents and the EZ Hybridization oven set to 40°C. ISH signal was detected with a DAB reaction and hematoxylin counterstain was applied. After thorough washing, slides were coverslipped using Cytoseal-60 mounting media. Slides were imaged using an Olympus BX51 inverted light microscope.
Human PAC1R Expression
Human gene-level brain expression data were obtained by datamining publicly available information from the BrainSpan project [www.hbatlas.org], a public (NIH)-private (Allen Brain Atlas) Consortium to map human gene transcriptome expression in the brain. This database contains genome-wide transcriptome data on postmortem developing and adult human brains (Kang et al., 2011). We downloaded PAC1R brain expression data from the NCBI GEO database (accession number GSE25219) in the form of log2-transformed signal intensity values (Platform GPL5175, Affymetrix GeneChip Human Exon 1.0 ST Array). Affymetrix uses background probes with matching GC content for background correction for all probes on the array [http://media.affymetrix.com/support/technical/whitepapers/exon_background_correction_whitepaper.pdf]. Median PAC1R expression values were plotted using ggplot2 in R for each brain region (neocortex, hippocampus, amygdala, striatum, mediodorsal nucleus of the thalamus, cerebellar cortex) and developmental time period that is outlined in Table 1. Local polynomial regression fitting was used to smooth the scatter plots. Table 2 provides a breakdown of total number of samples for which data were available from BrainSpan.
Table 1.
Gene Expression Developmental Time Periods.
| Developmental Period | Age | |
|---|---|---|
| 1 | Embryonic | 4–8 PCW |
| 2 | Early fetal | 8–10 PCW |
| 3 | Early fetal | 10–13 PCW |
| 4 | Early-mid fetal | 13–16 PCW |
| 5 | Early-mid fetal | 16–19 PCW |
| 6 | Late-mid fetal | 19–24 PCW |
| 7 | Late fetal | 24–38 PCW |
| 8 | Neonatal and early infancy | 0–6 M |
| 9 | Late infancy | 6–12 M |
| 10 | Early childhood | 1–6 Y |
| 11 | Middle and late childhood | 6–12 Y |
| 12 | Adolescence | 12–20 Y |
| 13 | Young adulthood | 20–40 Y |
| 14 | Middle adulthood | 40–60 Y |
| 15 | Late adulthood | 60+ Y |
Defined developmental periods of human brain expression graphs corresponding to Table 1, modified from Kang et al., 2011
Abbreviations M, postnatal months; PCW, post-conceptual weeks; Y, years.
Table 2:
Brainspan Data Per Period of Development
| Period of Development | Total Samples (Fig. 3A) | # Males | # Females | # Samples for Fig. 3B | # Samples for Fig. 3C |
|---|---|---|---|---|---|
| 1 | 2 | 2 | 0 | 0 | 0 |
| 2 | 2 | 2 | 0 | 0 | 0 |
| 3 | 3 | 0 | 3 | 0 | 0 |
| 4 | 3 | 2 | 1 | 3 | 3 |
| 5 | 4 | 3 | 1 | 4 | 4 |
| 6 | 7 | 2 | 5 | 7 | 7 |
| 7 | 3 | 1 | 2 | 3 | 3 |
| 8 | 3 | 3 | 0 | 0 | 0 |
| 9 | 3 | 1 | 2 | 3 | 0 |
| 10 | 4 | 2 | 2 | 4 | 4 |
| 11 | 3 | 2 | 1 | 3 | 3 |
| 12 | 4 | 2 | 2 | 4 | 4 |
| 13 | 9 | 5 | 4 | 9 | 9 |
| 14 | 4 | 3 | 1 | 4 | 4 |
| 15 | 3 | 1 | 2 | 3 | 3 |
| Totals | 57 | 31 | 26 | 47 | 44 |
Interactome and Gene Ontology (GO) analysis
An interactome connecting PAC1R to other proteins was generated with Genomatix Software Suite, Version 3.9 (Munich, Germany). Additional interactors of PAC1R were identified using IPA software (version 2017, QIAGEN Inc., https://www.qiagenbioinformatics.com/products/ingenuity-pathway-analysis) (Krämer et al., 2014), GeneMANIA [http://genemania.org/] (Warde-Farley et al., 2010), and bibliographic references. We used the web resource AmiGO developed by the GO Consortium for searching and browsing GO terms (AMIGO2, version 1.8, http://amigo.geneontology.org/amigo). The Cytoscape plug-in ClueGO (version 1.8) was used to identify a functionally organized network of GO (Bindea et al., 2009). Putative binding sites for promoters located on the SNP were predicted using the specific tool Matinspector from the Genomatix Software Suite.
Genotype to Phenotype Analysis
Participants
129 children (104 males, 25 females) with ASD between 6 and 14 years of age were recruited from the Washington, DC metropolitan area to participate in IRB approved investigations of cognitive and neuroimaging profiles. Participant characteristics and demographics are shown in Table 2A and B. All participants met ASD criteria outlined by the Diagnostic and Statistical Manual of Mental Disorders; Fifth Edition (DSM-5) as assessed by experienced, trained clinicians at the Children’s National Center for Autism Spectrum Disorders (CASD). All participants also met the cutoff for ASD as determined by Lainhart criteria established by the NICHD/NIDCD Collaborative Programs for Excellence in Autism (Lainhart et al., 2006). Exclusion criteria were: any known co-morbid medical conditions, such as Fragile X Syndrome or other genetic disorders that could affect brain and behavioral development, and/or brain trauma/injury.
Behavior Protocol and Analysis
Participants received the Autism Diagnostic Interview-Revised (ADI-R, n=129) and most received the Autism Diagnostic Observation Schedule (ADOS, module 3, n=98) administered by trained, research-reliable clinicians. Each participant also supplied a saliva sample for DNA genotyping. Saliva samples were collected using Oragene collections kits (DNA Genotek Inc., Ottawa, ON, Canada). Written informed consent, and assent where appropriate, were obtained under a Children’s National Health System approved IRB protocol. Data are expressed as mean ± SEM and are statistically significant at p<0.05. Statistical analysis was performed using the multiple comparisons ANOVA with Bonferroni correction in SPSS (IBM SPSS Software Version 23, Armonk, NY, USA).
Genotyping
DNA was isolated using the Oragene DNA Isolation Protocol, according to manufacturer’s instructions. Screening for the SNP of interest was performed using a TaqMan allelic discrimination assay that employed the 5’ nuclease activity of Taq polymerase to detect a fluorescent reporter signal. Both alleles were detected simultaneously using allele-specific oligonucleotides labeled with different fluorophores, and genotypes were automatically determined by the ratio of the two fluorophores used. Assay ID C_15872945_10 was used to assay SNP rs2267735 (C/G). The PCR for this SNP contained 30 ng of DNA, 900 nM primers, 200 nM probes, and TaqMan Genotyping Universal PCR Master Mix in a final volume of 8 µL. PCR was performed on a GeneAmp 9700 thermo cycler. The PCR conditions were 10 minutes at 95 °C (denaturation), 44 cycles of 15 seconds at 92 °C, and 1 minute at an annealing temperature of 60 °C. Fluorescence of PCR products was assessed with an ABI 7900HT RT-PCR system, and allele calling was made using SDS software. All instruments and reagents were purchased from ThermoFisher (Waltham, MA). These polymorphisms were tested for allele frequency and cross-referenced to dbSNP [http://www.ncbi.nlm.nih.gov/projects/SNP/] for allele calling.
Resting State fMRI Imaging Analysis
Participants
Resting-state functional images were available from 48 of the ASD children recruited, aged 7–13 years old, who had participated in imaging studies at Georgetown University. A final cohort of 20 ASD children (17 males, 3 females) was retained after applying strict criteria for head motion to resting-state fMRI data and other exclusion criteria stated below. Out of the 20, 9 were PAC1R CC genotype and 11 were GC genotype. Demographic information for the final imaging sample (N=20) is presented in Tables 4 and 5. Exclusion criteria included: (1) Full-Scale IQ below 80 as measured by the Wechsler Intelligence Scale for Children (WISC-IV) or Wechsler Abbreviated Scale of Intelligence (WASI); (2) Other neurological diagnosis (e.g., epilepsy) based on parent report; and (3) Contraindications for MRI. Imaging data were acquired according to consenting guidelines of Georgetown University and Children’s National Health System IRBs.
Table 4.
ASD Cohort Demographics.
| Race | CC | GC | GG |
|---|---|---|---|
| African American | 7 | 7 | 1 |
| Asian | 2 | 5 | 0 |
| White | 25 | 49 | 24 |
| Other | 1 | 5 | 1 |
| Total | 35 | 66 | 26 |
| Ethnicity | CC | GC | GG |
| Hispanic/Latino | 1 | 8 | 2 |
| Not Hispanic/Latino | 32 | 57 | 23 |
| Total | 33 | 65 | 25 |
Table 5.
Imaging Participant Characteristics.
| N | M | SD | Range | |
|---|---|---|---|---|
| Chronological age | 20 | 11.2 | 1.44 | 8–14 |
| ADI Reciprocal Social | 19 | 20.8 | 5.88 | 10–29 |
| ADI Communication Verbal | 19 | 16.1 | 4.94 | 6–24 |
| ADI Repetitive Behavior | 19 | 5.1 | 2.05 | 1–9 |
| ADOS Communication | 19 | 3.2 | 1.61 | 1–7 |
| ADOS Social Interaction | 19 | 7.5 | 2.85 | 2–13 |
| ADOS Social Communication | 19 | 10.7 | 4.15 | 3–18 |
| Full Scale IQ | 20 | 118.9 | 16.4 | 94–149 |
Imaging Protocol and Analysis
Resting state functional echo-planar images were acquired on a Siemens Trio 3T (Munich, Germany) with parameters: 3 mm isotropic resolution (3.0 × 3.0 × 2.5+.5 gap mm), TR = 2000 ms, TE = 30 ms, flip angle = 90°, FOV = 192 × 192 mm. Subjects were asked to stay awake with eyes open during a 5 mins/51secs scan. CONN functional connectivity toolbox was used to perform standard preprocessing and denoising steps, including slice-timing and motion correction, spatial normalization, resampling to 2 mm isotropic, smoothing (8mm kernel), nuisance regression (6 motion parameters, CSF and white matter signal, and high motion volumes, i.e. >3 standard deviations of average signal or >0.5mm framewise displacement “scrubbed”) and bandpass filtering (0.008–0.09 Hz). Seed regions of interest (ROIs) were created using left and right amygdala masks from the AAL atlas through Wake Forest PickAtlas (Wake Forest University School of Medicine, Winston-Salem, NC). Time series for each of the 2 ROIs were correlated with that of every other voxel in the brain (Pearson’s correlation r values were transformed to Z scores), which produced a whole-brain connectivity map for each participant, for left and right amygdala each. We then entered these two connectivity maps in second-level two-way ANOVA to test for the main effect of group for differences between participants with CC (N=9) and GC (N=11) genotypes for any of the ROIs. Results were corrected for voxel-wise multiple comparisons at p<0.05 using Monte-Carlo simulation 3dClustSim (2-sided, nearest neighbor = 2; ( Cox et al., 2017)) which produced a height threshold of p<0.005 with extent threshold k=56. Individuals from this imaging cohort with the GG genotype were not analyzed due to low sample size after exclusion for motion artifact.
Results
Pac1r expression
Previous studies revealed that Pac1r is expressed throughout the mature mouse brain particularly in the hippocampus and hypothalamus (Otto et al., 1998). However, the developmental pattern of expression within the amygdala has not been assessed. To determine when and where Pac1r is expressed during amygdala formation, we examined gene expression patterns by in situ hybridization (ISH) at embryonic day (E) 13.5, E18.5 and postnatal day (P) 7, time points that represent early, mid, and later stages of amygdala development (Sokolowski & Corbin, 2012). We found that at E13.5, Pac1r mRNA is expressed in the ventral pallium and the pre-optic area (Figure 1), two major amygdala progenitor zones previously identified by us and others (Carney et al., 2010; Hirata et al., 2009; Waclaw et al., 2010). We further observed high Pac1r expression at E18.5 in emerging amygdala nuclei such as the medial and basolateral amygdala (Figure 2a–d). Pac1r mRNA expression remained high and widespread across amygdala nuclei at P7 (Figure 2e).
Figure 1.

ISH analyses at E13.5 shows Pac1r mRNA expression in known amygdala progenitor zones (A, boxed regions). Higher magnification image shows numerous Pac1r+ cells (brown) in the emerging amygdala (B) and the VP (C, arrows), a source of progenitors destined to give rise to excitatory output neurons in the BLA. Pac1r+ cells (arrow) are also observed in the POA (D), a source of progenitors destined to give rise to inhibitory output neurons in the MeA. Abbreviations: AMY, Amygdala; BLA, Basolateral Amygdala; CeA, Central Amygdala; CTX, Cortex; HIP, Hippocampus; MeA, Medial Amygdala; LGE, Lateral Ganglionic Eminence; MGE, Medial Ganglionic Eminence; POA, Pre-Optic Area; VP, Ventral Pallium.
Figure 2.
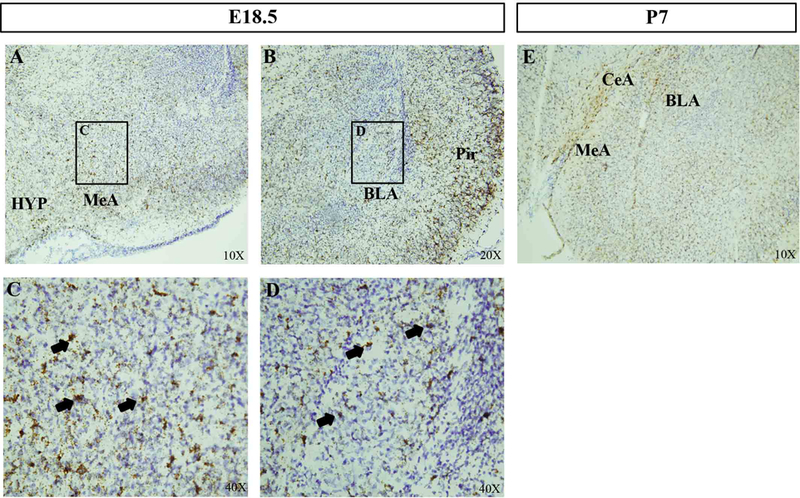
ISH analyses at E18.5 shows high levels of Pac1r mRNA in developing amygdala nuclei (A, B). Higher magnification of the MeA (C) and BLA (D) show numerous Pac1r+ cells (arrows). (E) At post-natal day 7 many Pac1r+ cells are observed in multiple amygdala sub-nuclei. Abbreviations: BLA, basolateral amygdala; CeA, central nucleus of the amygdala; MeA, medial amygdala; HYP, hypothalamus; Pir, piriform cortex
Next, we sought to examine the expression of PAC1R throughout human brain development. To accomplish this we datamined post-mortem human gene expression data from the BrainSpan project [http://hbatlas.org/](Kang et al., 2011) to generate gene expression graphs of PAC1R throughout the life span from human fetal stages through adulthood. Our brain expression graphs showed high levels of PAC1R expression in the amygdala, cerebellar cortex, hippocampus, mediodorsal nucleus of the thalamus, neocortex and striatum commencing at early-mid fetal stages and remaining high throughout childhood and adulthood (Figure 3a, Tables 1 and 2). Specifically, in the amygdala PAC1R expression increased throughout fetal development, peaked in expression around birth, and remained stable throughout the remainder of post-natal development. We also found differential expression of PAC1R between males and females at numerous stages of development (Figure 3b and Table 2). In the amygdala, expression was higher in males than females during fetal development (Figure 3c). Then, by birth and throughout childhood, PAC1R expression was higher in females compared to males, with a leveling off of expression across genders during adulthood.
Figure 3.

Gene-level brain expression graphs were generated with data from the BrainSpan project (Kang et al., 2011) collected from post-mortem human brain samples. The x-axis shows periods of development with the dark vertical line signifying birth (developmental time points are defined in Table 1). Along the y-axis are values of median expression (Log2-Transformed Signal Intensity) for which values ≥ 6 signify high levels of expression in at least one post-mortem brain sample. A. Expression of PAC1R is observed in multiple brain regions starting at stage 1 of fetal development. B. Differential expression of PAC1R is observed between males and females in multiple brain regions with median values above 0.0 denoting higher expression in males and values below 0.0 denoting higher expression in females. C. Differential expression of PAC1R between males and females only in the amygdala. Abbreviations: AMY, amygdala; CBC, cerebellar cortex; HIP, hippocampus; MD, mediodorsal nucleus of the thalamus; NCX, neocortex; STR, striatum.
PAC1R Interactome
To investigate potential interactors of PAC1R protein with other proteins and a potential functional relationship with known ASD susceptibility genes, we generated a protein interactome utilizing Genomatix (Figure 4). The interactome generated indicates that PAC1R is at a hub of different signaling cascades involved in stress, metabolism, and inflammatory responses, among others. Moreover, PAC1R potentially interacts with IL6, MAPK1 and CTNNB1, whose encoding genes have been listed as autism susceptibility genes by the Simons Foundation Autism Research Initiative [SFARI, https://gene.sfari.org/database/gene-scoring/]. Additionally, the PAC1R interactome included other proteins whose encoding genes are implicated in ASD with high scores in SFARI Gene (up to category 3) such as: DISC1, NLGN3, PER2 and SHANK1, as revealed by IPA and GeneMANIA analyses (Hattori et al., 2007; Katayama et al., 2009). The enriched biological functions of PAC1R interactome genes associated with ASD were assessed with ClueGO and included nervous system development, dendritic spine and synaptic junction, regulation of synaptic transmission (glutamatergic), gliogenesis, peptide hormone secretion, circadian rhythms, and response to stress. Therefore, mutations in PAC1R may affect a variety of these processes, potentially contributing to brain dysfunction in ASD. The intronic rs2267735 variant may not only impair the binding to the estrogen response element as experimentally validated (Mercer et al., 2016), but also other binding sites located in the SNP. Indeed Genomatix identified several susceptible (hypothesized but untested) binding sites within the SNP (Chr7:31095890) for promoters such as cAMP-responsive element binding proteins, v-ERB and RAR-related orphan receptor alpha, Nuclear receptor subfamily 2 factors, Nascent polypeptide associated complex and coactivator alpha, as well as RXR heterodimer binding sites. Thus, these potential interactors provide a rich data source to further investigate functional protein interactions with PAC1R that may modulate ASD phenotypes.
Figure 4.

PAC1R is at a hub of different signaling cascades involved in stress, metabolism, and inflammatory responses, among others. Plot and legend adapted from Genomatix (v.s. 3.9).
Genotype to Phenotype Correlations
Previous studies have revealed that a G to C SNP (rs2267735) occurring within a putative ERE in PAC1R confers increased PTSD risk in females (Mercer et al., 2016). We therefore next examined whether there is a relationship between this SNP and ASD, another disorder with a major amygdala component (Baron-Cohen et al., 2000; Guo et al., 2016; Kemper & Bauman 1998). To accomplish this, we examined the PAC1R genotype status (CC, GC, GG) within an ASD cohort (Tables 3 and 4; Figure 5) compared to mean raw scores for three subscales of the ADI-R (repetitive behaviors, communication, and reciprocal social interaction). Using a multiple comparisons ANOVA, we found our hypothesized significant difference in mean raw scores for the reciprocal social subscale of the ADI-R between the CC (PTSD risk) and GC (non-risk) groups, with CC individuals scoring higher—indicative of greater clinical difficulty (F = 3.33, p< 0.05). No significant difference was found between mean raw scores for the risk (CC) and homozygous non-risk (GG) individuals. This may be attributed to our low sample size (n=26) for the GG group (Table 4).
Table 3.
Characteristics and Demographics
| Participant Characteristics | N | M | SD | Range |
|---|---|---|---|---|
| Chronological age (years) | 129 | 10 | 2 | 6–14 |
| ADI Reciprocal Social | 128 | 18.7 | 5.37 | 7–30 |
| ADI Communication Verbal | 126 | 15.4 | 4.35 | 6–24 |
| ADI Repetitive Behavior | 129 | 5.5 | 2.31 | 0–12 |
| ADOS Communication | 95 | 3.4 | 1.99 | 0–9 |
| ADOS Social Interaction | 95 | 8.2 | 3.24 | 1–14 |
| ADOS Social Communication | 95 | 11.6 | 4.9 | 0–22 |
| Full Scale IQ | 108 | 105.4 | 20.6 | 62–149 |
| Participant Demographics | ||||
| Race | N | |||
| African American | 17 | |||
| Asian | 7 | |||
| Caucasian | 99 | |||
| Other | 7 | |||
| Missing | 2 | |||
| Total | 132 | |||
| Ethnicity | N | |||
| Hispanic or Latino | 11 | |||
| Non-Hispanic or Latino | 115 | |||
| Missing | 6 | |||
| Total | 132 | |||
| Gender | N | |||
| Male | 104 | |||
| Female | 25 | |||
Figure 5.

ADI behavioral scores by PAC1R SNP allele status. A significant correlation exists between Reciprocal Social scores and allele status. Bars show standard error, n = 129, p < 0.05.
To examine whether there is a link between genotype status and brain connectivity, we next conducted resting state fMRI imaging of a subset of individuals that were behaviorally and genetically assessed (Tables 5 and 6). Within the cohort of ASD participants who underwent resting state fMRI imaging, an F test revealed one cluster in posterior right middle temporal gyrus (k=97 (776 mm3), peak at MNI coordinate x=60,y=−60,z=6; see Figure 6) where functional connectivity was higher in the CC (PTSD-risk group) than non-risk GC group with the bilateral amygdala. A homologous cluster with the same connectivity pattern was observed in the middle temporal gyrus in the left hemisphere at an uncorrected threshold (p <0.005, k=44 (352 mm2), peak at MNI coordinate x=−58,y=−70,z=4). These regions correspond to visual area MT (Tootell et al., 1995), which is involved in processing of visual motion.
Table 6.
Imaging cohort details
| A fMRI Cohort Gender Groups. | ||
|---|---|---|
| N | Percent | |
| Male | 17 | 85 |
| Female | 3 | 15 |
| Total | 20 | 100 |
| B fMRI Cohort Allele Status Groups. | ||
| N | Percent | |
| CC | 9 | 45 |
| GC | 11 | 55 |
| Total | 20 | 100 |
| C fMRI Cohort Demographics. | ||
| Race | CC | GC |
| African American | 2 | 0 |
| Asian | 1 | 1 |
| White | 6 | 8 |
| Other | 0 | 1 |
| Total | 9 | 10 |
| Ethnicity | CC | GC |
| Not Hispanic/Latino | 7 | 10 |
| Total | 7 | 10 |
Figure 6.

F test reveals one cluster in right middle temporal gyrus where functional connectivity to the bilateral amygdala was significantly higher in the CC group compared to the GC group. Bars show standard error, n = 20, p < 0.005.
Discussion
ASD affects around 1 in 68 children (CDC, 2010) and is characterized by social-communication deficits and repetitive and/or restricted behaviors (American Psychiatric Association, 2013). Although ASD has been recognized for over 70 years as a distinct behavioral disorder (Kanner, 1943), its biological underpinnings remain relatively unknown (Geschwind, 2011). Moreover, ASD diagnosis is solely based on behavioral criteria, which have been modified over the years as the DSM has been revised. However, with the advent of rapid and inexpensive methods of gene sequencing over the past decade, the genetic landscape of ASD is beginning to be mapped (Ramaswami & Geschwind, 2018). Currently, according to SFARI Gene [https://gene.sfari.org/about-gene-scoring/criteria/], there are over 850 susceptibility genes, grouped according to level of confidence, that have been identified as potentially contributing to ASD risk. These genes likely act in combination and via complex gene-environment interactions resulting in alterations in brain development that are causal for ASD (Mullins et al., 2016). In addition to these susceptibility genes, there are likely other cohorts of genes that can greatly influence ASD behavioral phenotypes, either acting in a homeostatic manner to ameliorate autistic phenotypes, or acting to enhance core symptoms (Mullins et al., 2016). In this study, we focused our attention on PAC1R as a gene that may act as a modifier of social behavioral phenotypes. To accomplish this, we took a multi-modal approach to investigate a putative link between PAC1R genotype status, brain connectivity and social behavior in a cohort of children with ASD. We also further investigated gene expression patterns in mouse and human. Our focus on PAC1R stems from previous studies in both mice and humans. Adult Pac1R knockout mice display markedly abnormal social behaviors in the 3-chambered social task (Nicot, et al., 2004), a gold standard social assay in mice that has provided face validity for animal models of autism (Silverman et al., 2010). This previous finding implicated Pac1R as a key mediator of the development and/or function of brain systems that control social processes. Furthermore, studies in humans revealed a link between a SNP (rs2267725) in the PAC1R ERE and PTSD susceptibility in females (Mercer et al., 2016; Ressler et al., 2011). Although in our study our subjects were primarily male, the commonality of amygdala circuit dysfunction in both PTSD and ASD provides the justification for our focus on PAC1R and warrants continued investigation with larger cohorts of both sexes.
We first wanted to establish whether Pac1r is indeed expressed in the developing amygdala, coinciding with time frames critical for brain development and during periods implicated in altered developmental trajectories associated with ASD. We find that Pac1r is highly expressed in mouse brain neural progenitor zones previously implicated by others and us for generating neurons of the amygdala (Carney et al., 2010; Hirata et al., 2009; Waclaw et al., 2010). Moreover, at early postnatal stages we find high levels of Pac1r expression in emerging mouse amygdala nuclei. Consistent with our findings in the mouse, data mining of the BrainSpan database reveals high levels of PAC1R expression in the human amygdala across the lifespan. This datamining further revealed differential PAC1R expression in human male and female brains. Amygdala PAC1R expression is higher in males prenatally, and shifts to higher expression in females during childhood and early adulthood. Thus, Pac1r/PAC1R is expressed in a spatial and temporal manner during critical prenatal stages of amygdala development, and in an apparent sex-dependent manner in humans. Exploration of Pac1r sex specific function in mouse amygdala development and social behaviors merits further investigation.
Previous studies investigating genetic links to PTSD revealed that a G to C SNP (rs2267735) within the ERE of an intron of the PAC1R gene is predictive of PTSD severity in females (Mercer et al., 2016; Ressler et al., 2011). Estrogen binding to ERα on the ERE of the PAC1R is disrupted, causing a reduction in transcription and decreased PAC1R expression. This intronic variant might not only impair binding to the ERE (Mercer et al., 2016) but may also modify binding sites for the promoters identified by Genomatix reported here. As these promoters may affect PAC1R function they should be further investigated. Furthermore, several genes within the PAC1R interactome are found in the SFARI ASD risk gene list, including IL6, MAPK1, CTNNB1, DISC1, NLGN3, PER2 and SHANK1. These data together suggest that PAC1R is closely tied to amygdala function in stress and fear response pathways, which are disrupted in PTSD. Furthermore, both PTSD and ASD involve impairment of amygdala function and social related symptoms, albeit likely via distinct etiologies (American Psychiatric Association, 2013; Davis, 1992; Diener et al., 2016; Giustino & Maren, 2015; Shin, 2006).
Beyond studies of gene expression, we examined how the G to C SNP (rs2267735) may be related to ASD social symptoms and brain connectivity. Despite only being able to assess relatively small cohorts, we nevertheless find a significant correlation between the PTSD-linked CC genotype and raw score on the reciprocal social subscale of the ADI-R. Individuals with ASD carrying the homozygous CC genotype displayed a higher score, indicating greater social deficit than those carrying the heterozygous genotype (GC, n=66). No significant difference was found between the risk genotype (CC, n=35) and the wildtype genotype (GG, n=26), which may reflect limited power based on the small sample size. Additionally, exploratory analysis of fMRI resting state imaging data from a small subset of the behavioral sample provides evidence in support of genetic differences in functional connectivity of the amygdala. Individuals carrying the risk genotype (CC) had higher resting-state functional connectivity between the amygdala and right posterior temporal gyrus relative to carriers of the non-risk genotype (GC). PAC1R genetic differences in connectivity of the amygdala with a region involved in visual motion processing may influence how children with ASD perceive socially meaningful information. Indeed, motion perception is altered in ASD (Schauder et al., 2017) and individual differences may relate to PAC1R genetic differences in connectivity to the amygdala, a structure critical for emotional processing. However, it is important to note that our behavioral and connectivity findings represent a small sample of individuals with ASD, and while these findings are highly intriguing, it will be critical to extend these studies with larger cohorts and to explore potential sex differences in the role of PAC1R on behavioral phenotype and connectivity. It will also be critical to examine measurements of other ASD-related behavioral deficits, for example anxiety. As anxiety disorders are commonly comorbid with ASD and increased anxiety is a feature of PTSD, investigating the link between anxiety and PAC1R allele status may reveal further links between genotype and behavior. Despite these limitations, our intriguing findings form a strong basis for future studies to examine this relationship in larger cohorts and in females with ASD and suggest that PAC1R may be a novel biomarker for predicting social and brain connectivity alterations in this amygdala related disorder.
Acknowledgements
This work was supported by a DC-IDDRC Pilot Award [JGC, LK], CNHS CTSI-CN Pilot Studies Award [LK], IDDRC Award HD040677–07 [CV], The Isadore and Bertha Gudelsky Family Foundation [LK], and NIH grants MH083053–01A2 [LK] and MH084961 [CV]. Core support was provided by the DC-IDDRC Imaging and Genomics Cores (1U54HD090257). Provision of the trial license of the Genomatix software is greatly acknowledged. We would also like to thank the children/adults and their families who gave their time and energy to assist in completing this research. The authors declare no conflict of interest.
List of Abbreviations
- ASD
Autism Spectrum Disorders
- ADI-R
Autism Diagnostic Interview-Revised
- ADOS
Autism Diagnostic Observation Schedule
- AMY
amygdala
- ANOVA
analysis of variance
- CBC
cerebellar cortex
- DSM-IV
Diagnostic and Statistical Manual of Mental Disorders; Fourth Edition
- ERE
estrogen response element
- HIP
hippocampus
- IACUC
Institutional Animal Care and Utilization Committee
- NCBI GEO
National Center for Biotechnology Information Gene Expression Omnibus
- NCX
neocortex
- MD
mediodorsal nucleus of the thalamus
- MT
middle temporal gyrus visual area
- PACAP
Pituitary adenylate cyclase activating polypeptide
- PAC1R
pituitary adenylate cyclase-activating polypeptide type 1 receptor
- PCW
post conceptual weeks
- SNP
single nucleotide polymorphism
- STR
striatum
- VIP
vasoactive intestinal polypeptide
- Y
years
References
- American Psychiatric Association. (2013). The diagnostic and statistical manual of mental disorders, 5th edition (DSM-5) Washington, DC: American Psychiatric Association. [Google Scholar]
- Barak B, & Feng G (2016). Neurobiology of social behavior abnormalities in autism and Williams syndrome. Nat Neurosci, 19(6). 647–655. doi: 10.1038/nn.4276. [DOI] [PMC free article] [PubMed] [Google Scholar]
- Baron-Cohen S, Ring HA, Bullmore ET, Wheelwright S, Ashwin C, & Williams SCR (2000). The amygdala theory of autism. Neuroscience & Biobehavioral Reviews, 24(3), 355–364. 10.1016/S0149-7634(00)00011-7 [DOI] [PubMed] [Google Scholar]
- Bindea G, Mlecnik B, Hackl H, Charoentong P, Tosolini M, Kirilovsky A, … Galon J (2009). ClueGO: a Cytoscape plug-in to decipher functionally grouped gene ontology and pathway annotation networks. Bioinformatics, 25(8), 1091–1093. 10.1093/bioinformatics/btp101 [DOI] [PMC free article] [PubMed] [Google Scholar]
- Bozzi Y, Provenzano G, & Casarosa S (2018). Neurobiological bases of autism-epilepsy comorbidity: a focus on excitation/inhibition imbalance. Eur J Neurosci, 47(6), 534–548. doi: 10.1111/ejn.13595. [DOI] [PubMed] [Google Scholar]
- Breslau N, Kessler RC Chilcoat HD, Schultz LR, Davis GC, & Andreski P (1998). Trauma and Posttraumatic Stress Disorder in the Community: The 1996 Detroit Area Survey of Trauma, 55(7), 626–632. 10.1001/archpsyc.55.7.626 [DOI] [PubMed] [Google Scholar]
- Carney RS, Mangin J-M, Hayes L, Mansfield K, Sousa VH, Fishell G, … Corbin JG (2010). Sonic hedgehog expressing and responding cells generate neuronal diversity in the medial amygdala. Neural Development, 5(1), 14 10.1186/1749-8104-5-14 [DOI] [PMC free article] [PubMed] [Google Scholar]
- CDC. (2010). Prevalence of Autism Spectrum Disorder Among Children Aged 8 Years — Autism and Developmental Disabilities Monitoring Network, 11 Sites, United States, 2010. Surveill Summ, 63(2), 1–21. [PubMed] [Google Scholar]
- Christiane O, Zuschratter W, Gass P, & Schutz G (1998). Presynaptic localization of the PACAP-typeI-receptor in hippocampal and cerebellar mossy fibres 1999, 66, 163–174. 10.1016/S0169-328X(99)00010-8 [DOI] [PubMed] [Google Scholar]
- Davis M (1992). The role of the amygdala in fear and anxiety. Annual Review of Neuroscience, 15(1), 353–375. 10.1146/annurev.ne.15.030192.002033 [DOI] [PubMed] [Google Scholar]
- Dias Brian G, & Ressler Kerry J. (2012). PACAP and the PAC1 Receptor in Post-Traumatic Stress Disorder. Neuropsychopharmacology, 38, 245–246. 10.1038/npp.2012.147 [DOI] [PMC free article] [PubMed] [Google Scholar]
- Diener SJ, Nees F, Wessa M, Wirtz G, Frommberger U, Penga T, … Flor H (2016). Reduced amygdala responsivity during conditioning to trauma-related stimuli in posttraumatic stress disorder: Conditioning to trauma-related stimuli in PTSD. Psychophysiology, 53(10), 1460–1471. 10.1111/psyp.12699 [DOI] [PubMed] [Google Scholar]
- Falluel-Morel A, Tascau LI, Sokolowski K, Brabet P, & DiCicco-Bloom E (2008). Granule Cell Survival is Deficient in PAC1−/− Mutant Cerebellum. Journal of Molecular Neuroscience, 36(1–3), 38–44. 10.1007/s12031-008-9066-6 [DOI] [PubMed] [Google Scholar]
- Geschwind DH (2011). Genetics of autism spectrum disorders. Trends in Cognitive Sciences, 15(9), 409–416. 10.1016/j.tics.2011.07.003 [DOI] [PMC free article] [PubMed] [Google Scholar]
- Ghzili H, Grumolato L, Thouënnon E, Tanguy Y, Turquier V, Vaudry H, & Anouar Y (2008). Role of PACAP in the physiology and pathology of the sympathoadrenal system. Frontiers in Neuroendocrinology, 29(1), 128–141. 10.1016/j.yfrne.2007.10.001 [DOI] [PubMed] [Google Scholar]
- Giustino TF, & Maren S (2015). The Role of the Medial Prefrontal Cortex in the Conditioning and Extinction of Fear. Frontiers in Behavioral Neuroscience, 9 10.3389/fnbeh.2015.00298 [DOI] [PMC free article] [PubMed] [Google Scholar]
- Green SA, Hernandez L, Bookheimer SY, & Dapretti M (2016). Salience Network Connectivity in Autism Is Related to Brain and Behavioral Markers of Sensory Overresponsivity, 55(7), 618–626. 10.1016/j.jaac.2016.04.013 [DOI] [PMC free article] [PubMed] [Google Scholar]
- Guo X, Duan X, Long Z, Chen H, Wang Y, Zheng J, … Chen H (2016). Decreased amygdala functional connectivity in adolescents with autism: A resting-state fMRI study. Psychiatry Research: Neuroimaging, 257, 47–56. 10.1016/j.pscychresns.2016.10.005 [DOI] [PubMed] [Google Scholar]
- Harmar T, & Lutz E (1994). Multiple receptors for PACAP and VIP. Trends in Pharmacological Sciences, 15(4), 97–99. 10.1016/0165-6147(94)90042-6 [DOI] [PubMed] [Google Scholar]
- Hashimoto H (2006). New Insights into the Central PACAPergic System from the Phenotypes in PACAP- and PACAP Receptor-Knockout Mice. Annals of the New York Academy of Sciences, 1070(1), 75–89. 10.1196/annals.1317.038 [DOI] [PubMed] [Google Scholar]
- Hattori T, Baba K, Matsuzaki S, Honda A, Miyoshi K, Inoue K, … Baba A (2007). A novel DISC1-interacting partner DISC1-Binding Zinc-finger protein: implication in the modulation of DISC1-dependent neurite outgrowth. Molecular Psychiatry, 12(4), 398–407. 10.1038/sj.mp.4001945 [DOI] [PubMed] [Google Scholar]
- Hirata T, Li P, Lanuza GM, Cocas LA, Huntsman MM, & Corbin JG (2009). Identification of distinct telencephalic progenitor pools for neuronal diversity in the amygdala. Nature Neuroscience, 12(2), 141–149. 10.1038/nn.2241 [DOI] [PMC free article] [PubMed] [Google Scholar]
- Kang HJ, Kawasawa YI, Cheng F, Zhu Y, Xu X, Li M, … Šestan N (2011). Spatio-temporal transcriptome of the human brain. Nature, 478(7370), 483–489. 10.1038/nature10523 [DOI] [PMC free article] [PubMed] [Google Scholar]
- Kanner L (1943). Autistic disturbances of affective contact. Nervous Child, 2, 217–250. [PubMed] [Google Scholar]
- Katayama Taiichi, Hattori Tsuyoshi, Yamada Kohei, Matsuzaki Shinsuke, & Tohyama Masaya. (2009). Role of the PACAP–PAC1–DISC1 and PACAP–PAC1–stathmin1 systems in schizophrenia and bipolar disorder: novel treatment mechanisms? Pharmacogenomics, 10(12). 10.2217/pgs.09.147 [DOI] [PubMed] [Google Scholar]
- Kemper TL, & Bauman ML (1998). Neuropathology of infantile autism 1998, (7), S12–S13. 10.1038/sj.mp.4001165 [DOI] [PubMed] [Google Scholar]
- Kennedy DP, & Adolphs R (2012). The social brain in psychiatric and neurological disorders. Trends in Cognitive Sciences, 16(11), 559–572. 10.1016/j.tics.2012.09.006 [DOI] [PMC free article] [PubMed] [Google Scholar]
- Kessler RC, Sonnega A, Bromet E, Hughes M, & Nelson CB (1995). Posttraumatic stress disorder in the National Comorbidity Survey. Archives of General Psychiatry, 52(12), 1048–1060. 10.1001/archpsyc.1995.03950240066012 [DOI] [PubMed] [Google Scholar]
- Kliemann D, Dziobek I, Hatri A, Baudewig J, & Heekeren HR (2012). The Role of the Amygdala in Atypical Gaze on Emotional Faces in Autism Spectrum Disorders. Journal of Neuroscience, 32(28), 9469–9476. 10.1523/JNEUROSCI.5294-11.2012 [DOI] [PMC free article] [PubMed] [Google Scholar]
- Krämer A, Green J, Pollard J, & Tugendreich S (2014). Causal analysis approaches in Ingenuity Pathway Analysis. Bioinformatics, 30(4), 523–530. 10.1093/bioinformatics/btt703 [DOI] [PMC free article] [PubMed] [Google Scholar]
- Lainhart JE, Bigler ED, Bocian M, Coon H, Dinh E, Dawson G, … Volkmar F (2006). Head circumference and height in autism: A study by the collaborative program of excellence in autism. American Journal of Medical Genetics Part A, 140A(21), 2257–2274. 10.1002/ajmg.a.31465 [DOI] [PMC free article] [PubMed] [Google Scholar]
- LeDoux J (2007). The amygdala. Curr Biol 17(20):R868–874. Review [DOI] [PubMed] [Google Scholar]
- Mercer KB, Dias B, Shafer D, Maddox SA, Mulle JG, Hu P, … Ressler KJ (2016). Functional evaluation of a PTSD-associated genetic variant: estradiol regulation and ADCYAP1R1. Translational Psychiatry, 6(12), e978–e978. 10.1038/tp.2016.241 [DOI] [PMC free article] [PubMed] [Google Scholar]
- Mier D, & Kirsch P (2015). Social-Cognitive Deficits in Schizophrenia, (30), 397–409. 10.1007/7854_2015_427 [DOI] [PubMed] [Google Scholar]
- Mounien L, Do Rego J-C, Bizet P, Boutelet I, Gourcerol G, Fournier A, … Jégou S (2009). Pituitary adenylate cyclase-activating polypeptide inhibits food intake in mice through activation of the hypothalamic melanocortin system. Neuropsychopharmacology, 34(2), 424–435. 10.1038/npp.2008.73 [DOI] [PubMed] [Google Scholar]
- Mullins C, Fishell G, & Tsien RW (2016). Unifying Views of Autism Spectrum Disorders: A Consideration of Autoregulatory Feedback Loops. Neuron, 89(6), 1131–1156. doi: 10.1016/j.neuron.2016.02.017 Review. [DOI] [PMC free article] [PubMed] [Google Scholar]
- Mundy P (2018) A review of joint attention and social-cognitive brain systems in typical development and autism spectrum disorder. Eur J Neurosci, 47(6), 497–514. doi: 10.1111/ejn.13720. [DOI] [PubMed] [Google Scholar]
- Nicot A Otto T, Brabet P, & Dicicco-Bloom EM (2004). Altered Social Behavior in Pituitary Adenylate Cyclase-Activating Polypeptide Type I Receptor-Deficient Mice. Journal of Neuroscience, 24(40), 8786–8795. 10.1523/JNEUROSCI.1910-04.2004 [DOI] [PMC free article] [PubMed] [Google Scholar]
- Ramaswami G, & Geschwind DH (2018). Genetics of autism spectrum disorder. In Handbook of Clinical Neurology (Vol. 147, pp. 321–329). Elsevier; 10.1016/B978-0-444-63233-3.00021-X [DOI] [PubMed] [Google Scholar]
- Ressler KJ, Mercer KB, Bradley B, Jovanovic T, Mahan A, Kerley K, … May V (2011). Post-traumatic stress disorder is associated with PACAP and the PAC1 receptor. Nature, 470(7335), 492–497. 10.1038/nature09856 [DOI] [PMC free article] [PubMed] [Google Scholar]
- Roy AK, Shehzad Z, Margulis DS, Kelly AM, Uddin LQ, Gotimer K, Biswal BB, Castellanos FX, & Milham MP (2009). Functional connectivity of the human amygdala using resting state fMRI. Neuroimage, 45(2), 614–626. doi: 10.1016/j.neuroimage.2008.11.030. [DOI] [PMC free article] [PubMed] [Google Scholar]
- Schauder KB, Park WJ, Tadin D, & Bennetto L (2017). Larger receptive field size as a mechanism underlying atypical motion perception in autism spectrum disorder. Clinical Psychological Science, 5(5), 827–842. [DOI] [PMC free article] [PubMed] [Google Scholar]
- Schumann CM (2004). The Amygdala Is Enlarged in Children But Not Adolescents with Autism; the Hippocampus Is Enlarged at All Ages. Journal of Neuroscience, 24(28), 6392–6401. 10.1523/JNEUROSCI.1297-04.2004 [DOI] [PMC free article] [PubMed] [Google Scholar]
- Schumann CM, & Amaral DG (2006). Stereological Analysis of Amygdala Neuron Number in Autism. Journal of Neuroscience, 26(29), 7674–7679. 10.1523/JNEUROSCI.1285-06.2006 [DOI] [PMC free article] [PubMed] [Google Scholar]
- Shin LM (2006). Amygdala, Medial Prefrontal Cortex, and Hippocampal Function in PTSD. Annals of the New York Academy of Sciences, 1071(1), 67–79. 10.1196/annals.1364.007 [DOI] [PubMed] [Google Scholar]
- Silverman JL, Yang M, Lord C, & Crawley JN (2010). Behavioural phenotyping assays for mouse models of autism. Nat Rev Neurosci, 11(7), 490–502. doi: 10.1038/nrn2851 Review. [DOI] [PMC free article] [PubMed] [Google Scholar]
- Sokolowski K, & Corbin JG (2012). Wired for behaviors: from development to function of innate limbic system circuitry. Frontiers in Molecular Neuroscience, 5 10.3389/fnmol.2012.00055 [DOI] [PMC free article] [PubMed] [Google Scholar]
- Stroth N, Holighaus Y, Ait-Ali D, & Eiden LE (2011). PACAP: a master regulator of neuroendocrine stress circuits and the cellular stress response: PACAP: neuropeptide stress regulator. Annals of the New York Academy of Sciences, 1220(1), 49–59. 10.1111/j.1749-6632.2011.05904.x [DOI] [PMC free article] [PubMed] [Google Scholar]
- Tootell RB, Reppas JB, Kwong KK, Malach R, Born RT, Brady TJ, … Belliveau JW (1995). Functional analysis of human MT and related visual cortical areas using magnetic resonance imaging. Journal of Neuroscience, 15(4), 3215–3230. [DOI] [PMC free article] [PubMed] [Google Scholar]
- Cox W, Chen R, Glen G, Reynolds R, & Taylor P (2017). FMRI clustering and false-positive rates (Vol. 114). 10.1073/pnas.1614961114 [DOI] [PMC free article] [PubMed] [Google Scholar]
- Waclaw RR, Ehrman LA, Pierani A, & Campbell K (2010). Developmental Origin of the Neuronal Subtypes That Comprise the Amygdalar Fear Circuit in the Mouse. Journal of Neuroscience, 30(20), 6944–6953. 10.1523/JNEUROSCI.5772-09.2010 [DOI] [PMC free article] [PubMed] [Google Scholar]
- Warde-Farley D, Donaldson SL, Comes O, Zuberi K, Badrawi R, Chao P, … Morris Q (2010). The GeneMANIA prediction server: biological network integration for gene prioritization and predicting gene function. Nucleic Acids Research, 38(suppl_2), W214–W220. 10.1093/nar/gkq537 [DOI] [PMC free article] [PubMed] [Google Scholar]