

Abstract
The striatum is the key site for cortical input to the basal ganglia. Cortical input to striatal microcircuits has been previously studied only in the context of one or two types of neurons. Here, we provide the first description of four putative types of striatal neurons (medium spiny, fast spiking, tonically active, and low-threshold spiking) in a single data set by separating extracellular recordings of sorted single spikes recorded under halothane anesthesia using waveform and burst parameters. Under halothane, the electrocorticograms and striatal local field potential displayed spontaneous oscillations at both low (2–9 Hz) and high (35–80 Hz) frequencies. Putative fast spiking interneurons were significantly more likely to phase lock to high-frequency cortical oscillations and displayed significant cross-correlations in this frequency range. These findings suggest that, as in neocortex and hippocampus, the coordinated activity of fast spiking interneurons may specifically be involved in mediating oscillatory synchronization in the striatum.
Introduction
The striatum is the major source of input to basal ganglia networks and receives afferents from nearly all cortical areas (Bolam et al., 2000). The entrainment of striatal neurons to thalamocortical rhythms suggests a high sensitivity of these networks to global forebrain dynamics (Gervasoni et al., 2004). Striatal projection and interneurons recorded from awake rats are entrained by slow-wave, high-voltage spindle and theta oscillations from the cerebral cortex and hippocampus in a topographical manner (Berke et al., 2004; Dejean et al., 2007). Phase locking of single striatal neurons to high frequencies has not been demonstrated (Berke et al., 2004).
Medium spiny neurons (MSNs), the projection neurons of the striatum, are GABAergic and comprise ∼97% of the rat striatum (Rymar et al., 2004). They receive both cortical and thalamic synaptic inputs on the heads of their dendritic spines (Groenewegen and Berendse, 1994; Bolam et al., 2000). The remaining striatal neurons are made up of four different types of aspiny interneurons. “Giant” aspiny interneurons that release acetylcholine are generally agreed to correspond to the tonically active neurons (TANs) recorded extensively in primates in vivo (Tepper and Bolam, 2004). The unique ion channel properties of TANs, as defined in vitro, suggest that these characteristic features of their spike trains could be intrinsically generated (Bennett et al., 2000; Wilson, 2005).
The remaining striatal neurons are GABAergic interneurons that can be differentiated neurochemically. Parvalbumin-positive neurons receive input from diverse cortical areas, suggesting a role in integration of cortical inputs in the striatum (Ramanathan et al., 2002). Electrophysiologically, they resemble the fast spiking interneurons (FSIs) found in the cerebral cortex and hippocampus (Kawaguchi and Kondo, 2002; Somogyi and Klausberger, 2005), where their coordinated activity underlies the entrainment of networks to global low-frequency oscillations and to local high-frequency oscillations (Klausberger et al., 2003; Bartos et al., 2007; Tukker et al., 2007). Although there is evidence that putative FSIs in the striatum are strongly entrained to low-frequency (<10 Hz) cortical oscillations (Berke et al., 2004), it is unclear whether this property is specific to FSIs and whether it also applies to higher frequency activities. Anatomical evidence suggests that the synchronized firing of these neurons could coordinate striatal activity (Kawaguchi, 1993; Ramanathan et al., 2002). GABAergic interneurons without parvalbumin, but expressing neuropeptide Y and somatostatin, can be differentiated electrophysiologically in vitro as they display low-threshold calcium spikes (LTSs) (Tepper and Bolam, 2004). A third type of GABAergic interneuron, expressing the calcium binding protein calretinin, has also not been characterized electrophysiologically in vivo, although there is anecdotal evidence that they may also display LTSs (Tepper and Bolam, 2004).
Here, we demonstrate that extracellular recordings of striatal neurons under halothane anesthesia can be convincingly separated into four putative subtypes. This enables us for the first time to separately analyze and compare their relationship to spontaneously occurring high- and low-frequency oscillations. The results provide strong evidence that putative GABAergic interneurons could control the propagation of oscillations in the corticostriatal pathway.
Materials and Methods
Animal preparation.
The experiments were performed on nine male Brown-Norway rats weighing 200–300 g. Precautions were taken to avoid pain and stress in accordance with the German law for the protection of animals and National Institutes of Health Guidelines on the Care and Use of Laboratory Animals. The animals were kept under controlled environmental conditions (ambient temperature, 20°C; 12 h light/dark cycle). A standard diet and water were allowed ad libidum. After initial anesthesia with ketamine (20 mg/kg, i.p.) and xylazine (5 mg/kg, i.p.), animals were tracheotomized, artificially respirated (70% O2/30% N2O/0.5–1% halothane), and fixed in a stereotactic frame. After trepanation and removal of the dura, the cortex was exposed bilaterally to allow the placement of two hydraulic microdrives (FHC). To ensure stability of anesthesia, electrocardiograms were constantly monitored and all animals were respired at a rate adjusted to maintain an endexpiratory CO2 level of 3.5–4% (small animal ventilator, model 683; Harvard Instruments) as measured by a CO2 analyzer (Capstar 100; CWE). Body temperature was monitored and maintained at 36.5–37.5°C using a homeothermic blanket (Fine Science Tools). Whereas halothane level was kept at 1% during all preparatory manipulations, it was kept constant at 0.5–0.7% throughout the recording sessions. At the end of each experiment, the animals were killed with a lethal overdose of pentobarbital (200 mg/kg, i.p.) and electrolytic lesions (20 μA/20 s) were made to mark the recording sites within the respective target structure. Subsequently, rats were perfused transcardially with saline and then with buffered formalin. To verify the recording locations, fixed brains were sectioned and stained for Nissl and acetylcholinesterase (supplemental Fig. 1A, available at www.jneurosci.org as supplemental material). Pilot experiments were performed under ketamine/xylazine anesthesia (100 mg/kg ketamine/10 mg/kg xylazine) using the procedure, with the exception that the animals were breathing freely. Additional dosages of ketamine were given at regular intervals (every 60–90 min).
Recording and data acquisition.
In each hemisphere, four tungsten electrodes (FHC; impedance, 200–800 kΩ) were independently targeted to the desired recording site. Distances between electrodes varied between 300 and 1000 μm. Recording sites were sensorimotor cortex (Cx) and the caudate–putamen complex (CPu). All striatal cells were recorded from a limited region of the CPu (1.0 mm anterior to 1.5 mm posterior to bregma), on both medial and lateral sides of the striatum (2.5–4.0 mm lateral to bregma). The recording depth varied depending on the desired target structure from 0 to 2.0 mm (Cx) and 2.5 to 6.0 mm (CPu), respectively. Electrodes were left in place for a minimum of 5 min to allow stabilization before recording. Neural activity that could not unequivocally be attributed to either cortex or striatum was not included in this study. During the course of each experiment, neural activity was recorded from two or three different trajectories varying in the rostrocaudal plane.
Additionally, electrocorticographic (ECoG) recordings were performed using two skull screws placed above both ipsilateral and contralateral sensorimotor cortices (2.7–3.0 mm anterior to bregma, 2.0 mm lateral). A reference electrode was placed on the skull 4 mm anterior to bregma. Signals from each electrode were preamplified, amplified and differentially filtered (Multi Channel Processor; Alpha Omega). From the broadband recordings (1 Hz to 5 kHz), we extracted single-cell action potentials (single-unit activity), multiple-unit spike activity (multiunit activity) (both bandpass filtered 500 Hz to 5 kHz), and local field potentials (LFPs) (bandpass filter, 1–100 Hz). Whereas ECoG waves were used as correlates of a coherent synaptic activity in cortical neurons, striatal LFPs were used as such in striatal neurons. In some of the recordings, a notch filter was used to eliminate line noise at 50 Hz, and we therefore consistently excluded the bins at 50 Hz from the spectral analysis of these signals. Additionally, we verified in the ECoG and LFP that potentially induced phase jumps across the notch filter frequency were small (<10°) by estimating the average phase differences between neighboring frequency bins of their Fourier spectrum in nonoverlapping sliding windows of 10 s.
Recordings used for analysis had a minimum length of 184 s (mean, 782 ± 33 s) each with between one and eight recorded single units. Recordings with obvious artifacts were discarded. Bipolar derivations of LFPs were used only when two electrodes were in the striatum of the same hemisphere. Because LFPs were recorded on only two electrodes per hemisphere, some unit recordings did not have a corresponding bipolar LFP. Single units from the same electrode were not used in any correlation-based analysis because of possible shadowing effects (Bar-Gad et al., 2001). Unless stated otherwise, units from both hemispheres were included in all analyses. All data analysis was performed by using Matlab and its Signal Processing Toolbox (Mathworks).
Spike detection and characterization of unit subtypes.
Spike detection was performed off-line by a level crossing algorithm. The threshold value was set sufficiently high above the noise level to avoid artificial triggers by noise peaks (mean threshold ± SD, 7.4 ± 2.7 σ). When possible, multiple single units were separated on the basis of several waveform parameters, including principal components, signal energy, peak time, and other distinguishing features (Offline-Sorter; Plexon). Spike durations were obtained by reading the time difference between cursors placed at the points at which the averaged spike waveform departed and returned to baseline. A mean of 3686 digitized spikes was averaged to characterize the spike waveform for a given cell.
After spike sorting, the width of each phase of each spike was calculated using a peak finding algorithm. Spikes were then clustered using three parameters related to the length of the waveform: the length of the total initial deflections, the length of the valley, and the sum of these two parameters. Similar parameters have been previously used to discriminate putative striatal projection neurons and interneurons (Berke et al., 2004). Clustering was performed using a K-means supervised clustering algorithm and was performed using both a value for each record and for each neuron. As waveform shapes remained highly stable across recordings (i.e., when other electrodes were moved), this made little difference to the result. Final classification used clustering using the individual records, which slightly improved the estimate.
Detection of LTS bursting.
All spike trains were examined for evidence of LTS bursts. To characterize the types of bursts in the data, we used the methods of Jeanmonod and colleagues (Jeanmonod et al., 1996; Sarnthein and Jeanmonod, 2007), which examine three main criteria. In line with these studies, a burst here was defined simply as two or more spikes with interspike intervals (ISIs) of <10 ms. First, a standard ISI histogram for LTS neurons should be bimodal and have a peak <10 ms. Second, the duration of ISI was tested for a positive correlation with the ordinal of the ISI in each burst for bursts of comprising two to five spikes. Third, in the majority of bursts, the second spike should be smaller than the first. If 65% of 50 randomly selected bursts displayed this characteristic, this third criterion was considered to be met. Only neurons that passed all three criteria were considered LTS positive.
Cross-correlation analysis of spike trains.
In recent years, analysis of the oscillatory properties and correlation between multiple neurons is increasingly performed directly in the frequency domain (Rivlin-Etzion et al., 2006; Witham et al., 2007). Here, we chose to analyze unit activity first in the time domain, to avoid the assumption that the correlations between neurons would be oscillatory. To this end, we compared the maximum correlations, number of significant correlations, and the Fourier transform of the cross-correlation to characterize the absolute correlation, the likelihood of correlation, and the oscillatory content of the correlation, respectively.
Raw cross-correlations were calculated for each pair of spike trains and normalized by removing the mean correlation across the lag range. The aim of the analysis was to detect pairs of spike trains in which the number of coincidences and/or oscillatory properties were significantly different than those that would be predicted by the first-order characteristics of the spike train (i.e., rate and interspike interval distribution). To this end, cross-correlations were calculated using surrogate spike trains constructed by globally shuffling the interspike intervals of both neurons and calculating their correlation 1000 times. This produced a null hypothesis distribution for each lag point. The real correlation was then converted to a t score (the number of SDs of the true correlation from the mean of the null hypothesis) that was used as a measure of the correlation strength, as it is dependent mainly on the temporal locking of the two spike trains. The maximum absolute t score within the center of the cross-correlation (0 ± 0.25 s) was used for statistical comparison. The absolute score indicates how strongly the neurons influenced each other, regardless of the sign. A cross-correlation was considered significant at a given lag if it was outside 2 SDs of the null hypothesis (again, significantly positive and negative correlations are grouped together). This criterion was used to construct significance histograms (see Figs. 5–7), which were used to investigate the likelihood of significant correlation between a specific pair type at a given lag.
Figure 5.
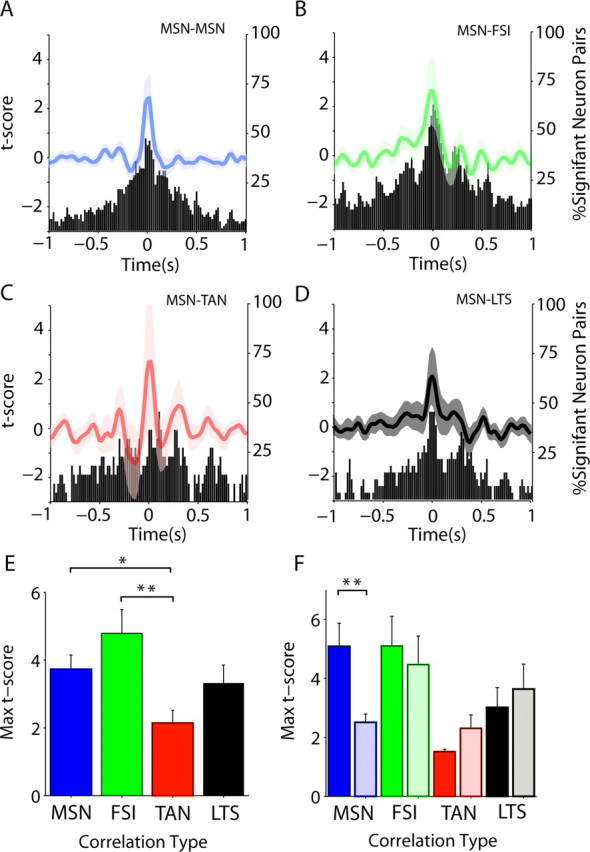
Slow correlation between pMSNs and putative interneurons. Correlation between different putative interneurons and pMSNs was assessed using cross-correlation. For all panels, the color code for pair types is the same: blue, pMSN–pMSN; green, pMSN–pFSI; red, pMSN–pTAN; black, pMSN–pLTS. A–D, The t score is the number of SDs from the surrogate correlation distribution calculated from the same neurons with shuffled interspike intervals. The mean t score for each pair type is shown by the lines (scale on left), with the shaded areas showing the SEM. The histogram shows the percentage of neurons in which 2 SDs were exceeded at a given lag regardless of the sign of the correlation. More significant correlations than would be expected by chance were observed between pMSNs and other pMSNs (A), pFSIs (B), pTANs (C), and pLTS cells (D). E, The maximum t score (between ±250 ms) of the correlation was significantly higher for pMSN–pFSI correlations than for pMSN–pTAN and pMSN–pLTS correlations. F, When the strength of ipsilateral (dark bars) and contralateral (light bars) correlations was compared, only pMSN pairs showed a significant difference with correlations being stronger between ipsilateral pairs. Error bars indicate SEM. Asterisks indicate significance without (*) and with (**) Bonferroni–Holmes correction.
Figure 6.

Low-frequency cross-correlation analysis between pFSIs and putative interneurons. Cross-correlations between different types of putative interneurons showed marked differences. For all panels, the color code for pair types is the same: green, pFSI–pFSI; red, pFSI–pTAN; black, pFSI–pLTS. As in Figure 5, the curves in A, C, and E denote the average t score, and the histogram shows the percentage of neurons in which 2 SDs were exceeded at a given lag regardless of the sign of the correlation. A, Pairs of pFSIs (n = 17) were almost always significantly correlated at zero phase lag and were often highly oscillatory. B, Two types of correlations were observed, demonstrated here by two representative example neurons. The top cross-correlation is slow with some oscillation and was accompanied by slow oscillations in the ECoG (right). The bottom correlation is highly oscillatory at ∼5 Hz and is accompanied by power at the same frequency in the ECoG (right). ECoG in both cases is averaged across the hemispheres. Note that, in both cases, the t score is large and centered on zero. C, The majority of pFSI–pLTS pairs (n = 11) were significant near zero lag but showed little evidence of oscillation. D, Analysis of single pairs shows, however, that these pairs also oscillate depending on the ECoG power (same format as B), albeit less than the FSI pairs. Note that both correlations are centered on zero. E, In contrast, fewer pFSI–pTAN pairs (n = 16) were significantly correlated and those that were exhibited negative and nonoscillatory correlations. F, In six pairs in which there was a significant t score, however, the pattern of correlation was highly uniform with a significant drop in coincidences 200 ms after the firing of the pFSI (the reference). G, The particularly strong 5 Hz oscillations of some pFSI pairs (not observed for other putative interneuron types) was visible in the autocorrelograms of simultaneously recorded putative interneurons (color code as above). H, The maximum t score (between ±250 ms) of the correlation was significantly higher for pFSI–pFSI correlations than for pFSI–pTAN and pFSI–pLTS correlations. pLTS correlations were also significantly stronger than pFSI–pTAN correlations. Error bars indicate SEM. I, FFT of the correlation of the different neuron types confirmed the pFSI pairs were significantly more oscillatory at ∼5 Hz. Asterisks indicate significance without (*) and with (**) Bonferroni–Holmes correction.
Figure 7.

High-frequency cross-correlation analysis between pFSIs and putative interneurons. Correlation analyses in Figure 6 were repeated after high-pass filtering to reveal high-frequency/short timescale correlations. For all panels, the color code for pair types is the same: green, pFSI–pFSI; red, pFSI–pTAN; black, pFSI–pLTS. A, pFSI pairs were also correlated at high frequency (high-pass filter, 30 Hz), which was not apparent in the other correlation types, pFSI with pTAN (B) and pFSI with pLTS (C). D, The strength of the correlation, however, was only significantly different for pFSI–pTAN pairs. Error bars indicate SEM. E, As for slow correlations, however, the high-frequency power was significantly higher for pFSI pairs than for other combinations of neurons types and over a frequency identical with the gamma frequency ECoG and LFPs. F, Gamma oscillation in a single pair of pFSIs in the cross-correlation (top) and its FFT (bottom). Two asterisks indicate significance after Bonferroni–Holmes step down correction.
Correlation strength was calculated in this way for each pair of spike trains using two sets of parameters. To maximize the detection and visualization of low- and high-frequency activities, a 2 s and a 0.2 s window were used, respectively. In cross-correlation-based analysis, large-amplitude common elements at low frequencies tend to dominate (Challis and Kitney, 1990). To test for any correlation between spike trains at higher frequencies, cross-correlations calculated with the smaller window were high-pass filtered at 30 Hz. To smooth the low-frequency activities, a 10 Hz low-pass filter was also used for some analyses. In both cases, a two-pole Butterworth filter was applied. Additionally, the Fourier transform of the higher resolution cross-correlation was used to evaluate the amplitude of oscillations in the correlations. As the Fourier transform (as opposed to windowed power spectral estimate) is vulnerable to outlying values, a multitaper approach, with three tapers, was used to stabilize the estimate. For analysis of low- and high-frequency activity, the center 0.5 and 0.3 s of the cross-correlation were used, respectively. This process was performed on the t score, which ensured that the amplitude of the oscillations in the cross-correlation were the result of temporal correlations above those expected because of the primary spiking statistics.
Unless otherwise stated, statistical comparisons between different putative neuron groups were calculated using Wilcoxon's rank sum test with Bonferroni–Holmes step down corrections for multiple comparisons. For selected analysis, results that were significant without the corrections are indicated with one asterisk and those significant with the correction are indicated with two asterisks (for details, see individual figure legends).
Spectral analysis of LFPs.
For LFPs, all spectral parameters were computed using 0.25 Hz resolution [4040 points/fast Fourier transform (FFT) window] to allow separation of low-frequency activities, and with a Hanning window to prevent spectral leakage. Coherence was computed using the same parameters and the square root of the coherence was Fisher transformed to normalize the variance before any averaging or statistical analysis (Rosenberg et al., 1989). Coherence was calculated between the ECoG and the raw, monopolar LFP and the bipolar derivation of the LFPs in the same hemisphere.
The coherence between the ECoG and the bipolar derivation should provide a measure of coupling relatively free from volume conduction and global noise. However, it is possible that coherence after bipolar derivation could be contaminated by subtraction artifacts or, conversely, underestimates the real coherence. To try to counter these problems, the phase spectra was calculated for the ECoG to each monopolar and bipolar pair, together with 95% confidence limits as described by Halliday et al. (1995). A detailed investigation of the phase relations between cortex and striatum is beyond the scope of this study, as the phase delay is ambiguous in complex systems, unless used together with complementary techniques (Cassidy and Brown, 2003). Therefore, we used confidence limits of the phase spectra to establish the incidence of nonzero phase coupling across the frequency range. By definition, if at a given frequency the number of phase values with confidence intervals excluding 0 and ±180° (which could be attributable to an arbitrary polarity reversal) greatly exceeds 5% (the proportion that would be expected by chance), the data would be incompatible with a situation in which volume conduction or noise are responsible for all of the significant coherence (Magill et al., 2006). In the case of bipolar derivations, these results would also argue against coherence caused by subtraction artifacts (Magill et al., 2006). This was statistically evaluated by using Fisher's exact test to compare the sum of nonzero values across a given frequency bands to the number that would be expected by chance for all the ECoG-striatal LFP pairs within each animal.
To investigate the fundamental frequencies in the ECoG and LFP data, we used the correlation matrix method previously described by Masimore et al. (2004) that has successfully been applied to basal ganglia LFP data (Fogelson et al., 2005; Masimore et al., 2005). Briefly, power spectral parameters were calculated in short time windows (10 s/5 s overlap or 12 s/6 s overlap). The correlation coefficient was calculated for all values across time for each frequency bin against all other frequency bins from 0.5 to 100 Hz with a frequency resolution of 1 or 0.25 Hz to examine high and low frequencies, respectively. Correlations that were not significant after Bonferroni's correction were then set to zero. Significant correlations were separated into positive and negative correlations and Fisher transformed before averaging. Positive/negative separation was performed to clarify visualization and reveal whether there were both positive and negative correlations in different records, which would not be clear after averaging (averaged significant positive and negative correlations could result in a false zero). Correlation matrices for each record were first averaged within animals and subsequently across animals. Correlations therefore had to be highly consistent within and between animals to result in a high coefficient in the final analysis. Correlation matrices provide two types of information. First, patches on the diagonal demonstrate covariation in power over time, indicating that these frequencies form a functional band. Second, significant values outside the diagonal show correlation between the involved bands (for more details, see Results).
Analysis of spike-field phase locking.
Oscillatory modes of field potentials are commonly considered as an indicator of coordinated network dynamics (Elul, 1971; Mitzdorf, 1985; Logothetis and Wandell, 2004). To explore how the spiking activity of identified neurons is related to this rhythmic activity, we evaluated the phase relationship between the ECoG/LFP signal and the spiking activity of single units. To this end, we expanded on current methods originating from phase synchronization analysis (cf. Varela et al., 2001; Friedrich et al., 2004) to study the instantaneous phase of the field potentials at spike times.
ECoG and LFP signals were filtered using a neutral-phase bandpass filter (sixth-order Butterworth), in which the width of each of the 50 defined pass bands (centered on frequencies from 2 to 126 Hz) was chosen as ±15% of the respective center period (exemplified in Fig. 4A for three different frequencies). In a subsequent step, the instantaneous phase of the field potentials was calculated from the analytic signal obtained via the Hilbert transformation (for details, cf. Lachaux et al., 1999; Le Van Quyen et al., 2001). In this formalism, troughs of the LFP correspond to a phase of 180°. The calculation of the analytic signal can be applied to arbitrary signals, but its interpretation as instantaneous phase is difficult if the signal contains time periods in which either the amplitude becomes too small to discriminate the oscillation from background noise, or in which the regular oscillation is disrupted (Boashash, 1992). To account for these effects, we discarded all calculated phase values that violated the monotonicity of the phase time series or exhibited instantaneous phase jumps.
Figure 4.

Phase locking of striatal neurons to ECoG oscillations. A, Sketch of the phase analysis. The raw ECoG signal (left) is filtered separately for different frequency bands, illustrated by three examples on the right. The instantaneous phases at spike occurrences (ticks) are assessed separately for each frequency band. B, Distribution of the mean phases of each neuron showing a nonuniform phase distribution (p = 0.05, Rayleigh's criterion) at a filter center frequency of 3.1 Hz (cutoff at 2.7 and 3.6 Hz). Here, and in the following panels, the distributions are shown separately for neurons classified as pMSN, pFSI, pTAN, and pLTS. C, Relative number of significantly (p = 0.05) locked neurons using the Rayleigh (red curve) and surrogate (gray histogram) criteria for significance evaluation, resolved by the filter center frequency. The expected percentage of false positives of 5% is indicated by the dashed lines. D, Frequency-resolved phase distributions computed from all spikes recorded from neurons that exhibited a nonuniform phase distribution (p = 0.05, Rayleigh's criterion). The color code of each graph is chosen to maximize the contrast by mapping maximum and minimum values to the same color in all graphs (red and blue, respectively). The absolute values for each graph can be read from the color bar on the right. For each frequency, the phase distribution was normalized to its sum across the 50 bins of the vertical phase axis, such that a flat distribution would show a probability of 0.02 per bin (marked by a black line in each color bar). Results are displayed for frequencies, in which >10% of neurons locked to the ECoG (compare C, red curve). E, Consistency of phase across neurons. Frequency-resolved estimate of the variability of the mean phase across neurons measured by its circular SD. Low values of this measure indicate consistency of the mean phase across neurons. As in D, for each frequency only neurons with a nonuniform phase distribution enter the analysis, and results are displayed for a minimum of 10% of the neurons showing such locking. F, Variability of locking strength across neurons. Histogram of the circular SDs of the phase distributions of each neuron resolved by frequency. Colors indicate counts per bin; their mean is indicated by a white curve. In contrast to D and E, all neurons enter the distribution regardless of whether they exhibit a nonuniform phase distribution.
We then analyzed the distributions of extracted phase values (Denker et al., 2007) using tools from circular statistics (Mardia and Jupp, 2000). In particular, we obtained the mean phase φ of the circular average,
 |
where φ(ti) indicates the phase of the field potential at time ti of spike i. In addition, we used the transformation of the vector strength R to the circular SD
 |
as a measure of the concentration of the phase distribution. For small values of σ, this measure relates to the SD of a normal distribution, whereas for flat distributions σ→∞.
We quantified whether the spikes recorded from each neuron showed a significant phase preference using two distinct criteria. First, we tested against the null hypothesis that the phase sample was taken from the uniform circular distribution (Rayleigh's test), which would be expected assuming a regular (e.g., filtered) field potential and an independent spike train with a Poisson spiking statistics. However, deviations from this assumption toward more regular spike trains as observed in this study could impose a certain degree of chance locking between the two signals. To examine whether phase distributions showed a stronger phase preference than expected given their underlying spiking statistics, we tested the measured value of the vector strength R against the distribution of R obtained from 1000 surrogates constructed from the original data. For each surrogate, we locally shuffled the interspike intervals of the recorded spike train in nonoverlapping windows of 10 s, while keeping the field potential trace unchanged. By doing so, we aimed to destroy the phase relation to the field potential, while retaining to first order the regularity of the spike train and respecting the overall rate profile. Unless otherwise stated, we say that a neuron has a nonuniform phase distribution if it passes the first criterion based on the Rayleigh's test, and that it is locked with respect to the surrogates if it passes the second, more restrictive criterion.
Results
Detection of low-threshold spike bursts allows separation of putative parvalbumin-negative GABAergic interneurons (pLTS)
LTS bursting is a common feature of thalamic neurons during sleep (Llinás and Steriade, 2006) and can be reliably detected in extracellular recordings (Jeanmonod et al., 1996; Lacey et al., 2007). In vitro recordings have shown that, in the striatum, only parvalbumin-negative GABAergic interneurons display LTS bursting in response to current injection (Tepper and Bolam, 2004). Figure 1, A–D, shows an example of a single neuron displaying all the key features of LTS bursting. These include a bimodal ISI histogram with a peak <10 ms, a positive correlation between the ISI and ordinal of the ISI in the burst, and a negative correlation between the first ISI and the size of the burst. In total, 15 neurons (21 recordings) in the sample matched the two key markers of LTS (i.e., an increase in ISI with the ordinal of the spike in the burst and a significant number of ISIs <10 ms). Figure 1, E and F, shows that these properties were highly consistent within the LTS-positive population. In addition, these neurons had a high percentage of bursts with a smaller second spike than the first (83 ± 10% SD). LTS-positive neurons were recorded in five of nine animals across a range of depths. These LTS-displaying neurons were considered to be putative parvalbumin-negative GABAergic interneurons (pLTS). Recordings of pLTS, and all other neuron types, were highly stable across hundreds of seconds (supplemental Fig. 1C, available at www.jneurosci.org as supplemental material), and bursts were therefore unlikely to be the result of injury discharge or other phenomenon related to recording conditions.
Figure 1.

LTS bursting in striatal neurons under halothane anesthesia. A–D, Burst and interspike interval analysis of a putative parvalbumin negative interneuron displaying LTS bursts. A, Interspike interval histogram of a single LTS-positive neuron. Note the bimodal distribution with a peak <10 ms. The inset shows an example of a single burst from this neuron. B, The ISI return plot of the same neuron shows asymmetry at the diagonal <10 ms showing that the interburst interval is not constant. This is elaborated in C, which demonstrates that the interspike interval positively correlates with its ordinal in the burst shown for bursts consisting of up to five ISIs. D, The length of the first interspike interval decreases together with the number of spikes in the burst. E, F, Plot of the mean ordinal (E) and ISI histogram (F) showing that these features are consistent in all the neurons demonstrating LTS bursting. The shaded areas in F show the SEMs across neurons.
Clustering of unit waveforms allows separation of three unit subtypes verified by physiological criteria
Previous studies have described the different waveform properties of different striatal neurons that have been subsequently labeled (Wilson et al., 1990; Kawaguchi, 1993; Mallet et al., 2005). We plotted three waveform parameters from all recorded neurons: the peak, initial first deflections, the valley and the sum of the two. These parameters yielded three clusters, which could be clearly separated by a supervised clustering algorithm (Fig. 2A). The long waveforms (red) of one of the clusters correspond to previous descriptions of giant cholinergic interneurons, often called TANs, and we therefore consider these cells to be putative neurons of this type (pTANs). Conversely, waveforms in the cluster with the shortest waveforms (green) match descriptions of parvalbumin-positive GABAergic interneurons, putative fast spiking interneurons (pFSIs). The majority of neurons had a waveform between these two extremes, conforming to previous reports of medium spiny projection neurons (pMSNs). The vast majority of waveforms for pLTS neurons were found in the central pMSN cluster, consistent with previous reports that their waveform is longer than FSIs (Kawaguchi, 1993) (Fig. 2A, inset). One pLTS waveform was in the pTAN cluster, but lacked the distinctive shape seen in the majority of pTAN waveforms (Fig. 2A). As there are no reports of LTS bursting in TANs, this may have been attributable to the electrode being particularly close to the soma (Gold et al., 2006), as indicated by the high signal-to-noise ratio in the recordings of that neuron. The consistency of the waveform shape across long periods of time (600–1500 s) could be clearly demonstrated in individual examples of each putative subtype in different animals (supplemental Fig. 2, available at www.jneurosci.org as supplemental material).
Figure 2.
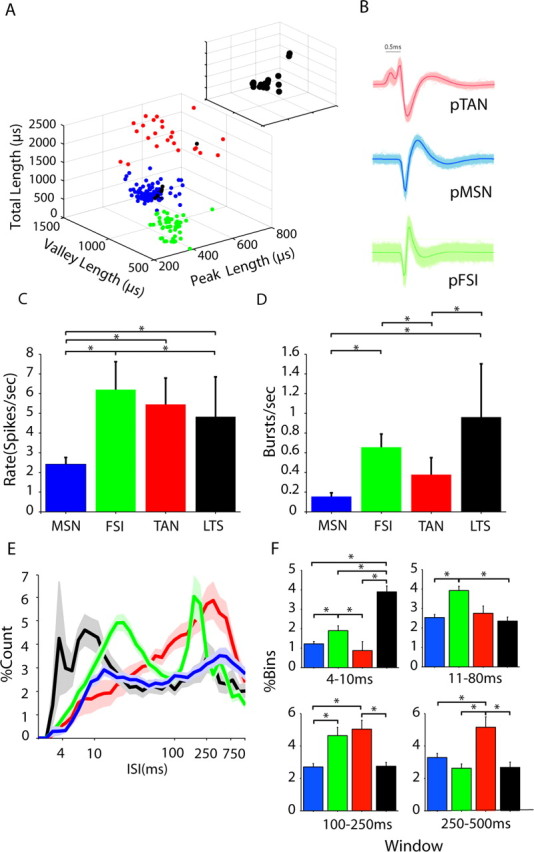
Separation of striatal neuron subtypes based on waveform parameters and LTS bursting. A, The parameters of mean waveforms for each neuron were plotted against each other, revealing three clear clusters, which were verified using a clustering algorithm. B, The clusters corresponded to three types of waveforms, which could be distinguished by eye after sorting. Long waveforms (red cluster/waveform) and very short waveforms (green cluster/waveform) correspond to previous descriptions of cholinergic neurons, usually referred to as tonically active neurons (pTANs) and parvalbumin-positive GABAergic interneurons, usually referred to as fast spiking interneurons (pFSIs), respectively. The majority of neurons had a waveform between these two extremes (blue cluster/waveform) and were thought to be putative medium spiny projection neurons (pMSNs). With one exception, all of the neurons identified as LTS positive (black spheres) were in this middle cluster (A) and are also shown separately (inset). C, D, Histograms of the rate and burstiness of putative neurons; color codes are as above. C, The rate of all putative interneuron types was significantly higher than that of the pMSNs. D, pLTS units had a significantly larger burst rate than all other putative neuron types. In addition, pFSIs were burstier than pTANs and pMSNs. E, The normalized interspike interval histograms averaged across all putative neuron types showed clear variations between the subtypes. F, LTS neurons had significantly more ISIs <10 ms than any other type. In the other time windows analyzed, there were significant differences between all putative subtypes. Error bars indicate SEM. Asterisks indicate significance with Bonferroni–Holmes correction.
The second step was to verify the separation using known physiological properties of the neurons that are independent of waveform and LTS-related parameters. The mean rate of the pMSNs was significantly lower than all other putative subtypes (Fig. 2C, Table 1). In addition, pFSIs had a significantly higher rate than pLTS cells. Both pLTSs and pFSIs had more bursts per second than pMSNs and pTANs using the burst criteria applied for LTS analysis (Fig. 2D, Table 1). The mean firing rate of the pFSIs (∼6 spikes/s), although on first reflection seems low, is faster than that observed in histologically identified FSIs recorded under ketamine anesthesia (Mallet et al., 2005) and within the range seen in the awake animal (Berke et al., 2004). Finally, the normalized interspike interval histogram was compared using four different windows (4–10, 11–80, 100–250, 251–500 ms). Clear differences could be seen in the profile of the ISI histogram for each putative subtype (Fig. 2F, Table 2). The ISI histogram for pTANs was unimodal with a clear peak ∼250 ms, consistent with a regular firing rate of 4–5 Hz as previously described in several preparations (Aosaki et al., 1995; Bennett et al., 2000; Apicella, 2007). In contrast, pFSIs consistently had a bimodal distribution suggestive of bursting with a longer interburst interval compared with LTS neurons with a peak at ∼20 ms, consistent with subsequently labeled recordings under ketamine (Mallet et al., 2005) (Fig. 2D). In vitro studies have led to the suggestion that this is the likely firing pattern for FSIs in vivo (Tepper and Bolam, 2004). Significant differences were found between all combinations of putative neurons in at least one of these windows (Fig. 2D, Table 2).
Table 1.
Statistical comparisons of rate and burst parameters
| Cell type | pFSI | pTAN | pLTS | |
|---|---|---|---|---|
| Rate | pMSN | p < 0.0001 | p < 0.0001 | p < 0.02 |
| pFSI | NS | p < 0.01 | ||
| pTAN | NS | |||
| Burst (10 ms ISI) | pMSN | p < 0.0001 | NS | p < 0.00001 |
| pFSI | p < 0.0046 | p < 0.005 | ||
| pTAN | NS |
Significance is noted only after Bonferroni–Holmes correction within each parameter.
Table 2.
Statistical comparisons of normalized ISI histogram
| Time window | Cell type | pFSI | pTAN | pLTS |
|---|---|---|---|---|
| 4–10 ms | pMSN | 0.0230 | NS | <0.0001 |
| pFSI | 0.0030 | 0.0001 | ||
| pTAN | 0.0004 | |||
| 10–80 ms | pMSN | 0.0000 | NS | NS |
| pFSI | NS | 0.0001 | ||
| pTAN | NS | |||
| 100–250 ms | pMSN | 0.0007 | 0.0002 | NS |
| pFSI | NS | NS | ||
| pTAN | 0.0032 | |||
| 250–500 ms | pMSN | NS | 0.0111 | NS |
| pFSI | 0.0034 | NS | ||
| pTAN | 0.0043 |
ISI histograms were calculated between 1 and 912 ms and normalized. Significance is noted only after Bonferroni–Holmes correction within each window.
Halothane anesthesia leads to multiple interrelated oscillatory activities
Spontaneous population activity in cortex and striatum, in the form of LFPs and ECoGs, has been extensively characterized under urethane and/or ketamine/xylazine anesthesia, but far less so using volatile anesthetics. We observed spectral properties of these population signals under halothane that markedly differed from those reported under ketamine-based anesthesia. Power spectra from striatal LFPs and ECoG displayed prominent peaks in the delta range (2–4 Hz) and the gamma range (40–80 Hz), which were highly consistent across animals (Fig. 3A–C). Both peaks were reduced, but clearly present in the bipolar derivations of both the striatal LFP power and the coherence between the ECoG and striatal LFP, suggesting that they were not the result of volume conduction between the two structures (Fig. 3A–C). This was supported by analysis of the phase spectra, which demonstrate that, even in the monopolar case, the percentage of coherence values with nonzero phase was well above chance across the frequency range from 1 to 100 Hz (supplemental Fig. 4, available at www.jneurosci.org as supplemental material). The bands with the highest monopolar coherence, 2–4 and 40–80 Hz (excluding 48–52 Hz, which could be affected by line noise), had the largest percentage of nonzero phase delays (∼60–70%), suggesting that the frequencies with the highest coherence were attributable to neuronal interaction and not volume conduction, which would be expected to have a delay incorporating 0° or ±180°. For ECoG and bipolar-LFP pairs, the distribution of nonzero coupling was more evenly distributed across the frequency spectra, as previously shown for similar data (Magill et al., 2006). At these frequency ranges, the sum of nonzero values was significantly above that expected by chance for both monopolar and bipolar pairs within each individual animal (Fisher's exact test, p < 0.0001).
Figure 3.
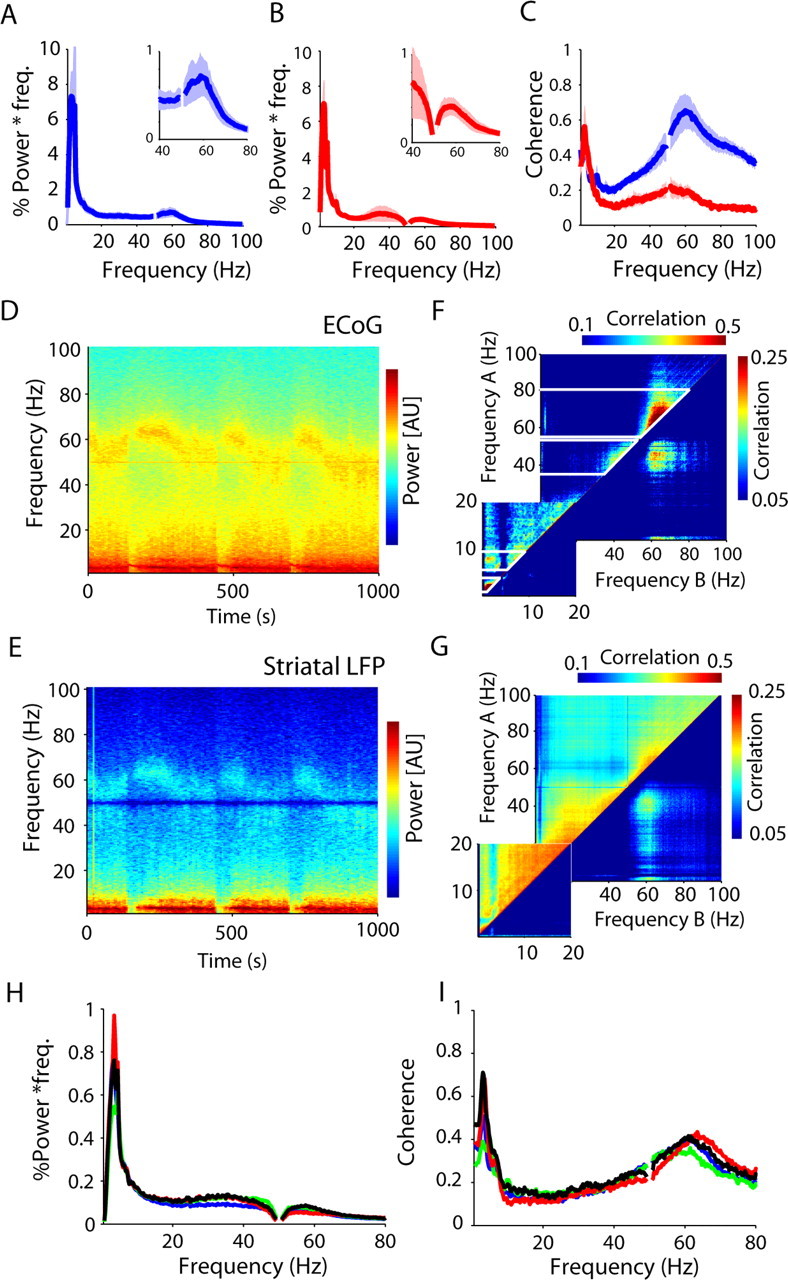
Spontaneous corticostriatal population activity under halothane anesthesia. A, B, The power spectra of the ECoG (A) and striatal LFP (B) have two prominent peaks at low (∼4 Hz) and high frequencies (40–75 Hz). C, These activities are coherent between the structures whether using the monopolar (blue) or bipolar (red) striatal LFP. The shaded areas show SEMs across animals. D, E, Time–frequency analysis of power in the cortex (ECoG; top) and striatum (LFP; bottom) reveals that these peaks are often composed of more focal activities that wax and wane over time. F, G, The relationship across frequency bins can be described using correlation matrices in which the Pearson correlation coefficient is calculated for the fluctuations in power over time for each frequency with all other frequencies between 0.5 and 100 Hz. Hence the diagonal (each frequency correlated with itself) is always 1. The matrices show separately the positive correlations above the diagonal (top) and the absolute value of negative correlations below the diagonal (note that positive and negative correlations are coded by two distinct color scales). Patches above the diagonal show neighboring frequencies that covary over time and can therefore be considered as bands (marked by the white lines). Patches off the diagonal indicate positive and negative correlations between those bands. The matrix for the ECoG shows two individual bands between 35–55 and 60–80 Hz. Activity is negatively correlated between these two frequency ranges within the gamma band. H, I, The mean bipolar LFP power (H) and coherence (I) between the ECoG and LFP showed were similar between recordings containing each neuron type (blue, pMSN; green, pFSI; red, pTAN; black, pLTS).
Spectral analysis of large data segments can mask fluctuations in dominant frequencies over time (Fig. 3D,E). To analyze such temporal relationships, we used a correlation matrix approach (Fig. 3F,G), which has been previously used to reveal interfrequency relationships in corticobasal ganglia networks (Masimore et al., 2004; Fogelson et al., 2005). The correlation matrix uncovers two pieces of information. First, continuously significant bins around the diagonal show frequencies that covary over time. The matrix for cortical ECoG shows discrete bands in the lower frequencies at 2–4 and 5–9 Hz, and at high frequencies between 35–55 and 60–80 Hz (marked on Fig. 3F). The matrix for striatal LFP is very similar, although there is also a clear band around beta frequencies (10–30 Hz) that is not a prominent feature in the cortex. Second, significant frequencies outside the diagonal show either positive or negative correlations between those bands identified on the diagonal. These will not be discussed in detail here, but we point out that the two prominent frequency ranges within the gamma band (35–55 and 56–80 Hz, respectively) are anticorrelated in their power, providing additional evidence that they originate in discrete activities.
A central aim of this work was to compare the oscillatory correlation between different unit subtypes. This comparison would be more meaningful if the oscillatory conditions at the level of the cortical and striatal population were not significantly different during the recording of the different neuronal types. To this end, the power and coherence of the different recordings was compared in the frequencies identified by the correlation matrices based on which units were in each recording [delta (2–4 Hz), theta (5–9 Hz), low gamma (40–55 Hz; excluding 48–52 Hz, which could be affected by line noise), and high gamma (56–80 Hz)]. After Bonferroni–Holmes correction for number of frequency band comparisons, no significant difference was found in the normalized ECoG power or monopolar striatal LFP in any frequency range (p > 0.05). There was also no difference in the normalized bipolar LFP power, arguably the most accurate measure of the population activity in the striatum, without any correction for multiple comparisons (Fig. 3H) (rank sum test, p > 0.05). Finally, no significant difference was found in the coherence between ECoG and striatal monopolar and bipolar LFPs (Fig. 3I). It therefore seems reasonable to conclude that differences between the oscillatory properties of different neuron subtypes were unlikely to reflect global state changes that can be caused by factors such as variations in the level of anesthesia across different recordings.
Phase locking of striatal neurons to cortical oscillations
We examined the phase relationship between the spiking activity of individual neurons and the oscillatory ECoG dynamics (Fig. 4A). For each neuron, we extracted the instantaneous phase at the time of spike occurrences and calculated its mean. Figure 4B shows the distributions of mean phases of the population of neurons that showed a significant nonuniform phase distribution (p < 0.05). Results are separated by the putative neuronal subtype, and relate to the low delta frequency band. At this frequency, all neuron types showed a strong tendency to spike shortly after the peak of the ECoG oscillation cycle, regardless of the strength of the observed phase locking. For the putative GABAergic interneurons, pFSI and pLTS, a majority of neurons favored a mean spiking phase that was slightly advanced by ∼20–30° from that of either pMSNs or pTANs, although significance of this finding could not be established because of the small sample sizes.
We quantified the relative number of neurons that were locked to the ECoG as a function of frequency using two distinct criteria. In a first step, we tested against the null hypothesis that the phase sample was taken from the uniform circular distribution (Rayleigh's test), which would be expected assuming a regular LFP and an independent spike train with a Poisson spiking statistics (Fig. 4C, red curve). We observed that, for each of the neuronal subtypes, 60–80% of the respective neurons showed significant phase locking to the low-frequency component with a peak at 4 Hz. In addition, pMSN, pTAN, and pLTS exhibited a second smaller peak at ∼8 Hz (pFSI, 11 Hz). Moreover, pFSIs showed significant locking at two frequencies not observed for the other neuron types, identified by a small peak at ∼15 Hz and strong component (46%) in the lower gamma band at ∼35 Hz. For all other neuron types, the number of neurons with a significant phase preference at gamma frequencies was only found at chance level (5%, as indicated by the dashed line in Fig. 4C showing the expected percentage of false positives).
In a second step, we accounted for chance locking caused by potential regularity of the spike trains by testing the strength of observed phase locking against surrogates derived by local shuffling of the ISIs (for details, see Materials and Methods). We observe a similar percentage of significantly locked neurons (Fig. 4C, gray histograms) as for Rayleigh's test (red line), excluding the possibility that the observed locking is a trivial consequence of the underlying spike train statistics.
In Figure 4D, we show the corresponding phase distributions constructed from all spikes for each frequency, in which the percentage of locked neurons exceeded 10% using the test of nonuniformity (compare Fig. 4C, red curves). For low frequencies, all neuron types have comparable phase distributions related to the peaks indicated above. Although these phase distributions for the delta band frequencies significantly differed in mean and/or variance for all subtype comparisons (Mardia–Watson–Wheeler test, p < 0.01), they did not provide a clear criterion for the separation of the neuronal subtypes. The exceptional locking of pFSI in the gamma range is associated with a weakly modulated phase distribution. The reason for the broadening of the population-averaged phase distribution is twofold: First, the mean phases across individual pFSI neurons were less consistent than observed for other frequencies in which neurons exhibited phase locking (Fig. 4E). Second, phase distributions obtained from each neuron were less concentrated compared with those found in the delta range (Fig. 4F). In conclusion, we observed strong and similar locking of all neuronal subtypes to the delta frequency band of the ECoG, but pFSIs in addition expressed locking in the low gamma frequency band in nearly one-half of all observed neurons.
To complement these findings, we repeated the previous analysis in which the reference signal was replaced by an LFP recording (excluding the electrode used to record spiking activity). We obtained similar results (data not shown), but note two major differences: the preferred phase consistently differed from that obtained for the ECoG independent of the neuronal subtype, and was approximately shifted by 180°. Furthermore, we observed that the frequency range in which significant locking of pFSI neurons to gamma oscillations is observed, increased to include also higher gamma frequencies than 60 Hz. The exclusive entrainment of the class of pFSI to gamma frequency oscillations in both types of field potentials provides evidence that activity of pFSI neurons is tightly related to cortical and striatal oscillations in this frequency range.
pMSNs correlate more strongly with putative GABAergic interneurons than pTANs
Cross-correlations were computed between pMSNs and all simultaneously recorded single neurons not recorded on the same electrode (Fig. 5A–D). All pair types had more significant correlations than would be expected by chance (5%), with the most correlations occurring around zero lag (Fig. 5A–D, histograms). The strength of connectivity between different neuron types was assessed by comparing the maximum t scores (the number of SDs from the surrogate null hypothesis) for each pair type (Fig. 5E). pMSNs were significantly more correlated with pFSIs (n = 59) than pTANs (n = 20; p < 0.004). They were also more correlated with themselves (n = 80; p < 0.04), although this was not significant after correction for multiple comparisons. pMSNs–pMSN pairs were the only type to show a significant difference between ipsilateral (n = 38) and contralateral (n = 42) pairs (p < 0.0004), indicating that pMSNs were more correlated if they were in the same hemisphere (Fig. 5F). In contrast, differences between pMSN and putative interneuron pairs were not significant. Low-frequency correlations between pMSNs, pFSI, and pLTS neurons could be clearly observed in raw examples (supplemental Fig. 5, available at www.jneurosci.org as supplemental material). Together, these results indicate that the locality of neuron pairs affected correlation between the putative projection neurons more than the correlation between projection and interneuron.
As all pair types showed some evidence of oscillation, we then compared the amplitude of the cross-correlations at the low frequencies in the ECoG/LFP signals (Fig. 5A–D). In all low-frequency ranges, the amplitude of the cross-correlation between pMSNs and pFSI or pLTS neurons was significantly higher than for pMSN–pTAN pairs (Table 3). pMSN–pFSI pairs where also more significantly correlated than pMSN–pMSN pairs in the lowest range. In the 5–9 Hz range, the amplitude of pMSN–pLTS was also significantly greater than pMSN–pMSN correlations. In summary, pMSNs showed the highest correlation between themselves and putative GABAergic interneurons. Correlations between putative projection and GABAergic interneurons were oscillatory, whereas those with pTANs were usually not.
Table 3.
Statistical comparisons of low-frequency power in pMSN cross-correlations
| Correlation type | 0–2 Hz | 2–4 Hz | 5–9 Hz |
|---|---|---|---|
| pMSNpMSN/pMSNpFSI | p < 0.0005 | NS | NS |
| pMSNpMSN/pMSNpTAN | p < 0.008 | p < 0.007 | p < 0.002 |
| pMSNpMSN/pMSNpLTS | NS | NS | p < 0.01 |
| pMSNpFSI/pMSNpTAN | p < 0.00001 | p < 0.0033 | p < 0.005 |
| pMSNpFSI/pMSNpLTS | NS | NS | NS |
| pMSNpTAN/pMSNpLTS | p < 0.00005 | p < 0.02 | p < 0.0001 |
Pilot recordings under ketamine anesthesia showed that striatal neurons could also be differentiated by waveform and were strongly correlated when recorded using another anesthetic preparation (supplemental Fig. 3, available at www.jneurosci.org as supplemental material).
Correlated activity is stronger between pairs of pFSIs than between pFSIs and other putative interneurons
More dramatic differences were observed in correlations between putative interneurons. pFSI pairs were often highly oscillatory across the whole lag range, and the phase of the oscillation at ∼5 Hz was consistent enough to accumulate in the mean (Fig. 6A). Closer examination of individual pairs revealed that correlations were observed both at very low frequencies (Fig. 6B, top left) and at 5 Hz (Fig. 6B, bottom left), but that in both cases the correlation was extremely strong and centered around zero. The frequency of the correlation matched the dominant power in the ECoG (corresponding panels to the right). Correlations between pFSIs and pLTS neurons were also common around zero lag (75% pairs) (Fig. 6C). Strong low-frequency correlations between pLTS and pFSI cells could be clearly observed in raw cross-correlation histograms (supplemental Fig. 5, available at www.jneurosci.org as supplemental material). As with pFSI pairs, analysis of single pairs showed similar low and 5 Hz correlation as pFSI pairs, which matched the dominant frequency in the ECoG power (Fig. 6D).
pFSIs were correlated both with themselves and pLTS neurons significantly more than with pTANs (p < 0.0003; p = 0.05) (Fig. 6H). Although strong correlations could be found between pFSIs and pTANs, they were clearly different in nature. Although the majority of putative GABAergic interneuron correlations were significantly positive around zero lag, the significant pFSI–pTAN correlations were negative with a positive latency when the pFSI was the reference (Fig. 6E,F). Despite the similar lag and oscillation of pFSI–pFSI and pFSI–pLTS correlations, pFSI–pFSI pairs were more correlated than pFSI–pLTS pairs (p = 0.03) (Fig. 6G), although this was not significant after correction. A large peak in the amplitude of the cross-correlation was observed between pFSI pairs at ∼5 Hz and the amplitude of the cross-correlation significantly greater in the 5–9 Hz range than for pFSI–pTAN pairs (Fig. 6H, Table 4). Although the amplitude in this range was not significantly greater than for pFSI–pLTS pairs, single examples could be demonstrated in which a pFSI followed this frequency, whereas pLTS neurons did not (Fig. 6G), and pFSIs showed a uniquely strong relationship to cortical oscillations at this frequency over time (see below) (see Fig. 8). Differences between pFSI–pFSI and pFSI–pTAN pairs could also be seen in relation to oscillations of different frequencies that could be observed in single recordings (supplemental Fig. 6, available at www.jneurosci.org as supplemental material).
Table 4.
Statistical comparisons of low-frequency power in putative interneuron cross-correlations
| Correlation type | 0–2 Hz | 2–4 Hz | 5–9 Hz |
|---|---|---|---|
| pFSIpFSI/pFSIpTAN | p < 0.0004 | NS | p < 0.002 |
| pFSIpFSI/pFSIpLTS | p < 0.02 | NS | NS |
| pFSIpTAN/pFSIpLTS | p < 0.03 | NS | p < 0.001 |
Figure 8.

Oscillations in single and coupled pFSI firing are strongly related to those in the cortical ECoG over time. Ai, The autocorrelation of an ECoG channel plotted over 150 s. The color scale shows the movement of the lag of the peaks and troughs of the prominent 5 Hz oscillation. Aii, Aiii, The autocorrelograms of two concurrently recorded pFSIs also have clear 5 Hz oscillations and show the same small deviations in frequency over time, which are also seen in the cross-correlation of the same units (Aiv). Bi, The time–frequency plot of an ECoG channel over 700 s shows characteristic transitions in both low and high frequencies (20 s windows). The rate of a single pFSI (superimposed white line) is elevated only during the transition periods. Bii, Gamma oscillations are present in the FFT of the autocorrelation of the pFSI in these periods. Ci, The rate of two pFSI neurons during an 800 s period with stable 5 Hz oscillations. Cii, The time–frequency representation of the ECoG during this period displays fluctuations in gamma oscillations. Ciii, The amplitude of the cross-correlation in the frequency domain of the two FSIs display gamma oscillations during these periods, which can also be seen in the filtered cross-correlation (Civ).
After filtering of low frequencies, only pFSI–pFSI correlations showed convincing evidence of high-frequency oscillations (Fig. 7A–C). The absolute correlation was significantly different between pairs of pFSIs than pFSI–pTAN pairs (Fig. 7D). The amplitude of the t score between 35 and 70 Hz for pFSI pairs was significantly higher than for correlations between pFSIs and pTAN (p < 0.015) or pLTS (p < 0.03) cells (Fig. 7E), and large gamma oscillations could be clearly observed in individual pFSI pairs (Fig. 7F; supplemental Fig. 6, available at www.jneurosci.org as supplemental material). The relationship between FSIs with themselves was, therefore, notably stronger than with other interneurons on both slow and fast timescales.
The oscillatory behavior of pFSIs is strongly related to cortical oscillations
As demonstrated by the phase-locking analyses, pFSIs had a particularly strong relationship to cortical oscillations. We explored this further by looking at the dynamic relationship between pFSI pairs and cortical oscillations at different frequencies. During periods of highly synchronized cortical activity in the theta range (Fig. 8Ai), the oscillation frequency changed by small graduations (0.25–0.5 Hz) over time. Individual pairs of pFSIs could follow these small changes remarkably closely (Fig. 8Aii–Aiv). In several recordings, the firing of pFSIs appeared to be highly related to periods in which the ECoG activity was dominated by this theta-like activity and the peak frequency of gamma oscillations was in transition (Fig. 8B). During these transition periods, the autocorrelation of pFSIs displayed gamma oscillations. In other recordings, in which 5–9 Hz activity was sustained, the cross-correlation of pFSIs had power at the gamma frequency during periods of higher gamma power (Fig. 8C). Together, these results suggest that coordinated activity of these pFSIs could propagate high and low cortical rhythms to the striatum.
Discussion
These results provide the first simultaneous identification and analysis of four putative subtypes of striatal neurons in a single data set and the first evidence that the subtypes differ significantly in their phase locking to cortical population oscillations. The magnitude and rhythmicity of correlations between different neuronal subtypes varies systematically with neuron type. In particular, the majority of pFSI neurons are locked to fast cortical oscillations, and a large percentage of pFSI pairs are correlated at high frequency.
It is important to address the limitations of the methodology used here. First, there is a limit to the extrapolation of findings under halothane anesthesia to the awake animal. In practical terms, halothane enabled a high level of stability that allowed us to record relatively stationary neuronal activity over long periods of time, aiding both spike sorting and data analysis. As with other anesthetics, the exact mechanism of action of halothane is unknown; however, the major frequencies observed are consistent with those previously described in the cortex of halothane-anesthetized rats (Berridge and Foote, 1991; Berridge et al., 1996; Imas et al., 2004). Halothane is also known to block gap junctions (Johnston et al., 1980), which simplifies the interpretation of the cross-correlation results (see below). In terms of how this compares to the state-related oscillatory activity in the awake animal, low-frequency oscillations (<4 Hz) are found only during sleep (Steriade, 2000). Despite this, the high level of synchronization during slow oscillations provides a highly useful tool for looking at neuronal interactions between the basal ganglia and cortex (Stern et al., 1998; Mahon et al., 2001; Berke et al., 2004), which can be predictive of higher frequency activities at the single-neuron level (Mallet et al., 2008). With this in mind, it is important to note that theta and gamma activities over a similar frequency range are a prominent feature in the striatum of awake rat (Berke et al., 2004; Tort et al., 2008). Therefore, although we cannot rule out the possibility that the choice of anesthetic influenced certain parameters, such as the proportion of each neuron type recorded, the majority of our findings regarding the temporal relationships of different neurons to each other and to cortex raise specific hypotheses about those relationships during those activities in the awake animal.
Second, how sure can we be that the putative neuronal subtypes described here belong to those different populations? Ideally, recorded neurons would be labeled and identified histologically using the juxtacellar method, which has been used to investigate the relationship of specific neuron types to network oscillations in hippocampus, cortex, and thalamus (Klausberger et al., 2003; Tierney et al., 2004; Lacey et al., 2007). However, to study the large numbers of simultaneous pairs of single neurons (>200) described here, it becomes essential to use a different method. Using waveform parameters to separate neurons has proved a valuable technique for separating neurons (Csicsvari et al., 1999; Constantinidis and Goldman-Rakic, 2002; Mitchell et al., 2007). The waveform characteristics of our pFSIs and pTANs match those of labeled parvalbumin-positive GABAergic interneurons (Kawaguchi, 1993; Mallet et al., 2005) and giant cholinergic neurons (Wilson et al., 1990), respectively. This approach demands care to circumvent several potential sources of error. Most obviously, it relies on high-quality spike sorting to produce an average waveform that truly reflects a single neuron. Although it is common to use tetrodes for this purpose (Berke et al., 2004; DeCoteau et al., 2007), the electrodes used here gave excellent results and enabled us to identify more types of striatal neurons than previous studies. The shape and length of the waveform are to some extent a function of the position of the electrode in relation to the neuron (Gold et al., 2006, 2007). To address this issue, we used several physiological parameters to convincingly verify the separation of units. Regarding pLTS neurons, we provide the first description of low-threshold spike bursts in the striatum in vivo. There is no evidence to suggest that MSNs, FSIs, or TANs display LTS bursts. Therefore, based on in vitro studies (Kawaguchi, 1993), it seems most likely that pLTS neurons correspond to the subpopulation of GABAergic interneurons expressing neuropeptide Y and somatostatin. Because of the limited descriptions of calretinin expressing GABAergic interneurons, however, we cannot rule out the possibility that they neurons may also correspond to this type. Despite the considerable electrophysiological evidence presented here, this putative separation will need to be verified using histological methods.
Third, it is important to evaluate the analytical methods used here. A significant cross-correlation between two neurons does not necessarily reflect direct synaptic connectivity (Nowak and Bullier, 2000). Indeed, it is highly unlikely that many of the neurons in this sample were monosynaptically connected, given that most were recorded from electrodes ∼0.5 mm apart. Rather than representing specific synaptic connections, the correlations seen here are more likely to reflect the locking to cortical population activity. It is likely that that the strong correlations between striatal neurons are attributable to synchronized inputs from the cortex. The corticostriatal projection is highly convergent, with a convergence ratio of 10 between corticostriatal neurons and striatal neurons, but also sparse, with many cortical inputs being necessary to cause action potential firing in projection neurons (Ramanathan et al., 2002; Zheng and Wilson, 2002). This interpretation would explain why two GABAergic neurons were usually positively correlated around zero lag, rather than negatively correlated. Although this result seems initially counterintuitive, it is what would be expected if the correlations were driven primarily by efferents from the cortex.
The corticostriatal projection is a key processing step in the basal ganglia network. Although the results of cross-correlation analyses presented here may not reflect direct synaptic interaction, the relationships between different striatal neurons in relation to cortical activity is, therefore, of considerable importance to striatal physiology. In the hippocampus and cerebral cortex, there is reciprocal inhibitory/excitatory connectivity between interneurons and projection neurons that is likely to underlie local high-frequency oscillations (Traub et al., 2004). Oscillations in striatum, however, appear primarily driven by the cortex, and at low frequency there is ample evidence for this (Stern et al., 1998; Murer et al., 2002; Berke et al., 2004). The specificity of gamma locking of pFSIs to cortical oscillations revealed in the present phase-locking analysis suggests that coherent gamma oscillations between cortex and striatum at the population level are entrained through this connection. Several lines of evidence from previous investigations support this finding. First, FSIs in the cortex and hippocampus are key drivers of high-frequency population oscillations (Klausberger et al., 2003; Hasenstaub et al., 2005). Second, the circuitry of striatal FSIs is suggestive of their involvement in coordinating large-scale activity (Ramanathan et al., 2002; Tepper and Bolam, 2004). FSIs form multiple synaptic contacts on MSN soma providing powerful inhibition (Koos et al., 2004). Third, the FSIs receive short latency cortical input, which is hypothesized to allow feedforward inhibition of MSNs (Mallet et al., 2005). Together, this suggests that FSIs may be involved both in the local generation of fast striatal oscillations and a key mediator of their entrainment to cortical rhythms. Gap junctions are commonly found between neighboring FSIs allowing for fast synchronization (Kita et al., 1990); however, the finding that halothane is a gap junction blocker (Johnston et al., 1980) suggests that these may not be required for the interactions among FSIs observed here.
To what extent can we rule out the contributions of other interneuron types to the propagation of oscillatory activity in the striatum? We could not test for correlations between pTAN or pLTS neurons, but, given the relatively low incidence of locking to the cortical oscillation, it seems unlikely that there would be high-frequency locking between these neuron types. In contrast, contrary to our observations, one might expect high-frequency correlations between pFSIs and pMSNs, as the latter need to be recruited to influence other basal ganglia structures. However, oscillations can manifest in the membrane potentials of neurons without initiating similar temporal patterning in the action potentials (Hasenstaub et al., 2005), including MSNs (Mahon et al., 2006). Indeed, given that FSIs make up only 0.8% of the striatum, a large summation of synchronized activity at the level of MSN membrane potential is the most likely explanation for the prominent power of oscillations in the bipolar LFP.
Many studies have demonstrated the importance of such oscillations in neuronal processing (Engel et al., 2001; Buzsáki and Draguhn, 2004) and gamma oscillations have received special attention as possible mediators of dynamic neuronal communication (Fries, 2005). A possible role of the coordinated high-frequency firing of FSIs might be to provide precise time windows for processing, integrating any MSNs that have sufficient synaptic input to fire at high frequency. At the systems level, coherent activity at gamma frequency between the striatum and cortex could facilitate the formation of temporally precise assemblies between the major processing hubs of the forebrain (Gervasoni et al., 2004) at a computationally relevant timescale (Fries, 2005; Womelsdorf et al., 2007). Our results add substantial support to the growing body of evidence that parvalbumin-positive GABAergic neurons are a crucial mediator of this process at the population level (Hasenstaub et al., 2005).
In conclusion, as in the cerebral cortex and hippocampus, the coordinated activity of fast spiking interneurons appears to underlie the emergence of high-frequency population oscillations in the striatum, fostering the entrainment of striatal rhythms by direct cortical projections. This finding suggests an important role of striatal FSIs in the propagation of oscillations within the striatum and the basal ganglia.
Footnotes
This work was supported by Bundesministerium für Bildung und Forschung Grant 01GQ01413 (Bernstein Center for Computational Neuroscience Berlin), Volkswagen Foundation Grant Az. 79342, Stifterverband für die Deutsche Wissenschaft Grant H140 5405 5024 111038, and European Union Marie Curie Training Network Programme Grant MRTN-CT-2005-019247. We thank Dr. Johannes Sarnthein for advice on burst analysis.
References
- Aosaki T, Kimura M, Graybiel AM. Temporal and spatial characteristics of tonically active neurons of the primate's striatum. J Neurophysiol. 1995;73:1234–1252. doi: 10.1152/jn.1995.73.3.1234. [DOI] [PubMed] [Google Scholar]
- Apicella P. Leading tonically active neurons of the striatum from reward detection to context recognition. Trends Neurosci. 2007;30:299–306. doi: 10.1016/j.tins.2007.03.011. [DOI] [PubMed] [Google Scholar]
- Bar-Gad I, Ritov Y, Vaadia E, Bergman H. Failure in identification of overlapping spikes from multiple neuron activity causes artificial correlations. J Neurosci Methods. 2001;107:1–13. doi: 10.1016/s0165-0270(01)00339-9. [DOI] [PubMed] [Google Scholar]
- Bartos M, Vida I, Jonas P. Synaptic mechanisms of synchronized gamma oscillations in inhibitory interneuron networks. Nat Rev Neurosci. 2007;8:45–56. doi: 10.1038/nrn2044. [DOI] [PubMed] [Google Scholar]
- Bennett BD, Callaway JC, Wilson CJ. Intrinsic membrane properties underlying spontaneous tonic firing in neostriatal cholinergic interneurons. J Neurosci. 2000;20:8493–8503. doi: 10.1523/JNEUROSCI.20-22-08493.2000. [DOI] [PMC free article] [PubMed] [Google Scholar]
- Berke JD, Okatan M, Skurski J, Eichenbaum HB. Oscillatory entrainment of striatal neurons in freely moving rats. Neuron. 2004;43:883–896. doi: 10.1016/j.neuron.2004.08.035. [DOI] [PubMed] [Google Scholar]
- Berridge CW, Foote SL. Effects of locus coeruleus activation on electroencephalographic activity in neocortex and hippocampus. J Neurosci. 1991;11:3135–3145. doi: 10.1523/JNEUROSCI.11-10-03135.1991. [DOI] [PMC free article] [PubMed] [Google Scholar]
- Berridge CW, Bolen SJ, Manley MS, Foote SL. Modulation of forebrain electroencephalographic activity in halothane-anesthetized rat via actions of noradrenergic beta-receptors within the medial septal region. J Neurosci. 1996;16:7010–7020. doi: 10.1523/JNEUROSCI.16-21-07010.1996. [DOI] [PMC free article] [PubMed] [Google Scholar]
- Boashash B. Estimating and interpreting the instantaneous frequency of a signal. I. Fundamentals. Proc IEEE. 1992;80:520–538. [Google Scholar]
- Bolam JP, Hanley JJ, Booth PA, Bevan MD. Synaptic organisation of the basal ganglia. J Anat. 2000;196:527–542. doi: 10.1046/j.1469-7580.2000.19640527.x. [DOI] [PMC free article] [PubMed] [Google Scholar]
- Buzsáki G, Draguhn A. Neuronal oscillations in cortical networks. Science. 2004;304:1926–1929. doi: 10.1126/science.1099745. [DOI] [PubMed] [Google Scholar]
- Cassidy M, Brown P. Spectral phase estimates in the setting of multidirectional coupling. J Neurosci Methods. 2003;127:95–103. doi: 10.1016/s0165-0270(03)00129-8. [DOI] [PubMed] [Google Scholar]
- Challis RE, Kitney RI. Biomedical signal processing (in four parts). Part 1: Time-domain methods. Med Biol Eng Comput. 1990;28:509–524. doi: 10.1007/BF02442601. [DOI] [PubMed] [Google Scholar]
- Constantinidis C, Goldman-Rakic PS. Correlated discharges among putative pyramidal neurons and interneurons in the primate prefrontal cortex. J Neurophysiol. 2002;88:3487–3497. doi: 10.1152/jn.00188.2002. [DOI] [PubMed] [Google Scholar]
- Csicsvari J, Hirase H, Czurkó A, Mamiya A, Buzsáki G. Fast network oscillations in the hippocampal CA1 region of the behaving rat. J Neurosci. 1999;19:RC20. doi: 10.1523/JNEUROSCI.19-16-j0001.1999. [DOI] [PMC free article] [PubMed] [Google Scholar]
- DeCoteau WE, Thorn C, Gibson DJ, Courtemanche R, Mitra P, Kubota Y, Graybiel AM. Learning-related coordination of striatal and hippocampal theta rhythms during acquisition of a procedural maze task. Proc Natl Acad Sci U S A. 2007;104:5644–5649. doi: 10.1073/pnas.0700818104. [DOI] [PMC free article] [PubMed] [Google Scholar]
- Dejean C, Gross CE, Bioulac B, Boraud T. Synchronous high-voltage spindles in the cortex-basal ganglia network of awake and unrestrained rats. Eur J Neurosci. 2007;25:772–784. doi: 10.1111/j.1460-9568.2007.05305.x. [DOI] [PubMed] [Google Scholar]
- Denker M, Roux S, Timme M, Riehle A, Grün S. Phase synchronization between LFP and spiking activity in motor cortex during movement preparation. Neurocomputing. 2007;70:2096–2101. [Google Scholar]
- Elul R. The genesis of the EEG. Int Rev Neurobiol. 1971;15:227–272. doi: 10.1016/s0074-7742(08)60333-5. [DOI] [PubMed] [Google Scholar]
- Engel AK, Fries P, Singer W. Dynamic predictions: oscillations and synchrony in top-down processing. Nat Rev Neurosci. 2001;2:704–716. doi: 10.1038/35094565. [DOI] [PubMed] [Google Scholar]
- Fogelson N, Pogosyan A, Kühn AA, Kupsch A, van Bruggen G, Speelman H, Tijssen M, Quartarone A, Insola A, Mazzone P, Di Lazzaro V, Limousin P, Brown P. Reciprocal interactions between oscillatory activities of different frequencies in the subthalamic region of patients with Parkinson's disease. Eur J Neurosci. 2005;22:257–266. doi: 10.1111/j.1460-9568.2005.04179.x. [DOI] [PubMed] [Google Scholar]
- Friedrich RW, Habermann CJ, Laurent G. Multiplexing using synchrony in the zebrafish olfactory bulb. Nat Neurosci. 2004;7:862–871. doi: 10.1038/nn1292. [DOI] [PubMed] [Google Scholar]
- Fries P. A mechanism for cognitive dynamics: neuronal communication through neuronal coherence. Trends Cogn Sci. 2005;9:474–480. doi: 10.1016/j.tics.2005.08.011. [DOI] [PubMed] [Google Scholar]
- Gervasoni D, Lin SC, Ribeiro S, Soares ES, Pantoja J, Nicolelis MA. Global forebrain dynamics predict rat behavioral states and their transitions. J Neurosci. 2004;24:11137–11147. doi: 10.1523/JNEUROSCI.3524-04.2004. [DOI] [PMC free article] [PubMed] [Google Scholar]
- Gold C, Henze DA, Koch C, Buzsáki G. On the origin of the extracellular action potential waveform: a modeling study. J Neurophysiol. 2006;95:3113–3128. doi: 10.1152/jn.00979.2005. [DOI] [PubMed] [Google Scholar]
- Gold C, Henze DA, Koch C. Using extracellular action potential recordings to constrain compartmental models. J Comput Neurosci. 2007;23:39–58. doi: 10.1007/s10827-006-0018-2. [DOI] [PubMed] [Google Scholar]
- Groenewegen HJ, Berendse HW. The specificity of the “nonspecific” midline and intralaminar thalamic nuclei. Trends Neurosci. 1994;17:52–57. doi: 10.1016/0166-2236(94)90074-4. [DOI] [PubMed] [Google Scholar]
- Halliday DM, Rosenberg JR, Amjad AM, Breeze P, Conway BA, Farmer SF. A framework for the analysis of mixed time series/point process data—theory and application to the study of physiological tremor, single motor unit discharges and electromyograms. Prog Biophys Mol Biol. 1995;64:237–278. doi: 10.1016/s0079-6107(96)00009-0. [DOI] [PubMed] [Google Scholar]
- Hasenstaub A, Shu Y, Haider B, Kraushaar U, Duque A, McCormick DA. Inhibitory postsynaptic potentials carry synchronized frequency information in active cortical networks. Neuron. 2005;47:423–435. doi: 10.1016/j.neuron.2005.06.016. [DOI] [PubMed] [Google Scholar]
- Imas OA, Ropella KM, Wood JD, Hudetz AG. Halothane augments event-related gamma oscillations in rat visual cortex. Neuroscience. 2004;123:269–278. doi: 10.1016/j.neuroscience.2003.09.014. [DOI] [PubMed] [Google Scholar]
- Jeanmonod D, Magnin M, Morel A. Low-threshold calcium spike bursts in the human thalamus. Common physiopathology for sensory, motor and limbic positive symptoms. Brain. 1996;119:363–375. doi: 10.1093/brain/119.2.363. [DOI] [PubMed] [Google Scholar]
- Johnston MF, Simon SA, Ramón F. Interaction of anesthetics with electrical synapses. Nature. 1980;286:498–500. doi: 10.1038/286498a0. [DOI] [PubMed] [Google Scholar]
- Kawaguchi Y. Physiological, morphological, and histochemical characterization of three classes of interneurons in rat neostriatum. J Neurosci. 1993;13:4908–4923. doi: 10.1523/JNEUROSCI.13-11-04908.1993. [DOI] [PMC free article] [PubMed] [Google Scholar]
- Kawaguchi Y, Kondo S. Parvalbumin, somatostatin and cholecystokinin as chemical markers for specific GABAergic interneuron types in the rat frontal cortex. J Neurocytol. 2002;31:277–287. doi: 10.1023/a:1024126110356. [DOI] [PubMed] [Google Scholar]
- Kita H, Kosaka T, Heizmann CW. Parvalbumin-immunoreactive neurons in the rat neostriatum: a light and electron microscopic study. Brain Res. 1990;536:1–15. doi: 10.1016/0006-8993(90)90002-s. [DOI] [PubMed] [Google Scholar]
- Klausberger T, Magill PJ, Márton LF, Roberts JD, Cobden PM, Buzsáki G, Somogyi P. Brain-state- and cell-type-specific firing of hippocampal interneurons in vivo. Nature. 2003;421:844–848. doi: 10.1038/nature01374. [DOI] [PubMed] [Google Scholar]
- Koos T, Tepper JM, Wilson CJ. Comparison of IPSCs evoked by spiny and fast-spiking neurons in the neostriatum. J Neurosci. 2004;24:7916–7922. doi: 10.1523/JNEUROSCI.2163-04.2004. [DOI] [PMC free article] [PubMed] [Google Scholar]
- Lacey CJ, Bolam JP, Magill PJ. Novel and distinct operational principles of intralaminar thalamic neurons and their striatal projections. J Neurosci. 2007;27:4374–4384. doi: 10.1523/JNEUROSCI.5519-06.2007. [DOI] [PMC free article] [PubMed] [Google Scholar]
- Lachaux JP, Rodriguez E, Martinerie J, Varela FJ. Measuring phase synchrony in brain signals. Hum Brain Mapp. 1999;8:194–208. doi: 10.1002/(SICI)1097-0193(1999)8:4<194::AID-HBM4>3.0.CO;2-C. [DOI] [PMC free article] [PubMed] [Google Scholar]
- Le Van Quyen M, Foucher J, Lachaux J, Rodriguez E, Lutz A, Martinerie J, Varela FJ. Comparison of Hilbert transform and wavelet methods for the analysis of neuronal synchrony. J Neurosci Methods. 2001;111:83–98. doi: 10.1016/s0165-0270(01)00372-7. [DOI] [PubMed] [Google Scholar]
- Llinás RR, Steriade M. Bursting of thalamic neurons and states of vigilance. J Neurophysiol. 2006;95:3297–3308. doi: 10.1152/jn.00166.2006. [DOI] [PubMed] [Google Scholar]
- Logothetis NK, Wandell BA. Interpreting the BOLD signal. Annu Rev Physiol. 2004;66:735–769. doi: 10.1146/annurev.physiol.66.082602.092845. [DOI] [PubMed] [Google Scholar]
- Magill PJ, Pogosyan A, Sharott A, Csicsvari J, Bolam JP, Brown P. Changes in functional connectivity within the rat striato-pallidal axis during global brain activation in vivo. J Neurosci. 2006;26:6318–6329. doi: 10.1523/JNEUROSCI.0620-06.2006. [DOI] [PMC free article] [PubMed] [Google Scholar]
- Mahon S, Deniau JM, Charpier S. Relationship between EEG potentials and intracellular activity of striatal and cortico-striatal neurons: an in vivo study under different anesthetics. Cereb Cortex. 2001;11:360–373. doi: 10.1093/cercor/11.4.360. [DOI] [PubMed] [Google Scholar]
- Mahon S, Vautrelle N, Pezard L, Slaght SJ, Deniau JM, Chouvet G, Charpier S. Distinct patterns of striatal medium spiny neuron activity during the natural sleep-wake cycle. J Neurosci. 2006;26:12587–12595. doi: 10.1523/JNEUROSCI.3987-06.2006. [DOI] [PMC free article] [PubMed] [Google Scholar]
- Mallet N, Le Moine C, Charpier S, Gonon F. Feedforward inhibition of projection neurons by fast-spiking GABA interneurons in the rat striatum in vivo. J Neurosci. 2005;25:3857–3869. doi: 10.1523/JNEUROSCI.5027-04.2005. [DOI] [PMC free article] [PubMed] [Google Scholar]
- Mallet N, Pogosyan A, Márton LF, Bolam JP, Brown P, Magill PJ. Parkinsonian beta oscillations in the external globus pallidus and their relationship with subthalamic nucleus activity. J Neurosci. 2008;28:14245–14258. doi: 10.1523/JNEUROSCI.4199-08.2008. [DOI] [PMC free article] [PubMed] [Google Scholar]
- Mardia KV, Jupp PE. Directional statistics. New York: Wiley; 2000. [Google Scholar]
- Masimore B, Kakalios J, Redish AD. Measuring fundamental frequencies in local field potentials. J Neurosci Methods. 2004;138:97–105. doi: 10.1016/j.jneumeth.2004.03.014. [DOI] [PubMed] [Google Scholar]
- Masimore B, Schmitzer-Torbert NC, Kakalios J, Redish AD. Transient striatal gamma local field potentials signal movement initiation in rats. Neuroreport. 2005;16:2021–2024. doi: 10.1097/00001756-200512190-00010. [DOI] [PubMed] [Google Scholar]
- Mitchell JF, Sundberg KA, Reynolds JH. Differential attention-dependent response modulation across cell classes in macaque visual area V4. Neuron. 2007;55:131–141. doi: 10.1016/j.neuron.2007.06.018. [DOI] [PubMed] [Google Scholar]
- Mitzdorf U. Current source-density method and application in cat cerebral cortex: investigation of evoked potentials and EEG phenomena. Physiol Rev. 1985;65:37–100. doi: 10.1152/physrev.1985.65.1.37. [DOI] [PubMed] [Google Scholar]
- Murer MG, Tseng KY, Kasanetz F, Belluscio M, Riquelme LA. Brain oscillations, medium spiny neurons, and dopamine. Cell Mol Neurobiol. 2002;22:11–32. doi: 10.1023/A:1021840504342. [DOI] [PMC free article] [PubMed] [Google Scholar]
- Nowak LG, Bullier J. Time in the brain. Amsterdam: Harwood Academic; 2000. Cross-correlograms for neuronal spike trains. Different types of temporal correlation in the neocortex, their origin and significance; pp. 53–96. [Google Scholar]
- Ramanathan S, Hanley JJ, Deniau JM, Bolam JP. Synaptic convergence of motor and somatosensory cortical afferents onto GABAergic interneurons in the rat striatum. J Neurosci. 2002;22:8158–8169. doi: 10.1523/JNEUROSCI.22-18-08158.2002. [DOI] [PMC free article] [PubMed] [Google Scholar]
- Rivlin-Etzion M, Ritov Y, Heimer G, Bergman H, Bar-Gad I. Local shuffling of spike trains boosts the accuracy of spike train spectral analysis. J Neurophysiol. 2006;95:3245–3256. doi: 10.1152/jn.00055.2005. [DOI] [PubMed] [Google Scholar]
- Rosenberg JR, Amjad AM, Breeze P, Brillinger DR, Halliday DM. The Fourier approach to the identification of functional coupling between neuronal spike trains. Prog Biophys Mol Biol. 1989;53:1–31. doi: 10.1016/0079-6107(89)90004-7. [DOI] [PubMed] [Google Scholar]
- Rymar VV, Sasseville R, Luk KC, Sadikot AF. Neurogenesis and stereological morphometry of calretinin-immunoreactive interneurons of the neostriatum. J Comp Neurol. 2004;469:325–339. doi: 10.1002/cne.11008. [DOI] [PubMed] [Google Scholar]
- Sarnthein J, Jeanmonod D. High thalamocortical theta coherence in patients with Parkinson's disease. J Neurosci. 2007;27:124–131. doi: 10.1523/JNEUROSCI.2411-06.2007. [DOI] [PMC free article] [PubMed] [Google Scholar]
- Somogyi P, Klausberger T. Defined types of cortical interneurone structure space and spike timing in the hippocampus. J Physiol. 2005;562:9–26. doi: 10.1113/jphysiol.2004.078915. [DOI] [PMC free article] [PubMed] [Google Scholar]
- Steriade M. Corticothalamic resonance, states of vigilance and mentation. Neuroscience. 2000;101:243–276. doi: 10.1016/s0306-4522(00)00353-5. [DOI] [PubMed] [Google Scholar]
- Stern EA, Jaeger D, Wilson CJ. Membrane potential synchrony of simultaneously recorded striatal spiny neurons in vivo. Nature. 1998;394:475–478. doi: 10.1038/28848. [DOI] [PubMed] [Google Scholar]
- Tepper JM, Bolam JP. Functional diversity and specificity of neostriatal interneurons. Curr Opin Neurobiol. 2004;14:685–692. doi: 10.1016/j.conb.2004.10.003. [DOI] [PubMed] [Google Scholar]
- Tierney PL, Dégenètais E, Thierry AM, Glowinski J, Gioanni Y. Influence of the hippocampus on interneurons of the rat prefrontal cortex. Eur J Neurosci. 2004;20:514–524. doi: 10.1111/j.1460-9568.2004.03501.x. [DOI] [PubMed] [Google Scholar]
- Tort AB, Kramer MA, Thorn C, Gibson DJ, Kubota Y, Graybiel AM, Kopell NJ. Dynamic cross-frequency couplings of local field potential oscillations in rat striatum and hippocampus during performance of a T-maze task. Proc Natl Acad Sci U S A. 2008;105:20517–20522. doi: 10.1073/pnas.0810524105. [DOI] [PMC free article] [PubMed] [Google Scholar]
- Traub RD, Bibbig A, LeBeau FE, Buhl EH, Whittington MA. Cellular mechanisms of neuronal population oscillations in the hippocampus in vitro. Annu Rev Neurosci. 2004;27:247–278. doi: 10.1146/annurev.neuro.27.070203.144303. [DOI] [PubMed] [Google Scholar]
- Tukker JJ, Fuentealba P, Hartwich K, Somogyi P, Klausberger T. Cell type-specific tuning of hippocampal interneuron firing during gamma oscillations in vivo. J Neurosci. 2007;27:8184–8189. doi: 10.1523/JNEUROSCI.1685-07.2007. [DOI] [PMC free article] [PubMed] [Google Scholar]
- Varela F, Lachaux JP, Rodriguez E, Martinerie J. The brainweb: phase synchronization and large-scale integration. Nat Rev Neurosci. 2001;2:229–239. doi: 10.1038/35067550. [DOI] [PubMed] [Google Scholar]
- Wilson CJ. The mechanism of intrinsic amplification of hyperpolarizations and spontaneous bursting in striatal cholinergic interneurons. Neuron. 2005;45:575–585. doi: 10.1016/j.neuron.2004.12.053. [DOI] [PubMed] [Google Scholar]
- Wilson CJ, Chang HT, Kitai ST. Firing patterns and synaptic potentials of identified giant aspiny interneurons in the rat neostriatum. J Neurosci. 1990;10:508–519. doi: 10.1523/JNEUROSCI.10-02-00508.1990. [DOI] [PMC free article] [PubMed] [Google Scholar]
- Witham CL, Wang M, Baker SN. Cells in somatosensory areas show synchrony with beta oscillations in monkey motor cortex. Eur J Neurosci. 2007;26:2677–2686. doi: 10.1111/j.1460-9568.2007.05890.x. [DOI] [PMC free article] [PubMed] [Google Scholar]
- Womelsdorf T, Schoffelen JM, Oostenveld R, Singer W, Desimone R, Engel AK, Fries P. Modulation of neuronal interactions through neuronal synchronization. Science. 2007;316:1609–1612. doi: 10.1126/science.1139597. [DOI] [PubMed] [Google Scholar]
- Zheng T, Wilson CJ. Corticostriatal combinatorics: the implications of corticostriatal axonal arborizations. J Neurophysiol. 2002;87:1007–1017. doi: 10.1152/jn.00519.2001. [DOI] [PubMed] [Google Scholar]