

Abstract
Synaptic input to a neuron may undergo various filtering steps, both locally and during transmission to the soma. Using simultaneous whole-cell recordings from soma and apical dendrites from rat CA1 hippocampal pyramidal cells, and biophysically detailed modeling, we found two complementary resonance (bandpass) filters of subthreshold voltage signals. Both filters favor signals in the theta (3–12 Hz) frequency range, but have opposite location, direction, and voltage dependencies: (1) dendritic H-resonance, caused by h/HCN-channels, filters signals propagating from soma to dendrite when the membrane potential is close to rest; and (2) somatic M-resonance, caused by M/Kv7/KCNQ and persistent Na+ (NaP) channels, filters signals propagating from dendrite to soma when the membrane potential approaches spike threshold. Hippocampal pyramidal cells participate in theta network oscillations during behavior, and we suggest that that these dual, polarized theta resonance mechanisms may convey voltage-dependent tuning of theta-mediated neural coding in the entorhinal/hippocampal system during locomotion, spatial navigation, memory, and sleep.
Introduction
Cortical neurons process synaptic inputs spanning a wide range of frequencies, arising from irregular spike trains as well as cortical rhythms (Buzsáki and Draguhn, 2004; Buzsáki, 2006). For example, during spatial navigation, exploration, learning, and rapid eye movement (REM) sleep, the hippocampal and entorhinal cortex (EC) networks oscillate at theta frequency, 3–12 Hz (Buzsáki, 2002). Such theta oscillations occur in all mammals examined, including humans, and are probably essential for neural coding (O'Keefe and Recce, 1993; Kahana et al., 1999; Kahana et al., 2001; Buzsáki, 2002; Cantero et al., 2003; Mehta et al., 2002).
Network activity, including oscillations, arises from interplay between synaptic network properties and intrinsic conductances of the participating neurons. Neurons express a variety of voltage-dependent conductances that can produce resonance and intrinsic oscillations, thus enhancing responses to input of certain frequencies (Hutcheon and Yarom, 2000). In electrical terms, these neurons respond like bandpass filters. To understand the functional relevance of these properties, it is essential to determine the frequency dependence of the dendrosomatic integration and transmission. To date, however, few studies have directly explored the frequency dependence of dendrite-to-soma transmission (Ulrich, 2002; Cook et al., 2007; Narayanan and Johnston, 2007).
In this study, we explored these properties in CA1 pyramidal neurons of the rat by using simultaneous somatic and dendritic recordings in conjunction with biophysically detailed computational modeling. We identified two separate, segregated theta resonator mechanisms within these cells: (1) a perisomatic M-resonance mechanism operating only at depolarized potentials, generated by an M-type slow potassium current (mediated by M-channels, also called Kv7, or KCNQ) and strengthened by a persistent Na+ current (INaP), and (2) a distal dendritic H-resonance mechanism, dominating at hyperpolarized levels and generated by h-current (HCN channels) (Hu et al., 2002). We show that these two resonator mechanisms are not only spatially segregated, they are also virtually mirror images of each other, performing complementary, direction- and voltage-dependent forms of theta bandpass filtering of inputs. When M-resonance filtering is engaged at depolarized potentials, this bandpass filter affects only dendrite-to-soma transmission. Conversely, when hyperpolarized potentials activate H-resonance filtering, soma-to-dendrite transmission is selectively affected.
The complementary mechanisms are well positioned to impact postsynaptic frequency selectivity, integration, and transduction, by multistep bandpass filtering of synaptic input, thus locally at the site of dendritic input (Leung and Yu, 1998; Hu et al., 2002; Narayanan and Johnston, 2007), during signal propagation from dendrites to the soma (Ulrich, 2002), and finally during backpropagation of somatic signals to the dendrites. Since the filters are tuned to the theta frequency band, both are suited to participate in the theta network rhythm processing in the entorhinal/hippocampal system (Buzsáki, 2002). Indeed, the complementary spatial arrangement and function of the two resonators seems to fit intriguingly well with models of hippocampal theta oscillations, in which pyramidal cell somata are rhythmically hyperpolarized by theta-modulated inhibitory input while their apical dendrites are rhythmically depolarized by excitatory input from EC (Buzsáki, 2002). Furthermore, the segregated dual resonance described here fit well with the proposed spatially separated dual oscillator models of place fields, grid fields, and phase precession in the entorhinal/hippocampal network during exploration, spatial navigation, learning, and memory (Lengyel et al., 2003; Burgess et al., 2007; Giocomo et al., 2007).
The main data and conclusions of this study were presented at a conference two years ago (Hu et al., 2007b).
Materials and Methods
Slice preparation.
Male Wistar rats (6–10 weeks) were anesthetized with an intraperitoneal injection of Equithesin (3 ml/kg body weight), before being perfused transcardially with ice-cold (∼4°C) cutting solution (in mm): 230 sucrose, 25 NaHCO3, 1.25 KCl, 1.25 KH2PO4, 10 MgCl2, 1.0 CaCl2, and 16 glucose, saturated with 95% O2–5% CO2. After decapitation, hippocampal horizontal slices were cut in the same solution used for perfusion with a Vibratome 3000 slicer. Slices were incubated at ∼35°C for 30 min and subsequently stored at room temperature (20–25°C) in artificial CSF (aCSF) containing the following (in mm): 125 NaCl, 25 NaHCO3, 1.25 KCl, 1.25 KH2PO4, 1.0 MgCl2, 1.0 CaCl2, and 16 glucose, saturated with 95% O2–5% CO2. During recording, slices were submerged in aCSF with 2.0 mm CaCl2 at 30–35°C (<0.5°C variation within each recording).
Whole-cell patch-clamp recording.
Whole-cell patch-clamp recordings were obtained from soma or apical dendrite of visually identified CA1 pyramidal neurons, viewed with an upright microscope with IR-DIC optics (Olympus, BX50). The diagram in Figure 1 shows the triple patch recording configuration that was used in most of the experiments of this study (i.e., in Figs. 1, 3, 6, 7 and supplemental Figs. S1, S2, S4, S7a,b, available at www.jneurosci.org as supplemental material). The intracellular solution contained the following (in mm): 140 KMeSO4 (or 140 K-gluconate), 10 HEPES, 2 ATP disodium salt, 0.4 GTP sodium salt hydrate, 1.0 MgCl2, 10 phosphocreatine disodium salt hydrate, 10 inositol, and 0.1 EGTA (pH adjusted to 7.3), giving a pipette resistance of 2–5 MΩ for somatic recordings and 8–12 MΩ for dendritic recordings. The maximal series resistance that we accepted in this study was 90 MΩ. Thus, recordings with higher series resistance were discarded. The resting potential was −70.0 ± 1.4 mV in the soma and −71.5 ± 1.6 mV in the dendrite (n = 31 simultaneous recordings). The somatic action potential threshold was −50.8 ± 1.7 mV (determined from a subset of recorded cells, n = 8). To trace the apical dendrite, the soma was patched with 100 μm Alexa 488 in the patch pipette. After 3–5 min, the slice was illuminated at a wavelength of 492 nm (Polychrome IV, T.I.L.L. Photonics) and the fluorescence imaged with a CCD camera (VX45 Optronics). The visualized apical dendrite was subsequently patched under IR-DIC optics. Series resistance was 15–90 MΩ, and all potentials were corrected for the junction potential (−8 to −10 mV). Current-clamp recordings were obtained with two Dagan BVC 700A amplifiers or an additional Multiclamp amplifier (Molecular Devices).
Figure 1.

Resonance recorded near the resting membrane potential (approximately −78 mV) is stronger in the dendrites than in the soma because of h-channels. A, B, Simultaneous whole-cell recording from soma and dendrite (distance to soma: 210 μm). The somatic response (A) to somatic IZAP injection (0–15 Hz, 0.3 nA peak to peak, lower trace) and the dendritic response (B) to dendritic IZAP injection are shown. The diagram shows the triple patch recording configuration. C, D, Voltage responses in soma and dendrite after bath application of 10 μm ZD7288 (same cell and IZAP as in A and B). E, F, Somatic (blue) and dendritic (red) impedance profiles from the recordings in A and C and in B and D, respectively. G–I, Summary comparing the local somatic (blue) and dendrite (red) resonance strength (Q value, shown in G), resonance frequency (H), and local peak impedance (I) before (n = 8) and after (n = 5) ZD7288 application. Note that ZD7288 abolished all resonance and equalized the impedance properties in soma and dendrites. All data were obtained from simultaneous soma and dendrite recordings: average distance between recording sites: 202 ± 13 μm. G, Q values: control: soma: 1.06 ± 0.02, dendrite: 1.13 ± 0.02; ZD7288: soma: 1.0, dendrite: 1.0. H, Resonance frequency: control: soma: 3.5 ± 0.4 Hz, dendrite: 4.4 ± 0.4 Hz; ZD7288: soma: 1.0 Hz, dendrite: 1.0 Hz. I, Peak local impedance: control: soma: 51.7 ± 3.9 MΩ, dendrite: 42.9 ± 3.7 MΩ; ZD7288: soma: 72.9 ± 14.5 MΩ, dendrite: 70.2 ± 10.7 MΩ. **p < 0.01; *0.01 < p < 0.05; NS, p > 0.05.
Figure 3.

Resonance recorded close to the spike threshold (approximately −56 mV) is stronger in the soma than in the dendrites because of M-channels. A, B, Simultaneous whole-cell recording from soma and dendrite (distance to soma: 130 μm) in the presence of 1 μm TTX. The soma response (A) to somatic IZAP injection (0–15 Hz, 0.4 nA peak to peak, lower trace) and the dendritic response (B) to dendritic IZAP injection are shown. C, D, Voltage responses in soma and dendrite after bath application of 10 μm XE991 (same cell and IZAP as in A and B). E, F, Somatic (blue) and dendritic (red) impedance profiles from the recordings in A and C and in B and D, respectively. G–I, Summary graphs for all recorded cells, comparing the local somatic (blue) and dendrite (red) resonance Q value (G), resonance frequency (H), and local peak impedance (I) before (n = 7, average dendritic recording distance: 125 ± 7 μm) and after (n = 5, average dendritic recording distance: 137 ± 8 μm) XE991 application. Note that XE991 abolished all resonance and equalized the impedance properties in soma and dendrites. All data were obtained from simultaneous soma and dendrite recordings. G, Q values: control: soma: 1.07 ± 0.02, dendrite: 1.02 ± 0.01; XE991: soma: 1.0, dendrite: 1.0. H, Resonance frequency: control: soma: 4.0 ± 0.6 Hz, dendrite: 2.0 ± 0.4 Hz; XE991: soma: 1.0 Hz, dendrite: 1.0 Hz. I, Peak local impedance: control: soma: 36.9 ± 3.8 MΩ, dendrite: 44.1 ± 6.3 MΩ; XE991: soma: 62.2 ± 4.0 MΩ, dendrite: 57.5 ± 3.8 MΩ. **p < 0.01; *0.01 < p < 0.05; NS, p > 0.05.
Figure 6.
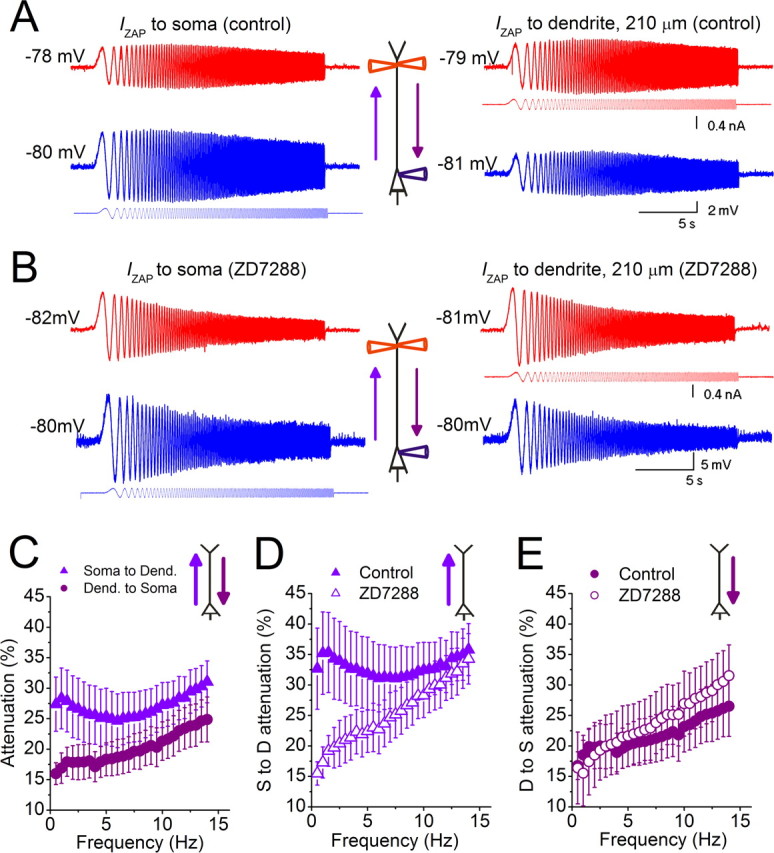
Near the resting potential, h-channels confer direction selective bandpass filtering along the apical dendrite. A, IZAP was injected either into the soma (blue) or into the apical dendrite (red) during simultaneous somatic and dendritic recordings in the same CA1 pyramidal cell (distance to soma: 210 μm). Both the dendrite and soma were held at approximately −78 mV, while the local and propagated voltage responses were recorded. B, Similar experiments as in A were performed in the presence of 10 μm ZD7288. C–E, Summary graphs for all recorded cells. C, From the recordings in A, we calculated the frequency-dependent voltage attenuation either from the soma to the dendrite when IZAP was applied to the soma (violet triangles), or from the dendrite to the soma when IZAP was applied to the dendrite (purple circles), for all recorded cells (n = 8, p < 0.05 below 5 Hz). D, Summary of the voltage attenuation from the soma to the dendrite before and after application of 10 μm ZD7288 (n = 4, dendritic recordings: 170–273 μm from soma; average distance: 212 ± 19 μm) (p < 0.05 below 7.5 Hz, except p = 0.07 at 0.5 Hz). E, Summary of the voltage attenuation from the dendrite to the soma before and after application of 10 μm ZD7288 (n = 5, dendritic recordings: 167–273 μm from soma, average distance: 203 ± 19 μm) (p > 0.05 at all frequencies). The traces shown in A and B are from the same recordings shown in Figure 1A–D.
Figure 7.
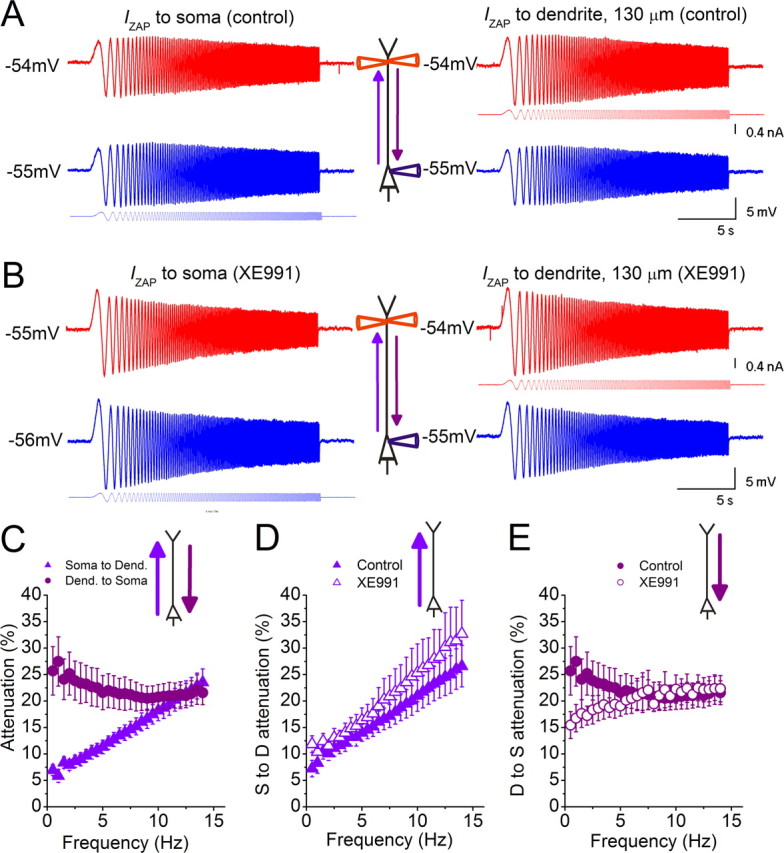
Near the spike threshold, M-channels confer direction selective bandpass filtering along the apical dendrite. A, IZAP was injected either into the soma (blue) or into the apical dendrite (red) during simultaneous somatic and dendritic recordings (distance to soma: 130 μm). Both the dendrite and soma were held approximately −55 mV, while the local and propagated voltage responses were recorded. B, Similar experiments as in A were performed in the presence of 10 μm XE991. C–E, Summary graphs for all recorded cells. C, From the recordings in A, we calculated the frequency-dependent voltage attenuation either from the soma to the dendrite when IZAP was applied to the soma (violet triangles), or from the dendrite to the soma when IZAP was applied to the dendrite (purple circles) (n = 10, dendritic recordings: 101–165 μm from soma, average distance: 136 ± 8 μm) (p < 0.05 below 9.5 Hz). D, Summary of the voltage attenuation from the soma to the dendrite before and after application of 10 μm XE991 (n = 5, dendritic recordings: 101–152 μm from soma, average distance: 126 ± 9 μm) (p > 0.05 at all frequencies). E, Summary of the voltage attenuation from the dendrite to the soma before and after application of 10 μm XE991 (n = 5, dendritic recordings: 101–152 μm from soma, average distance: 126 ± 9 μm) (p < 0.05 below 5 Hz, except p = 0.1 at 4 Hz). The traces shown in A and B are from the same recordings shown in Figure 3A–D.
Data acquisition and analysis.
The data were acquired with pClamp 9 (Molecular Devices) at a sampling rate of 0.5–20 kHz, measured, and plotted with pClamp 9 and Origin 7 (Microcal). Local somatic or dendritic impedance was obtained by injecting IZAP in soma and dendrite, respectively, and the impedance amplitude profile (ZAP) was calculated by dividing the magnitude of the fast Fourier transform (referred to hereafter as “FFT”) of the voltage (V) by the FFT of the injected current (IZAP) [ZAP = FFT(V)/FFT(IZAP)]. IZAP increased linearly from 0 to 15 Hz in 20 s. By exploring how resonance properties depended on the IZAP amplitude with the model, we found that changes in IZAP that produced voltage responses from 0.5 to 10 mV (peak to peak) made little difference in the results as long as the peak voltages were at least 2–3 mV below the spike threshold. The lowest frequency analyzed was 1 Hz to avoid boundary artifacts of the fast Fourier transformation. IZAP amplitude at depolarized potentials was adjusted to keep the voltage responses below ∼5 mV, to avoid spiking. The frequency-dependent voltage attenuation was calculated as follow: during simultaneous dendritic and somatic recordings IZAP was injected in either the soma or the dendrite and the local and propagated voltage response recorded. The attenuation (percentage) was then calculated as follows: 100 − [FFT(Vpropagated)/FFT(Vlocal) × 100]. The transfer impedance was obtained during dual somatic and dendritic recordings by injecting IZAP in either soma or dendrite and calculating the ratio FFT(Vpropagated)/FFT(IZAP).
Statistics.
Two-tailed Student's t test and nonparametric tests (Wilcoxon signed-rank test or Mann–Whitney test) were used for statistical analysis when appropriate (α = 0.05). Values are expressed as mean ± SEM.
Chemicals.
XE991 ([10,10-bis(4-pyridinylmethyl)-9(10H)-antracenone]) was obtained from DuPont pharmaceutical company and NeuroSearch. TTX was obtained from Alomone Labs. Alexa 488 was purchased from Invitrogen. The remaining chemicals were purchased from Sigma-Aldrich Norway.
We showed previously that ZD7288 did not affect somatic M-resonance when this compound was bath applied for <15 min (Hu et al., 2002). However, there is evidence that long-lasting application of ZD7288 (for >20 min) has h-current-independent effects on synaptic transmission at hippocampal mossy fiber synapses (Chevaleyre and Castillo, 2002). Therefore, to avoid possible unknown side effects of long-lasting ZD7288 applications, we restricted the application time to <15 min (see Figs. 1, 6, and supplemental Fig. S2, available at www.jneurosci.org as supplemental material). Since this time window was often too short for a clear and stable isolation of M-resonance followed by M-channel blockade by XE991, we chose to use CsCl instead of ZD7288 in experiments in which it was necessary to block the h-current for longer than 15 min, such as in Figure 3.
Computational modeling.
In the supplemental material (available at www.jneurosci.org), we describe the CA1 pyramidal neuron model in detail. Briefly, computer simulations were performed using the Surf-Hippo simulator, version 3.5a (Graham, 2004). For integrating the circuit equations, Surf-Hippo uses a variant of the Crank Nicholson method as described by Hines (1984). The variable time-step method was used to speed up the simulations (Borg-Graham, 2000), with a maximum voltage error criterion of 0.05 mV. We used four reconstructed cells from the Duke/Southampton database, named n416, n418, n420, and n120, and one from the laboratory of David Amaral (Center for Neuroscience, University of California, Davis, CA), named c12861. Only the results from simulations with cell n120 are shown in the figures. However, simulations with all other morphologies gave qualitatively similar results. Since the model was used to explore only the subthreshold voltage regime, only the following ion channels active in the subthreshold voltage range were included to speed up the simulations: M-current (IM), h-current (Ih), persistent Na+ current (INaP), A-current (IA), a T-type Ca2+ current (ICaT), D-current (ID), a fast delayed rectifier type K+ current (IK), and a K+ leak current (Ileak). The resting potential in the soma and dendrite was −69 mV and −70 mV, respectively, and the threshold was approximately −57 mV.
Results
Neuronal resonance properties are determined by the interplay between passive membrane properties and voltage-dependent conductances. Since these active conductances are distributed nonuniformly within CA1 pyramidal neurons (Magee, 1998; Devaux et al., 2004; Vervaeke et al., 2006a; Hu et al., 2007a; Shah et al., 2008), the resonance properties between different subcellular compartments may differ. We tested this hypothesis by simultaneous triple or dual whole-cell recording from the soma and apical dendrite of CA1 pyramidal cells in rat hippocampal slices. In most experiments, we used triple patching with one somatic and two separate dendritic electrodes (separation <20 μm), one recording membrane potential, the other injecting current, to avoid series resistance artifacts (see Fig. 1 diagram, and Materials and Methods).
Since M- and h-currents may underlie theta-resonance expressed at different membrane potentials (Hu et al., 2002), we compared the resonance properties of the different cellular compartments both (1) near the resting potential, as determined noninvasively in slices (approximately −78 mV) (Fricker et al., 1999); and (2) at a depolarized level near the spike threshold (approximately −55 mV). Note that −78 mV, which is hyperpolarized relative to the prevailing membrane potential during in vivo activity (Kamondi et al., 1998; Hahn et al., 2007), was recorded in the soma (Fricker et al., 1999).
As described below, our recordings revealed two complementary theta resonance mechanisms within each cell: a dendritic resonator operating near the resting potential, and a perisomatic resonator operating near the spike threshold.
Dendritic resonance at resting potential mediated by h-channels
To study resonance, we determined the impedance amplitude profile (ZAP, see Materials and Methods) by injecting an oscillating current of constant amplitude and linearly increasing frequency (IZAP) (Hutcheon and Yarom, 2000), and measured the voltage response. We adjusted the sinusoidal current amplitude to evoke voltage responses that resemble intracellular theta-like voltage oscillations occurring in vivo, which have been reported to be up to 5–10 mV in amplitude (Kamondi et al., 1998; Lee et al., 2006). The resonance strength is expressed as the Q value, obtained by dividing the impedance at the peak resonance frequency with the impedance at 1 Hz (the lowest tested frequency). When we kept the background membrane potential close to −78 mV with steady current (Fig. 1), both the soma and the dendrite displayed resonance in response to locally injected IZAP (Fig. 1A,B), indicated by a peak in the ZAP at theta frequencies (4–8 Hz) (Fig. 1E,F, control). The resonance in the dendrite was stronger (i.e., larger Q value) (Fig. 1G, control; see also supplemental Fig. S1A, available at www.jneurosci.org as supplemental material), with a higher resonance frequency (Fig. 1H, control) but lower peak impedance (Fig. 1I, control) than the soma. Thus, near the resting potential, the dendrites are “leakier” but display stronger resonance than the soma.
We hypothesized that these differences between dendrites and soma might be caused by the far higher h-channel density in the distal dendrites (Magee, 1998; Lörincz et al., 2002). Indeed, we found that bath application of the h-channel blocker ZD7288 (10 μm) abolished both the somatic and the dendritic resonance at approximately −78 mV, as indicated by a shift of the peak voltage response to the lowest frequency tested (Fig. 1C–F; supplemental Fig. S2A, available at www.jneurosci.org as supplemental material). Thus, ZD7288 made the local filtering properties of the soma and dendrite equal (Fig. 1E–H). In parallel, ZD7288 increased the peak impedance, both in the soma and in the dendrite (Fig. 1I). Supplemental Figure S2 (available at www.jneurosci.org as supplemental material) shows that the application of ZD7288 had a significant effect on the Q value, resonance frequency, and peak impedance in both soma and dendrite. These results indicate that the differences in somatic versus dendritic resonance near the resting potential are due to different subcellular h-channel densities.
Somatic resonance close to the spike threshold mediated by M-channels
Next, we compared resonance in the soma and dendrites at depolarized potentials (approximately −56 mV) near the spike threshold (Fig. 2). During simultaneous recording from the soma and a relatively proximal site in the dendrite (distance to soma: 161 μm), somatic and dendritic IZAP injections evoked similar local voltage responses (Fig. 2A,D). To test the properties of the distal dendrite, we then retracted both recording pipettes and repatched the apical dendrite of the same neuron at a more distal site (distance: 378 μm) (Fig. 2B). Injection of the same IZAP (100 pA) at the same holding potential as before now failed to induce any resonance (Fig. 2B,E, left), indicating distance dependence. Since M-channels, which generate M-resonance at depolarized potentials (Hu et al., 2002), are largely axosomatic (Devaux et al., 2004; Hu et al., 2007a; Shah et al., 2008), the absence of resonance might be caused by dendrite-to-soma voltage attenuation, giving insufficient somatic depolarization during dendritic IZAP injection. To test this idea, we injected a stronger IZAP (150 pA) (Fig. 2B,E, right), almost evoking backpropagating spikes. Still, no detectable resonance was evoked, again indicating genuine distance dependence. To also test whether the absence of M-resonance in the distal dendrite might be caused by run-down of M-current during whole-cell recording, we repatched the soma of the same neuron and repeated IZAP. Again, the soma displayed clear resonance (Fig. 2C,F). Overall, at depolarized potentials, somatic resonance was stronger than dendritic resonance (see also supplemental Fig. S1B, available at www.jneurosci.org as supplemental material), with a higher resonance frequency (Fig. 2H). However, there was no significant difference in peak impedance between the soma and the dendrite at this potential (Fig. 2I).
Figure 2.

Resonance recorded close to the spike threshold (approximately −56 mV) is stronger in the soma than in the dendrites. A–C, Local somatic (blue) and dendritic (red) whole-cell voltage responses to IZAP were obtained in the following sequence from the same cell: soma and proximal dendrite were simultaneously patched (distance to soma: 161 μm, IZAP, 100 pA peak to peak) (A); both pipettes were retracted and the same dendrite was repatched more distally (distance to soma: 378 μm, IZAP is 100 and 150 pA in left and right panels, respectively) (B); and the dendritic pipette was retracted and the soma was repatched (IZAP: 150 pA) (C). D–F, Impedance profiles of the respective responses shown above, in A–C. G–I, Summary graphs for all recorded cells, comparing local somatic and dendritic Q values (G, soma: 1.15 ± 0.02, dendrite: 1.03 ± 0.02), resonance frequency (H, soma: 3.4 ± 0.27 Hz, dendrite: 2.0 ± 0.5 Hz), and peak impedance (I, soma: 63.2 ± 4.8 MΩ, dendrite: 65.9 ± 11.8 MΩ). Somatic recordings: n = 10, dendritic recordings: n = 6, average dendritic recording distance: 186 ± 40 μm from the soma. **p < 0.01; *0.01 < p < 0.05; NS, p > 0.05.
The difference between somatic and dendritic theta resonance at approximately −56 mV might be due to the higher density of M and/or persistent Na+ (NaP) currents near the soma compared with the dendrite (Stuart and Sakmann, 1995; Devaux et al., 2004; Astman et al., 2006; Vervaeke et al., 2006b; Hu et al., 2007a; Kole et al., 2008; Shah et al., 2008). To test this hypothesis, we used the M-channel blocker XE991 while Ih was blocked by 3 mm CsCl, to avoid contamination from H-resonance (Fig. 3).
After application of XE991, the neurons often fired spontaneous spikes (Shah et al., 2008), thus distorting the responses to IZAP. To avoid spiking, it was often necessary to reduce IZAP to <15% of the control level (supplemental Fig. S3, available at www.jneurosci.org as supplemental material). However, the voltage responses at high frequencies (>8 Hz) then often became so small (<1 mV) that they were distorted by the intrinsic noise and the typical spontaneous oscillations in these cells (Leung and Yim, 1991) (supplemental Fig. S3, available at www.jneurosci.org as supplemental material), thus precluding accurate analysis of membrane impedance. To improve the signal-to-noise ratio while testing the effects of XE991, we used TTX (1 μm) to block spiking and allow the amplitude of the voltage responses to be increased (Figs. 3, 7; supplemental Figs. S4, S7B, available at www.jneurosci.org as supplemental material).
Figure 3 illustrates local somatic and dendritic resonance at depolarized membrane potentials in the presence of TTX and CsCl. The soma showed stronger local resonance (Fig. 3A,B,E–G, control) and higher local resonance frequency (Fig. 3E,F,H, control) than the dendrite in response to IZAP. Hence, the resonance differences at depolarized potentials were unlikely to be caused by different INaP densities in soma and dendrite, since this current was blocked by TTX, but were probably due to the higher M-channel density near the soma.
Application of XE991 abolished the resonance in both the soma and dendrite at approximately −55 mV (Fig. 3C–F). Supplemental Figure S4A (available at www.jneurosci.org as supplemental material) shows the time course of the XE991 effect. Thus, XE991 abolished all resonance differences between soma and dendrite at approximately −55 mV (Fig. 3G,H), indicating that they were due to M-channels. Furthermore, the local peak impedance was significantly increased by XE991 (Fig. 4D). Supplemental Figure S4 (available at www.jneurosci.org as supplemental material) also shows that the application of XE991 had a significant effect on Q value, resonance frequency, and peak impedance in the soma.
Figure 4.
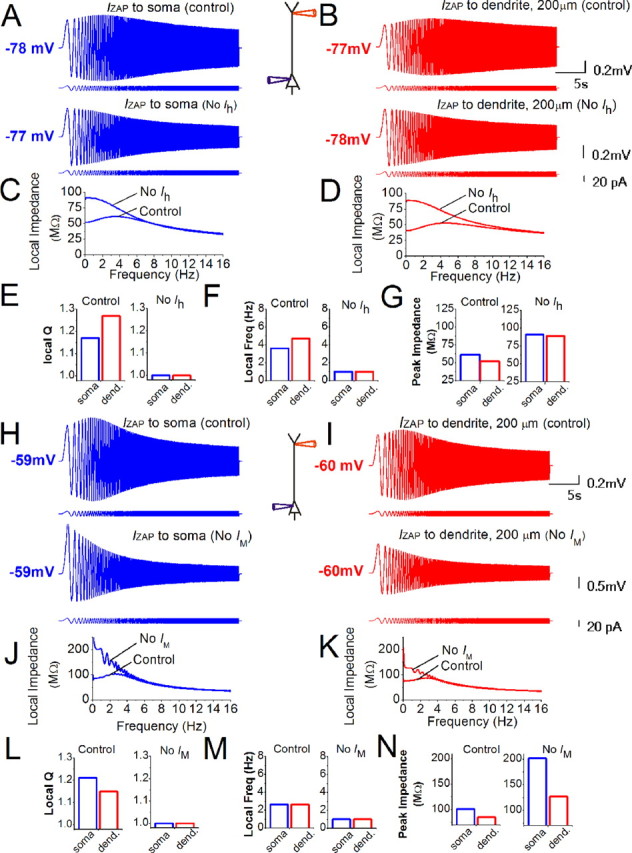
Simulations with a CA1 pyramidal cell model confirmed h- and M-channel-dependent and location-dependent resonance properties near the resting potential and near the spike threshold. A, B, IZAP (0–16 Hz, 18 pA peak to peak) was applied at either the soma (A, blue) or the dendrite (B, red, ∼200 μm from the soma) with (upper traces) or without (lower traces) Ih. The membrane potential was set to approximately −78 mV with steady current. The hyperpolarization due to blocking of Ih was compensated with steady current. C, D, The impedance profiles of the soma and dendrites from the simulations in A and B with or without Ih. E–G, Summary of the local somatic and dendritic Q values (E), resonance frequency (F), and peak impedance (G), with (control) and without Ih. Note that blocking of Ih abolished all resonance and equalized the impedance properties of soma and dendrite. E, Q values: control: soma: 1.17, dendrite: 1.27; no Ih: soma: 1.0, dendrite: 1.0. F, Resonance frequency: control: soma: 3.6 Hz, dendrite: 4.7 Hz; no Ih: soma: 1.0 Hz, dendrite: 1.0 Hz. G, Peak local impedance: control: soma: 61 MΩ, dendrite: 52 MΩ; no Ih: soma: 91 MΩ, dendrite: 89 MΩ. H, I, IZAP (0–16 Hz, 18 pA peak to peak) was applied either at the soma (blue) or dendrite (red, ∼200 μm from the soma) with (upper traces) or without IM (lower traces). The membrane potential was set to approximately −60 mV with steady current. The depolarization due to blocking of IM was compensated with steady current. J, K, The impedance profiles of the soma and dendrites from the simulations in (H, I) with or without IM. L–N, Summary of the local somatic and dendritic Q values (L), resonance frequency (M), and peak impedance (N) with (control) and without IM. Note that blocking of IM abolished all resonance and equalized the impedance properties of soma and dendrite. In J, the ringing artifact at low frequencies is caused by the Fourier transform near the discontinuity at 0 Hz (Gibbs phenomenon) and can also be seen in other plots. L, Q values: control: soma: 1.21, dendrite: 1.15; no IM: soma: 1.0, dendrite: 1.0. M, Resonance frequency: control: soma: 2.6 Hz, dendrite: 2.6 Hz; no IM: soma: 1.0 Hz, dendrite: 1.0 Hz. N, Peak local impedance: control: soma: 101 MΩ, dendrite: 85 MΩ; no IM: soma: 202 MΩ, dendrite: 127 MΩ.
Simulations of dual, complementary resonance with CA1 pyramidal neuron models
Our experiments so far indicate that these neurons are endowed with two segregated and complementary mechanisms mediating local theta resonance bandpass filtering: (1) one caused by h-channels in the distal apical dendrites, operating close to the resting potential, (2) the other caused by M-channels in the axosomatic region, operating close to the spike threshold. To test whether this hypothesis is sufficient to explain our experimental findings, we used a set of detailed compartmental CA1 pyramidal cell models based on five reconstructed morphologies and state of the art data on ion channel kinetics and distributions (see Materials and Methods and supplemental material, available at www.jneurosci.org).In particular, the models included M- and NaP-currents with high density in the soma and axon initial segment (AIS), and h-current with high density in the distal apical dendrites (Stuart and Sakmann, 1995; Magee, 1998; Lörincz et al., 2002; Devaux et al., 2004; Astman et al., 2006; Vervaeke et al., 2006b; Hu et al., 2007a; Kole et al., 2008; Shah et al., 2008). Before being used in this study, the models were developed and tested to reproduce a wide spectrum of previously published experimental data from these neurons (Hoffman et al., 1997; Magee, 1998, 1999; Staff et al., 2000; Golding et al., 2005). Importantly, however, the models were not adjusted to fit the data from the present experiments.
To test local resonance properties in the model (Fig. 4), we injected IZAP in the soma and in the distal apical dendrite (200 μm from soma). When tested at approximately −78 mV, the dendrites showed stronger resonance (Fig. 4A–E, control) and higher resonance frequency (Fig. 4F, control) but lower peak impedance (Fig. 4G, control) than the soma. When repeating IZAP without Ih (Fig. 4A–G, no Ih), resonance was abolished, thus giving similar impedance profiles in dendrites and soma (Fig. 4C–F, no Ih). Also the peak impedances became virtually identical (Fig. 4G). These modeling results all agree closely with our experimental results (Fig. 1), demonstrating that our dendritic H-resonance hypothesis is sufficient to explain the observed Ih-dependent resonance both in the dendrites and soma, although Ih is primarily dendritic. The simulations also show that the experimental data of Figure 1 are compatible with our somatic M-resonance hypothesis, and the other ionic mechanisms of our model.
In the model we also tested the somatic and dendritic resonance properties close to the spike threshold (approximately −60 mV) (Fig. 4H–N, control). The dendrites showed weaker resonance than the soma (Fig. 4L, control), a similar resonance frequency (Fig. 4M, control), and a slightly lower peak impedance (Fig. 4N, control). Omitting IM abolished resonance at depolarized potentials in both soma and dendrites (Fig. 4H–N, no IM), while the peak impedance increased at both sites (Fig. 4N).
Thus, the simulations at depolarized potentials also resemble our experimental results (Figs. 2, 3), although there were minor differences. Whereas the model yielded similar somatic and dendritic resonance frequencies (Fig. 4M, control), the experimental resonance frequency was lower in the dendrites at depolarized potentials (Figs. 2H, 3H, control). However, simulation of IZAP injection further out in the dendrites (∼320 μm from the soma) showed resonance with lower frequency than in the soma (dendrites: 1.8 Hz, soma: 2.6 Hz; data not shown). A similar effect was also shown experimentally (Fig. 2A,B). The model also showed a lower dendritic than somatic peak impedance at depolarized potentials (Fig. 4N), while experimentally the peak impedance seemed similar in both locations (Figs. 2I, 3I). However, simulations at slightly less depolarized potentials (approximately −63 mV), where INaP is less active, strongly reduced the somatic input resistance, producing a similar peak impedance in soma and dendrite (data not shown). Overall, these simulations demonstrate that the axosomatic M-resonance hypothesis is sufficient to explain the observed IM-dependent resonance both in the soma and dendrites, and is also compatible with the H-resonance hypothesis and other known active and passive membrane properties.
We also used the model to explore the resonance strength throughout the entire apical trunk at membrane potentials ranging from −60 to −80 mV (Fig. 5), by expanding the type of simulations illustrated in Figure 4. Interestingly, resonance strength showed a strong dual polarization, with prominent resonance at depolarized potentials around the soma and at hyperpolarized potentials in the distal dendrites (Fig. 5A). When simulations were repeated after turning off Ih, the resonance at potentials negative to −65 mV was abolished in both dendrites and soma (Fig. 5B). Omitting IM abolished the strong somatic resonance at depolarized potentials, but also the weaker dendritic resonance at these potentials (Fig. 5C). Omitting INaP, weakened the somatic resonance at depolarized potentials, without eliminating it, showing that INaP strengthens M-resonance but is not essential for generating it (Fig. 5D). Thus, M-resonance is generated by IM and amplified by INaP.
Figure 5.
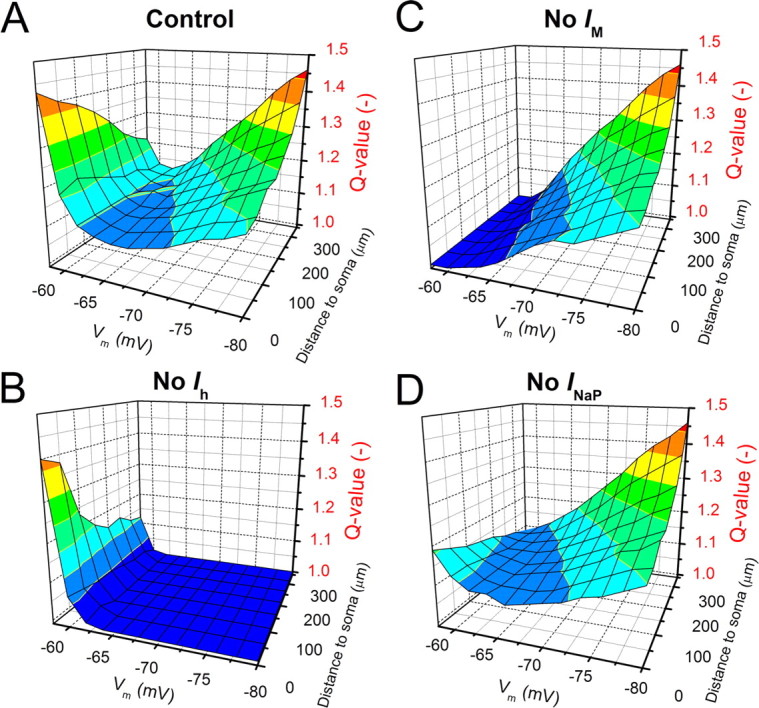
Model simulations showing polarized location- and membrane potential-dependent differences in local resonance strength, caused by polarized h-, M-, and NaP-channel distributions. A, IZAP (0–16 Hz, 18 pA peak to peak) was injected at various potentials (from −60 to −80 mV) and at various locations in the apical dendrite, and the resonance strength (Q value) was determined. Note the two strong resonance poles; one around the soma at depolarized potentials, caused by IM and INaP (M-resonance) and one in the distal dendrites near the resting potential, caused by Ih (H-resonance). B–D, Like in A, but Ih, IM, or INaP were blocked, respectively. Changes in holding potential due to ion channel blockade were compensated with steady current.
Polarized M- and h-channel distributions cause frequency- and direction-dependent voltage attenuation along the apical dendrites
Next, we studied how this polarized distribution of ion channels affects the frequency dependence of voltage attenuation along the apical dendrite, both experimentally (Figs. 6, 7) and by simulations (Figs. 8; supplemental Figs. S5, S6, available at www.jneurosci.org as supplemental material).
Figure 8.

Model simulations confirmed direction- and voltage-dependent bandpass filtering along the apical dendrite. A, B, Frequency dependence of the voltage attenuation is shown either for the soma-to-dendrite direction when IZAP (0–16 Hz, 18 pA peak to peak) was applied to the soma (A), or for the dendrite-to-soma direction when IZAP was applied to the dendrite (B). The membrane potential was set to approximately −78 mV with steady current. The dendritic site was 200 μm from the soma. C, D, Similarly, the frequency dependence of the voltage attenuation is shown when holding the membrane potential at approximately −60 mV. The simulations were run to compare the results when all channels were present and when IM was blocked (solid lines). The simulations comparing the result with or without IM were also repeated to match more closely the experimental conditions of the recordings shown in Fig. 3, i.e., INaP and Ih were blocked (dashed lines).
First at approximately −78 mV, we injected IZAP either in the soma (Fig. 6A, left) or in the dendrites (Fig. 6A, right) and recorded the local and propagated voltage responses, thus measuring the frequency and direction dependence of voltage attenuation along the dendrite (see Materials and Methods). We found that the soma-to-dendrite voltage transfer was more attenuated than the dendrite-to-soma transfer, particularly at frequencies of <5 Hz (Fig. 6C). Moreover, soma-to-dendrite voltage transfer, but not transfer in the opposite direction, was minimally attenuated at theta frequencies (∼6–7 Hz) (Fig. 6C). ZD7288 reduced the voltage attenuation below 7.5 Hz in the soma-to-dendrite direction (Fig. 6B,D), showing that it was caused by Ih, but had no significant effect on attenuation in the opposite direction (Fig. 6D,E). After blocking h-channels, the dendrite behaved like a low-pass filter for voltage propagation in both directions. These results indicate that close to the resting potential, theta-modulated synaptic or intrinsic signals originating in the soma or basal dendrites are preferentially transmitted to the apical dendrites. Thus, the theta-rhythmic inhibitory input to CA1 somata (Kamondi et al., 1998; Buzsáki, 2002) may selectively propagate into the apical dendrite, and may gate voltage-dependent synaptic plasticity (LTP, LTD) of theta-modulated dendritic inputs from CA3 or EC.
Closer to threshold (approximately −55 mV), dendrite-to-soma voltage transfer [Fig. 7A (right),C] was attenuated at frequencies of <7.5 Hz, in sharp contrast both to soma-to-dendrite transfer at the same potential [Fig. 7A (left),C] and to dendrite-to-soma transfer at more negative potentials (Fig. 6C). Thus, theta-modulated input to the CA1 pyramidal dendrites, e.g., from CA3 or entorhinal cortex, will be selectively transmitted to soma and the axonic spike generation site when the cell is depolarized close to threshold, i.e., when the input can most efficiently influence the cell's spike output.
XE991 reduced dendrite-to-soma voltage attenuation below theta frequency (∼5 Hz) (Fig. 7E), thus blocking the theta bandpass filter properties in this direction, but did not affect soma-to-dendrite attenuation (Fig. 7D). Thus, strikingly, the M- and H-resonance-dependent bandpass filter mechanisms are virtually mirror images of each other in every respect, except their remarkable common preference for theta frequency.
We also used model simulations to explore the mechanisms of frequency-dependent voltage attenuation along the apical trunk (Fig. 8; traces shown in supplemental Figs. S5, S6, available at www.jneurosci.org as supplemental material). When IZAP was injected in the soma at approximately −78 mV, the soma-to-dendrite attenuation was minimal at ∼8 Hz (Fig. 8A, control), reflecting theta-selective transfer, which was abolished by turning off Ih (Fig. 8A, no Ih). In contrast, dendrite-to-soma attenuation (Fig. 8B, control) resembled more passive low-pass filtering, and turning off Ih had a much smaller effect (Fig. 8B, no Ih). These results are qualitatively similar to those we obtained experimentally (Fig. 6C–E), thus confirming that our hypotheses were sufficient to explain our observations. In contrast to the experiments (Fig. 6E), the attenuation from dendrite-to-soma (Fig. 8B, control) showed a slight resonance, which might be overlooked experimentally because of noise and variability. However, blocking Ih in the basal dendrites of the model abolished this slight resonance, suggesting that there may be little or no Ih in this part of the neuron.
Modeling signal propagation at depolarized potentials also confirmed our experimentally derived conclusions (Fig. 8C,D, solid lines; supplemental Fig. S6, available at www.jneurosci.org as supplemental material). Thus, the soma-to-dendrite transfer showed nearly no bandpass filtering and blocking IM had no effect (Fig. 8C, solid lines). In contrast, the dendrite-to-soma transfer showed clear theta resonance, which was eliminated by omitting IM (Fig. 8D, solid lines).
We also repeated the latter simulations after blocking Ih and INaP (Fig. 8C,D, dashed lines) to compare with the impact of TTX and CsCl in our experiments. Omitting Ih and INaP abolished the slight theta preference in the soma-to-dendrite attenuation (Fig. 8C, dashed lines). The dendrite-to-soma transfer (Fig. 8D, dashed lines) still showed IM-dependent theta preference, even in the absence of Ih and INaP, in agreement with our experimental results (Fig. 7E). However, without Ih and INaP the overall attenuation was stronger (Fig. 8D, compare solid and dashed lines). Additional simulations revealed that this is because INaP amplifies signals entering the soma (Stuart and Sakmann, 1995; Vervaeke et al., 2006b) (data not shown). Thus, like in the experiments, propagation along the dendrite shows theta bandpass filtering when the signal propagates toward a region with an active theta resonance mechanism, i.e., toward the soma at depolarized potential (M-resonance), and toward the dendrites at more negative potentials (H-resonance).
Cook et al. (2007) reported that the gain of the dendrite-to-soma input/output relationship varied as a function of stimulus variance. Using the model, we explored whether the stimulus amplitude affected the transfer impedance, and found no significant amplitude-dependent difference (supplemental Fig. S8, available at www.jneurosci.org as supplemental material). Thus, injection of ZAP currents of very different amplitudes, which evoked oscillations of either 1 or 12 mV peak-to-peak amplitude, revealed no differences in the transfer impedance, neither from the soma to the dendrite, nor from dendrite to soma, and neither at −65 nor at −80 mV (supplemental Fig. S8, available at www.jneurosci.org as supplemental material). Neither the gain nor the filter properties seemed to differ depending on the stimulus amplitude. However, these results cannot be directly compared with those of Cook et al. (2007), because their high-variance stimuli evoked action potentials. Therefore, spike-evoked conductances may well alter the gain properties in their experiments, unlike our study, in which purely subthreshold stimuli were used.
Thus, the dendrite-to-soma or soma-to-dendrite transfer impedance is not significantly dependent on the stimulus amplitude.
The relation between asymmetric voltage attenuation and local transfer impedances
Finally, we examined the symmetry properties of the frequency-dependent relationship between current injected at one site i, Ii, and the voltage recorded at a second point j, Vj, i.e., the transfer impedance Kij(f) = Vj/Ii. We examined how the transfer impedance related to the local impedance, Kii(f) (Figs. 1–5), and how both measures related to the voltage attenuation Aij(f) between voltages measured at the two locations i and j.
Specifically, in this paper we use the term “resonance” in the context of a linear circuit response. One property of such a circuit is that the transfer impedance is symmetrical (Koch, 1999). In other words, if a linear approximation of a dendritic tree is valid, then the ratio of the current injected at one point and the voltage measured at another point is the same as when the two locations are reversed (Koch, 1999).
We investigated this property by injecting IZAP into the dendrite and measuring the voltage at the soma, and vice versa, with experiments and simulations at approximately −78 mV (supplemental Fig. S7A,C, available at www.jneurosci.org as supplemental material) or at approximately −55 mV (supplemental Fig. S7B,D, available at www.jneurosci.org as supplemental material). The transfer impedances Kij(f) from both experiments and simulations not only showed resonance (h-channel dependent at approximately −78 mV; M-channel dependent at approximately −55 mV), they were also symmetrical under all conditions tested:
These results are consistent with the prediction of a linear model, thus confirming that the somatodendritic compartments behave as a nearly linear system at subthreshold membrane potentials, despite the demonstrated presence of a multitude of voltage-dependent conductances.
However, in contrast to this symmetry, and as we described above, the voltage attenuation Aij(f) between the site of current injection and the voltage recording site were asymmetric (Figs. 6C, 7C, 8). This can be explained as follows: Since Aij(f) is given by the ratio of the local and transfer impedances (Koch, 1999), as follows:
 |
the ratio of the voltage attenuations back and forth between two points is as follows:
 |
By Equation 1, the right side simplifies to a ratio of the local impedances at the two points:
 |
Thus, an inequality of Aij(f) and Aji(f), e.g., a direction dependence of the voltage attenuation, or transfer, can be completely accounted for by a location dependence of the local (input) impedances.
Indeed, for even a simple neuron model with a soma and a single dendrite, linear cable theory predicts that the input impedance will depend on location. In particular, for a neuron with homogeneous membrane properties, a lower somatic input impedance is expected due to the soma's larger surface to volume ratio, compared with the dendrites (Rall and Rinzel, 1973; Koch, 1999). Following directly from Equation 4, a corollary in this case is that the voltage attenuation from dendrites to the soma will be larger than that from the soma to the dendrites (Koch, 1999).
Our model and, in part our experiments, also show inequalities in input impedance and voltage attenuation, but in contrast these inequalities are exactly the opposite from that predicted by the simple model with homogeneous membrane properties. First, the input impedance at the soma was larger than at the dendrites at both hyperpolarized [Figs. 1I (experiment), 4G (model)] and depolarized potentials (Fig. 4N, model) [see also Magee (1998) and Narayanan and Johnston (2007)]. Our model accounts for this difference from the simple homogeneous neuron model because of inhomogeneous membrane properties. Specifically, in our model there is a higher density of Ih (relevant when recording at low potentials where these channels are open) (Magee, 1998) and Ileak in the distal dendrites, as well as a restricted distribution of INaP around the soma (relevant when recording near spike threshold where these channels are open) (Stuart and Sakmann, 1995; Vervaeke et al., 2006b; Kole et al., 2008) (see supplemental material, available at www.jneurosci.org). In both voltage conditions, these channel distributions make the soma impedance larger than the dendritic impedance (note that activation of the INaP inward current at the soma results in an increase of the local slope impedance) (Stuart and Sakmann, 1995; Vervaeke et al., 2006b). We do note that the model's prediction of input impedance at depolarized potentials is not reproduced in the experimental recordings (no significant different between somatic and dendritic input impedances, the latter measured within 200 μm from the soma) (Fig. 2D,I). This is explained because we were constrained to recording potentials that were insufficiently depolarized to significantly activate INaP, to avoid noise-triggered spikes during the ZAP protocols. Second, consistent with Equation 4 and again in contrast to a simple homogeneous neuron model, we found a stronger voltage attenuation from the soma to the dendrite than in the opposite direction, at both hyperpolarized [Figs. 6C (experiment), 8A,B (model)], and depolarized levels (Fig. 8D, model). Consistent with the input impedance results described above, there is an exception between our model and the experiments at depolarized potentials (Fig. 7C), again because our recording potentials did not strongly activate INaP.
To our knowledge, this is the first explicit account of centripetal versus centrifugal voltage attenuation properties that depart from a classical homogeneous neuron model. Our results recapitulate in part the detailed experimental and modeling study by Golding et al. (2005), which also focus on inhomogeneous distributions of membrane properties, particularly the leak resistance and Ih. However, while that study measured, separately, soma to dendrite voltage attenuation due to current injection, and dendrite to soma voltage attenuation with evoked EPSPs, the different protocols were not analyzed together to examine direction dependence of these attenuations.
Discussion
In this study we found experimentally and by computational modeling that CA1 pyramidal neurons not only respond preferentially to theta frequency signals locally, at the input site (local resonance), but also show complementary, theta-tuned bandpass filtering of subthreshold signals that propagate along the dendrite, in a direction- and voltage-dependent manner, i.e., depending on the state of the cell. We also tested predictions from linear cable theory regarding the frequency and direction dependence of voltage attenuation and transfer impedance, demonstrating that nonlinear membrane channels can mediate nearly linear filtering for small, physiologically relevant signal amplitudes, as the transfer impedances were symmetrical. Our data and model however contrast with linear neuron models with homogeneous membrane properties, by showing stronger voltage attenuation from the soma to the dendrite than in the opposite direction.
Functional implications
A fundamental functional implication of our results is that CA1 pyramidal cells are selectively responsive to input at theta frequency by two different mechanisms. This may extend the possibility for selective communication between neurons via resonance (Izhikevich et al., 2003), using two segregated information channels, a somatic “depolarized” one and a dendritic “hyperpolarized” one. Since both are tuned to the theta frequency band, they seem adapted for functioning within the theta-dominated hippocampal network. These dual theta resonance mechanisms are in strategic positions for interacting with the two main oscillatory inputs to the CA1 area during theta in vivo—one at the soma level, the other in the distal dendrites (Fig. 9) (Kamondi et al., 1998; Buzsáki, 2002).
Figure 9.

Interactions between dual theta resonance mechanisms and oscillatory inputs. This diagram illustrates how the two main theta-modulated oscillatory synaptic inputs to the CA1 pyramidal cell can interact with the two segregated theta resonance mechanisms in this cell type. Rhythmic firing of GABA-ergic neurons (G) in the medial septum and diagonal band of Broca (DBB) causes rhythmic inhibition of local hippocampal inhibitory interneurons (G), which in turn causes theta-modulated disinhibition (black sine curve) of the soma region/axon initial segment (AIS) of the CA1 pyramidal cell. Here, in the AIS/soma, the high density of voltage-gated Kv7/M-type potassium channels produce somatic theta-resonance (M-resonance), which is strengthened by the sodium channels underlying the persistent Na+ current (INaP), when the cell is close to spike threshold. This makes the spike generator mechanism at the AIS/soma selectively responsive to the theta-modulated disinhibition driven by the septum. It also causes direction-selective bandpass filtering of subtheta frequencies entering the AIS/soma from the apical dendrite (not illustrated). Conversely, the excitatory perforant path (PP) input from L3 cells in the entorhinal cortex (EC L3), which is the second main theta-modulated synaptic input to the CA1 pyramidal cells (gray sine curve), impinges on the distal dendrites where it can selectively interact with the highly concentrated HCN/h channels there. These h-channels, by producing local H-resonance, make the dendrites selectively responsive to the theta-modulated excitation (and inhibition; data not shown) driven by the EC. It also causes direction-selective bandpass filtering of subtheta frequencies entering the apical dendrites from the soma/AIS (not illustrated). (Modified from Buzsáki, 2002.)
Thus, the somatic M-resonance is strategically positioned to control spike generation and interact selectively with the theta-rhythmic inhibition of the soma/AIS region, driven by rhythmic input from the medial septum (Buzsáki, 2002). Since M-resonance is maximal when the cell is close to spike threshold, where inhibition has maximal driving force, this ensures optimal modulation of the spike output by M-resonance. Thus the M-resonance makes the axon initial segment spike generator mechanism selectively responsive to theta input from septum. Conversely, the H-resonance, operating further from the spike threshold, is strategically positioned to control subthreshold theta-selective filtering of excitatory input from EC to the distal dendrites (Fig. 9). However, it should be kept in mind that our dendritic whole-cell recordings were limited to the str. radiatum, and were thus unable to directly explore the most distal, thin dendrites within str. lacunosum moleculare. Nevertheless, considering the strong evidence for a high h-channel density in str. lacunosum moleculare (Lörincz et al., 2002), we expect that the local resonance effects there will be even stronger than the ones we recorded in str. radiatum, thus strengthening our conclusion of a powerful distal dendritic h-resonance mechanism strategically positioned to filter input from EC.
Furthermore, the dual M- and H-resonance seems highly relevant for the “dual oscillator” models that have been proposed to explain both the hippocampal “place fields” and the striking EC “grid cell” pattern, as well as phase precession in both regions (Hafting et al., 2005; O'Keefe and Burgess, 2005; Burgess et al., 2007; Giocomo et al., 2007). In these models, a somatic oscillation imposed by the network interacts with an intrinsic dendritic oscillation modulated by velocity-dependent synaptic input, to produce interference patterns that gives rise to phase precession (i.e., temporal coding), grid cell fields, and/or hippocampal place cell fields (O'Keefe and Burgess, 2005; Burgess et al., 2007; Lengyel et al., 2003). Note that with addition of a sufficiently strong amplifying current, such as INaP, the currents (IM, Ih) that cause resonance can also produce spontaneous intrinsic oscillations with similar frequency preference (Leung and Yim, 1991; Hutcheon and Yarom, 2000). Furthermore, channel kinetics—and hence oscillation frequency—can be modulated both by voltage and transmitters (Robinson and Siegelbaum, 2003), thus regulating dual oscillator interference (Burgess et al., 2007; Giocomo et al., 2007). According to some models, however, input from the EC grid cells provides the necessary spatial information for generation of place cells in CA1 (McNaughton et al., 2006; Moser and Moser, 2008), which would seem to render intrinsic oscillator mechanisms in CA1 unnecessary. However, these models are still speculative and there are reasons to believe that the CA1 pyramidal cells may still need to “make their own comparison” between two oscillatory inputs, as hypothesized to explain the place fields of CA1 pyramidal cells (Kamondi et al., 1998b; Magee, 2001; Lengyel et al., 2003; O'Keefe and Burgess, 2005). Our finding of two theta resonator mechanisms in individual CA1 pyramidal cells may provide indirect support for the concept of oscillatory interference within an individual hippocampal place cell. In any event, and regardless of whether a dual oscillator model holds true for CA1, the existence of two complementary and segregated theta resonance mechanisms will in any case substantially impact postsynaptic frequency selectivity, integration, and transduction (Ulrich, 2002; Cook et al., 2007; Narayanan and Johnston, 2007).
Comparison with other studies
In line with our results (supplemental Fig. S7, available at www.jneurosci.org as supplemental material), Ulrich (2002) and Cook et al. (2007) found that the transfer impedance show Ih-dependent resonance in neocortical and CA1 pyramidal neurons, respectively. However, they did not report IM-dependent resonance, possibly because they did not test at sufficiently depolarized potentials. Also, our results on local H-resonance (Fig. 1) agree with the strong resonance in distal CA1 dendrites recently reported by Narayanan and Johnston (Narayanan and Johnston, 2007). However, their most depolarized test potential (−79 mV after correction for liquid junction potential) was close to our most hyperpolarized test potential. Such hyperpolarizations beyond −79 mV strongly boost the H-resonance (Hu et al., 2002; Narayanan and Johnston, 2007), but may lead to overestimation of its effect, since it seems likely that these neurons rarely experience such strong hyperpolarizations in vivo. Thus, the reported prevailing membrane potential of rat CA1 pyramidal cells in vivo during theta and other activity was −58 to −66 mV (Kamondi et al., 1998a; Hahn et al., 2007), i.e., a range where the somatic M-resonance filtering reported here is particularly prominent.
Other types of neurons
The mechanisms described here in CA1 pyramidal cells are likely to exist in other types of neurons in which the necessary channel types coexist. For example, both Kv7/KCNQ/M-channels and INaP are found in a variety of neurons in the CNS and are likely to be concentrated in the axon initial segment and soma (Stuart and Sakmann, 1995; Cooper et al., 2001; Devaux et al., 2004; Astman et al., 2006; Vervaeke et al., 2006b; Hu et al., 2007a; Kole et al., 2008), thus providing a basis for a somatic M-resonance and related subthreshold oscillations (Gutfreund et al., 1995). Likewise, HCN/h-channels are concentrated in the dendrites of neocortical pyramidal and other neurons in the CNS (Williams and Stuart, 2000; Migliore and Shepherd, 2002) thus providing a basis for dendritic H-resonance. Furthermore, there is increasing evidence that network oscillations in the theta band have widespread importance also outside the hippocampal-EC system, including the neocortex (Kahana et al., 2001). The strong voltage dependence of the M- and H-resonance and the related direction-dependent bandpass filtering, may also enable cortical up and down states (Hahn et al., 2007; Mehta, 2007) to selectively modulate and exploit these processes for signaling, by favoring M-resonance during up states (approximately −60 mV) and H-resonance during down states (approximately −70 mV). Thus, the dual theta resonator mechanisms described here are likely to have widespread importance for neural coding in the brain.
Footnotes
This work was supported by the Norwegian Research Council (NFR) via Storforsk Grant 167182 to J.F.S.; NevroNor Grant 178892 to J.F.S.; the Norwegian Centre of Excellence programs (SFF/CMBN) to J.F.S.; and Fellowship 178670 from NFR to H.H.; an Agence Nationale de Recherche grant (FUNVISYNIN) to L.J.G.; and University of Oslo. We thank Tiago Branco, Emmanuelle Chaigneau, Mayank Mehta, Edvard Moser, Ede Rancz, Arnd Roth, Jason Rothman, and Angus Silver for helpful comments on the manuscript. The study was initiated by the Oslo team (J.F.S., K.V., H.H.). H.H. performed all experiments and data analysis. K.V. built the computational model and performed all simulations. L.G. contributed by discussing model development and results. The paper was mainly written by J.F.S., K.V., and H.H. with important contributions from L.G.
References
- Astman N, Gutnick MJ, Fleidervish IA. Persistent sodium current in layer 5 neocortical neurons is primarily generated in the proximal axon. J Neurosci. 2006;26:3465–3473. doi: 10.1523/JNEUROSCI.4907-05.2006. [DOI] [PMC free article] [PubMed] [Google Scholar]
- Borg-Graham LJ. Additional efficient computation of branched nerve equations: adaptive time step and ideal voltage clamp. J Comput Neurosci. 2000;8:209–226. doi: 10.1023/a:1008945925865. [DOI] [PubMed] [Google Scholar]
- Burgess N, Barry C, O'Keefe J. An oscillatory interference model of grid cell firing. Hippocampus. 2007;17:801–812. doi: 10.1002/hipo.20327. [DOI] [PMC free article] [PubMed] [Google Scholar]
- Buzsáki G. Theta oscillations in the hippocampus. Neuron. 2002;33:325–340. doi: 10.1016/s0896-6273(02)00586-x. [DOI] [PubMed] [Google Scholar]
- Buzsáki G. Rhythms of the brain. Oxford, UK: Oxford UP; 2006. [Google Scholar]
- Buzsáki G, Draguhn A. Neuronal oscillations in cortical networks. Science. 2004;304:1926–1929. doi: 10.1126/science.1099745. [DOI] [PubMed] [Google Scholar]
- Cantero JL, Atienza M, Stickgold R, Kahana MJ, Madsen JR, Kocsis B. Sleep-dependent theta oscillations in the human hippocampus and neocortex. J Neurosci. 2003;23:10897–10903. doi: 10.1523/JNEUROSCI.23-34-10897.2003. [DOI] [PMC free article] [PubMed] [Google Scholar]
- Chevaleyre V, Castillo PE. Assessing the role of Ih channels in synaptic transmission and mossy fiber LTP. Proc Natl Acad Sci U S A. 2002;99:9538–9543. doi: 10.1073/pnas.142213199. [DOI] [PMC free article] [PubMed] [Google Scholar]
- Cook EP, Guest JA, Liang Y, Masse NY, Colbert CM. Dendrite-to-soma input/output function of continuous time-varying signals in hippocampal CA1 pyramidal neurons. J Neurophysiol. 2007;98:2943–2955. doi: 10.1152/jn.00414.2007. [DOI] [PubMed] [Google Scholar]
- Cooper EC, Harrington E, Jan YN, Jan LY. M channel KCNQ2 subunits are localized to key sites for control of neuronal network oscillations and synchronization in mouse brain. J Neurosci. 2001;21:9529–9540. doi: 10.1523/JNEUROSCI.21-24-09529.2001. [DOI] [PMC free article] [PubMed] [Google Scholar]
- Devaux JJ, Kleopa KA, Cooper EC, Scherer SS. KCNQ2 is a nodal K+ channel. J Neurosci. 2004;24:1236–1244. doi: 10.1523/JNEUROSCI.4512-03.2004. [DOI] [PMC free article] [PubMed] [Google Scholar]
- Fricker D, Verheugen JA, Miles R. Cell-attached measurements of the firing threshold of rat hippocampal neurones. J Physiol. 1999;517:791–804. doi: 10.1111/j.1469-7793.1999.0791s.x. [DOI] [PMC free article] [PubMed] [Google Scholar]
- Giocomo LM, Zilli EA, Fransén E, Hasselmo ME. Temporal frequency of subthreshold oscillations scales with entorhinal grid cell field spacing. Science. 2007;315:1719–1722. doi: 10.1126/science.1139207. [DOI] [PMC free article] [PubMed] [Google Scholar]
- Golding NL, Mickus TJ, Katz Y, Kath WL, Spruston N. Factors mediating powerful voltage attenuation along CA1 pyramidal neuron dendrites. J Physiol. 2005;568:69–82. doi: 10.1113/jphysiol.2005.086793. [DOI] [PMC free article] [PubMed] [Google Scholar]
- Graham LJ. The Surf-Hippo Neuron Simulation System, version 3.5a. 2004. http://www.neurophys.biomedicale.univ-paris5.fr/∼graham/surf-hippo.html.
- Gutfreund Y, Yarom Y, Segev I. Subthreshold oscillations and resonant-frequency in guinea-pig cortical-neurons—physiology and modeling. J Physiol. 1995;483:621–640. doi: 10.1113/jphysiol.1995.sp020611. [DOI] [PMC free article] [PubMed] [Google Scholar]
- Hafting T, Fyhn M, Molden S, Moser MB, Moser EI. Microstructure of a spatial map in the entorhinal cortex. Nature. 2005;436:801–806. doi: 10.1038/nature03721. [DOI] [PubMed] [Google Scholar]
- Hahn TT, Sakmann B, Mehta MR. Differential responses of hippocampal subfields to cortical up-down states. Proc Natl Acad Sci U S A. 2007;104:5169–5174. doi: 10.1073/pnas.0700222104. [DOI] [PMC free article] [PubMed] [Google Scholar]
- Hines M. Efficient computation of branched nerve equations. Int J Biomed Comput. 1984;15:69–76. doi: 10.1016/0020-7101(84)90008-4. [DOI] [PubMed] [Google Scholar]
- Hoffman DA, Magee JC, Colbert CM, Johnston D. K+ channel regulation of signal propagation in dendrites of hippocampal pyramidal neurons. Nature. 1997;387:869–875. doi: 10.1038/43119. [DOI] [PubMed] [Google Scholar]
- Hu H, Vervaeke K, Storm JF. Two forms of electrical resonance at theta frequencies, generated by M-current, h-current and persistent Na+ current in rat hippocampal pyramidal cells. J Physiol. 2002;545:783–805. doi: 10.1113/jphysiol.2002.029249. [DOI] [PMC free article] [PubMed] [Google Scholar]
- Hu H, Vervaeke K, Storm JF. M-channels (Kv7/KCNQ channels) that regulate synaptic integration, excitability, and spike pattern of CA1 pyramidal cells are located in the perisomatic region. J Neurosci. 2007a;27:1853–1867. doi: 10.1523/JNEUROSCI.4463-06.2007. [DOI] [PMC free article] [PubMed] [Google Scholar]
- Hu H, Vervaeke K, Storm JF. Theta resonance regulates frequency-dependence of postsynaptic responses and transfer along the apical dendrites of hippocampal pyramidal cells. Soc Neurosci Abstr. 2007b;33 467.17. [Google Scholar]
- Hutcheon B, Yarom Y. Resonance, oscillation and the intrinsic frequency preferences of neurons. Trends Neurosci. 2000;23:216–222. doi: 10.1016/s0166-2236(00)01547-2. [DOI] [PubMed] [Google Scholar]
- Izhikevich EM, Desai NS, Walcott EC, Hoppensteadt FC. Bursts as a unit of neural information: selective communication via resonance. Trends Neurosci. 2003;26:161–167. doi: 10.1016/S0166-2236(03)00034-1. [DOI] [PubMed] [Google Scholar]
- Kahana MJ, Sekuler R, Caplan JB, Kirschen M, Madsen JR. Human theta oscillations exhibit task dependence during virtual maze navigation. Nature. 1999;399:781–784. doi: 10.1038/21645. [DOI] [PubMed] [Google Scholar]
- Kahana MJ, Seelig D, Madsen JR. Theta returns. Curr Opin Neurobiol. 2001;11:739–744. doi: 10.1016/s0959-4388(01)00278-1. [DOI] [PubMed] [Google Scholar]
- Kamondi A, Acsády L, Wang XJ, Buzsáki G. Theta oscillations in somata and dendrites of hippocampal pyramidal cells in vivo: activity-dependent phase-precession of action potentials. Hippocampus. 1998;8:244–261. doi: 10.1002/(SICI)1098-1063(1998)8:3<244::AID-HIPO7>3.0.CO;2-J. [DOI] [PubMed] [Google Scholar]
- Koch C. Biophysics of computation. Oxford, UK: Oxford UP; 1999. pp. 61–71. [Google Scholar]
- Kole MH, Ilschner SU, Kampa BM, Williams SR, Ruben PC, Stuart GJ. Action potential generation requires a high sodium channel density in the axon initial segment. Nat Neurosci. 2008;11:178–186. doi: 10.1038/nn2040. [DOI] [PubMed] [Google Scholar]
- Lee AK, Manns ID, Sakmann B, Brecht M. Whole-cell recordings in freely moving rats. Neuron. 2006;51:399–407. doi: 10.1016/j.neuron.2006.07.004. [DOI] [PubMed] [Google Scholar]
- Lengyel M, Szatmáry Z, Erdi P. Dynamically detuned oscillations account for the coupled rate and temporal code of place cell firing. Hippocampus. 2003;13:700–714. doi: 10.1002/hipo.10116. [DOI] [PubMed] [Google Scholar]
- Leung LS, Yu HW. Theta-frequency resonance in hippocampal CA1 neurons in vitro demonstrated by sinusoidal current injection. J Neurophysiol. 1998;79:1592–1596. doi: 10.1152/jn.1998.79.3.1592. [DOI] [PubMed] [Google Scholar]
- Leung LW, Yim CY. Intrinsic membrane potential oscillations in hippocampal neurons in vitro. Brain Res. 1991;553:261–274. doi: 10.1016/0006-8993(91)90834-i. [DOI] [PubMed] [Google Scholar]
- Lörincz A, Notomi T, Tamás G, Shigemoto R, Nusser Z. Polarized and compartment-dependent distribution of HCN1 in pyramidal cell dendrites. Nat Neurosci. 2002;5:1185–1193. doi: 10.1038/nn962. [DOI] [PubMed] [Google Scholar]
- Magee JC. Dendritic hyperpolarization-activated currents modify the integrative properties of hippocampal CA1 pyramidal neurons. J Neurosci. 1998;18:7613–7624. doi: 10.1523/JNEUROSCI.18-19-07613.1998. [DOI] [PMC free article] [PubMed] [Google Scholar]
- Magee JC. Dendritic Ih normalizes temporal summation in hippocampal CA1 neurons. Nat Neurosci. 1999;2:848. doi: 10.1038/12229. [DOI] [PubMed] [Google Scholar]
- Magee JC. Dendritic mechanisms of phase precession in hippocampal CA1 pyramidal neurons. J Neurophysiol. 2001;86:528–532. doi: 10.1152/jn.2001.86.1.528. [DOI] [PubMed] [Google Scholar]
- McNaughton BL, Battaglia FP, Jensen O, Moser EI, Moser MB. Path integration and the neural basis of the ‘cognitive map’. Nat Rev Neurosci. 2006;7:663–678. doi: 10.1038/nrn1932. [DOI] [PubMed] [Google Scholar]
- Mehta MR. Cortico-hippocampal interaction during up-down states and memory consolidation. Nat Neurosci. 2007;10:13–15. doi: 10.1038/nn0107-13. [DOI] [PubMed] [Google Scholar]
- Mehta MR, Lee AK, Wilson MA. Role of experience and oscillations in transforming a rate code into a temporal code. Nature. 2002;417:741–746. doi: 10.1038/nature00807. [DOI] [PubMed] [Google Scholar]
- Migliore M, Shepherd GM. Emerging rules for the distributions of active dendritic conductances. Nat Rev Neurosci. 2002;3:362–370. doi: 10.1038/nrn810. [DOI] [PubMed] [Google Scholar]
- Moser EI, Moser MB. A metric for space. Hippocampus. 2008;18:1142–1156. doi: 10.1002/hipo.20483. [DOI] [PubMed] [Google Scholar]
- Narayanan R, Johnston D. Long-term potentiation in rat hippocampal neurons is accompanied by spatially widespread changes in intrinsic oscillatory dynamics and excitability. Neuron. 2007;56:1061–1075. doi: 10.1016/j.neuron.2007.10.033. [DOI] [PMC free article] [PubMed] [Google Scholar]
- O'Keefe J, Burgess N. Dual phase and rate coding in hippocampal place cells: theoretical significance and relationship to entorhinal grid cells. Hippocampus. 2005;15:853–866. doi: 10.1002/hipo.20115. [DOI] [PMC free article] [PubMed] [Google Scholar]
- O'Keefe J, Recce ML. Phase relationship between hippocampal place units and the EEG theta rhythm. Hippocampus. 1993;3:317–330. doi: 10.1002/hipo.450030307. [DOI] [PubMed] [Google Scholar]
- Rall W, Rinzel J. Branch input resistance and steady attenuation for input to one branch of a dendritic neuron model. Biophys J. 1973;13:648–687. doi: 10.1016/S0006-3495(73)86014-X. [DOI] [PMC free article] [PubMed] [Google Scholar]
- Robinson RB, Siegelbaum SA. Hyperpolarization-activated cation currents: from molecules to physiological function. Annu Rev Physiol. 2003;65:453–480. doi: 10.1146/annurev.physiol.65.092101.142734. [DOI] [PubMed] [Google Scholar]
- Shah MM, Migliore M, Valencia I, Cooper EC, Brown DA. Functional significance of axonal Kv7 channels in hippocampal pyramidal neurons. Proc Natl Acad Sci U S A. 2008;105:7869–7874. doi: 10.1073/pnas.0802805105. [DOI] [PMC free article] [PubMed] [Google Scholar]
- Staff NP, Jung HY, Thiagarajan T, Yao M, Spruston N. Resting and active properties of pyramidal neurons in subiculum and CA1 of rat hippocampus. J Neurophysiol. 2000;84:2398–2408. doi: 10.1152/jn.2000.84.5.2398. [DOI] [PubMed] [Google Scholar]
- Stuart G, Sakmann B. Amplification of EPSPs by axosomatic sodium channels in neocortical pyramidal neurons. Neuron. 1995;15:1065–1076. doi: 10.1016/0896-6273(95)90095-0. [DOI] [PubMed] [Google Scholar]
- Ulrich D. Dendritic resonance in rat neocortical pyramidal cells. J Neurophysiol. 2002;87:2753–2759. doi: 10.1152/jn.2002.87.6.2753. [DOI] [PubMed] [Google Scholar]
- Vervaeke K, Gu N, Agdestein C, Hu H, Storm JF. Kv7/KCNQ/M-channels in rat glutamatergic hippocampal axons and their role in regulation of excitability and transmitter release. J Physiol. 2006a;576:235–256. doi: 10.1113/jphysiol.2006.111336. [DOI] [PMC free article] [PubMed] [Google Scholar]
- Vervaeke K, Hu H, Graham LJ, Storm JF. Contrasting effects of the persistent Na+ current on neuronal excitability and spike timing. Neuron. 2006b;49:257–270. doi: 10.1016/j.neuron.2005.12.022. [DOI] [PubMed] [Google Scholar]
- Williams SR, Stuart GJ. Site independence of EPSP time course is mediated by dendritic I(h) in neocortical pyramidal neurons. J Neurophysiol. 2000;83:3177–3182. doi: 10.1152/jn.2000.83.5.3177. [DOI] [PubMed] [Google Scholar]