

Abstract
In motor and sensory areas of cortex, neuronal activity often depends on the location of a movement target or a sensory stimulus, with each neuron tuned to a single part of space called a preferred direction (when motor) or a receptive field (when sensory). As we previously reported, some neurons in the monkey prefrontal cortex are tuned to two parts of space, which we interpreted as reflecting attention and working memory, respectively. Monkeys performed a behavioral task in which they attended to a visual stimulus at one location while remembering a second place, and these locations were varied from trial to trial to assess spatial tuning. Most spatially tuned neurons specialized in either attentional or mnemonic processing, but about one-third of the cells showed tuning for both. Here, we show that the latter population, called multitasking neurons, improves the encoding of both the attended and remembered locations. These neurons do so for three reasons: (1) the preferred directions for attention and for working memory usually differ (and often diametrically oppose one another), (2) they have stronger tuning than specialized cells, and (3) pairs of multitasking neurons represent these cognitive parameters more efficiently than pairs that include even a single specialized cell. These findings suggest that multitasking neurons provide a computational advantage for behaviors that place simultaneous demands on two or more cognitive processes.
Introduction
Although spatial attention and spatial working memory have much in common, we often need to separate attentional and mnemonic processing. Imagine, for example, searching for a lost contact lens. It is advantageous to remember which places have already been inspected and to direct attention only to the current site of scrutiny. Otherwise, attention would return to locations that had already been inspected and an already difficult detection task would become nearly impossible. Little is known, however, about how the brain represents and independently controls spatial attention and spatial memory. To assess the role of the prefrontal cortex in these two different cognitive operations, we trained monkeys to remember one location while attending to a visual stimulus somewhere else.
In a previous study based on the present data (Lebedev et al., 2004), we demonstrated that the activity of neurons in the dorsolateral prefrontal cortex (PFdl) of monkeys cannot be accounted for solely in terms of working memory. The monkeys performed a task requiring covert attention to a visual stimulus at one location and the simultaneous memory of a second location, with both varying from trial to trial. We found neuronal representations of both attended and remembered locations, which were primarily carried by two separate groups of specialized neurons. Neurons specialized for attentional processing (attention cells) strongly outnumbered those specialized for mnemonic processing (working-memory cells). A third group of spatially tuned neurons, however, simultaneously represented both the attended and remembered locations. These neurons were named “hybrid cells” in our previous report (Lebedev et al., 2004) but are referred to as “multitasking neurons” here. Specialized attention and memory cells, alone, could account for the ability to distinguish attended locations from remembered ones. We therefore wanted to know what advantage, if any, the multitasking neurons provided.
In an attempt to gain insight into this problem, the present analysis paid special attention to the characterization and comparison of spatial preferences for attention and memory. In our previous analysis, we assessed spatial preferences by determining the “best” attended location (i.e., the attended location associated with the greatest firing rate) and the best remembered location for each multitasking neuron. We found that these best locations often differed for the two cognitive processes, but in recognition of the coarse nature of a best-location measure for spatial tuning, we did not pursue this comparison in any detail (Lebedev et al., 2004). Here, we use vector summation and regression methods to characterize the spatial preferences of each cell. Unlike best locations, these measures of spatial preference are continuous, which allows a comparison of attention and memory tuning in finer detail. In addition, the previous analysis excluded special “control” trials, which still necessitated covert attention to a location but did not require remembering a second location. Here, we both included and excluded these trials.
Materials and Methods
Behavioral paradigm.
As reported previously (Lebedev et al., 2004), two adult, male rhesus monkeys (Macaca mulatta), called monkey Z and monkey H, were trained to simultaneously remember one location and covertly direct their attention to another location, all while maintaining central fixation.
The monkey sat comfortably in a primate chair with its head restrained so that it faced a computer monitor 57 cm away. The monkey initiated each trial by manually depressing a waist-high metal button attached to its chair, which caused a fixation point (0.2° diameter) to appear in the center of the monitor. The monkey had to maintain fixation of this central point until receiving the “go” signal, which occurred much later in the trial (see below). After 1.0–1.5 s of fixation, a filled, gray circle (2° diameter) appeared 8° from the fixation point at one of four locations: left, right, up, or down from the fixation point. The circle was stationary for 1.0–1.5 s and then began to revolve (at 90°/s) along a circular trajectory centered at the fixation point. It eventually stopped at one of the same four locations (see Fig. 1a) (i.e., left, right, up, or down from the central fixation point). At a variable time, 1.0–2.5 s after stopping (see Fig. 1b), the circle brightened or dimmed (see Fig. 1c) and then disappeared 150 ms later. This brightness change served as the go signal, which instructed the monkey to make a specific saccadic eye movement (see Fig. 1d) within 2.0 s. If the circle brightened (see Fig. 1c,d, top), the monkey was required to saccade to the location where the circle originated on that trial, called the “remembered” location; whereas, if the circle dimmed (see Fig. 1c,d, bottom), the monkey was required to saccade to the current location of the circle. We refer to the current location of the circle as the “attended” location because the monkey had to detect the subtle change in the luminance of the circle to determine both when and where to saccade.
Figure 1.

The sequence of events in an example trial of the behavioral task. The monkey is shown from above facing a video screen, and the monkey's fixation target is depicted by the converging dashed lines. a, The monkey fixated a light spot at the center of the screen. Then a gray circle appeared at one of four locations: right, up, left, or down from fixation (up depicted). The circle then revolved (curved arrow) around the fixation spot and stopped right, up, left, or down from fixation (right depicted), thus initiating the delay period (b). b, The monkey had to maintain central fixation while remembering the starting place of the circle and attending to its final location. c, After a variable delay period, the circle brightened (top) or dimmed (bottom) briefly (the go signal) and then disappeared. d, Brightening instructed a saccadic eye movement (white arrow) to the remembered location (top); dimming instructed a saccade to the attended location (bottom).
Eye position was monitored with an infrared oculometer and sampled at 250 Hz. Once a saccade began, the central fixation point disappeared and, if the correct saccade was made, a new fixation point appeared at the corresponding peripheral location. The monkey was required to fixate this point until it dimmed 1.0–1.5 s later, at which point the monkey had to release the manual button within 2.0 s to obtain a juice reward.
For each possible combination of the remembered and attended locations, the monkey had to complete one correct trial in which the circle brightened and one correct trial in which it dimmed before any trial type was repeated. A computer randomly selected among these trial types, with error trials being returned to the pool of remaining trial types. When the remembered and attended locations were opposite one another, the circle revolved 180° in a randomly selected direction (either clockwise or counterclockwise). For all other trials, procedures for the two monkeys differed. For monkey Z, the circle always took the shortest route to its final location. When the remembered and attended locations were 90° apart (see Fig. 1), the circle revolved 90° and on control trials, when the initial and final location of the circle were the same, the circle did not move. For monkey H, the circle revolved either 90 or 270° to go between remembered and attended locations that were 90° apart. On control trials, the circle either did not move or revolved 360° in a randomly determined direction. For monkey H, whether the circle traveled 90 or 270° and whether or not it moved on control trials was determined randomly. All variable durations were also chosen randomly in 50 ms increments.
Neuronal recording.
After training, recording chambers were mounted over the left PFdl of monkey H and over the left and right PFdl of monkey Z. For monkey Z, neuronal recordings were conducted using a single-electrode microdrive, whereas for monkey H, a seven-electrode microdrive was used (Thomas Recording). Neural signals were amplified, filtered and discriminated using the Multi-spike discriminator (Alpha Omega Engineering). Single units were isolated as the monkey performed the behavioral task and discriminated on the basis of waveform shape, interspike intervals, and a signal-to-noise ratio exceeding 3:1. On completion of recording, we examined 40-μm-thick Nissl-stained sections from the left frontal cortex of monkey H and the right frontal cortex of monkey Z to determine the cytoarchitectonic properties of areas with recording sites.
Data analysis.
The neuronal discharge data were first separated into the 16 combinations of remembered and attended locations, and organized in a 4 × 4 matrix. In this matrix, the four remembered locations were plotted as rows and the four attended locations were plotted as columns (see Fig. 2a,c). Note, however, that for control trials (corresponding to the major diagonal of this matrix) the circle remained at or returned to the single location of interest, so there was no requirement to remember an unmarked location that was distinct from the focus of covert attention. The mean neuronal firing rate during the 800 ms before the go signal was then calculated for each trial. Neuronal tuning was assessed using a two-way ANOVA, with the independent variables remembered and attended location as factors and the trial-by-trial firing rate as the replicated dependent variable. Each factor had four levels (right, up, left, and down), which produced 15 df [(4 × 4) − 1]. In this and in all other statistical tests, we used the conventional α level of 0.05 as the criterion for rejecting the null hypothesis.
Figure 2.

Two examples of neurons specialized for either attention (a) or working memory (c). Correct brightening and dimming trials were grouped into a 4 × 4 matrix according to the remembered location (rows) and attended location (columns). Neuronal activity in each trial was aligned on the go signal (vertical line in spike raster), and firing rates were assessed for the preceding 800 ms of the variable delay period. The 16 spike density functions show average activity across like trials in spikes per second (sp/s). a, A cell most active when the monkey attended to the right (blue rectangle). b, For the cell in a, polar tuning curves for attention (blue, solid line) and memory (red, dashed line), and the attention PD (blue arrow). c, A working-memory neuron most active for holding the upward location in memory (red rectangles). d, For the cell in c, polar tuning curves for attention (blue, dashed line) and memory (red, solid line), and the working-memory PD (red arrow). Both example neurons were recorded in the left hemisphere of monkey Z.
To determine the preferred working-memory location of each neuron, a mean firing rate for each remembered location was obtained by averaging the firing rates for all trials in the same row of the 4 × 4 matrix (i.e., averaging across attended locations). The preferred remembered location was described as a vector, with its tail at the fixation point, and was computed as the sum of four vectors, each pointing in one of the four cardinal directions from the fixation point and scaled according to the mean firing rates for the remembered location in that direction. We call this vector the working-memory preferred-direction vector, abbreviated as the “working-memory PD.” An analogous procedure produced the attention preferred-direction vector of each neuron (the “attention PD”), except that the mean firing rates were computed by averaging all trials within a column (i.e., averaging across the remembered locations).
The magnitude of each preferred-direction vector was used to quantify tuning strength. Statistical comparisons of tuning strength were performed with Wilcoxon's signed rank test (paired comparisons) or Wilcoxon's rank sum test (unpaired comparisons). For most of the comparisons, the sample size was sufficient for a normal approximation to determine the critical value for these tests. We therefore report a Z-statistic for these comparisons, although the tests are nonparametric (MATLAB; Mathworks).
As noted above, the major diagonal of the 4 × 4 matrix corresponds to trials without the requirement to remember an unmarked location that differed from an attended location. Neuronal activity on these diagonal trials might therefore be expected to differ from that on trials with distinct remembered and attended locations (i.e., trials off the major diagonal). Such differences could influence the two-way ANOVA and PD calculations described above. To assess the potential for such an influence, we compared trial-by-trial firing rates on and off the major diagonal for each neuron (Wilcoxon's rank sum test). Cells with and without a significant difference in firing rate were evaluated separately to test whether our central finding could be attributed to an activity difference between the diagonal and off-diagonal trial types.
In addition, we repeated two analyses using only trials with distinct remembered and attended locations (i.e., trials off the major diagonal). First, neurons exhibiting a main effect of remembered location with the two-way ANOVA, which included the major-diagonal trials, were retested using a one-way ANOVA that excluded these trials. Second, to obtain an alternative measure of the attention and working memory PD of each cell, we applied a linear regression method to the off-diagonal trials. Trial-by-trial firing rates were fit using the following function: Firing rate = a · Xmem + b · Ymem + c · Xatt + d · Yatt + constant, where (Xmem, Ymem) is (±1, 0) for the right and left remembered locations, respectively, and (0, ±1) for the up and down remembered locations, respectively. Similarly, the value of (Xatt, Yatt) depended on the attended location. The regression coefficients were then used to determine the PD angles: working-memory PD = tan−1 (b/a); attention PD = tan−1 (d/c).
Neuron-dropping curves.
The robustness of the prefrontal representation of the attended and remembered locations was assessed by computing neuron-dropping curves. These were computed as in our previous study (Lebedev et al., 2004), which followed the method of Wessberg et al. (2000) except that here we included trials from the major diagonal, selected neurons based on the two-way ANOVA described above, and increased the total number of iterations to 16,000. The analysis began with an ensemble of n neurons, selected at random from the population of a particular class of cells (attention, working-memory, or multitasking neurons). Note that neurons in an ensemble were, in general, not recorded simultaneously. For each of the n neurons, one trial of a particular type (i.e., a conjunction of an attended and remembered location) was randomly selected and temporarily removed. The firing rate of the neuron was then averaged for each of the 16 trial types across all trials, except the one removed. The difference in firing rate between the selected trial and the average rate for each trial type was ranked between 1 and 16, with 1 indicating the closest match. The selected trials were classified as being of the trial type with the smallest sum of ranks across the n selected neurons. If this classified trial type and the actual trial type had the same attended location, then classification of the attended location was correct, and if they had the same remembered location, then classification of the remembered location was correct. This procedure was repeated 1000 times for each of the 16 trial types to compute a percentage of correct classifications for both attended and remembered locations. Classification performance was assessed at a variety of ensemble sizes. The calculation of performance versus ensemble size was repeated 16 times. The neuron-dropping curves show the average of the performance on these 16 runs. The width of the curve extends ±1 SD around the average.
Results
The database comprised 957 PFdl neurons located in three hemispheres of the two monkeys. The vast majority of cells were located in Walker's area 46. During the last 800 ms of the variable delay period (Figs. 1b, 2), the monkeys had to covertly attend to the gray circle at one peripheral location while remembering where the circle had originally appeared on that trial. During this interval, the monkeys could not know whether the go cue would arrive in 1000 ms, in 2500 ms, or some time in between. The monkeys correctly made a saccade to the remembered location on 84.6% of trials in which the circle brightened and made a saccade to the attended location on 96.6% of trials in which the circle dimmed. For monkey Z, performance (±SE) on these two trial types was 88.8 ± 0.5 and 95.6 ± 0.5% correct, respectively (189 sessions). Performance for monkey H was 76.3 ± 0.8 and 98.7 ± 0.1% correct, respectively (95 sessions, excluding trials in which the circle revolved 360°). Only correctly executed trials were included in the present analysis.
We begin by categorizing PFdl neurons based on spatial tuning during the delay period, just prior to the go cue. Cells were classified as specialized if they exhibited significant spatial tuning for attention or for working memory or as multitasking neurons if they contributed significantly to both processes. In the following section, we characterize the strength and spatial uniformity of these two cognitive representations. The subsequent section concerns the capacity of multitasking neurons to represent different parts of space for purposes of attention and working memory and the advantages of these cells over specialized neurons. The final section of Results addresses whether spatial preferences changed over time by looking at how neurons are spatially tuned before the delay period and during the behavioral response period.
Effects analysis for attention and working-memory tuning
Main effects
For each neuron, we assessed whether neuronal activity in the 800 ms preceding the go cue was modulated significantly by the location the monkey had to remember or by the location the monkey had to attend (two-way ANOVA, α = 0.05). Over one-half of the recorded neurons (58%; 556 of 957) were spatially tuned, in that at least one main effect was statistically significant.
Consistent with our previous report (Lebedev et al., 2004), most of the spatially tuned neurons (71%; 392 of 556) exhibited a single main effect, and were thus specialized for either working memory or for attention. The remaining spatially tuned neurons (29%; 164 of 556), called multitasking neurons in this study, exhibited both main effects. In what follows, we first characterize the working memory and attention tuning of the spatially tuned neurons, in turn, and then compare these two types of tuning for individual neurons.
Figure 2 shows two examples of specialized neurons, defined as neurons showing only one of the two possible main effects in the delay period preceding the go cue. Figure 2a shows the activity of an example neuron that was tuned exclusively for the attended location. The delay period activity of the neuron was highest when the monkey attended to the right (first column). Figure 2c shows the activity of a neuron that was significantly tuned for the remembered location, but not for the attended location. The highest delay period firing rate of this neuron occurred when the monkey had to remember the upper location (second row).
Of the neurons exhibiting a single main effect during the delay period, the number exhibiting a main effect of attended location (N = 297; attention neurons) was threefold larger than the number exhibiting a main effect of remembered location (N = 95; working-memory neurons). Attention neurons were twice as common as working-memory neurons (172 vs 83) in monkey H and 10 times as common in monkey Z (125 vs 12). Thus, for both monkeys, more PFdl neurons encoded where a monkey was attending than encoded the remembered location. This finding confirmed our previous report (Lebedev et al., 2004). The exact number of tuned neurons and the proportion of each type of tuning reported here differ somewhat because of differences in statistical methods and because the present analysis includes trials on the major diagonal of the 4 × 4 matrix (see Materials and Methods).
On trials from the major diagonal, there was no unmarked location that had to be remembered. To assess the possible influence of these trials on the present results, especially regarding memory tuning, we compared activity for trials from the major diagonal with those off it. Significant differences (Wilcoxon's rank sum test) in activity between on-diagonal and off-diagonal trials were more common for multitasking neurons than for specialized neurons (35% of multitasking neurons vs 16% of working-memory neurons and 14% of attention neurons). Despite these differences, post hoc tests showed that most cells preserved their tuning for the remembered location after trials from the major diagonal were excluded from analysis. Of the neurons that exhibited a main effect of remembered location in the two-way ANOVA, most (81%; 210 of 259) remained significantly tuned for the remembered location when only data from trials with distinct attended and remembered locations were analyzed (one-way ANOVA). This post hoc test was significant for 79% (58 of 73) of cells with a significant difference of activity between the diagonal and off-diagonal trials and 82% (152 of 186) of cells without a significant difference. Tuning for the remembered location remained significant for 69% (66 of 95) of working-memory neurons and 88% (144 of 164) of multitasking neurons (88%). Furthermore, for both cell types, the best remembered location was typically the same (88%; 185 of 210) whether assessed with or without the major-diagonal trials.
Interaction effects
There was a significant interaction (ANOVA) between attended location and remembered location for 164 neurons. Nearly one-half (49%) of the multitasking neurons (i.e., cells with both main effects) also exhibited an interaction effect, but a much smaller percentage of the specialized neurons did so (16% of working-memory neurons and 15% of attention neurons). Among neurons exhibiting neither main effect, significant interaction terms occurred at approximately chance levels (6% of untuned neurons).
In total, 40% (223 of 556) of the spatially tuned neurons were significantly involved in both attention and working memory during the delay period either by virtue of exhibiting two main effects or a main effect plus an interaction effect. Coincidentally, the number of spatially tuned cells with significant interaction effects precisely equaled the number that had both main effects (N = 164 for both; 29%). These cell counts were in close agreement for both monkey H (N = 57 and 55, respectively; 18%) and monkey Z (N = 107 and 109, respectively; 44%).
Vector analysis for attention and working-memory tuning
The strength and directionality of tuning for attention and for working memory were assessed for each neuron by computing a preferred direction vector (PD) for each cognitive operation (see Materials and Methods). For the neuron shown in Figure 2a, the average firing rate for each of the four attended locations (columns) is shown on the polar plot in Figure 2b by the solid blue line. The blue arrow shows the attention PD, which is the vector sum of these four component vectors. The dashed red line shows the average activity of this neuron for each remembered location. The resultant working-memory PD for this neuron is very small (data not shown). Figure 2d shows the working-memory PD corresponding to Figure 2c (red arrow). This cell has a very small attention PD (data not shown). Thus, for these two example cells, attention tuning was much stronger than working memory tuning in one of them (Fig. 2a,b) and vice versa in the other (Fig. 2c,d). To determine which example better represented the population of PFdl neurons, we examined the magnitudes of the working-memory and attention PDs across the population.
For neurons exhibiting at least one main effect in the two-way ANOVA, the average magnitude of the attention PD was significantly greater than the average magnitude of the working-memory PD [Wilcoxon's signed rank test, p ≪ 0.001 for each of the following comparisons; both monkeys: 5.5 vs 2.7 spikes/s (sp/s), N = 556, Z = −11.3; monkey H: 3.0 vs 1.9 sp/s, N = 310, Z = −5.6; monkey Z: 8.6 vs 3.7 sp/s, N = 246, Z = −9.8]. Thus, the activity of spatially tuned PFdl neurons was more modulated by attention than by working memory, which confirms our previous report (Lebedev et al., 2004). The present analysis extends the previous one by taking into account the spatial relationships of the conditions being compared, an inherent aspect of PD analysis that our previous analysis ignored. When the untuned cells were included in the comparison, the basic result remained the same (p ≪ 0.001 for each comparison; both monkeys: 3.7 vs 2.1 sp/s, N = 957, Z = −10.4; monkey H: 2.0 vs 1.5 sp/s, N = 657, Z = −4.9; monkey Z: 7.3 vs 3.3 sp/s, N = 300, Z = −9.9). At the single-cell level, attention tuning was stronger than working-memory tuning for 70% (390 of 556) of neurons exhibiting at least one main effect and for 62% (593 of 957) of all recorded neurons.
The preceding paired statistical comparisons could reflect the fact that more neurons exhibited a main effect of attended location than remembered location and not that attention tuning was more robust. We therefore compared the average magnitude of the attention PD across the 461 neurons with a main effect of attended location with the average magnitude of the working-memory PD across the 259 neurons with a main effect of remembered location. (The 164 multitaking neurons contributed to both groups.) Variation in the attended location modulated neuronal activity by 50% more than did variation in the working-memory location (Wilcoxon's rank sum test, p < 0.002; 6.4 vs 4.3 sp/s, Z = −3.2). Attention tuning remained significantly stronger when the multitasking neurons were excluded (p < 0.001; 5.6 vs 3.2 sp/s, Z = −3.8).
Attention PD distribution
Figure 3a shows the angular distribution of attention PDs across all 461 neurons that exhibited significant tuning for the attended location. The contribution from attention cells is shown in blue, and the contribution from multitasking neurons is shown in purple (as well as separately in Fig. 3c). The distributions for the two cell types did not differ significantly (Watson's test, U2 = 0.05; p > 0.5). Note that the horizontal axis does not run from right to left as it did in Figure 2, b and d, but rather from contralateral to ipsilateral, thus representing direction relative to the hemisphere of each recorded neuron.
Figure 3.
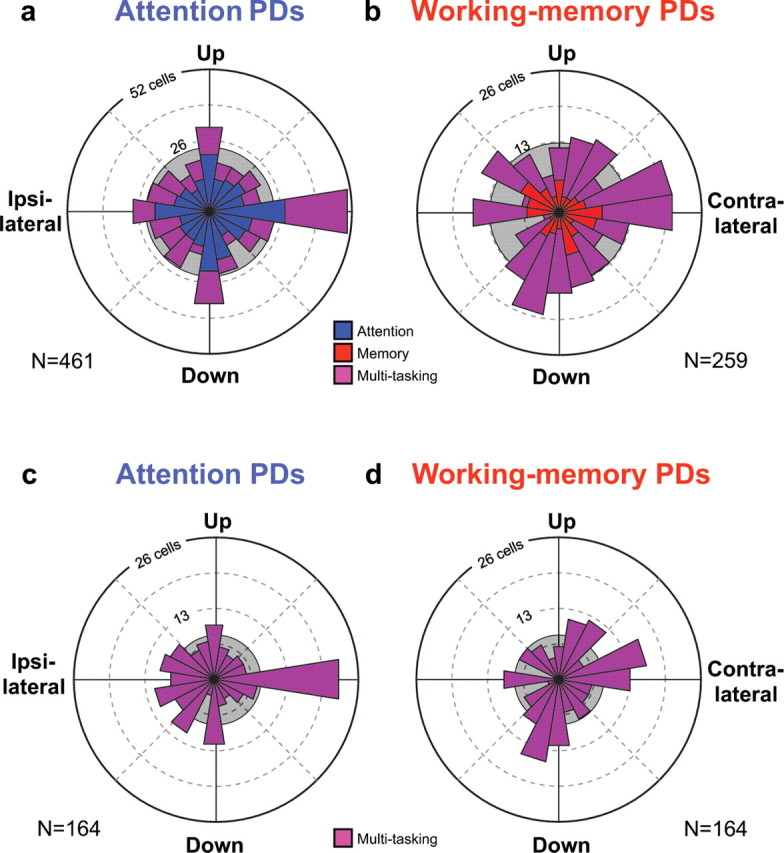
Spatial distribution of attention and working-memory PDs. a, The radius of the circular histogram shows the number of neurons with attention PDs in each 18° bin. The population includes 297 attention neurons (blue) and 164 multitasking neurons (purple). b, Distribution of working-memory PDs, plotted at one-half the scale of distribution (a). This population includes 95 working-memory neurons (red) and the 164 multitasking neurons (purple). Distribution of attention PDs (c) and working-memory PDs (d) for multitasking cells only. The PD distributions all differed significantly from a uniform distribution (shaded circles), and both attention PD distributions (a, c) exhibited a significant bias toward the cardinal directions.
The representation of attended directions was highly nonuniform, a result that was statistically significant (χ2 test, χ2 = 56.1; df = 19; p ≪ 0.001). Although all possible attended directions were represented in PFdl, the cardinal axes were disproportionately represented. Nearly one-third (144 of 461; 31%) of the attention PDs fell in one of the four cardinal bins, although these comprised only one-fifth of all bins (18° bin size). We compared the number of attention PDs in the four cardinal bins with the number in the 16 noncardinal bins, and found the former to be significantly higher than would be expected for a uniform distribution (χ2 test, χ2 = 36.4; df = 1; p ≪ 0.001). Each monkey exhibited this bias of attention PDs for the cardinal directions (monkey H: χ2 = 6.7, p < 0.01, N = 227; monkey Z: χ2 = 35.0, p ≪ 0.001, N = 234). In addition, the bias of attention PDs toward the cardinal directions was significant for both attention neurons (χ2 = 21.0; p ≪ 0.001; N = 297) (Fig. 3a, blue) and multitasking neurons (χ2 = 15.6; p ≪ 0.001; N = 164) (Fig. 3c). As will be described below, the cardinal-direction bias of multitasking neurons could be traced to a subset of these cells (see Fig. 6).
Figure 6.
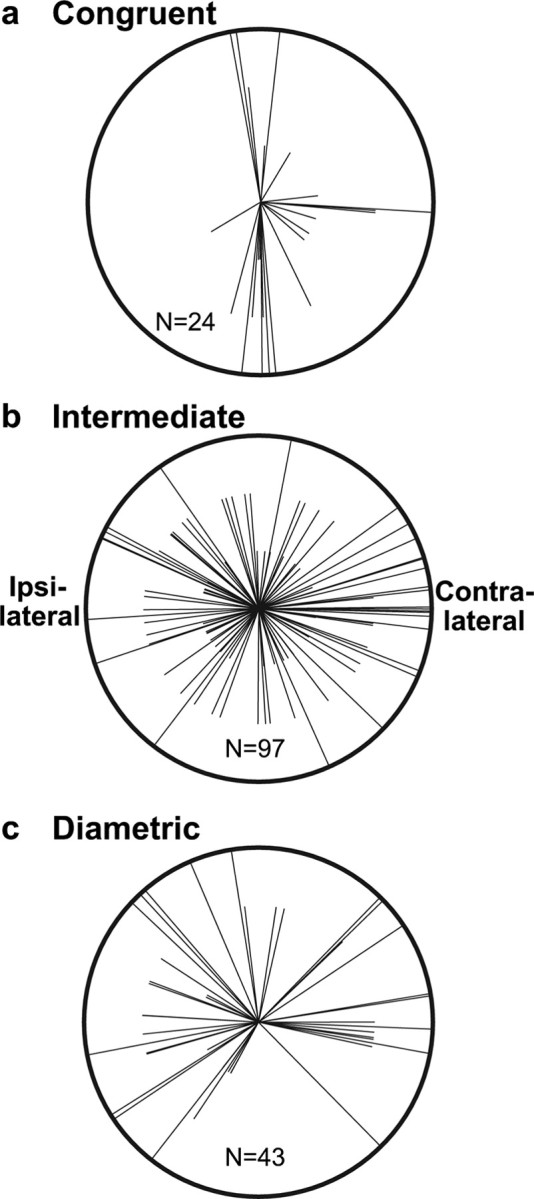
Distribution of attention PD directions and magnitudes. Each radial line shows the attention PD of one multitasking neuron. The line lengths correspond to attention PDs of small (<3 sp/s), medium, and large (>7.5 sp/s) magnitude. The attention PDs of congruent multitasking neurons (a) showed a significant bias toward the cardinal directions. This bias was absent for multitasking neurons with intermediate angles between their PDs (ΔΦ = 22.5–157.5°) (b) and for diametric multitasking neurons (c). The right side of each circle corresponds to the direction contralateral to the recorded neuron.
More of the attention PDs shown in Figure 3a pointed contralateral than pointed up, ipsilateral, or down (±9°). This difference between the representation of the four cardinal directions was significant for the combined distribution (χ2 test, χ2 = 8.8; df = 3; p < 0.05) and for just the multitasking neurons (Fig. 3c) (n = 23, 10, 8, and 12, respectively; χ2 = 10.2; df = 3; p < 0.02) but not for just the attention neurons (Fig. 3a, blue) (n = 28, 21, 20, and 22, respectively; χ2 = 1.7; df = 3; p = 0.6). We performed pairwise comparisons between the counts in the cardinal directions (χ2 test; df = 1) for both the combined distribution (Fig. 3a) and the multitasking neurons alone (Fig. 3c). Only counts for the contralateral direction differed significantly from the others [specifically the upward (p < 0.05) and ipsilateral (p < 0.01) directions, with a nonsignificant “trend” for the downward direction (p < 0.07)]. Note that the overrepresentation of the contralateral direction was specific to PD vectors near the horizontal axis (±9°) and did not reflect a bias for the contralateral hemifield as a whole. The attention PD vectors were nearly evenly split between the contralateral and ipsilateral hemifields for both attention neurons (155 vs 142) and multitasking neurons (80 vs 84).
Working-memory PD distribution
Figure 3b shows the angular distribution of working-memory PDs across all 259 neurons that exhibited significant tuning for the remembered location. The distributions for working-memory cells (red) and multitasking neurons (purple) were combined because they did not significantly differ (Watson's test, U2 = 0.10; p > 0.2). Tuning for the remembered location was less common than tuning for the attended location (259 vs 461 neurons), so the radial scale used in Figure 3b is one-half that used in Figure 3a.
Figure 3b shows that the working-memory PDs were nonuniformly distributed (χ2 test, χ2 = 32.0; df = 19; p < 0.05), although the departures from uniformity were not as pronounced as those for attention PDs (Fig. 3a). We tested whether there was a bias for the cardinal versus noncardinal directions and, in contrast to the attention PD distribution, this difference did not reach statistical significance for the working-memory PDs (χ2 test, χ2 = 3.6; df = 1; p = 0.06). There was also no significant difference in the number of working-memory PDs that pointed contralaterally, upward, ipsilaterally, and downward (n = 21, 12, 16, and 15, respectively; χ2 test, χ2 = 2.6; df = 3; p = 0.5).
We assessed the working-memory PD distributions of the 95 working-memory neurons (Fig. 3b, red) and the 164 multitasking neurons (Fig. 3d) separately and found that neither had a cardinal bias or a significant difference among the four cardinal directions (p > 0.1 in all cases). Thus, although PFdl neurons did not represent all remembered directions with equal likelihood, this nonuniformity could not be attributed to overrepresentation or underrepresentation of the cardinal directions as a group or any particular cardinal direction.
Comparison of attention and working-memory PD distributions
As mentioned above, both the attention PD (Fig. 3a) and the working-memory PD (Fig. 3b) distributions were significantly nonuniform. Although the differences between these two distributions did not reach significance (Watson's test, U2 = 0.06; p > 0.5), their representations of cardinal versus noncardinal directions were significantly different (χ2 test, χ2 = 9.6; df = 1; p < 0.002). Only the attention PD distribution exhibited a significant cardinal-direction bias. The two distributions also differed significantly in their representation of the four cardinal directions (χ2 = 11.5; df = 3; p < 0.01). In particular, there were significant differences in the representation of the horizontal (χ2 = 7.4; df = 1; p < 0.01) but not the vertical (χ2 = 0.5; df = 1; p = 0.5) cardinal directions between the two distributions, with only the attention distribution exhibiting a bias of contralateral over ipsilateral PDs.
Multitasking neurons
Figure 4a shows an example of the 164 PFdl neurons that exhibited a significant main effect of both attended and remembered locations. This neuron was more active when the monkey was attending downward (fourth column) or when then monkey had to remember the downward location (fourth row).
Figure 4.

Two examples of multitasking neurons, in the format of Figure 2. a, A congruent multitasking neuron, recorded from the right hemisphere, that was most active when the monkey was attending or remembering the downward location (purple rectangles). b, For the cell in a, polar tuning curves for attention (blue line) and memory (red line), along with the attention PD (blue arrow) and the working-memory PD (red arrow); angular difference, ΔΦ = 8°. c, A diametric multitasking neuron, recorded from the left hemisphere, that was most active when the monkey was either attending to the right or remembering the left location (purple rectangles). d, For the cell in c, polar tuning curves in the format of b; ΔΦ = 174°. a, b, From monkey Z. c, d, From monkey H.
Tuning strength
Comparison of the magnitudes of the attention and working-memory PD vectors of multitasking neurons showed that attention tuning was significantly stronger than working-memory tuning (7.8 vs 4.9 sp/s; N = 164; Wilcoxon's signed rank test, p ≪ 0.001; Z = −4.4), as it was in the population as a whole. This difference was significant for monkey Z (9.5 vs 5.8 sp/s; N = 109; p ≪ 0.001; Z = −4.4) but not for monkey H (4.5 vs 3.0 sp/s; p = 0.24; N = 55; Z = −1.1). Attention tuning was stronger than working-memory tuning for 65% (71 of 109) of monkey Z's multitasking neurons, but only 53% (29 of 55) of monkey H's.
The tuning of multitasking neurons exceeded that of the specialized neurons. The working-memory PD vector was significantly larger for multitasking neurons than for working-memory neurons (Wilcoxon's rank sum test, p ≪ 0.001; 4.9 vs 3.2 sp/s; Z = −4.6). Likewise, the magnitude of the attention PD vector was significantly larger for multitasking neurons than for attention neurons (p < 0.001; 7.8 vs 5.6 sp/s, Z = 3.4). Thus, multitasking neurons represented attended and remembered locations better than neurons that encoded just one of these locations.
Directional differences in the PD for attention and working memory
We also compared the spatial preferences reflected in the attention and working-memory PDs for each multitasking neuron, taking the smaller angle (ΔΦ) between the two vectors. Figure 4, a and b, shows a cell with a small ΔΦ; Figure 4c, in contrast, illustrates a large difference. This neuron was more active when the monkey directed its attention to the right or when it remembered a place to the left of the fixation point. Thus, these PDs were nearly diametrically opposed (ΔΦ ≈ 180°). Figure 5 shows the distribution of these angular differences. Twenty-four of these 164 neurons (15%) had similar PDs for attention and memory (ΔΦ < 22.5°). These cells, called “congruent neurons,” showed their greatest activity when the monkey either attended or remembered this common preferred location. The remaining 140 multitasking neurons (85%) had ΔΦ ≥ 22.5°, indicating that these cells had distinct spatial preferences for attention and working memory.
Figure 5.

Distribution of differences between attention and working-memory PDs. The histogram shows the number of multitasking neurons with a given angular difference (ΔΦ) for both monkey (Mk) H (N = 55) and monkey Z (N = 109). The distribution for both monkeys deviated significantly from a uniform distribution, shown for the combined data by the dashed line. The bin to the far left corresponds to congruent multitasking (ΔΦ < 22.5°) neurons; the bin to the far right to diametric ones (ΔΦ > 157.5°).
The two PDs did not vary independently. Had the spatial preferences been independent, then the ΔΦ distribution would have been uniform (Fig. 5, dashed line). But neither the combined ΔΦ distribution (χ2 = 50.4; df = 7; p ≪ 0.001) nor the distribution for each monkey (χ2 > 19.0; p < 0.01) was uniform. The ΔΦ distribution was instead biased toward large angular differences. For nearly one-half (75 of 164) of the cells, ΔΦ was between 135 and 180°. For both monkeys, there were more neurons in the largest angle difference bin (ΔΦ = 157.5–180°) than in any other bin, amounting to over one-quarter of the multitasking neurons in each monkey. We refer to the 43 neurons falling in this largest ΔΦ bin as “diametric neurons.”
As noted previously, the activity of 35% of the multitasking neurons differed significantly between on-diagonal and off-diagonal trials, the former being control trials that lacked the requirement to remember an unmarked location. In principle, such differences could influence the calculated PDs and, hence, ΔΦ. Supplemental Figure 1 (available at www.jneurosci.org as supplemental material) shows the ΔΦ distribution separately for those multitasking cells with no significant difference between on- and off-diagonal trials (a) and those with a significant difference (b). Separately, we also used a linear regression analysis that excluded the diagonal trials to compute the PDs to further rule out spurious contributions from the on-diagonal trials. Supplemental Figure 1c (available at www.jneurosci.org as supplemental material) shows the ΔΦ distribution computed using these alternate PDs. Like the original distribution shown in Figure 5, these distributions were significantly nonuniform (χ2 test; df = 7; p < 0.01), have their peak in the largest angle bin (i.e., diametric neurons), and minima in the 22.5–90° range of ΔΦ. Thus the pattern of observed angle differences between the PDs for attention and working memory, including nearly opposite PDs, cannot be attributed to inclusion of the on-diagonal trials.
Comparison of neurons with congruent and diametric PDs
We investigated whether the congruent and diametric neurons differed in ways other than the angle between the attention and working-memory PDs. For diametric multitasking neurons, the average magnitude of the attention PD was significantly larger than that of the working-memory PD (8.7 vs 4.8 sp/s; N = 43; Wilcoxon's signed rank test, p < 0.005; Z = −3.0), as in the PFdl population generally (see above). In contrast, the attention and working-memory PD magnitudes did not differ for congruent multitasking neurons (p > 0.2; 7.4 vs 5.7 sp/s; N = 24; Z = −1.3). These findings held for both monkeys. The proportion of cells with stronger attention tuning than working-memory tuning was also significantly higher (χ2 test, χ2 = 8.6; df = 1; p < 0.005) for diametric neurons (31 of 43; 72%) than for congruent neurons (13 of 24; 54%). Multitasking neurons with intermediate angles between their PDs (ΔΦ = 22.5–157.5°) also had significantly larger attention PDs than working-memory PDs (Wilcoxon's signed rank test, p < 0.005; 7.5 vs 4.7 sp/s; N = 97; Z = −2.9). Thus, on average, multitasking neurons with low ΔΦ values had comparable tuning strength for attention and for working memory, unlike the PFdl population as a whole, whereas those with large and intermediate ΔΦ values had significantly stronger tuning for attention, like the PFdl population as a whole.
Figure 6 shows how the attention PDs were distributed for the congruent, intermediate, and diametric multitasking neuron subtypes. The magnitude of tuning is divided into three categories, indicated by lines of three different lengths, to show that the properties described here are not predominantly caused by weakly tuned cells. As a whole, multitasking neurons exhibited a significant (χ2 test, χ2 = 15.6; df = 1; p ≪ 0.001) cardinal-direction bias in their attention PDs (Fig. 3c; a, outer distribution). However, only congruent multitasking neurons (Fig. 6a) exhibited this bias (χ2 = 32.7; p ≪ 0.001), with two-thirds (16 of 24) of their attention PDs falling in one of the cardinal bins (4 contralateral, 4 up, 0 ipsilateral, and 8 down). In contrast, the cardinal bins only accounted for about one-quarter of the attention PDs for the intermediate (26 of 97) (Fig. 6b) and diametric (11 of 43) (Fig. 6c) subtypes. Neither of these distributions exhibited a significant cardinal bias (intermediate: χ2 = 2.8, p = 0.09; diametric: χ2 = 0.8, p > 0.3).
Finally, we compared the anatomical distribution of congruent and diametric multitasking neurons across PFdl. We previously showed that attention neurons were significantly more prevalent lateral to the principal sulcus, whereas working-memory neurons were more prevalent medial to the principal sulcus (Lebedev et al., 2004), and this finding is confirmed in Figure 7, a and b. In contrast, multitasking neurons were evenly distributed on both sides of the sulcus (Fig. 7b,d). Multitasking neurons with congruent, intermediate, and diametric PDs were scattered throughout the sampled region.
Figure 7.
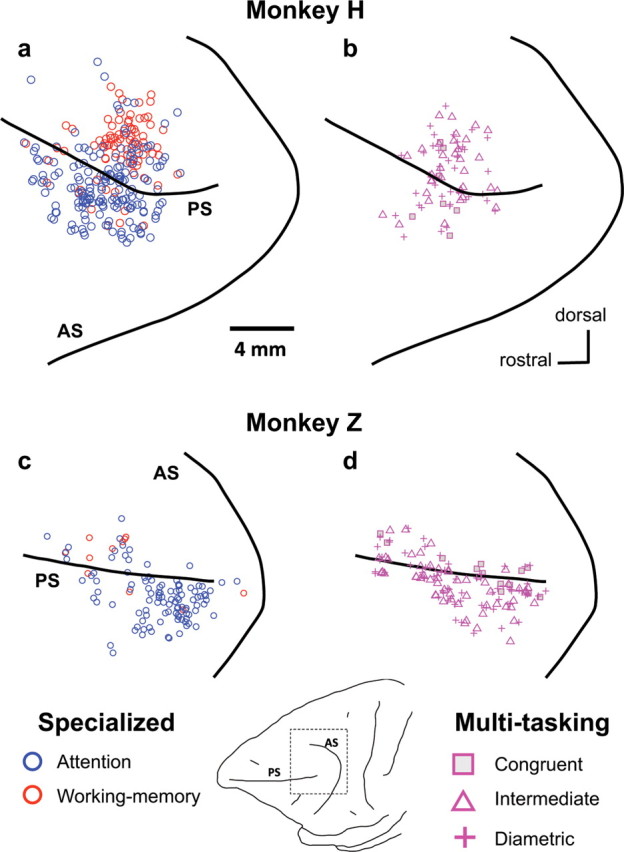
Location of the specialized (a, c) and multitasking cells (b, d) for monkey H (a, b) and monkey Z (c, d). AS, Arcuate sulcus; PS, principal sulcus. c and d correspond to the dashed box in the drawing at the bottom. Note that the locations of multitasking cells do not differ markedly from those of specialized attention and memory cells, together.
Comparison of the coding efficiency of specialized and multitasking neurons
The activity of a single multitasking neuron is inherently ambiguous. For example, when the diametric neuron shown in Figure 8a fires robustly, it could signify either that the monkey is attending to the right or remembering that the circle started at the left location. Similarly, if the congruent neuron shown in Figure 8b fires robustly, this activity signals that the right location is important for the current trial but not whether this location is being attended or remembered. In contrast, the activity of one specialized neuron (such as those shown in Fig. 8d–f) can unambiguously signal both a particular cognitive operation and a location.
Figure 8.
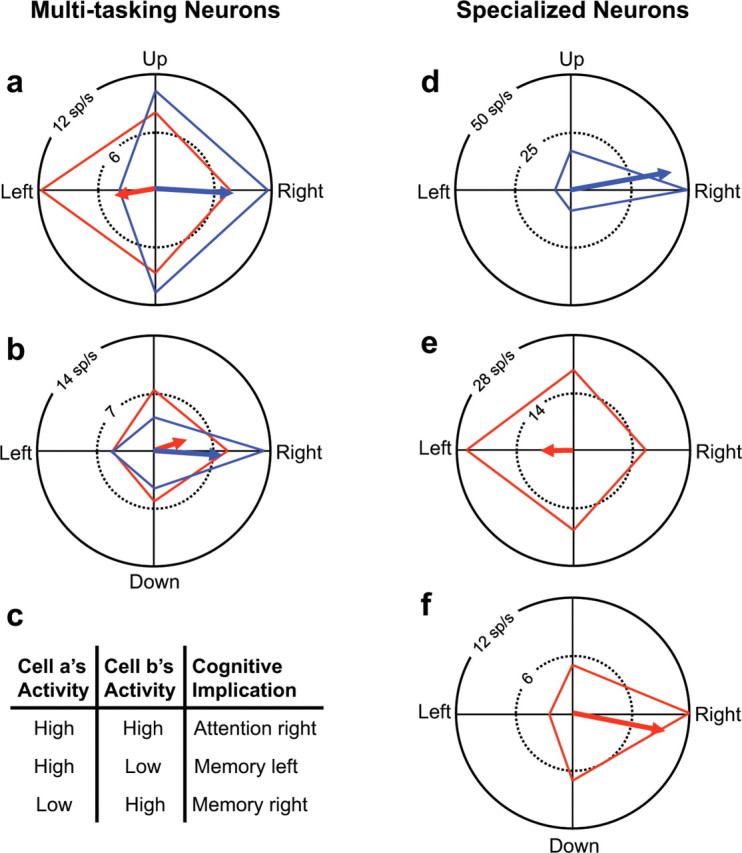
Increased coding efficacy of multitasking neurons. Representing the same information encoded by only two multitasking neurons (a, b) requires three neurons if two or more are specialized for either attention or memory (d–f). As shown in c, together the two multitasking neurons (cell a and cell b) can signal three cognitive states: attention to the right, working memory of the left location, and working memory of the right. For example, maximal activity in cell a could indicate either attention to the right (blue) or memory of the left location (red). The level of activity in cell b, however, disambiguates the signal of cell a. If the activity of cell b is also maximal, then the two cells, together, are signaling attention to the right. Alternatively, if the activity of cell b is low, then cell a must be signaling memory of the left location. Representing the same information requires three specialized neurons (d–f). That is, it would take three cells to signal attention to the right (the contribution of cell d), memory of the left location (cell e), and memory of the right location (cell f). Two of the specialized neurons and one of the multitasking neurons would achieve the same result.
The ambiguity of single multitasking neurons can be resolved by combining the signals of two or more such cells. For example, the two multitasking neurons in Figure 8 will both be highly active only when the monkey attends to the right. Elevated activity of just the diametric (Fig. 8a) or just the congruent neuron (Fig. 8b) instead signifies that the monkey is remembering the left or right location, respectively (Fig. 8c, table). Thus, these two multitasking neurons can unambiguously represent three process–location combinations: attend right, remember left, and remember right. These same three combinations can also be represented by three specialized cells (Fig. 8d–f) or by one multitasking neuron and two specialized cells (Fig. 8a,d,f). Hence a pair of multitasking neurons can convey the same information as three specialized neurons. One exception involves pairs of congruent neurons, which convey information about location but remain ambiguous regarding cognitive process. This fact may explain why 85% of multitasking neurons had distinct PDs for attention and working memory.
We examined whether populations of multitasking neurons were, in general, more efficient in the manner shown by example in Figure 8. To do so, we used a neuron-dropping procedure to assess how reliably both the locus of attention and the location held in working memory could be decoded from the firing rate of an ensemble of neurons on a single trial of a particular type (i.e., one of the 16 conjunctions of a remembered location and an attended location represented by the 4 × 4 matrix). The single trial was classified as belonging to the trial type with the most similar firing rate, averaged across all other trials (see Materials and Methods). This classification could be correct with regard to the attended location, the remembered location, both, or neither.
Figure 9 shows the percentage of correct trial classification as a function of the number of neurons in the ensemble. Decoding performance for both the attended location (Fig. 9a) and the remembered location (Fig. 9b) was above chance level (25% correct for four possible locations) for even a single tuned neuron and increased as the ensemble size increased. The decoding performance of multitasking neurons (purple curves) rose more rapidly than that of attention neurons (blue curves) or working-memory neurons (red curves). Thus, decoding either cognitive operation at a given level of reliability requires fewer multitasking neurons than specialized neurons, as shown by example in Figure 8. Hence multitasking neurons represented the relevant variables more efficiently than either type of specialized neuron.
Figure 9.

Neuron-dropping curves for multitasking versus specialized neurons. The curves show the percentage of single trials correctly classified as a function of the number of neurons used in the computation (see Materials and Methods). The width of each curve shows ±1 SD around the average percentage of correct classifications. Groups of multitasking neurons (purple curves) were more efficient at encoding the attended (a) and remembered (b) location than equal-size groups of either attention neurons (blue curves) or working-memory neurons (red curves). In c, the black curve shows the performance of the specialized cells at decoding both the attended and remembered locations. This population was constructed from an ensemble of attention cells that was used to classify the attended location and an ensemble of working-memory neurons that was used to classify the remembered location. The classification was considered correct when both ensembles were correct. The purple curve shows the performance of two random ensembles of multitasking neurons, one for decoding the attended location and one for the remembered location. Decoding both locations was, as in a and b, more efficient using multitasking cells than the combination of the two specialized cell types, with each decoding only its specialty. The dashed horizontal line shows chance levels of decoding.
Figure 9c shows the combined decoding performance of two neuronal ensembles of equal size: one for classifying the attended location and one for classifying the remembered location. In this plot, a classification was considered correct only if the classification of both groups was correct. Chance performance was thus 1 of 16, rather than 1 of 4 as in Figure 9, a and b. The purple curve shows performance when both ensembles are composed of multitasking neurons. The solid black curve shows performance as a function of the number of attention neurons in the first ensemble and the number of working-memory neurons in the second ensemble. As was the case for decoding each cognitive operation separately, multitasking neurons decoded both the attended and remembered locations more efficiently than the neurons specialized for these operations. Thus, when more than one location in the environment is behaviorally relevant, a network of neurons that each encode information about both locations provides a more reliable representation than a network composed of two groups of neurons, each of which encodes a single location.
Tuning during other task periods
Previous studies have shown that prefrontal neurons can represent different variables or have different spatial preferences during different periods of a task (see Discussion). Above and previously (Lebedev et al., 2004), we showed that individual PFdl neurons can encode distinct attended and remembered locations during a single task period, specifically the delay period before the go cue. We extended this analysis to other task periods, as well.
Activity early in the trial (during the 800 ms before the circle started revolving around the fixation point) was measured to determine whether multitasking or other neurons encoded the starting location of the circle (one-way ANOVA). Of the 957 recorded neurons, 409 (43%) exhibited such tuning. Working-memory neurons represented the location of the circle during this early part of the trial less frequently (29%; 28 of 95) than both attention neurons (60%; 177 of 297) and multitasking neurons (76%; 124 of 164). We used neuronal activity when the circle was at each of its four possible starting locations to compute an “early PD.” For cells that were significantly tuned both early and during the delay period, we compared spatial preferences in these two periods. Close agreement, between the early PD and the working-memory PD was defined as an angular difference of <22.5°. This property was found in only a minority of working-memory tuned neurons that were also significantly tuned in the early period [36% (10 of 28) of working-memory neurons and 23% (29 of 124) of multitasking neurons]. In contrast to these results for working-memory PDs, the early and attention PDs were often in close agreement (ΔPD, <22.5°). Over one-half the attention-tuned neurons that were also significantly tuned in the early period had such closely aligned PDs [51% (91 of 177) of attention neurons and 56% (70 of 124) of multitasking neurons]. Thus, neurons tuned to the attended location during the delay period were frequently tuned to the starting location of the circle early in the trial, and in many cases the spatial preferences in these two task periods were in close agreement. This correspondence suggests that the monkeys attended to the circle not only in the 800 ms before the go cue, but also early in the trial when the circle was at its initial position. In contrast, the neurons that encoded the location of the circle at the start of the trial were mostly distinct from those that reflected working memory of this location during the delay period.
We also analyzed activity later in the trial, after the delay period and go cue, as the monkey made its saccade (Fig. 1d). Mean firing rates were computed for the period from 100 ms before to 200 ms after saccade onset and grouped by the location of the saccade target, regardless of whether the target was an attended or remembered location. Slightly more than one-half the PFdl population (55%; 530 of 957) exhibited significant tuning for the location of the saccade target during this perisaccadic period. A majority (57%; 54 of 95) of working-memory neurons exhibited such tuning, as did a larger majority of attention (65%; 194 of 297) and multitasking neurons (75%; 125 of 164). Mean firing rates for the four saccade directions were used to compute a “perisaccadic PD.” Only ∼25% of the neurons showed close agreement (ΔPD, <22.5°) between the perisaccadic PD and the PDs computed during the delay period. Working-memory and perisaccadic PDs were within 22.5° for 28% (15 of 54) of the working-memory neurons and 23% (29 of 125) of the multitasking neurons that exhibited significant perisaccadic tuning. Similarly, the attention and perisaccadic PDs were within 22.5° for only 23% of the attention (45 of 194) and multitasking neurons (29 of 125) that exhibited significant perisaccadic tuning. The lack of close correspondence between the perisaccadic PDs and either the working-memory or attention PDs provides additional evidence, beyond that discussed previously (Lebedev et al., 2004), that for the majority of neurons neither of these two delay period PDs represents a simple motor plan. It is more likely that PFdl neurons represent different variables, with different spatial preferences, at different times during a trial. It is important to note, therefore, that the appellations “attention” and “working-memory” neuron apply only to the delay period as defined here.
Discussion
We previously reported that most spatially tuned neurons in PFdl specialize for either attention or memory, but about one-third contributes simultaneously to both, with many such multitasking neurons encoding distinct locations for attention and memory (Lebedev et al., 2004). Given that the specialized attention and working-memory cells, alone, could account for the ability to distinguish attended locations from remembered ones, we wanted to determine whether there were any advantages multitasking neurons might provide to the PFdl network. The present analysis indicated that multitasking neurons improved the encoding of attended and remembered locations and did so for three reasons. First, the PDs for attention and for working memory usually differ, and often are diametrically opposite one another. Congruent PDs would not improve the separate representations of attended and remembered locations. Second, the multitasking neurons have stronger tuning than specialized cells. And third, pairs of multitasking neurons represent these cognitive parameters more efficiently than pairs of specialized neurons or combined specialized-multitasking pairs. We found in addition that congruent neurons preferentially represented attention to one of the cardinal directions.
Tuning strength and encoding efficiency
Multitasking cells outnumbered working-memory cells and also had significantly stronger working-memory tuning than these specialized cells. Multitasking cells also had significantly stronger attention tuning than specialized attention cells. Thus, the presence of multitasking neurons enhanced the contribution of the overall network to both cognitive processes. In addition to being more strongly tuned, multitasking neurons also encoded the attended and remembered locations more efficiently than specialized cells. Unlike specialized neurons, the activity of a single multitasking neuron is ambiguous because it could reflect either of two cognitive operations. But this ambiguity is resolved when the activity of a group of multitasking neurons is considered together, as long as the group is not entirely composed of congruent cells.
Another benefit of multitasking neurons is their potential to bridge between attention and working memory, which operate jointly in the task. For example, saccades to a remembered location entail a shift of attention from the attended to the remembered location (Hoffman and Subramaniam, 1995; Kowler et al., 1995; Deubel and Schneider, 1996; Baldauf and Deubel, 2008). Multitasking neurons are well situated to facilitate such attention shifts because they are distributed throughout PFdl and thus close to both types of specialized neurons.
Congruent and diametric mappings
Congruent multitasking neurons did not distinguish between attended and remembered locations in terms of either PD or tuning strength. These cells therefore likely serve as generalized spatial processors, indicating a relevant location. For example, they may signal when this location is associated with reward or is a potential saccade target. Some prefrontal (Funahashi et al., 1993; Takeda and Funahashi, 2002) and premotor (Ohbayashi et al., 2003; Cisek and Kalaska, 2005) cortex cells encode plans to saccade to a particular location. Like congruent neurons, such cells generally prefer the same target for both visually guided (attended location) and memory-guided (remembered location) saccades (Tsujimoto and Sawaguchi, 2004).
In contrast to congruent cells, most multitasking neurons had attention and working-memory PDs that differed in direction and/or magnitude. Diametric cells, with nearly opposite PDs, were particularly common. Their abundance did not reflect a bias in task design, which balanced the four possible angles between the remembered and attended locations. Multitasking neurons with diametric (or intermediate) PDs had stronger attention tuning than working-memory tuning. Thus, cells that distinguished between the attended and remembered locations preferentially contributed to attention processing.
Cardinal-direction bias
The attention PDs of congruent multitasking and attention neurons were biased toward the cardinal directions, particularly the contralateral axis. This bias likely resulted from plasticity induced by learning and repeatedly performing the task, in which the cardinal directions were more attended, remembered, and targeted by saccades than other places. Another factor could be our sparse spatial sampling, in this case of only four locations. Others who have used sparse sampling either did not compute PDs (Sawaguchi and Yamane, 1999; Sawaguchi, 2001) or did not report their spatial distribution (Takeda and Funahashi, 2002, 2004; Funahashi, 2006). Most studies report that PFdl preferentially represents the contralateral hemifield (Sawaguchi and Yamane, 1999; Sawaguchi, 2001; Iba and Sawaguchi, 2002; Tsujimoto and Sawaguchi, 2004) or has no spatial bias (Takeda and Funahashi, 2004). We are not aware of any previous reports of PDs clustering around the cardinal axes.
Relationship to previous neurophysiological results
Although reminiscent of spatial tuning properties described previously, multitasking cells differ importantly. They simultaneously exhibit spatial tuning for two different cognitive operations, attention and working memory, with different spatial preferences for each.
Multitasking neurons are not unique in their representation of more than one orientation or direction. A small proportion of neurons in visual cortex have two preferred line orientations or bimodal tuning for stimulus direction (Albright, 1984; Felleman and Van Essen, 1987). Likewise, neurons in motor areas (Coltz et al., 1999; Amirikian and Georgopoulos, 2000) can have bimodal tuning curves for the direction of reach. Multitasking neurons, however, do not have bimodal tuning. Instead, they have two tuning curves, one for attention and one for memory.
Neurons in visual areas can switch tuning preferences depending on the eye used or stimulus length, shape, speed, depth, or location in the visual field (Zeki, 1974; Poggio and Fischer, 1977; Poggio and Talbot, 1981; Jones and Sillito, 1994; Okamoto et al., 1999; Tanaka et al., 1999, 2002; Anzai et al., 2007) (cf. Maunsell and Van Essen, 1983). In frontal cortex, PDs can change across tasks, between different task periods (di Pellegrino and Wise, 1993; Sergio and Kalaska, 1998; Takeda and Funahashi, 2002, 2004; Tsujimoto and Sawaguchi, 2004; Watanabe et al., 2006) or during learning (Wise et al., 1998; Taylor et al., 2002). Thus, the PD of a cell is not always a fixed property. We also observed changes in PD across task periods. In contrast, multitasking neurons simultaneously exhibited one PD for attention and another for working memory. Furthermore, these PDs differed by >45° for 73% of multitasking neurons, whereas most PF studies have reported that only 13–38% of neurons undergo PD shifts of this magnitude across tasks (Takeda and Funahashi, 2002, 2004; Tsujimoto and Sawaguchi, 2004; Watanabe et al., 2006).
For some PFdl neurons, delay-period tuning before a single saccade differs from that before sequential saccades (Inoue and Funahashi, 2002). In this sense, these neurons represent more than one location, a finding that generalizes to reaching movements (Funahashi et al., 1997) and nonspatial targets (Ninokura et al., 2003, 2004; Warden and Miller, 2007). Hence, PFdl neurons can represent conjunctions of locations or objects. We also observed that some neurons exhibiting a significant interaction effect were particularly active for certain conjunctions of remembered and attended locations. In contrast to such “conjunction” effects, multitasking neurons exhibited two main effects. They could represent the remembered location independent of where the monkey was attending and vice versa.
Interpretational issues
We refer here, as in the past (Lebedev et al., 2004), to memory and attention tuning because the monkeys had to remember the unmarked location where the circle first appeared on each trial (in case they needed to saccade there) and had to attend to its final location (to get the go cue and saccade instruction). While acknowledging the possibilities of multiple memory locations and divided attention, the previous report discussed these and other alternative interpretations in considerable detail, as well as providing psychophysical evidence in support of the attention claim. We can rule out an account for tuning for the remembered or the attended location in terms of associations between places and rewards because these were balanced for all locations and conditions. Likewise, with the exception of the congruent multitasking neurons, we can rule out simple accounts of multitasking cells in terms of saccade planning. In addition, we showed that tuning for the attended location was significantly stronger than the visual tuning of the same neurons for an identical stimulus that did not require attention, thus ruling out a simple sensory account of the attention tuning. The thrust of the present interpretation is, however, independent of the previous one. Regardless of the labels given to the two salient locations, the multitasking cells performed more than one cognitive operation.
Conclusion
The prefrontal cortex has been implicated in a variety of cognitive functions, including working memory, attention, response inhibition, self-monitoring, motor planning, rule implementation, reward estimation, and decision making (Fuster, 2000; Miller and Cohen, 2001; Schall et al., 2002; Passingham and Sakai, 2004; Johnston and Everling, 2006; Muhammad et al., 2006; Champod and Petrides, 2007; Lee et al., 2007; Tanji and Hoshi, 2008). The multitasking neurons in PFdl may enable efficient monitoring and control of ongoing behaviors that depend on both working memory and attention. For example, during a visual search, multitasking neurons may help distinguish locations that have previously been searched from those that need scrutiny. In general, the presence of multitasking neurons suggests a strategy by which the prefrontal cortex can efficiently represent different cognitive attributes of a given location and selectively access any such attribute depending on the behavioral context.
Footnotes
This work was supported by National Institute of Mental Health Division of Intramural Research Grant Z01MH-01092. We thank Dr. Andrew R. Mitz for engineering support, Jim Fellows for assistance in behavioral training, Daniel Muldrew for assistance with the data analysis, and Alex Cummings for preparing the histological material.
References
- Albright TD. Direction and orientation selectivity of neurons in visual area MT of the macaque. J Neurophysiol. 1984;52:1106–1130. doi: 10.1152/jn.1984.52.6.1106. [DOI] [PubMed] [Google Scholar]
- Amirikian B, Georgopoulos AP. Directional tuning profiles of motor cortical cells. Neurosci Res. 2000;36:73–79. doi: 10.1016/s0168-0102(99)00112-1. [DOI] [PubMed] [Google Scholar]
- Anzai A, Peng X, Van Essen DC. Neurons in monkey visual area V2 encode combinations of orientations. Nat Neurosci. 2007;10:1313–1321. doi: 10.1038/nn1975. [DOI] [PubMed] [Google Scholar]
- Baldauf D, Deubel H. Properties of attentional selection during the preparation of sequential saccades. Exp Brain Res. 2008;184:411–425. doi: 10.1007/s00221-007-1114-x. [DOI] [PubMed] [Google Scholar]
- Champod AS, Petrides M. Dissociable roles of the posterior parietal and the prefrontal cortex in manipulation and monitoring processes. Proc Natl Acad Sci U S A. 2007;104:14837–14842. doi: 10.1073/pnas.0607101104. [DOI] [PMC free article] [PubMed] [Google Scholar]
- Cisek P, Kalaska JF. Neural correlates of reaching decisions in dorsal premotor cortex: specification of multiple direction choices and final selection of action. Neuron. 2005;45:801–814. doi: 10.1016/j.neuron.2005.01.027. [DOI] [PubMed] [Google Scholar]
- Coltz JD, Johnson MT, Ebner TJ. Cerebellar Purkinje cell simple spike discharge encodes movement velocity in primates during visuomotor arm tracking. J Neurosci. 1999;19:1782–1803. doi: 10.1523/JNEUROSCI.19-05-01782.1999. [DOI] [PMC free article] [PubMed] [Google Scholar]
- Deubel H, Schneider WX. Saccade target selection and object recognition: evidence for a common attentional mechanism. Vision Res. 1996;36:1827–1837. doi: 10.1016/0042-6989(95)00294-4. [DOI] [PubMed] [Google Scholar]
- di Pellegrino G, Wise SP. Visuospatial versus visuomotor activity in the premotor and prefrontal cortex of a primate. J Neurosci. 1993;13:1227–1243. doi: 10.1523/JNEUROSCI.13-03-01227.1993. [DOI] [PMC free article] [PubMed] [Google Scholar]
- Felleman DJ, Van Essen DC. Receptive field properties of neurons in area V3 of macaque monkey extrastriate cortex. J Neurophysiol. 1987;57:889–920. doi: 10.1152/jn.1987.57.4.889. [DOI] [PubMed] [Google Scholar]
- Funahashi S. Prefrontal cortex and working memory processes. Neuroscience. 2006;139:251–261. doi: 10.1016/j.neuroscience.2005.07.003. [DOI] [PubMed] [Google Scholar]
- Funahashi S, Chafee MV, Goldman-Rakic PS. Prefrontal neuronal activity in rhesus monkeys performing a delayed anti-saccade task. Nature. 1993;365:753–756. doi: 10.1038/365753a0. [DOI] [PubMed] [Google Scholar]
- Funahashi S, Inoue M, Kubota K. Delay-period activity in the primate prefrontal cortex encoding multiple spatial positions and their order of presentation. Behav Brain Res. 1997;84:203–223. doi: 10.1016/s0166-4328(96)00151-9. [DOI] [PubMed] [Google Scholar]
- Fuster JM. Executive frontal functions. Exp Brain Res. 2000;133:66–70. doi: 10.1007/s002210000401. [DOI] [PubMed] [Google Scholar]
- Hoffman JE, Subramaniam B. The role of visual attention in saccadic eye movements. Percept Psychophys. 1995;57:787–795. doi: 10.3758/bf03206794. [DOI] [PubMed] [Google Scholar]
- Iba M, Sawaguchi T. Neuronal activity representing visuospatial mnemonic processes associated with target selection in the monkey dorsolateral prefrontal cortex. Neurosci Res. 2002;43:9–22. doi: 10.1016/s0168-0102(02)00013-5. [DOI] [PubMed] [Google Scholar]
- Inoue M, Funahashi S. Prefrontal delay-period activity is affected by visual cues presented outside the memory field. Neuroreport. 2002;13:2097–2101. doi: 10.1097/00001756-200211150-00021. [DOI] [PubMed] [Google Scholar]
- Johnston K, Everling S. Neural activity in monkey prefrontal cortex is modulated by task context and behavioral instruction during delayed-match-to-sample and conditional prosaccade-antisaccade tasks. J Cogn Neurosci. 2006;18:749–765. doi: 10.1162/jocn.2006.18.5.749. [DOI] [PubMed] [Google Scholar]
- Jones HE, Sillito AM. Directional asymmetries in the length-response profiles of cells in the feline dorsal lateral geniculate nucleus. J Physiol. 1994;479:475–486. doi: 10.1113/jphysiol.1994.sp020311. [DOI] [PMC free article] [PubMed] [Google Scholar]
- Kowler E, Anderson E, Dosher B, Blaser E. The role of attention in the programming of saccades. Vision Res. 1995;35:1897–1916. doi: 10.1016/0042-6989(94)00279-u. [DOI] [PubMed] [Google Scholar]
- Lebedev MA, Messinger A, Kralik JD, Wise SP. Representation of attended versus remembered locations in prefrontal cortex. PLoS Biol. 2004;2:e365. doi: 10.1371/journal.pbio.0020365. [DOI] [PMC free article] [PubMed] [Google Scholar]
- Lee D, Rushworth MF, Walton ME, Watanabe M, Sakagami M. Functional specialization of the primate frontal cortex during decision making. J Neurosci. 2007;27:8170–8173. doi: 10.1523/JNEUROSCI.1561-07.2007. [DOI] [PMC free article] [PubMed] [Google Scholar]
- Maunsell JH, Van Essen DC. Functional properties of neurons in middle temporal visual area of the macaque monkey. I. Selectivity for stimulus direction, speed, and orientation. J Neurophysiol. 1983;49:1127–1147. doi: 10.1152/jn.1983.49.5.1127. [DOI] [PubMed] [Google Scholar]
- Miller EK, Cohen JD. An integrative theory of prefrontal cortex function. Annu Rev Neurosci. 2001;24:167–202. doi: 10.1146/annurev.neuro.24.1.167. [DOI] [PubMed] [Google Scholar]
- Muhammad R, Wallis JD, Miller EK. A comparison of abstract rules in the prefrontal cortex, premotor cortex, inferior temporal cortex, and striatum. J Cogn Neurosci. 2006;18:974–989. doi: 10.1162/jocn.2006.18.6.974. [DOI] [PubMed] [Google Scholar]
- Ninokura Y, Mushiake H, Tanji J. Representation of the temporal order of visual objects in the primate lateral prefrontal cortex. J Neurophysiol. 2003;89:2868–2873. doi: 10.1152/jn.00647.2002. [DOI] [PubMed] [Google Scholar]
- Ninokura Y, Mushiake H, Tanji J. Integration of temporal order and object information in the monkey lateral prefrontal cortex. J Neurophysiol. 2004;91:555–560. doi: 10.1152/jn.00694.2003. [DOI] [PubMed] [Google Scholar]
- Ohbayashi M, Ohki K, Miyashita Y. Conversion of working memory to motor sequence in the monkey premotor cortex. Science. 2003;301:233–236. doi: 10.1126/science.1084884. [DOI] [PubMed] [Google Scholar]
- Okamoto H, Kawakami S, Saito H, Hida E, Odajima K, Tamanoi D, Ohno H. MT neurons in the macaque exhibited two types of bimodal direction tuning as predicted by a model for visual motion detection. Vision Res. 1999;39:3465–3479. doi: 10.1016/s0042-6989(99)00073-5. [DOI] [PubMed] [Google Scholar]
- Passingham D, Sakai K. The prefrontal cortex and working memory: physiology and brain imaging. Curr Opin Neurobiol. 2004;14:163–168. doi: 10.1016/j.conb.2004.03.003. [DOI] [PubMed] [Google Scholar]
- Poggio GF, Fischer B. Binocular interaction and depth sensitivity in striate and prestriate cortex of behaving rhesus monkey. J Neurophysiol. 1977;40:1392–1405. doi: 10.1152/jn.1977.40.6.1392. [DOI] [PubMed] [Google Scholar]
- Poggio GF, Talbot WH. Mechanisms of static and dynamic stereopsis in foveal cortex of the rhesus monkey. J Physiol. 1981;315:469–492. doi: 10.1113/jphysiol.1981.sp013759. [DOI] [PMC free article] [PubMed] [Google Scholar]
- Sawaguchi T. The effects of dopamine and its antagonists on directional delay-period activity of prefrontal neurons in monkeys during an oculomotor delayed-response task. Neurosci Res. 2001;41:115–128. doi: 10.1016/s0168-0102(01)00270-x. [DOI] [PubMed] [Google Scholar]
- Sawaguchi T, Yamane I. Properties of delay-period neuronal activity in the monkey dorsolateral prefrontal cortex during a spatial delayed matching-to-sample task. J Neurophysiol. 1999;82:2070–2080. doi: 10.1152/jn.1999.82.5.2070. [DOI] [PubMed] [Google Scholar]
- Schall JD, Stuphorn V, Brown JW. Monitoring and control of action by the frontal lobes. Neuron. 2002;36:309–322. doi: 10.1016/s0896-6273(02)00964-9. [DOI] [PubMed] [Google Scholar]
- Sergio LE, Kalaska JF. Changes in the temporal pattern of primary motor cortex activity in a directional isometric force versus limb movement task. J Neurophysiol. 1998;80:1577–1583. doi: 10.1152/jn.1998.80.3.1577. [DOI] [PubMed] [Google Scholar]
- Takeda K, Funahashi S. Prefrontal task-related activity representing visual cue location or saccade direction in spatial working memory tasks. J Neurophysiol. 2002;87:567–588. doi: 10.1152/jn.00249.2001. [DOI] [PubMed] [Google Scholar]
- Takeda K, Funahashi S. Population vector analysis of primate prefrontal activity during spatial working memory. Cereb Cortex. 2004;14:1328–1339. doi: 10.1093/cercor/bhh093. [DOI] [PubMed] [Google Scholar]
- Tanaka YZ, Koyama T, Mikami A. Neurons in the temporal cortex changed their preferred direction of motion dependent on shape. Neuroreport. 1999;10:393–397. doi: 10.1097/00001756-199902050-00033. [DOI] [PubMed] [Google Scholar]
- Tanaka YZ, Koyama T, Mikami A. Visual responses in the temporal cortex to moving objects with invariant contours. Exp Brain Res. 2002;146:248–256. doi: 10.1007/s00221-002-1058-0. [DOI] [PubMed] [Google Scholar]
- Tanji J, Hoshi E. Role of the lateral prefrontal cortex in executive behavioral control. Physiol Rev. 2008;88:37–57. doi: 10.1152/physrev.00014.2007. [DOI] [PubMed] [Google Scholar]
- Taylor DM, Tillery SI, Schwartz AB. Direct cortical control of 3D neuroprosthetic devices. Science. 2002;296:1829–1832. doi: 10.1126/science.1070291. [DOI] [PubMed] [Google Scholar]
- Tsujimoto S, Sawaguchi T. Properties of delay-period neuronal activity in the primate prefrontal cortex during memory- and sensory-guided saccade tasks. Eur J Neurosci. 2004;19:447–457. doi: 10.1111/j.0953-816x.2003.03130.x. [DOI] [PubMed] [Google Scholar]
- Warden MR, Miller EK. The representation of multiple objects in prefrontal neuronal delay activity. Cereb Cortex. 2007;17(Suppl 1):i41–i50. doi: 10.1093/cercor/bhm070. [DOI] [PubMed] [Google Scholar]
- Watanabe K, Igaki S, Funahashi S. Contributions of prefrontal cue-, delay-, and response-period activity to the decision process of saccade direction in a free-choice ODR task. Neural Netw. 2006;19:1203–1222. doi: 10.1016/j.neunet.2006.05.033. [DOI] [PubMed] [Google Scholar]
- Wessberg J, Stambaugh CR, Kralik JD, Beck PD, Laubach M, Chapin JK, Kim J, Biggs SJ, Srinivasan MA, Nicolelis MA. Real-time prediction of hand trajectory by ensembles of cortical neurons in primates. Nature. 2000;408:361–365. doi: 10.1038/35042582. [DOI] [PubMed] [Google Scholar]
- Wise SP, Moody SL, Blomstrom KJ, Mitz AR. Changes in motor cortical activity during visuomotor adaptation. Exp Brain Res. 1998;121:285–299. doi: 10.1007/s002210050462. [DOI] [PubMed] [Google Scholar]
- Zeki SM. Cells responding to changing image size and disparity in the cortex of the rhesus monkey. J Physiol. 1974;242:827–841. doi: 10.1113/jphysiol.1974.sp010736. [DOI] [PMC free article] [PubMed] [Google Scholar]