

Abstract
Caenorhabditis elegans shows chemotaxis to various odorants and water-soluble chemoattractants such as NaCl. Previous studies described the pirouette mechanism for chemotaxis, in which C. elegans quickly changes the direction of locomotion by using a set of stereotyped behaviors, a pirouette, in response to a decrease in the concentration of the chemical. Here, we report the discovery of a second mechanism for chemotaxis, called the weathervane mechanism. In this strategy animals respond to a spatial gradient of chemoattractant and gradually curve toward higher concentration of the chemical. By computer simulation, we find that both of these mechanisms contribute to chemotaxis and both mechanisms need to act in parallel for efficient chemotaxis. Using laser ablation of individual neurons to examine the underlying neural circuit, we find the ASE sensory neurons and AIZ interneurons are essential for both the pirouette and weathervane mechanisms in chemotaxis to NaCl. Salt-conditioned animals show reversed responses in both of these behaviors, leading to avoidance of NaCl. These results provide a platform for detailed molecular and cellular analyses of chemotaxis and its plasticity in this model organism.
Introduction
Animals show orientation behaviors in response to external stimuli such as light, chemicals, and temperature and either aggregate at the source of the stimuli or actively avoid it. Although it seems a simple task and the behavior may look similar between species, there are actually many strategies that an animal can adopt. Attempts to classify mechanisms of orientation behavior have been made and several different mechanisms have been proposed, such as orthokinesis, klinokinesis, klinotaxis, and tropotaxis (Frankel and Gunn, 1961).
The soil nematode Caenorhabditis elegans is a model organism whose behavioral genetics has been thoroughly studied, thereby allowing cellular and molecular analysis of behavior using mutants and transgenic animals (Brenner, 1974). In addition, the whole neural circuit is described, facilitating the analysis of neural network underlying each behavior (White et al., 1986). For this purpose, dissection of various behaviors into elementary components and formulation of each behavioral unit is essential. When placed on an agar plate, C. elegans lies on either of its sides and moves either forward or backward, alternately contracting its body wall muscles along the ventral and dorsal surface. Most of the time, the animals simply move forward, but this locomotion behavior is occasionally interrupted by one of several types of other behaviors. These include short reversals, long reversals, and ω turns, in the last of which the animals curl their whole body so that their heads get close to or even touch their tails.
C. elegans shows chemotaxis to various odorants and water-soluble chemoattractants, such as NaCl, by sensing them mainly with sensory neurons whose sensory endings are located in amphid sensory organs at the anterior tip of the animal. The strategy of chemotaxis in this organism was previously studied by Pierce-Shimomura et al. (1999), who found the “pirouette strategy” for chemotaxis to water-soluble chemoattractants. “Pirouette” refers to a bout of sharp turns, which typically include long reversals and ω turns (see Fig. 1 A). The remainder of the movement is called the “runs.” According to their observations, pirouettes occur more frequently when chemoattractant concentration decreases (dC/dT <0) compared with the conditions dC/dT = 0 or dC/dT >0. This strategy, also called biased random walk, is based on nondirectional locomotion, but eventually biases the locomotion toward the higher concentration of the chemical because runs toward lower concentration are interrupted, whereas runs to the opposite direction are sustained.
Figure 1.

Confirmation of the pirouette mechanism and a hint of another mechanism. A, Schematic representation of a reversal and an ω turn which typically constitute a pirouette. B, An example of tracks of C. elegans. The black dot indicates the position of a NaCl spot. Circles indicate pirouettes, and the rest of the track is defined as runs. C, Evidence of the pirouette mechanism. Probability of pirouette is plotted for different dC/dT values. Error bars indicate SEM of the values from each animal (n = 67). See Materials and Methods for details of the data presentation. D, Worms appear to slowly curve toward the NaCl spots, which are indicated by black dots. Tracks of worms that started from the center of the grids were randomly selected and plotted. Only the run parts of the tracks are shown. E, Among the runs that passed the rectangular box, those that passed the box in the upward direction were selected. The trajectories before and after passing the box were plotted to see whether there is any bias in the curvature relative to the salt gradient peak. F, Definition of bearing of the NaCl peak (black dot) relative to the direction of locomotion, and curving rate. G, Definition of tangential and normal direction for calculation of NaCl gradient.
Importantly, however, in the computer simulation that Pierce-Shimomura et al. (1999) performed, the model animals driven by the pirouette strategy did not perform as well as real animals. We reexamined chemotaxis using a computer-assisted tracking system and found a different strategy called the weathervane strategy. In this strategy, animals curve during forward locomotion toward higher concentration of the chemical. Thus the forward locomotion, which had previously been considered a random movement, is shown to be regulated by sensory inputs. We show that C. elegans employ both of these strategies for chemotaxis and both are required for efficient chemotaxis. We further describe the neurons underlying these behaviors.
Materials and Methods
Worm culture and strains.
C. elegans strains were cultured at 20°C using a standard technique (Brenner, 1974) on NGM (nematode growth medium) plates with Escherichia coli NA22 as a food source. Strains used were all derivatives of C. elegans var. Bristol: wild-type N2, OH161: ttx-3(ot22) X., peEx131[lin-11::nlsGFP], Ex[ins-1::Venus], Ex[ttx-3::GFP], Ex[zig-5::Venus], and Ex[glr-1::Venus].
Chemotaxis assays.
Chemotaxis assay plates contained 10 ml of 1 mm CaCl2, 1 mm MgSO4, 5 mm potassium phosphate, pH 6.0, and 2% agar (Difco) in a 9 cm plastic dish. Unless otherwise noted, a grid format was used in which 1 μl each of 200 mm NaCl in low-salt buffer (see below) was spotted onto 12 grid points spaced 2 cm apart (supplemental Fig. 1A, available at www.jneurosci.org as supplemental material), and left for 1 h at 20°C to allow diffusion of NaCl. Single animals were picked from culture plates by platinum wire, transferred into low-salt buffer (1 mm CaCl2, 1 mm MgSO4, and 5 mm potassium phosphate, pH 6.0) and left for 1 h at room temperature (23°C). The animals were then recovered by a pipetter, washed in the same buffer with 0.05% gelatin, placed on the assay plate 1 h after NaCl had been spotted on the plate, and tracking was immediately started and lasted for 20 min. For a radial gradient assay, 5 μl each of 0.5 m NaCl in low-salt buffer was spotted at the center of the plate twice, once ∼19 h before the start of assay and once 4 h before the assay. For tracking, the animals started at a point 22 mm from the NaCl spot (supplemental Fig. 1B, available at www.jneurosci.org as supplemental material) (Pierce-Shimomura et al., 1999). For a plate pretreatment, animals picked from culture media were placed on a blank chemotaxis plate and left for 1 h. For salt conditioning, instead of pretreatment in low-salt buffer, animals were placed in 20 mm NaCl in low-salt buffer and processed as above. For odorant chemotaxis, grid format similar to NaCl chemotaxis was used, but odorants were spotted immediately before placing the animals. Dilutions of either diacetyl or isoamyl alcohol (0.5 μl each of 2 × 10⁻⁴) in ethanol was spotted.
Worm tracking system.
We used an Olympus dissecting microscope SZ60 equipped with transmission illuminator SZX-ILLB, a motorized stage (Chuo-Seiki MSS-150), and a video camera (Tokyo Electronic Industry CS3330Bi). Images were captured by the Capture kit MV imaging board (Media Cybernetics) and images of the animals were analyzed by ImagePro Plus (Media Cybernetics) to locate the centroid of the animal. The coordinate of the centroid was recorded, and when necessary, a move command was sent to the motorized stage from a Visual Basic program, which was a modification of the program kindly provided by S. Lockery (University of Oregon, Eugene, OR). The interval of image capture was 0.4–0.6 s and the recording time was 20 min. The video signal was also sent to a second PC and images were captured by Storm DV capture board (Canopus) as avi movies for off-line analyses.
Analysis of tracking data.
Any tracking data were discarded in which the animal was immotile (velocity <0.01 mm/s for more than half of all time points in a 10 s bin) for >20% of the recording time. Sharp turns were detected under the following criteria. A previous report defined a sharp turn as >50°/s of turning (Pierce-Shimomura et al., 1999). However, we find this definition inconvenient, because with long sampling intervals like this study and the previous one (Pierce-Shimomura et al., 1999), the value based on this definition is largely affected by the sampling interval. Therefore we adopted a geometrical definition of a sharp turn: >100° change in the direction of movement (a turn making an angle of <80°) (supplemental Fig. 1C, available at www.jneurosci.org as supplemental material). This value was selected to maximize identification of sharp turns (including start and end of long reversals and ω turns) and minimize mislabeling. In this definition, short reversals that do not cause alteration of locomotion direction are mostly omitted. Distribution of the length of swims, namely the intervals between sharp turns, are fit by two exponential curves and T crit was determined as described (supplemental Fig. 1F, available at www.jneurosci.org as supplemental material) (Pierce-Shimomura et al., 1999). However, because the definition of sharp turns are different from the previous study, T crit was equal to 3.18 s in this study in contrast to the previous value of 6.05 s. Pirouette was defined as consecutive sharp turns separated by less than T crit = 3.18 s similar to the previous study (Pierce-Shimomura et al., 1999). The rest of all time points are defined as runs (which could include short reversals). Concentration of NaCl (in millimolars) was calculated by the solution of Fick's equation for two-dimensional diffusion with no border: C = N o e−r2/400Dt/4πdDt, where N o = 0.2 (μm) is the amount of NaCl spotted, D = 0.000015 (cm2/s) is diffusion constant of NaCl, d = 0.18 (cm) is thickness of the plate, t is time (in seconds) after spotting, and r is distance (in millimeters) from the spot. Because Fick's equation is linear, the above value was summed for each of the 12 NaCl spots. For radial gradient, the same equation was used and the values for the two spot times were added. Bearing of gradient peak relative to worm locomotion, salt gradient and curving rate were determined as in Figure 1 F,G. All angles are defined as positive in the clockwise rotation.
Computer simulation.
The simulator renewed the position and direction of movement of a model animal every 0.6 s. Velocity of the animal was set to a constant value of 0.12 mm/s, which is the average velocity of wild-type animals on chemotaxis plates (see Results).
Even in the absence of chemical gradient, curving rate of real animals is not constant during runs but frequently changes in an apparently random manner. The overall distribution of curving rate shows normal distribution with a SD of 32.3°/mm. However, the curving rate values are strongly correlated in time, because of physical constraint of animals and the methods of sampling (supplemental Fig. 1D, available at www.jneurosci.org as supplemental material). supplemental Figure 2A–C, available at www.jneurosci.org as supplemental material, shows the extent of correlation over time. Distribution of curving rate is dependent on the curving rate 6 s before (average is close to the previous value), but independent of the curving rate 12 s before (average is always zero). Therefore, in the model animals, new curving rate values were chosen every 12 s from randomized values assuming a normal distribution with a mean of 0 and SD of 32.3°/mm. To avoid sudden changes of curving rate, the curving rate was changed linearly between consecutive guidepost values selected as above. Random fluctuations of curving rate in shorter time span observed in real worms were not incorporated in the model. Also, real animals show systematic curving biases that differ between individuals (Pierce-Shimomura et al. 1999), which was not incorporated in the model either, for the sake of simplicity. The latter idealization may lead to overestimation of the performance of the behavioral mechanisms in the model animals.
When the weathervane mechanism was incorporated, curving rate bias (in degrees per millimeter) was calculated as 12.7 × NaCl gradient perpendicular to the direction of movement (in millimolars per millimeter) based on the slope of the regression line of Figure 2 C. This value of curving rate bias was added to the random value determined as above. Based on the curving rate determined in this manner, the direction of movement was changed in each step (0.6 s). Pirouette was simply treated as an instant change in the direction of movement. Basal frequency of pirouette was set to 0.0197 events/s (frequency in real animals at dC/dT = 0). When the pirouette mechanism was incorporated, frequency of pirouette was calculated by the sigmoidal function 0.023/(0.40 + e 140dC/dT) + 0.0033 based on the fitting line for Figure 1 C (see below about the formula). In this case, the direction of the pirouette turn was selected from the distribution in supplemental Figure 1G (available at www.jneurosci.org as supplemental material) based on the value of bearing of the nearest NaCl peak. The direction of the nearest peak is not exactly identical with the direction of steepest NaCl gradient, which is the vectorial sum of the gradients formed by each NaCl spot. Although this approximation may also give overestimation of the performance of model animals, the effect must be small because the bias in Figure 1 G is not very strong.
Figure 2.

Evidence of the weathervane mechanism A, Relationship between bearing of NaCl peak and curving rate. B, Same as in A except that data from animals tracked on NaCl-free assay plates were used. The line is slightly shifted to the negative value. This is because each animal has a systematic bias of curving rate and the data set included more worms with negative bias. C, Relationship between NaCl gradient in normal direction and curving rate. D, Same as C except that data from animals tracked on NaCl-free assay plates were used. E, Relationship between NaCl gradient in tangential direction and curving rate. F, Relationship between NaCl concentration change (dC/dT) and curving rate. G, Schematic representation of the pirouette mechanism. H, Schematic representation of the weathervane mechanism. In G and H, the shading indicates NaCl gradient.
For Figure 3, simulation was repeated 500 times under each setting, average distance from the nearest NaCl peak was calculated for each model animal, the median value was determined, four animals around the median were selected, and the tracks of these representative animals were shown in Figure 3, left. Tracking data from real animals were similarly treated and representative tracks were selected and shown in Figure 3, left.
Figure 3.

Computer simulation. A–D, In each set, left four panels are examples of tracks of real animals (A) or simulated animals (B–D). See Materials and Methods for selection of representative tracks. The right-most panels show density plots of the animals' occurrence at each point. The darkness of each pixel is proportional to the fraction of time spent by an animal in that pixel relative to the total time, so that points frequently visited by the animals are darker. Results of the following numbers of animals were pooled. A, Real animals (n = 67). B, Computer simulation with the pirouette mechanism alone (n = 500). C, Computer simulation with the weathervane mechanism alone (n = 500). D, Computer simulation with both mechanisms (n = 500).
Chemotaxis index, weathervane index, pirouette index and curve fitting.
From the tracking data or simulation data, chemotaxis index (C. I.) was calculated as C. I. = [(time spent within mm from any NaCl peak) − (time spent outside the area)]/(total time of tracking). The threshold distance () is determined so that C. I. = 0 for randomly moving animals. As a measure of the strength of the weathervane response, the weathervane index was defined as follows. For each animal, the relationship between NaCl gradient and average curving rate was calculated as in Figure 2 C. Weathervane index was defined as the slope of the regression line. For a population of animals, averaged weathervane index was used.
Plots in Figure 1 C and Figure 7 showing the pirouette response were generated as follows. All data points of tracking data were classified into 10 groups according to dC/dT, so that the number of data points for each rank was equal. Because worms do not frequently encounter large absolute value of dC/dT, the widths of the ranks are not even. For each rank, the number of occurrence of pirouette was divided by the total time in which animals encountered the dC/dT value in that rank, giving the probability of pirouette. This calculation was done for each animal, and average and SEM were plotted for the midpoint of dC/dT in each rank. These values were fit by the sigmoidal curve with the formula y = 0.023/(a + ebx) + c, where y is pirouette probability in 1 per second, x is dC/dT in millimolars per second, and a, b, c are constants. The best-fit curves were determined by optimizing the constants using the least-squares method and shown by dotted lines in the figures. Although the mechanical bases of this relationship are to be determined in the future, empirically this equation fitted the data well. a = 0.40, b = 140, and c = 0.0033 for wild type. As seen from the figures, the probability data are highly variable especially for laser ablation experiments in which numbers of animals examined are small, because pirouette is a rare event and also because transgenic strains used for laser ablation experiments often showed abnormal pirouette frequency. Therefore, for statistical purposes data points were divided into 3 ranks rather than 10. An example is shown in supplemental Figure 1H, available at www.jneurosci.org as supplemental material. Pirouette index was defined as the difference of the probability between the lower dC/dT rank (for negative dC/dT) and the higher dC/dT rank (for positive dC/dT). This value was calculated for each animal and average and SEM was shown in Figure 8 C. Even with this simplification, the index was highly valuable and one should be careful in interpretation of the data. The middle rank is a measure of the basal pirouette frequency in the absence of salt concentration change (dC/dT = 0). This value was similarly treated and shown in Figure 8 D.
Figure 7.
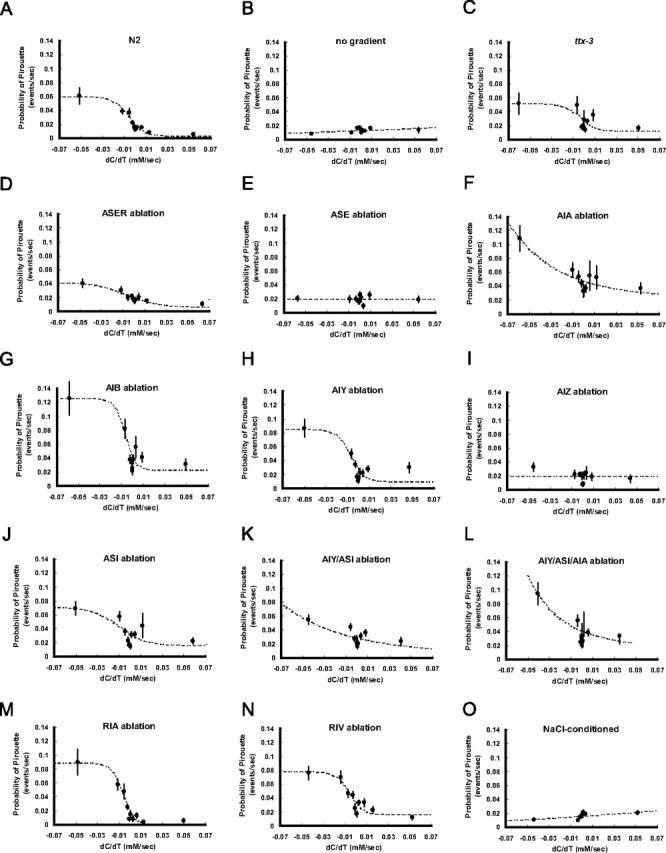
The pirouette response of cell-ablated animals. Same as in Figure 6 except that relationship between temporal change of NaCl concentration (dC/dT) and probability of pirouette is shown in this figure.
Figure 8.
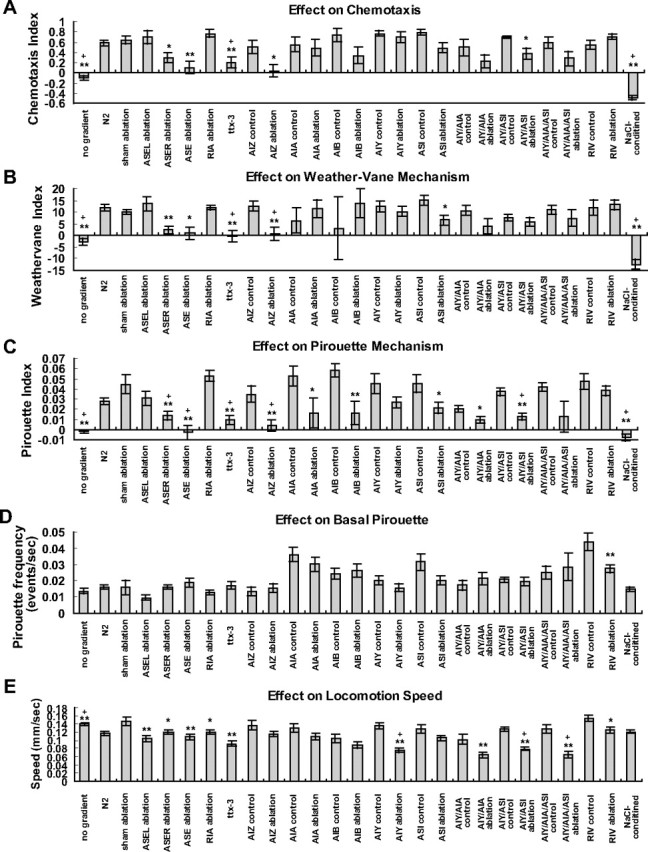
Quantification of the effects of cell ablation. A, Chemotaxis index showing the efficiency of chemotaxis. B, Weathervane index showing the extent of the weathervane response. C, Pirouette index showing the extent of the pirouette response. D, Basal frequency of pirouette at dC/dT = 0. E, Speed of locomotion. See Materials and Methods for definition of each index. Significant differences from the control (strains used for laser ablation, otherwise untreated N2 under standard assay conditions) are indicated by single asterisks (p < 0.05, t test), double asterisks (p < 0.01, t test) and plus symbols (p < 0.05, Bonferroni correction).
For all indices shown in Figure 8, the sets of values from each animal were subjected to unpaired t test. The mutant was compared with the wild type and laser-ablated animals were compared with the same marker strain sham operated. Double asterisks show p < 0.01 and single asterisks show p < 0.05. Because 16 comparisons were made among 27 data sets, Bonferroni correction was also made and significant differences at p < 0.05 were shown by plus symbols. Note that Bonferroni correction is conservative and the risk of type II errors (meaningful difference overlooked) is greatly increased when applied to comparisons of many data sets. AIZ ablation experiments were independently performed by two experimenters (YI and KY) and both obtained significant differences. Combined data are shown for AIZ ablations in Figure 8.
Laser ablation.
Laser ablation of neurons was performed at the L1–L3 stage (depending on the neuron) using Micropoint equipped to Zeiss upright microscope AxioSkop. Cells to be ablated were identified either by Nomarski optics [for ASEL (left ASE), ASER (right ASE), ASEL/R, and RIA] or DiO filling (for ASI) in N2, or using fluorescence of green fluorescent protein (GFP) or Venus expressed in the target neurons. As a control for each ablation, the same strain was sham operated. Behavioral parameters were compared between operated and sham-operated animals. Fluorescent lines used were Ex[ins-1::Venus] for AIA, Ex[glr-1::Venus] for AIB (Tomioka et al., 2006), Ex[ttx-3::GFP] for AIY, peEx131[lin-11::nlsGFP] for AIZ and Ex[zig-5::Venus] for RIV. The peEx131[lin-11::nlsGFP] and Ex[zig-5::Venus] strains were generated by microinjection into N2 of pGlin-11::nlsGFP and pGzig-5::Venus, respectively, which were generated with Gateway system using an entry vector carrying the genomic region spanning the third intron of lin-11 (1451–2838 relative to ATG) and the zig-5 promoter (−7076 to −1 relative to ATG), and destination vectors carrying nlsGFP and Venus, respectively (http://park.itc.utokyo.ac.jp/mgrl/IINO_lab/Gateway/Gateway_overview1.html). The numbers of animals analyzed are shown in Figure 5 and supplemental Figure 3, available at www.jneurosci.org as supplemental material. The numbers are the same for Figures 6, 7, 8 and supplemental Figures 4 and 5 (available at www.jneurosci.org as supplemental material), because the same data were used for all the plots and index calculations.
Figure 5.

Efficiency of chemotaxis in cell-ablated animals. Time spent at each position as fraction of total time is indicated by the darkness of that position. A, Untreated wild-type N2. B, Untreated N2 animals on assay plates without NaCl. C, Untreated ttx-3(ot22) mutants. D, N2 animals with ASER neurons ablated. E, N2 animals with both ASER and ASEL neurons ablated. F, Ex[ins-1::Venus] animals with AIA neurons ablated. G, Ex[glr-1::Venus] animals with AIB neurons ablated. H, Ex[ttx-3::GFP] animals with AIY neurons ablated. I, Ex[lin-11::nlsGFP] animals with AIZ neurons ablated. J, N2 animals with ASI neurons ablated. K, Ex[ttx-3::GFP] animals with AIY and ASI neurons ablated. L, Ex[ttx-3::GFP ins-1::Venus] animals with AIY, ASI, and AIA neurons ablated. M, N2 animals with RIA neurons ablated. N, Ex[zig-5::Venus] animals with RIV neurons ablated. O, N2 animals pretreated in NaCl-containing buffer. The numbers of animals tested for each test and average chemotaxis indices are shown for each panel.
Figure 6.
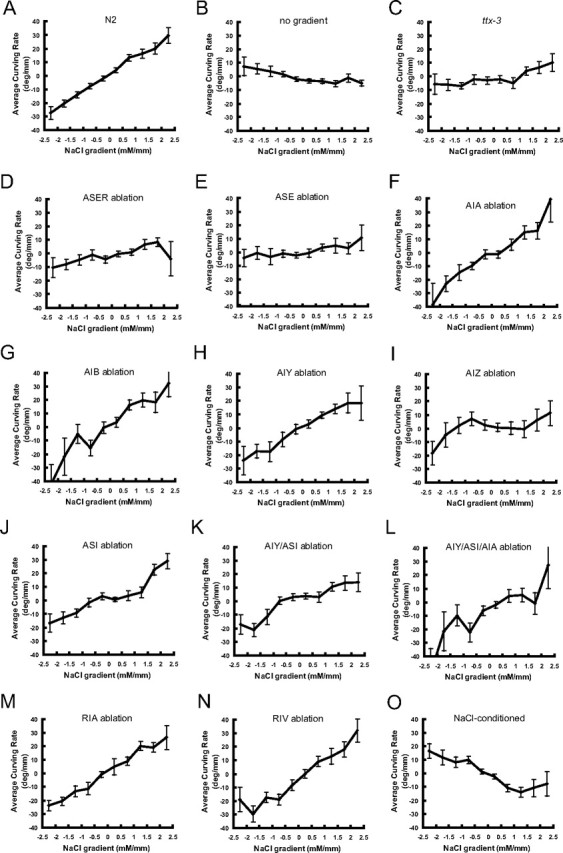
The weathervane response of cell-ablated animals. Relationships between NaCl gradient in normal direction and average curving rate are shown for each panel. A–O, Same as Figure 5.
Results
Confirmation of the pirouette mechanism
In an attempt to make the animals encounter as great a variation of salt concentration gradients as possible, we used the “grid format” in which NaCl was spotted in a grid pattern on chemotaxis agar (supplemental Fig. 1A, available at www.jneurosci.org as supplemental material) (see Materials and Methods). After allowing the salt to diffuse in agar, a single animal was placed and tracked for 20 min. In pilot experiments, animals were pretreated before the assays in two different ways because both treatments caused better chemotaxis than naive animals. In one set of experiments, they were kept on blank chemotaxis agar for 1 h (n = 62). In another set, animals were kept in low-salt buffer for 1 h before the assay (n = 95). We obtained essentially the same results with these two sets, and the buffer pretreatment was adopted for further analyses.
Among various possible mechanisms of aggregation to chemicals, orthokinesis, in which the velocity of animals' movement is reduced when the stimulus of the chemical is strong, is the simplest strategy. As shown before (Pierce-Shimomura et al., 1999), C. elegans does not use this strategy for chemotaxis. The speed of movement was approximately constant at ∼0.12 mm/s and did not systematically change depending on NaCl concentration (supplemental Fig. 1E, available at www.jneurosci.org as supplemental material). We then asked whether the pirouette mechanism is detected under our conditions. Pirouette was defined as a bout of sharp turns separated by less than a critical time, t crit, according to the previous analysis (Pierce-Shimomura et al., 1999), but the t crit value was adjusted to our system (see Materials and Methods). Based on this criteria, the whole locomotion was separated into pirouettes and runs (Fig. 1 A,B). As shown in Figure 1 C, the pirouette mechanism was confirmed. Namely, frequency of pirouette was higher when the change of salt concentration that the animal senses (dC/dT) was negative. Although biased random walk mechanism postulates nondirectional turns, Pierce-Shimomura and colleagues reported a weak bias of turning angle so that after the turn animals tend to orient themselves toward the peak of gradient. This was confirmed in the current analysis (supplemental Fig. 1G, available at www.jneurosci.org as supplemental material).
A novel mechanism for chemotaxis
Through observation of the tracks of the animals during chemotaxis, we noticed that C. elegans may tend to curve toward the gradient peak without using pirouette (Fig. 1 D–E). To test this possibility quantitatively, the following variables were defined. Curving rate (H = ψ/d, in degrees per millimeter) was defined as the change of direction of locomotion per unit length of an animal's advancement (Fig. 1 F; supplemental Fig. 1D, available at www.jneurosci.org as supplemental material). This value is inversely proportional to the radius (r, in millimeters) of the arc of curving such that H = 180/πr. Bearing (θ) is defined as the direction of nearest chemoattractant peak relative to the direction of animal's locomotion. Average curving rate was calculated for each bin (30°) of bearing, and the result (Fig. 2 A) (n = 67) shows a clear relationship between the two values. It shows that C. elegans turns, on average, toward chemoattractant peak, and the absolute value of curving rate is largest at θ = ±90°, namely when animals proceed perpendicular to the direction of the NaCl spot. Note that we omitted all pirouettes in this analysis and used only the “run” part of locomotion. Therefore, animals curve toward higher concentration of NaCl without using sharp turning by reversals and ω turns. To confirm that the correlation is caused by the effect of NaCl rather than the geometry of the plate format, movement of the animals on assay plates without NaCl was tracked and the data analyzed in exactly the same procedure, namely based on the bearing of the nearest grid point. The resulting plot shows no bias of curving rate (Fig. 2 B) (n = 64), confirming that the relationship in Figure 2 A shows a response to NaCl.
To curve depending on the direction of NaCl peak, animals must be sensing local environment of the chemical. Therefore, average curving rate was plotted against spatial gradient of NaCl concentration at the position of the animal. Salt concentration was calculated from time and position on the plate based on diffusion equation. The gradient was assessed in two components, tangential to the direction of locomotion and in the normal direction (Fig. 1 G). Curving rate showed clear correlation with the NaCl gradient in normal direction (Fig. 2 C), whereas it showed no relationship with the NaCl gradient in tangential direction (Fig. 2 E). No correlation was observed when the movement on NaCl-free plates was tracked and analyzed in a similar manner (Fig. 2 D). Because in the pirouette mechanism animals respond to the temporal change of chemoattractant concentration (dC/dT), the relationship between dC/dT and curving rate was also tested, but no correlation was detected (Fig. 2 F). We also analyzed the chemotaxis behavior in the regular plate format with radial gradient of NaCl (supplemental Fig. 1B, available at www.jneurosci.org as supplemental material), and obtained essentially the same relationship as above (supplemental Fig. 2D–E, available at www.jneurosci.org as supplemental material).
In summary, C. elegans shows two different responses to the salt during chemotaxis. They respond by pirouettes to the temporal change of chemoattractant concentration, which is proportional to the spatial gradient in the tangential direction (Fig. 2 G). However, they respond to spatial gradient perpendicular to the direction of locomotion by gradually curving to the side (ventral or dorsal) with higher chemoattractant concentration (Fig. 2 H). This mechanism is hereafter called “the weathervane mechanism” based on an analogy between chemoattractants and wind (Pierce-Shimomura et al., 1999, 2005).
Contribution of the pirouette strategy and the weathervane strategy to chemotaxis
Does the weathervane response contribute to chemotaxis at all? If it does, are the two mechanisms, pirouette and weathervane, both needed for chemotaxis? To assess the contribution of each strategy, computer simulation was performed. Model animals proceed at a constant velocity during runs as real animals do, and randomly curve, also as real animals do in the absence of chemical gradient. They also occasionally change the direction of locomotion instantly, mimicking the pirouettes (see Materials and Methods). These settings generate the basic movement of model animals. When the pirouette mechanism is implemented, the probability of occurrence of pirouette is set based on the relationship in Figure 1 C and the bias of turning angle at pirouettes is also introduced (based on supplemental Fig. 1G, available at www.jneurosci.org as supplemental material). When the weathervane mechanism is implemented, the curving rate determined by the relationship with NaCl gradient in Figure 2 C was added to the random value given for the basic movement. With the pirouette mechanism alone, model animals are attracted to NaCl spots but the efficiency is not as good as real worms (Fig. 3, compare density plots in B with those in A). This is in agreement with the previous report (Pierce-Shimomura et al., 1999). When the weathervane mechanism alone is implemented, model animals also showed the ability to aggregate at the peak, but not as well as real worms (Fig. 3 C). With both mechanisms at work, tracks of model animals look more like real animals, and the efficiency of chemotaxis is as good as real worms (Fig. 3 D). These results suggest that C. elegans employs both the pirouette and weathervane strategies for salt chemotaxis. They operate in parallel during chemotaxis and it is essential for efficient chemotaxis that both mechanisms are at work.
The weathervane strategy is also observed for odorant chemotaxis
In addition to water-soluble salts, C. elegans shows chemotaxis to volatile chemoattractants. It was recently demonstrated that C. elegans also respond to a decrease in the concentration of odorants by increasing the frequency of reversals (Chalasani et al., 2007; Luo et al., 2008). These observations are consistent with the assumption that odorant chemotaxis is also achieved by the pirouette strategy. To see whether the weathervane strategy is used in odorant chemotaxis, chemotaxis to the odorants isoamyl alcohol and diacetyl was analyzed by the worm tracking system. Figure 4, A and B, shows that, as with the case of NaCl (Fig. 2 A), worms show a clear bias of curving toward the peak of odorants. These results strongly suggest that odorant chemotaxis also employs the weathervane strategy. It is difficult to quantitatively predict spatial distribution of odorant concentration on the plate, because odorants diffuse through air and also dissolve into the aqueous phase in agar, to which C. elegans has access. Therefore the relationship between odorant concentration and curving rate was not calculated.
Figure 4.
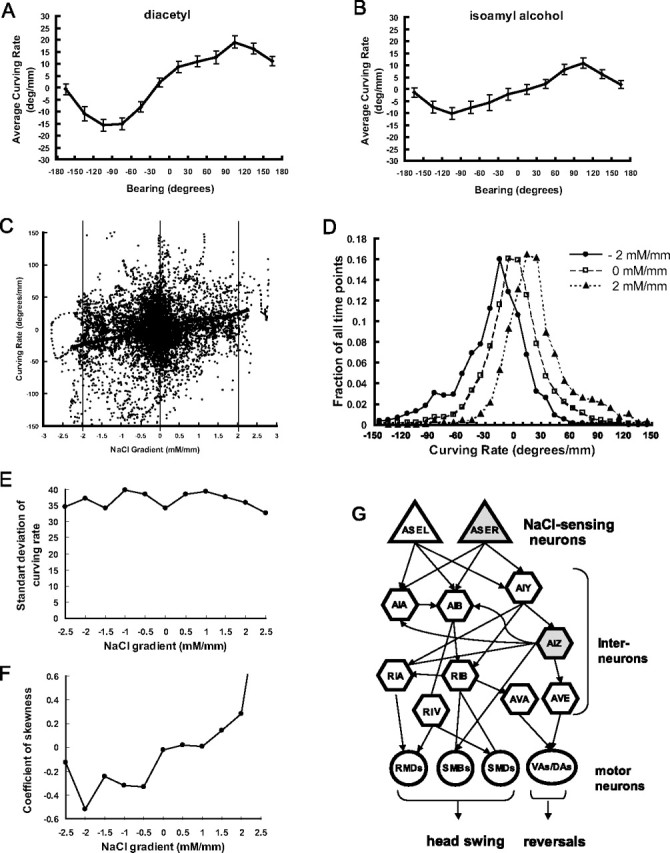
The weathervane strategy for odorant chemotaxis and variability of curving rates. A, B, Relationship between bearing of the odorant spots and curving rate. A, Dilution of diacetyl (10−4), B , dilution of isoamyl alcohol (10−4). C, Curving rates were plotted against NaCl gradient in normal direction for all data points. The thick line indicates the average values. D, Histogram showing distribution of curving rate for fixed NaCl gradient. Extraction of data points from C that have the given value of NaCl gradient. E, F, SD of curving rates (E) and coefficient of skewness (F) for each value of NaCl gradient. G, Simplified amphid neural circuit including neurons tested in this study. Arrows indicate chemical synapses and lines show gap junctions.
Weathervane response is caused by both steady bias of curving and abrupt steep curving
For the weathervane strategy, worms steer the course of their progression. Because worms proceed by sinusoidal body waving, curvature of its course is likely to be generated by the head swing biased to either ventral or dorsal side. By visual inspection of movies captured during tracking and brief quantification of body posture, it was confirmed that biased head swing was actually the cause of curving. In these behaviors, both continuous weak biasing and abrupt turning by one or two heavily biased head swing appeared to exist. Do both of these events contribute to the weathervane response to NaCl gradient? As described earlier, the relationship in Figure 2 C shows averaged curving rate. The dot matrix shown in Figure 4 C depicts all the data points, showing the variability of curving rate and the bias on it imposed by NaCl gradient. The statistical nature of the curving can be extracted by examining how the distribution of the curving rate changes depending on the NaCl gradient. Figure 4 D shows histograms of curving rate for three different NaCl gradient values, corresponding to three vertical cross-sections of Figure 4 C. It is obvious at first sight that the whole peak is shifted, indicating that NaCl gradient causes steering toward higher concentration of NaCl by imposing a steady bias of curving by an amount proportional to the NaCl gradient throughout the migration time. However, it also appears that the distributions flare out at the bottom toward positive curving rate at positive NaCl gradient and vice versa. This was confirmed by evaluation of the coefficient of skewness (third order moment around the mean, a measure of asymmetry of the distribution), which had a positive correlation with NaCl gradient (Fig. 4 F). These results suggest that in addition to steady bias of curving rate, there are also rare big curving events toward salt gradient peak that contribute to the weathervane strategy.
Neural circuit underlying the weathervane and pirouette responses
The next question is, which neurons and neural circuits mediate the weathervane and pirouette responses (Fig. 4 G). To answer this question, candidate neurons were removed by laser ablation and the behaviors of cell-ablated animals were quantified by worm tracking system (Figs. 5 –8). Although many of the laser ablations caused changes in the average speed of locomotion (Fig. 8 E), only a few caused an obvious change in the efficiency of chemotaxis (Figs. 5, 8 A). As for sensory neurons, previous laser ablation experiments showed that chemotaxis to sodium and chloride ions are mediated mainly by the ASE sensory neurons with minor contributions of ADF, ASG, and ASI (Bargmann and Horvitz, 1991). To assess the contribution of ASE sensory neurons, we laser ablated ASEL, ASER, or both. Ablation of ASEL had no apparent effect (supplemental Figs. 3B, 4 B, 5 B, available at www.jneurosci.org as supplemental material), whereas killing ASER caused partial impairment of both pirouette and weathervane responses, leading to poor chemotaxis (Figs. 5 D, 6 D, 7 D). Killing ASEL on top of ASER causes almost complete abolishment of both responses (Figs. 5 E, 6 E, 7 E, 8) (significant effect of ASEL/R ablations on chemotaxis index, F (3,53) = 7.38; on weathervane index, F (3,53) = 6.37; on pirouette index, F (3,53) = 8.52; p < 0.001 for all indices, one-way ANOVA). Therefore, the pirouette response and weathervane response are mediated by the same sensory neurons: ASER playing a major role with ASEL also contributing. The ASEL ablation results show that presence of two ASE neurons is not required for the responses.
Based on the neural circuit diagram (White et al., 1986, Gray et al., 2005), ASE neurons send major synaptic outputs to AIA, AIB and AIY interneurons, which are further connected to AIZ, RIA, RIV and other neurons (Fig. 4 G). Killing the primary interneurons AIA, AIB or AIY did not cause discernible effect on chemotaxis. There is a possible reduction of pirouette responses by the ablations of AIA or AIB, but the results are difficult to evaluate because the transgenic GFP strains used for the laser ablation experiments showed elevated pirouette frequencies (Figs. 7 F,G, 8 C,D; supplemental Fig. 5C,D, available at www.jneurosci.org as supplemental material). Another amphid interneuron thought to be important for chemosensory information processing is AIZ (Fig. 4 G). When AIZ neurons were laser ablated, a severe impairment of chemotaxis and defects of the weathervane and pirouette responses similar in extent to ASE ablation were observed (Figs. 5 I, 6 I, 7 I). The ttx-3 mutant is known for impaired functions of AIY. Surprisingly, chemotaxis, the weathervane response and pirouette response were all greatly reduced in the ttx-3(ot22) mutant unlike AIY ablation (Figs. 5 C, 6 C, 7 C). In addition to AIY, ttx-3 is expressed in AIA, ASI, and ADL and the mutant shows altered gene expression in AIA neurons (Altun-Gultekin et al., 2001). Therefore, we double-ablated AIY and AIA, but the strong defect seen in the mutant was not reproduced. Ablation of ASI had a small reduction of weathervane and pirouette responses. Combined ablation of AIY/AIA, AIY/ASI, and AIY/AIA/ASI caused partial mimic of the ttx-3 defect, but the impairment was not so severe (Figs. 5 –8; supplemental Figs. 3–5, available at www.jneurosci.org as supplemental material). Among the ttx-3 expressing neurons, ADL was not tested in this study, and these neuron or some other unidentified neurons could explain the discrepancy between the ttx-3(ot22) mutant and the triple ablation. Among other interneurons associated with amphid sensory circuit, RIA neurons receive synaptic inputs from both AIY and AIZ and densely innervate SMD and RMD head motor neurons, and therefore appeared possibly important for head swing and the weathervane response. RIV neurons receive inputs from AIB neurons through gap junctions, connected to head motor neurons SMD and RMD and is important for ventral body bend (Gray et al., 2005). However, laser killing of neither RIA nor RIV affected chemotaxis (Figs. 5 –8).
Salt chemotaxis learning causes reversed responses
Chemotaxis behavior is not rigidly stereotyped, but shows plasticity according to prior experience. Chemotaxis to salt is known to be altered by prior treatment with salt in a paradigm called either gustatory plasticity or salt chemotaxis learning (Saeki et al., 2001; Hukema et al., 2006; Tomioka et al., 2006). Interestingly, treatment of C. elegans in a salt-containing buffer causes a change of chemotaxis from attraction to avoidance of salt. It is therefore of interest to look at the strategy for this avoidance behavior. C. elegans animals were pretreated in salt-containing buffer and then chemotaxis behavior was analyzed by worm tracking. The results are shown in Figures 5 O, 6 O, 7 O, and 8 (n = 70). They show that salt conditioning causes a reversed response in both pirouette and weathervane strategies. The probability of pirouette is slightly higher when NaCl concentration increases, in contrast to unconditioned animals. The weathervane response is reversed so that worms tend to curve away from the gradient peak. We have previously shown that regulation of the ASER sensory neurons is important for salt chemotaxis learning (Tomioka et al., 2006). The above results are consistent with these observations, although further cellular and molecular studies are needed to delineate the learning-induced changes.
Discussion
Chemotaxis in C. elegans is under intensive studies from various perspectives because it offers a convenient way to monitor sensory function and motor control of the animals, which depend on proper development of the nervous systems, maintenance of neuronal morphology, chemosensory signal transduction and synaptic transmission. Chemotaxis is also subject to behavioral plasticity by sensory adaptation and learning. Based on these advantages, extensive molecular and cellular studies have been performed. Therefore it is important to understand the detailed behavior of the animals during chemotaxis and behavioral strategy for chemotaxis that this species adopt. In this respect, the pirouette mechanism was reported almost a decade ago, and the mechanism was widely accepted. In fact, in addition to the result of tracking analyses (Pierce-Shimomura et al., 1999), various behavioral analyses have supported this model: by using glued animals and semirestrained animals, it was shown that worms show a reversal response to a decrease in salt concentration (Dusenbery, 1980; Faumont et al., 2005; Miller et al., 2005). Similar reversal responses were detected for odorants (Chalasani et al., 2007; Luo et al., 2008). Behavioral analyses of the temperature response also supported the pirouette model (Ryu and Samuel, 2002).
In this report, we found another mechanism, the weathervane mechanism, which has been overlooked since the proposal of the pirouette model (Pierce-Shimomura et al., 1999). The weathervane mechanism, which was actually proposed by Sam Ward in 1973 but was not supported further (Ward, 1973; Pierce-Shimomura et al., 2005), is fundamentally different from the pirouette mechanism in two aspects. (1) The pirouette mechanism involves the pirouette behavior, which is a bout of sharp turns triggered by a reversal, whereas the weathervane mechanism does not involve pirouettes nor reversals. (2) In the pirouette mechanism, animals respond to the change of salt concentration along the line of locomotion, whereas in the weathervane mechanism they respond to salt concentration gradient perpendicular to the direction of locomotion. Our computer simulation suggests that both strategies are important for efficient chemotaxis.
Aggregation behaviors triggered by environmental cues are commonly observed in various animals. By careful consideration of experiments on aggregation behaviors, several strategies were defined (Frankel and Gunn, 1961). Of particular interest are two principal strategies thus defined, klinokinesis and klinotaxis, which are often used for aggregation to chemicals. Klinokinesis refers to a strategy in which an animal changes the frequency of random turning in response to the (change of) intensity of stimuli. Bacterial chemotaxis is a well known example of klinokinesis, in which decrease in chemical concentration induces a “tumbling” which leads to a change of the direction of migration. Klinotaxis, however, refers to a strategy in which animals select the direction of locomotion so that they move toward (or away from) the stimulus. One example is negative phototaxis of fly larvae, where the larva continuously waves its head whereby comparing the intensity of illumination on both side, and turns toward weaker intensity of light (Frankel and Gunn, 1961). In the case of C. elegans, the pirouette strategy is an example of klinokinesis and the weathervane strategy belongs to the category klinotaxis. Our present study reveals that, although chemical response of C. elegans is conventionally called chemo-“taxis,” it is actually achieved by a combination of the two major categories of aggregation strategies, klinokinesis and klinotaxis.
The presence of two types of responses raises important questions. (1) How do the animals detect different components of sensory information? (2) How do they transmit the two different components of information in the nervous system and differentially process them? (3) How do they change the migration direction in the weathervane mechanism? To start to answer these questions, we performed laser ablation studies. Several previous studies attempted to determine the neurons that affect the frequency of reversals (Tsalik and Hobert, 2003; Wakabayashi et al., 2004; Gray et al., 2005). In these studies, ablation of the sensory neurons ASE or interneurons AIA or AIY increased the frequency of reversals, whereas killing the sensory neurons AWC or interneurons AIB or AIZ decreased it, leading to proposals of neural circuits that control reversal frequency under the influence of chemosensory inputs (Wakabayashi et al., 2004; Gray et al., 2005). In these studies, the reversals are thought to be mainly induced by removal from food (Chalasani et al., 2007). In our current analyses, the effect of laser ablation on overall frequency of pirouette was not pronounced (Fig. 8 D), probably because we pretreated the animals in food-free buffer for 1 h before the assays. Therefore food-off response was probably not observed. In our analyses, which therefore assessed the pure response to salt gradients, ASE and AIZ neurons were found essential. Because both pirouette and weathervane responses are impaired by ablation of either ASE or AIZ, these neurons comprise the common pathway for both responses. Although killing AIA or AIB neurons might have specific effects on the pirouette mechanism, we cannot conclude it from our data because pirouettes are rare events and vulnerable to genetic and environmental conditions making the quantification and evaluation of small differences difficult.
In thermotaxis, at least two different behavioral components were detected. One is the pirouette response mentioned above, and another characteristic behavior is isothermal tracking (Mori and Ohshima, 1995; Luo et al., 2006). In this behavior, worms move along the isothermal line. Because worms seem to steer their way along the isothermal line without using sharp turns, this behavior may share some sensory and/or motor components with the weathervane response in chemotaxis. In this respect, the difference of the contribution of RIA neurons is worth noting. These neurons receive synaptic inputs from AIY and AIZ neurons and densely innervate head motor neurons SMD and RMD. Laser ablation of RIA neurons and a mutation that impairs the function of these neurons cause athermotactic behavior (Mori and Ohshima, 1995; Tanizawa et al., 2006). However, killing RIA neurons had absolutely no effect on chemotaxis. Along with the apparent dispensability of AIY neurons in chemotaxis, this result highlights the difference in the neural circuit for chemotaxis and thermotaxis. In chemotaxis, only the ablation of AIZ neurons caused severe defects among the individual ablations of amphid interneurons tested. Synaptic targets of AIZ neurons include AVE command interneurons which can regulate reversal, RIM neurons which in turn innervate command interneurons, and SMB head motor neurons. Therefore AIZ might be key neurons that control both reversal and biased head swing that causes slow curving. AIZ had long been known to be essential for chemotaxis, and ectopic activation of a transcription factor in these neurons cause hyper-adaptation in odorant chemotaxis (Bargmann and Mori, 1997; Sze and Ruvkun, 2003). RIV neurons also appeared a good candidate for neurons controlling biased head swing needed for the weathervane mechanism, because a previous study showed that killing RIV neurons almost abolishes the ventral bias of body bend during ω turns (Gray et al., 2005). Our results, however, indicate that these neurons are probably not involved in the weathervane response.
A major unanswered question about the weathervane response is how worms detect the spatial gradient of chemicals in the direction perpendicular to its own locomotion. The most likely possibility is that worms sense the change of chemoattractant concentration during each head swing, as a difference between ventral head position and dorsal head position. In this case it is important to note that the calculated difference in NaCl concentration between the two head positions in our grid format is ∼0.1 mm. No or marginal response was observed in ASE neurons to this small concentration step by calcium imaging (Suzuki et al., 2008). Therefore, there seems to be a need for a means to amplify the small sensory response to a subtle concentration change and accumulate the information. However, there is an intrinsic large variability in the curving rate of locomotion, even in the absence of a chemoattractant. The curving response to the small signal is therefore in battle with this large noise in the weathervane mechanism. Our analysis on the statistical relationship between salt gradient and curving suggests that C. elegans shows steady response to salt gradient and also shows occasional large responses to it. Therefore in the future analyses, it is important to understand how information of salt gradient causes, on one hand, instantaneous reflex responses, and is also kept in the nervous system as internal representation of the environment and causes sustained behavioral bias. It is also an important question how the slow concentration change relevant to the pirouette response and the concentration change at a higher frequency relevant to the weathervane response are differentially extracted from the one-dimensional information received by the ASER neuron.
Footnotes
This study was supported by Sumitomo Foundation and KAKENHI (Grant-in-Aid for Scientific Research) on Priority Areas Systems Genomics from the Ministry of Education, Culture, Sports, Science, and Technology of Japan. We thank Miho Sotodate for performing worm tracking assays, Jon Pierce-Shimomura and Shawn Lockery for providing the prototype of tracking program, and Caenorhabditis Genetics Center, which is funded by the National Institutes of Health–National Center for Research Resources, for C. elegans strains.
References
- Altun-Gultekin Z, Andachi Y, Tsalik EL, Pilgrim D, Kohara Y, Hobert O. A regulatory cascade of three homeobox genes, ceh-10, ttx-3 and ceh-23, controls cell fate specification of a defined interneuron class in C. elegans . Development. 2001;128:1951–1969. doi: 10.1242/dev.128.11.1951. [DOI] [PubMed] [Google Scholar]
- Bargmann CI, Horvitz HR. Chemosensory neurons with overlapping functions direct chemotaxis to multiple chemicals in C. elegans . Neuron. 1991;7:729–742. doi: 10.1016/0896-6273(91)90276-6. [DOI] [PubMed] [Google Scholar]
- Bargmann CI, Mori I. Chemotaxis and thermotaxis. In: Riddle DL, Blumenthal T, Meyer BJ, Priess JR, editors. C. elegans II. Cold Spring Harbor, NY: Cold Spring Harbor Laboratory; 1997. pp. 717–738. [PubMed] [Google Scholar]
- Brenner S. The genetics of Caenorhabditis elegans . Genetics. 1974;77:71–94. doi: 10.1093/genetics/77.1.71. [DOI] [PMC free article] [PubMed] [Google Scholar]
- Chalasani SH, Chronis N, Tsunozaki M, Gray JM, Ramot D, Goodman MB, Bargmann CI. Dissecting a circuit for olfactory behaviour in Caenorhabditis elegans . Nature. 2007;450:63–70. doi: 10.1038/nature06292. [DOI] [PubMed] [Google Scholar]
- Dusenbery D. Responses of the nematode Caenorhabditis elegans to controlled chemical stimulation. J Comp Physiol. 1980;136:327–331. [Google Scholar]
- Faumont S, Miller AC, Lockery SR. Chemosensory behavior of semi-restrained Caenorhabditis elegans . J Neurobiol. 2005;65:171–178. doi: 10.1002/neu.20196. [DOI] [PubMed] [Google Scholar]
- Frankel GS, Gunn DL. The orientation of animals. London: Dover; 1961. [Google Scholar]
- Gray JM, Hill JJ, Bargmann CI. A circuit for navigation in Caenorhabditis elegans . Proc Natl Acad Sci U S A. 2005;102:3184–3191. doi: 10.1073/pnas.0409009101. [DOI] [PMC free article] [PubMed] [Google Scholar]
- Hukema RK, Rademakers S, Dekkers MP, Burghoorn J, Jansen G. Antagonistic sensory cues generate gustatory plasticity in Caenorhabditis elegans . EMBO J. 2006;25:312–322. doi: 10.1038/sj.emboj.7600940. [DOI] [PMC free article] [PubMed] [Google Scholar]
- Luo L, Clark DA, Biron D, Mahadevan L, Samuel AD. Sensorimotor control during isothermal tracking in Caenorhabditis elegans . J Exp Biol. 2006;209:4652–4662. doi: 10.1242/jeb.02590. [DOI] [PubMed] [Google Scholar]
- Luo L, Gabel CV, Ha HI, Zhang Y, Samuel AD. Olfactory behavior of swimming C. elegans analyzed by measuring motile responses to temporal variations of odorants. J Neurophysiol. 2008;99:2617–2625. doi: 10.1152/jn.00053.2008. [DOI] [PubMed] [Google Scholar]
- Miller AC, Thiele TR, Faumont S, Moravec ML, Lockery SR. Step-response analysis of chemotaxis in Caenorhabditis elegans . J Neurosci. 2005;25:3369–3378. doi: 10.1523/JNEUROSCI.5133-04.2005. [DOI] [PMC free article] [PubMed] [Google Scholar]
- Mori I, Ohshima Y. Neural regulation of thermotaxis in Caenorhabditis elegans . Nature. 1995;376:344–348. doi: 10.1038/376344a0. [DOI] [PubMed] [Google Scholar]
- Pierce-Shimomura JT, Morse TM, Lockery SR. The fundamental role of pirouettes in Caenorhabditis elegans chemotaxis. J Neurosci. 1999;19:9557–9569. doi: 10.1523/JNEUROSCI.19-21-09557.1999. [DOI] [PMC free article] [PubMed] [Google Scholar]
- Pierce-Shimomura JT, Dores M, Lockery SR. Analysis of the effects of turning bias on chemotaxis in C. elegans . J Exp Biol. 2005;208:4727–4733. doi: 10.1242/jeb.01933. [DOI] [PubMed] [Google Scholar]
- Ryu WS, Samuel AD. Thermotaxis in Caenorhabditis elegans analyzed by measuring responses to defined thermal stimuli. J Neurosci. 2002;22:5727–5733. doi: 10.1523/JNEUROSCI.22-13-05727.2002. [DOI] [PMC free article] [PubMed] [Google Scholar]
- Saeki S, Yamamoto M, Iino Y. Plasticity of chemotaxis revealed by paired presentation of a chemoattractant and starvation in the nematode Caenorhabditis elegans . J Exp Biol. 2001;204:1757–1764. doi: 10.1242/jeb.204.10.1757. [DOI] [PubMed] [Google Scholar]
- Suzuki H, Thiele TR, Faumont S, Ezcurra M, Lockery SR, Schafer WR. Functional asymmetry in Caenorhabditis elegans taste neurons and its computational role in chemotaxis. Nature. 2008;454:114–117. doi: 10.1038/nature06927. [DOI] [PMC free article] [PubMed] [Google Scholar]
- Sze JY, Ruvkun G. Activity of the Caenorhabditis elegans UNC-86 POU transcription factor modulates olfactory sensitivity. Proc Natl Acad Sci U S A. 2003;100:9560–9565. doi: 10.1073/pnas.1530752100. [DOI] [PMC free article] [PubMed] [Google Scholar]
- Tanizawa Y, Kuhara A, Inada H, Kodama E, Mizuno T, Mori I. Inositol monophosphatase regulates localization of synaptic components and behavior in the mature nervous system of C. elegans . Genes Dev. 2006;20:3296–3310. doi: 10.1101/gad.1497806. [DOI] [PMC free article] [PubMed] [Google Scholar]
- Tomioka M, Adachi T, Suzuki H, Kunitomo H, Schafer WR, Iino Y. The insulin/PI 3-kinase pathway regulates salt chemotaxis learning in Caenorhabditis elegans . Neuron. 2006;51:613–625. doi: 10.1016/j.neuron.2006.07.024. [DOI] [PubMed] [Google Scholar]
- Tsalik EL, Hobert O. Functional mapping of neurons that control locomotory behavior in Caenorhabditis elegans . J Neurobiol. 2003;56:178–197. doi: 10.1002/neu.10245. [DOI] [PubMed] [Google Scholar]
- Wakabayashi T, Kitagawa I, Shingai R. Neurons regulating the duration of forward locomotion in Caenorhabditis elegans . Neurosci Res. 2004;50:103–111. doi: 10.1016/j.neures.2004.06.005. [DOI] [PubMed] [Google Scholar]
- Ward S. Chemotaxis by the nematode Caenorhabditis elegans: identification of attractants and analysis of the response by use of mutants. Proc Natl Acad Sci U S A. 1973;70:817–821. doi: 10.1073/pnas.70.3.817. [DOI] [PMC free article] [PubMed] [Google Scholar]
- White JG, Southgate E, Thomson JN, Brenner S. The structure of the nervous system of Caenorhabditis elegans . Philos Trans R Soc Lond B Biol Sci. 1986;314:1–340. doi: 10.1098/rstb.1986.0056. [DOI] [PubMed] [Google Scholar]