

Abstract
The frequency profiles of various extracellular field oscillations are known to reflect functional brain states, yet we lack detailed explanations of how these brain oscillations arise. Of particular clinical relevance are the high-frequency oscillations (HFOs) associated with interictal events and the onset of seizures. These time periods are also when pyramidal firing appears to be vetoed by high-frequency volleys of inhibitory synaptic currents, thereby providing an inhibitory restraint that opposes epileptiform spread (Trevelyan et al., 2006, 2007). The pattern and timing of this inhibitory volley is suggestive of a causal relationship between the restraint and HFOs. I show that at these times, isolated inhibitory currents from single pyramidal cells have a similarity to the extracellular signal that significantly exceeds chance. The ability to extrapolate from discrete currents in single cells to the extracellular signal arises because these inhibitory currents are synchronized in local populations of pyramidal cells. The visibility of these inhibitory currents in the field recordings is greatest when local pyramidal activity is suppressed: the correlation between the inhibitory currents and the field signal becomes worse when local activity increases, suggestive of a switch from one source of HFO to another as the restraint starts to fail. This association suggests that a significant component of HFOs reflects the last act of defiance in the face of an advancing ictal event.
Introduction
Recordings of oscillations in the extracellular field are among the oldest type of brain recordings, dating back to Berger in the 1920s (Berger, 1929; Buzsaki, 2006). Many studies have shown consistent relationships of various frequency oscillations with particular brain states: slow waves (<2 Hz; sleep, anesthesia) (Steriade, 2003), alpha rhythms (8–10 Hz; relaxed wakefulness) (Adrian and Yamagiwa, 1935), theta (4–12 Hz; low level mental activity including exploratory behavior and REM sleep) (Soltesz and Deschênes, 1993; Bragin et al., 1995; Buzsáki, 2002), gamma rhythms (30–80 Hz, exploratory behavior) (Soltesz and Deschênes, 1993; Bragin et al., 1995), ripples (80–200 Hz, memory consolidation, epileptic discharges) (Ylinen et al., 1995; Bragin et al., 1999a), and fast ripples (>200 Hz, epileptic discharges) (Ylinen et al., 1995; Bragin et al., 1999a,b; Grenier et al., 2001). For all these rhythms however, we have struggled to progress beyond making these associations to really understand the significance of the electrophysiology. Understanding the origin of these different rhythms and their functional significance remains a major goal of brain research.
Several studies have noted cell-specific firing patterns associated with different rhythms (Buzsáki et al., 1992; Klausberger et al., 2003; Hasenstaub et al., 2005). It remains unclear however, how the firing translates into the field potential. At what level can these rhythms be understood? Might it be possible to understand local field potential oscillations in terms of particular membrane currents? The microscopic structure of the network and the nature of synaptic events suggest that certain synaptic currents may be highly visible in the extracellular signal. For instance, a single presynaptic axon can induce currents simultaneously in many postsynaptic targets. The visibility of such currents may be further amplified if the receptor conductance and driving force (Em − Ereceptor) are large.
The study of high-frequency oscillations (HFOs; 80–500 Hz) has assumed particular clinical significance because of their association with the onset of seizures and with interictal events in seizure prone individuals (Ylinen et al., 1995; Bragin et al., 1999a,b). Indeed, much effort has been expanded trying to use such HFOs in seizure prediction algorithms (Schelter et al., 2008). Implicit in these studies is the assumption that HFOs in some way trigger seizures (Traub et al., 2001; Grenier et al., 2003). Recent electrophysiological evidence suggests an alternative explanation: that the HFOs in fact reflect attempts by the network to halt the seizure. The critical observation is that pyramidal cells receive high-frequency inhibitory barrages at these same times (Timofeev et al., 2002; Trevelyan et al., 2006), which serve apparently to restrict epileptiform spread (Trevelyan et al., 2006, 2007). Might these inhibitory barrages give rise to HFOs in the extracellular field, thereby linking this well described electroencephalographic feature with the old hypothesis of a cortical inhibitory restraint (Prince and Wilder, 1967)? I examine this relationship using an in vitro model of the inhibitory restraint (Trevelyan et al., 2006, 2007).
Materials and Methods
Slice preparation.
All animal handling and experimentation were done according to UK Home Office guidelines. All recordings were made from slices of occipital cortex prepared acutely from postnatal day 13 to 33 d C57BL/6 mice. Our findings appeared consistent over this age range (supplemental Figure, available at www.jneurosci.org as supplemental material) and so the data were pooled. The animals were killed by cervical dislocation (schedule 1), and the brain removed and submerged in ice-cold artificial CSF with supplemented Mg2+, but lacking Ca2+ (NaCl, 125; NaHCO3, 26; glucose, 10; KCl, 3.5; NaH2PO4−, 1.26; MgSO4−, 3) Coronal slices, 350 μm thick, were cut using a Leica Vibratome, and the slices were then incubated in artificial CSF (ACSF) containing 1 mm Mg2+ and 2 mm Ca2+ ions. (NaCl, 125; NaHCO3, 26; glucose, 10; KCl, 3.5; CaCl2, 2; NaH2PO4−, 1.26; MgSO4, 1). This same extracellular solution was used to bath the slices in the recording chambers until after the first cells were patched, at which point, the inflow was switched to deliver the same basic ACSF solution but without Mg2+ ions.
Electrophysiology.
The electrophysiological data were collected on two different set-ups: one incorporated a Zeiss Axioskop, with Luigs and Neumann micromanipulators, Axoclamp 1D amplifiers and Axoclamp software; the other, an Olympus BX51, with Scientifica Patchmaster micromanipulators mounted on a Scientifica movable top plate, and using Multiclamp 700B (Molecular Devices) and Axoclamp 1D amplifiers (Molecular Devices) and pClamp software. On both, the perfusate was heated by sleeve heater elements (Warner Instruments) to give a bath temperature of 32−36°C. Whole-cell patch-clamp recordings were made using 3–7 MΩ pipettes (borosilicate glass, Harvard Apparatus). Patch pipette solution contained 125 mm K methyl-SO4; 10 mm K-HEPES; 2.5 mm Mg-ATP; 6 mm NaCl; 5 mm QX-314 [N-(2,6-dimethylphenylcarbamoylmethyl) striethylammonium bromide] (Tocris Bioscience); 0.3 mm Na-GTP; 0.5% biocytin (weight/volume). QX-314 was included to block voltage-dependent Na+ channels for increased stability of recordings at 0 mV; voltage-dependent K+ conductances were less of an issue for analysis of the high-frequency signals because the voltage clamp was kept constant. For current-clamp (Iclamp) recordings of action potential trains, the QX-314 was omitted. Extracellular recordings were made using 1–3 MΩ pipettes (borosilicate glass, Harvard University) filled with ACSF. For “juxtaposed” triple recordings, the extracellular electrode was placed between 20 and 40 μm from the voltage-clamped cell: importantly, the extracellular electrode was not pressed against that cell and thus was not recording the currents in that cell directly. The extracellular signal was further amplified 1000× (10× amplification at output of amplifier, and fed into a second amplifier for further 100×) and bandpass filtered (2–800 Hz) as well as notch filtered (50 Hz, Humbug). Recordings were digitized through a Digidata 1440 AD board and recorded at 5 kHz, and analyzed off-line using Igor (Wavemetrics). There were no qualitative differences between the recordings using the different amplifiers. Pyramidal cell separation was either derived from biocytin fills in fixed preparations [corrected for shrinkage (∼9%)], or from direct distance measurements taken during the experiments (imaging using a Hamamatsu charge-coupled device camera mounted on the microscope).
Correlation index noise.
An assessment of the distribution of correlation indices for noncorrelated extracellular “noise” was made from paired extracellular recordings. Two different methods were used. The first derived correlation indices from distantly separated paired recordings during baseline activity (i.e., away from the high-frequency peaks associated with interictal or ictal events). The second used temporally mismatched time periods from juxtaposed extracellular recordings. There was no difference between these two methods and so the data sets were pooled.
Data analysis.
Cross-correlograms shown in Figure 1 were performed on the first derivative of the voltage-clamp recordings. The reason was because the derivative showed sharp peaks associated with the onset of the large amplitude, fast rising IPSCs. As such, the derivative more specifically reflected the onset of these synaptic events, which was the critical facet being studied. Cross correlograms of the derivative allowed a far clearer assessment of the timing of IPSCs in the two cells. In contrast, cross-correlograms of the raw traces showed a much weaker relationship of closely apposed cells, only marginally better than distantly separated pairs. The correlation index is described in the legend to Figure 5.
Figure 1.
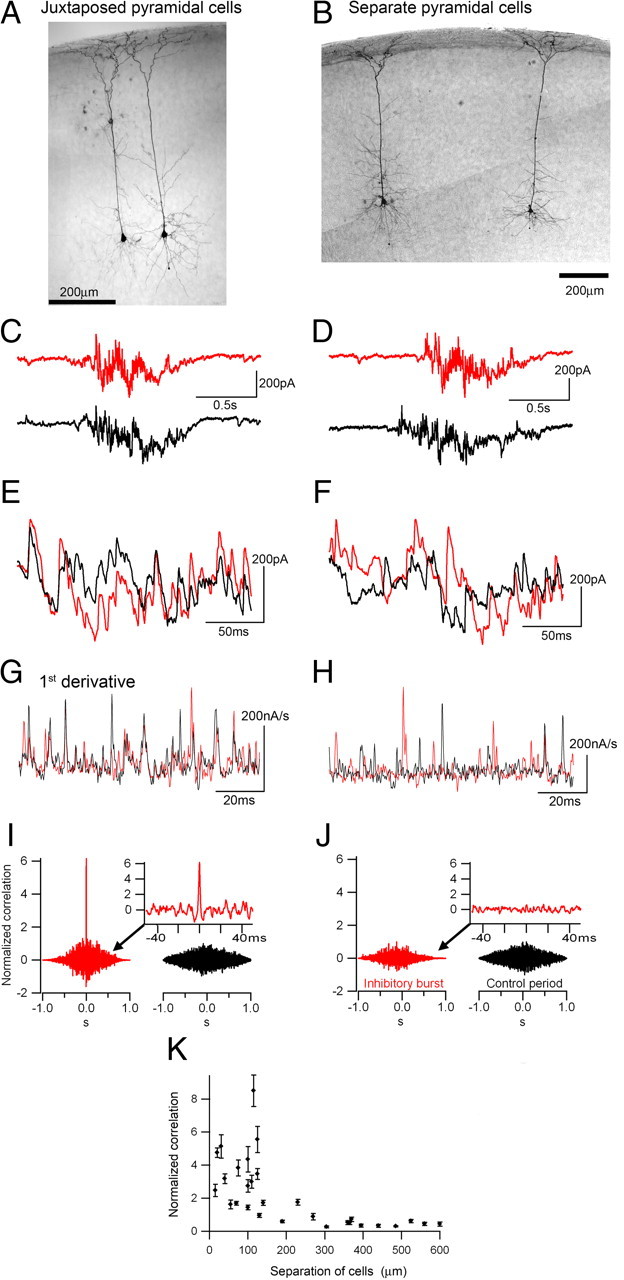
High-frequency inhibitory barrages are coordinated onto local populations of pyramidal cells. A, B, Pairs of biocytin filled, layer 5 pyramidal cells that were recorded simultaneously in voltage-clamp mode at −30 mV. C–F, Juxtaposed paired recordings routinely showed synchronous IPSCs in both cells (C, E). In contrast, more separate cell pairs show broadly synchronous interictal events (D), but the individual IPSCs are not synchronous (F). G, H, A short epoch showing the first derivative of the voltage-clamp traces. Note the many matched peaks for the closely apposed pairs (G) and the lack of matching for the more separate pair (H). I, Cross-correlograms of the paired recordings of juxtaposed cells show a sharp peak at zero millisecond, whereas this peak is lacking for more separate cells (J). K, The correlation is markedly reduced for cells separated by more than ∼200 μm, and there is a highly significant difference in correlation. Data are from animals aged postnatal day 14–18.
Figure 5.

Depolarizing EGABA causes a small diminution of IGABA, and only toward the end of the barrages. A, Top traces show the membrane potential and two different simulated levels of EGABA: one with fixed EGABA (blue) and one where EGABA changes proportional to the accumulation of chloride within the cell (see explanation in Materials and Methods section). Since the source of chloride is through the GABA channels themselves, the accumulation only starts when the IPSCs start. Thus the reduction in the driving force (Em − EGABA) only becomes significant toward the end of the barrage, and IGABA is likewise minimally affected. Furthermore, the difference between the two simulations only contains low frequencies (witness the EGABA trace in red); since the correlation index assesses high frequencies, the two models of EGABA are effectively equivalent (B).
Simulation of depolarizing shift in EGABA.
The purpose of simulating a depolarizing shift in EGABA was merely to examine whether my conclusions were valid when the driving force for IGABA varies. The motivation for this is the evidence that EGABA becomes progressively depolarized during intense GABAergic barrages, because neurons become loaded with chloride (Thompson and Gähwiler, 1989a,b; Staley et al., 1995). This chloride loading depends on a number of factors with complex interrelations, including the extracellular K+ concentration, the rate of KCC2 transporter, and the conductance of HCO3− ions through GABA receptors, among other things. Instead of trying to model these various unknown quantities as part of a complex set of Nernst equations, I therefore made the simplifying assumption that the shift in EGABA was directly proportional to the excess chloride ions inside the cell due to an imbalance between chloride moving in and out of the cell:
 |
where L is the excess number of chloride ions, and EGABA(baseline) and κ are constants. I used a value for EGABA(baseline) of 5 mV hyperpolarized to the membrane potential for the simulations. L is derived from the integral of the calculated GABAergic current, Qin, and an estimate of the chloride clearance, Qout, as follows:
 
|
where Iin is the inward current through the GABA receptors, given by Ohm's law: Iin = gGABA·(Em − EGABA), and gGABA is the GABAergic conductance, and Em is the membrane potential.
Likewise, Qout is the integral of the rate of chloride clearance (Iout), which is assumed to be directly proportional to the excess chloride, L, with λ being a constant.
 |
These equations are solved using values for gGABA derived from the voltage-clamp recordings at 0 mV, and Em derived from the current-clamp recording. Because of the complex nature of these two functions derived from the electrophysiology recordings (voltage-clamp current and membrane potential), I solved these equations numerically. Values of κ = 0.65 μV/pC, and λ = 0.063 s−1 gave realistic shifts in EGABA during the course of IPSC barrages (see Fig. 5A). The gradient of the EGABA flux could be altered readily by changing these two constants, but is always tied to the timing of the inward GABA current. Alterations in the gradient (achieved by varying κ and λ) did not alter the results.
Spike phase analysis.
Sine waves were fitted to 20 ms epochs of the extracellular signal (bandpass filtered at 100–200 Hz) centered on action potentials recorded in local pyramidal cells. The exact phase of the pyramidal spike could then be derived from the best fit wave. If the best fit sine frequency was <100 Hz or >200 Hz (i.e., outside the bandwidth of the filter), the data point was discarded. I only analyzed spikes coincident with HFOs in the extracellular field (>3 SD shift in the total line length).
Results
Synchronized inhibitory barrages during interictal activity
I hypothesized that extracellularly recorded HFOs have a direct relationship to the high-frequency inhibitory synaptic barrages which constitute a restraint against spreading epileptiform discharges. The development of an in vitro model of the inhibitory restraint (Trevelyan et al., 2006, 2007) allows a direct test of this hypothesis using multiple juxtaposed intracellular and extracellular recordings. It remains beyond our capabilities to make such juxtaposed recordings in vivo and yet many researchers do this routinely in vitro. Such experiments have already proved invaluable in helping relate different electrophysiological events during the evolution of an ictal event (Trevelyan et al., 2006), and I used the same techniques here to make explicit the relationship between HFOs and the inhibitory restraint.
I recorded epileptiform activity generated in neocortical slices by removing Mg2+ ions from the bathing medium. In addition to full ictal events, when all cells fire intensely, this pharmacological manipulation induces two other patterns of activity: interictal and preictal events. Interictal events are discrete, transient events lasting ∼0.1–2 s. Preictal events are of variable duration, and immediately precede the transition into a full ictal event (Trevelyan et al., 2006). The defining feature of both interictal and preictal events is that pyramidal cells experience a strong depolarization, but generally fire only sporadically. While this represents an increase in firing rate over the baseline activity, the level of excitatory drive would be expected to produce much more intense firing since the excitatory drive exceeds threshold levels at these times by a factor of 20 or more (Trevelyan et al., 2006). The restraint of pyramidal firing appears to be imposed by a very high-frequency barrage of IPSCs. Indeed, these high-frequency IPSC barrages can veto the excitatory drive altogether. Interictal events are also characterized by HFOs in the extracellular field.
The first indication of the significance of the inhibitory barrages was that they are coordinated on local populations of pyramidal cells (Fig. 1). Such coordinated currents in many cells may be expected to be more visible in extracellular recordings. Juxtaposed pyramidal cells routinely experience exactly synchronized IPSCs during these volleys (Fig. 1E,G). To examine the spatial pattern of the correlated IPSCs further, I derived cross-correlograms of the derivatives of Vclamp recordings in pairs of pyramidal cells (Fig. 1G–J). The reason for performing this analysis on the derivative of the traces was because the IPSCs represent the largest amplitude, fast deflections in the raw trace, and so by taking the derivative, I weighted the analysis strongly toward an examination of these specific events. This is akin to a single iteration of the time differencing method (yt − yt-1) to remove nonstationarities in a linear time series (Box et al., 2008), and serves to emphasize the most extreme nonstationarities (largest instantaneous fluctuations, corresponding in this case to the large IPSCs).
More separate pyramidal pairs, while displaying broadly synchronous synaptic volleys (Fig. 1D,F), did not show the millisecond precision synchrony seen in adjacent pyramidal cells. There was a highly significantly difference between the closely apposed pairs compared with more distantly separated cells with respect to the degree of synchrony (Fig. 1K) (normalized correlations: <200 μm separation, 3.23 ± 0.49 (mean ± SEM, n = 17); >200 μm, 0.60 ± 0.12 (n = 12); p < 0.001). This analysis showed clearly that the synchrony of IPSCs on pairs of pyramidal cells was much reduced when they were more than ∼150–200 μm apart. Previous authors have shown that local populations of pyramidal cells receive synchronized IPSCs (Miles et al., 1996; Hasenstaub et al., 2005); I show here that the same synchronization of inhibition also occurs during interictal events.
The synchrony of these high-frequency IPSCs in local populations of pyramidal cells suggested that this current may be visible in the extracellular field potential. The basic model is schematized in Figure 2. The key feature is that pyramidal cells invariably receive a depolarizing glutamatergic drive at the same time as the high-frequency inhibitory volleys (>30 paired recordings of closely apposed pyramidal cells) (Fig. 3A) (Trevelyan et al., 2006), and consequently, the membrane potential is shifted from the GABAergic reversal potential thereby creating a large driving force for the current. There is therefore a large, high-frequency, outward going current at the pyramidal soma, and the crucial point is this: the current is precisely synchronized in the local pyramidal population (Fig. 1).
Figure 2.
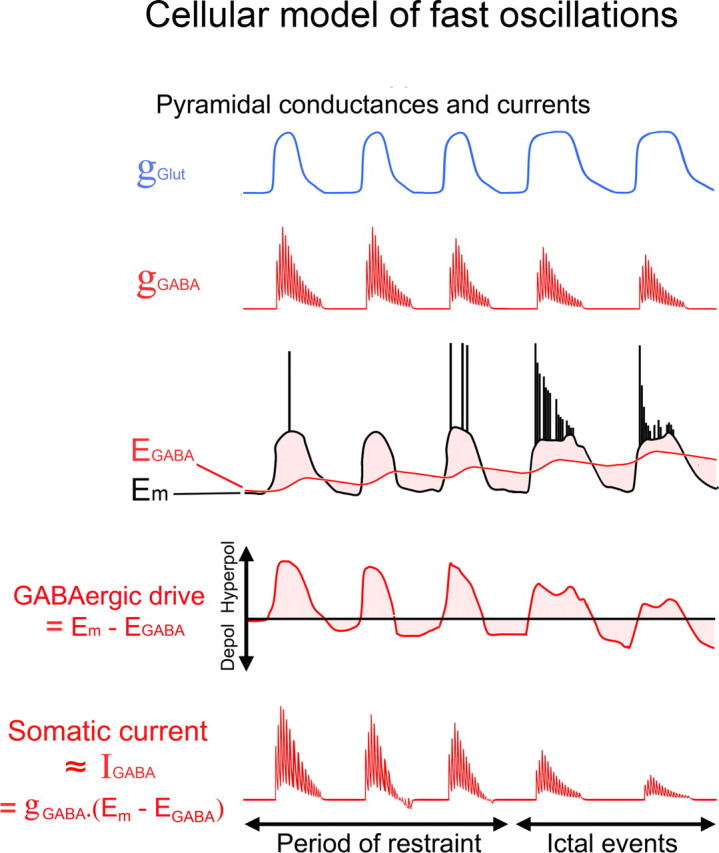
A model of high-frequency oscillations corresponding directly to the inhibitory currents in pyramidal cells. Schematic traces to show the main synaptic drives onto pyramidal cells during the preictal period transitioning into the ictal event. There is a large glutamatergic drive (blue) coincident with the high-frequency inhibitory barrages (red), and the glutamatergic drive causes the membrane potential (Em) to be shifted away from the GABAergic reversal potential (EGABA; middle traces). EGABA is depicted as varying, the variation being caused by chloride loading during the inhibitory barrages (Thompson and Gähwiler, 1989a,b; Staley et al., 1995), followed by clearance mediated by potassium-chloride cotransporters. Thus, there are periods of high GABAergic conductance coincident with a large GABAergic drive, resulting in large inhibitory currents (bottom trace).
Figure 3.

Experimental test of the match between the inhibitory current and the extracellular field potential. I tested the hypothesized equivalence of GABAergic currents with the extracellular field signal by deriving an estimate of the high-frequency inhibitory current from paired recordings of juxtaposed pyramidal cells, and comparing that to the true extracellular field recorded in a third electrode (black trace). The bottom panel shows a differential interference contrast photomicrograph of such a recording (scale bar, 20 μm). The inhibitory conductance is estimated from a voltage-clamp recording of a pyramidal cell held at 0 to +10 mV (Bi, red trace), and the GABAergic drive is estimated from the second cell recorded in current-clamp mode (A, blue trace, Em; red line, EGABA; GABAergic drive = Em − EGABA; EGABA was assumed to be constant for these simulations). The derived inhibitory current is simply the product of these two intracellular signals (Bi). The current-clamp recording is low-pass filtered (<10 Hz) so that the only source of high frequencies in the model is from the voltage-clamp recording, which are dominated by the IPSCs. The model is bandpass filtered (80–500 Hz), sign-inverted, and overlaid with the extracellular signal (Biii). Biv, Cross-correlograms of the model versus the extracellular signal (red) routinely show a sharp narrow peak at 0 ms delay, with a very similar structure to the auto-correlogram of the extracellular signal (black).
The correspondence between IPSCs and the extracellular field
To examine explicitly whether this current corresponds to the extracellular field oscillations, I made triple recordings to derive an approximation of the inhibitory current and compared this directly with the local field potential (Fig. 3A). I recorded from closely apposed pyramidal cells (<50 μm separation), recording one cell in voltage-clamp mode holding ∼0 to +10 mV to minimize the glutamatergic currents. I simultaneously derived an approximation of the driving force for this inhibitory current by recording the second cell in current-clamp mode. The driving force was calculated as Em − EGABA (EGABA estimated as −65 mV; the calculations were robust for values <−55 mV). The inhibitory current was calculated then as the product of the voltage-clamp signal (which is proportional to the inhibitory conductance; the amplitude is irrelevant because the signal amplitudes are normalized at a later stage in the calculation) and the GABAergic driving force (Fig. 3Bi). Because I was interested in the high-frequency IPSCs, and not in any high-frequency components arising from the current-clamp recording (e.g., action potentials), this latter signal was smoothed (100 ms box rolling average) before calculating the inhibitory current. Thus, the only source of high frequencies to this derived current was from the voltage-clamp recording.
The derived current was bandpass filtered at the same frequencies as the extracellular signal (80–500 Hz) and sign-inverted to allow for the fact that the current being measured was going toward one electrode and away from the other since the two electrodes effectively existed on either side of the pyramidal cell membrane (Fig. 3Bii). When the filtered GABAergic current was overlaid onto the adjacently recorded field potential, the match was, in the majority of cases, quite striking (Fig. 3Biii). Cross-correlograms of the current versus the extracellular signal compared favorably with autocorrelograms of the extracellular signal, frequently showing the same width peak at 0 ms delay, as well as many other subpeaks in the correlogram (Fig. 3Biv), suggesting strongly that this discrete current is the direct analog of the extracellular field. This direct correspondence between an intracellular voltage-clamp signal and an extracellular field recording is perhaps a surprising finding, yet Fatt and Katz (1952), in their neuromuscular junction recordings, also noted this same correspondence in their, electrically much simpler, preparation.
To provide a more objective measure of the match between the inhibitory current and the extracellular field, I developed a means of pooling measurements from different experiments by normalizing the amplitude of the signals and deriving a “correlation index” (proportional to the value of the cross-correlogram at Δt = 0 ms) (see Fig. 4). Thus, to have a high index, the inhibitory current and extracellular field had to match up with no phase shift. This objective measure matched well with the subjective impression of the degree of similarity between particular signals (Fig. 4), and allowed the hypothesized match between the GABAergic current, IGABA, and the extracellular field signal to be tested.
Figure 4.
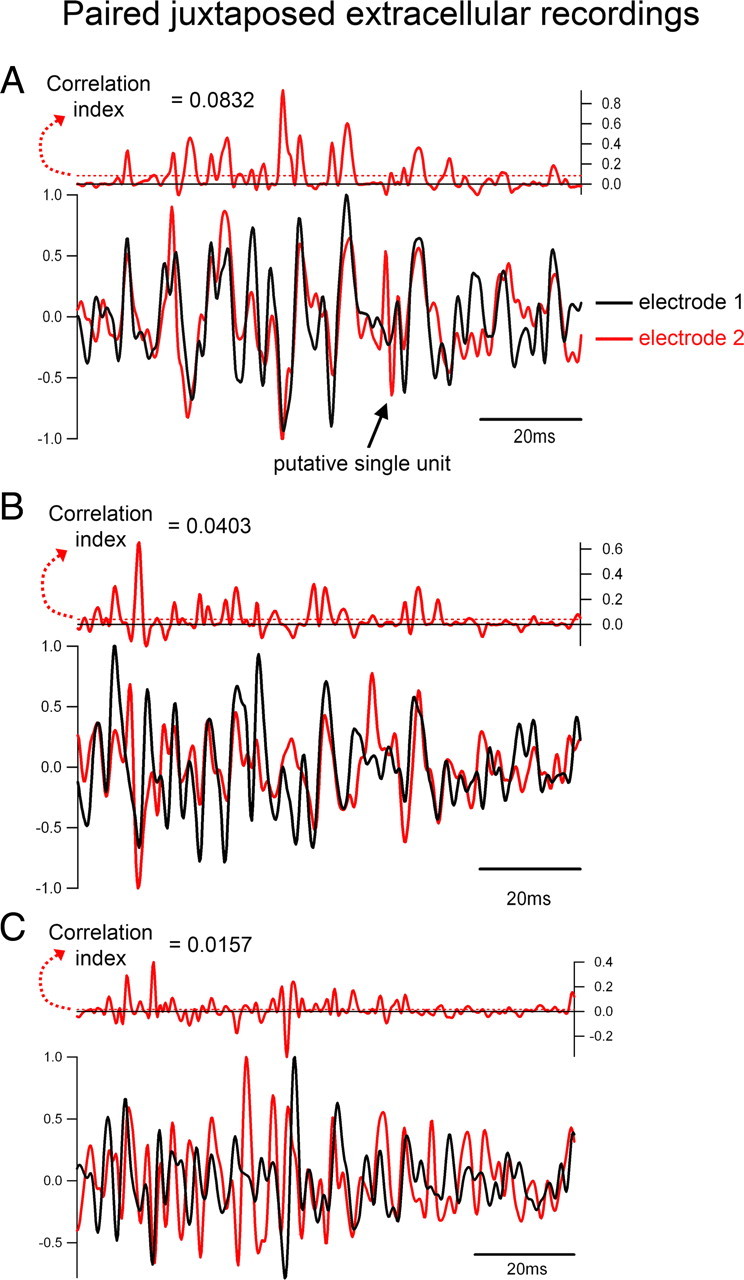
Derivation of the “correlation index.” A–C, I show three paired, normalized, extracellular recordings [closely apposed electrodes (within 50 μm)×. Time epochs (100 ms) are taken centered on the peak high-frequency deviations. The single peaks are detected, and the epoch is then set starting 10 ms before the time at which the trace first crosses 50% threshold of this peak. Epochs are always 100 ms long. Each recording is normalized to the peak deviation from zero (to either ±1), and the product of the two traces is calculated. This product is the red trace shown immediately above each paired recording. The correlation index is the average value of the product taken over the 100 ms epoch. As evident from these three examples, which represent ∼90% of the range of the paired extracellular recordings, the correlation index matches well with subjective assessments of the similarity of the traces, with very similar traces (top) having a high correlation index, while relatively dissimilar traces have a correspondingly low index.
The GABAergic current had been calculated by assuming a constant EGABA, but evidence suggests that during bursts of epileptiform activity, EGABA may shift to a more depolarized level due to chloride loading of the cells (Fig. 2) (Thompson and Gähwiler, 1989a,b). I therefore repeated the derivation of the GABAergic current based on a variable EGABA, which shifts toward a depolarized level subsequent to chloride entry (Fig. 5). Since the shift in EGABA only occurs secondary to Cl− entry, the initial currents derived in the two ways (constant versus variable EGABA) are effectively identical at the start of the barrage, deviating from each other only when the IPSC sizes are already diminishing due to prominent synaptic depression (Fig. 5A); the fast large amplitude events at the start of the barrages, which represent a major component of the high-frequency signal, are equivalent in both simulations.
As expected given the similarities of the derived currents, the index calculated from simulations with constant EGABA were almost identical to those calculated with depolarizing EGABA (Fig. 5B) (gradient of 0.96 − unitary gradient represents identity). There is a simple intuitive explanation for why the two simulations (constant versus depolarizing EGABA) are equivalent (Fig. 5B): the depolarizing EGABA introduces a low-frequency distortion, and the correlation index only examines high-frequency components of the signal, and is therefore minimally effected. For this reason, I used the simpler, if perhaps biologically less accurate, calculation, with a fixed EGABA for the remaining analysis.
The correlation indices were derived for between 7 and 16 interictal events for each triple recording, and the average value gave an estimate of the similarity of the model to the extracellular signal for each experiment. By pooling the averages from each individual experiment in this way (to derive a mean of means), I could address an important issue: whether the match could have arisen by chance. The spatial pattern of cross-correlations between pyramidal cell pairs shown in Figure 1 provided a ready control for this issue, because distantly separated pyramidal cells received desynchronized inhibitory barrages during interictal events. Thus, the model derived from paired recordings should give a good match to the local extracellular field, but a poor match to a more distant extracellular field recording. The pooled data sets showed this to be the case, with the model showing a significantly greater similarity to the nearby field than the distant field (ts = 2.81; 15 degrees of freedom; p < 0.02; Student's t test). The model also provided a significantly better match to the local field recording than noise levels in the system [assessed from paired extracellular recordings—see Materials and Methods for details: mean correlation index = −0.00097; 6 different paired recordings—10 events from each (total of 60 events)]. Two tailed Student's t test versus model (n = 11) used the means from each experiment (n = 6): ts = 3.18; 15 degrees of freedom; p < 0.005). In conclusion, the inhibitory current in pyramidal cells is significantly more similar to the extracellular signal than would be expected from chance.
Next, I asked how the model compared with recording the extracellular signal using a second electrode (Fig. 6Aii). The correlation between closely paired extracellular electrode recordings turned out to be significantly better than the model, although notably these recordings showed the same spatial organization, with a sharp drop in correlation when the electrodes were more separate. These comparisons with paired extracellular recordings indicate that while the model showed a highly significant correlation with the extracellular field, there must be other contributors to HFOs in the field recordings. One obvious contribution will be from action potentials in neurons local to the extracellular electrode. It is well established that action potentials are manifest in extracellular recordings but that they can be very localized (e.g., Fig. 4A), having different appearances in closely apposed electrodes, thereby allowing spike sorting. Critically, the contribution of action potentials was deliberately excluded from the derivation of the inhibitory currents. The prediction is that as the local activity rises, the model will give a progressively worse match to the extracellular signal. This was borne out precisely from the current-clamp recordings (Fig. 6B). Although the activity of a single neuron offers only an approximate measure of the local population firing rate, the model showed a significant drop in correlation with the extracellular signal as activity levels increased (p < 0.01; Pearsons correlation coefficient, r = 0.4083; 101 degrees of freedom).
Figure 6.
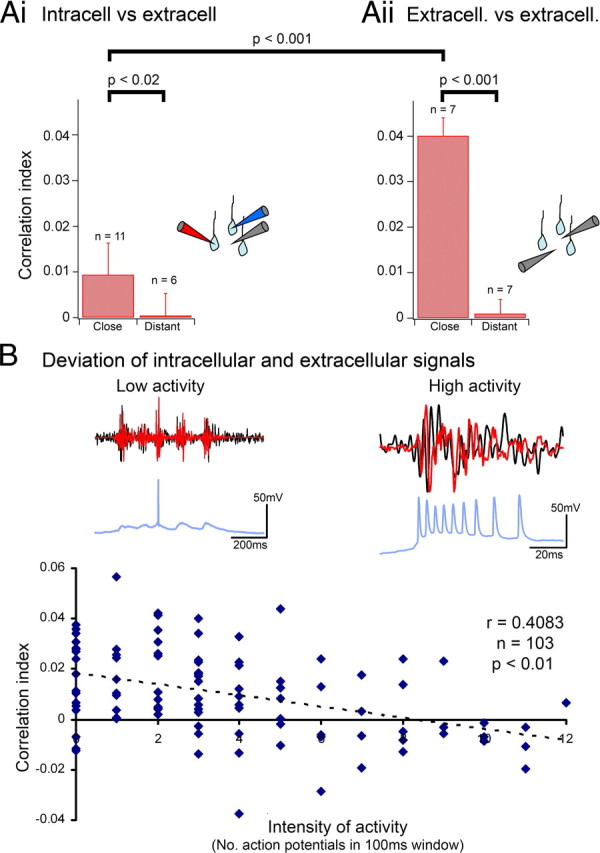
The high-frequency inhibitory current provides a significant component of the extracellular field oscillation. A, Correlation indices showing how closely apposed triple recordings allow for a good match between the derived inhibitory currents and the local extracellular signal, but not for distant extracellular signals (>200 μm). Aii, Equivalent plot showing how extracellular paired recordings show a similar decreasing trend with electrode separation. Error bars show the SD. B, Plot of the correlation indices versus the estimated local activity level for all juxtaposed triple recordings (103 interictal events—same data set as the “close” bin in Ai). The local activity is estimated from the current-clamp recording. Insets show examples of recordings for which there is minimal pyramidal discharge, and also of a period of intense discharge. They show the bandpass filtered (80–500 Hz) derived inhibitory current (red) and extracellular signal (black) and the unfiltered current-clamp recording (blue). These data are also displayed in the supplemental figure, available at www.jneurosci.org as supplemental material, showing that the findings are robust over the age range assessed.
This significant trend indicates that the relationship between the inhibitory restraint and the extracellular signal is strong only when the restraint itself is strong. The strength of the restraint imposed by the inhibitory barrages was also apparent from analysis of the timing of pyramidal spikes. Examination of breakthrough action potentials during events with just 1–3 action potentials showed a prominent modulation of the action potential likelihood during the extracellular field cycle, with a marked dip during and immediately following the negative peak (Fig. 7A), and a maximum at the positive extracellular peak. The negative peak corresponds to the peak inhibitory current, and the positive peak to the trough between IPSCs. In contrast, for other events when the restraint is presumed weaker as judged by the more intense pyramidal firing (>8 action potentials), the precise timing of action potentials no longer has any clear association with the rhythm (Fig. 7B). This impression is supported by spike-triggered averaging of the field potentials (Fig. 7C,D), which show a pronounced flattening of the average trace for the intense bursting (weakened restraint, 7D).
Figure 7.

Pyramidal spiking is precisely timed when the restraint is effective, but not when the restraint is weak. A, The probability distribution of spike times (histogram plot) relative to the phase of the extracellular signal (sine wave) for bursts when there are <4 action potentials. B, Same analysis for events in which the pyramidal cell burst 8–12 times (“weak restraint”). Note the greatly reduced modulation of spike timing relative to the extracellular cycle. C, D show the same data set as spike-triggered averages (black traces). The current-clamp traces are shown superimposed in purple-red, with the spikes aligned. Note that the averaged extracellular signal for the “weak restraint” (C) has more pronounced peaks and troughs, reflecting the more defined phase relationship of firing in this data set. The action potential height appears reduced in D because the level of depolarization is greater.
Action potentials introduce a very brief and very large increase in the driving force for the GABAergic conductance. My simulations of IGABA excluded these transients by smoothing the membrane potential recording. I therefore checked whether a calculation using the raw (unsmoothed) Em recordings would improve the match to the extracellular signal. It did not. For events with no action potentials, the smoothed and unsmoothed calculations resulted in identical correlation indices (CIsmooth = 0.025 ± 0.005 (mean ± SEM); CIunsmooth = 0.024 ± 0.006; n = 7). When the current-clamp recording included action potentials, however, the IGABA was dominated by the excess current associated with action potentials due to the 5–10-fold increase in driving force, and any correlation with the extracellular signal vanished. For events with between 1 and 4 action potentials, representing instances where the match remained good: CIsmooth = 0.018 ± 0.004 (mean ± SEM); CIunsmooth = 0.004 ± 0.003; n = 9. Action potentials of course introduce other large currents (inward: Na+, Ca2+; outward: K+), all temporally offset by fractions of milliseconds which will influence the extracellular field. Furthermore, unlike the synchrony of IPSCs in local cells, available evidence indicates that with increasing firing, there is also increased spike timing jitter (Netoff and Schiff, 2002; Foffani et al., 2007). One obvious explanation for the jitter is a loss of the temporal regulation by basket cell input, but an important consequence is that one cannot extrapolate from single cell recordings to get the timing of these currents in other cells in the way I did for IPSCs. Indeed, for low activity levels, the good matches for simulations using smoothed Em suggests that the excess GABAergic conductance due to an action potential in a single cell are averaged out by the absence of this transient in the other cells. I conclude therefore that the situation, when high-frequency IPSCs are successfully restraining local pyramidal firing, is a peculiarly simple case in which a single class of conductance dominates the extracellular signal.
Discussion
The origin of high-frequency oscillations
I present here data indicating that certain inhibitory currents onto pyramidal cells are peculiarly prominent in EEG recordings under specific conditions, namely when local pyramidal activity is restrained despite powerful concurrent excitation. The significance of this result is that it provides functional insight into various EEG rhythms by suggesting that some fast EEG rhythms may be a signature of the inhibitory restraint described in our previous studies of epileptic neocortex (Trevelyan et al., 2006, 2007).
What might be the source of high-frequency inhibitory barrages on to the pyramidal cells? Various evidence points to fast spiking, perisomatic-targeting interneurons. Space clamp considerations suggest that the largest amplitude IPSCs are likely to arise from perisomatic synapses: pyramidal cells are electrically leaky at this time because of the synaptic barrages, and consequently, only the soma will be genuinely held at 0 mV. Current source density analysis of the high-frequency component of sharp waves (∼200 Hz) recorded in the CA1 region of the hippocampus show the largest fluctuations centered on the pyramidal cell layer, and was also interpreted as arising from perisomatic inhibitory drive (Ylinen et al., 1995).
Synchronous IPSCs on different pyramidal cells, a key feature of the restraint model, are thought to arise primarily from perisomatic, rather than more distally located, inhibitory inputs (Miles et al., 1996). This synchrony likely reflects several well described features of basket cell network connectivity. Basket cells, the main source of perisomatic inhibition, send dense axonal arbors that innervate most pyramidal cells locally (Freund and Buzsáki, 1996). Yet individual pyramidal cells receive perisomatic inhibition from only small numbers (∼10) of basket cells. Furthermore, basket cell activity is coordinated through gap-junctions, leading to tight (millisecond) synchrony of spiking (Galarreta and Hestrin, 1999; Gibson et al., 1999). Thus, small numbers of basket cells, with coordinated firing, all innervate the same pyramidal cells: all factors that might explain the synchrony of IPSCs in pyramidal cells.
Moreover, inhibition is most powerful when located in the perisomatic region and is thus the desirable location to provide a restraint (Jack et al., 1983; Vu and Krasne, 1992). Finally, basket cells are known to fire intensely at the correct time (Grenier et al., 2001; Kawaguchi, 2001; Grenier et al., 2003) to be able to provide this restraint. In contrast, axoaxonic cells are thought to fire before ripple activity (Klausberger et al., 2003).
Inhibitory restraint theory is consistent with spike timing data
This inhibitory restraint theory of fast rhythms is also consistent with spike timing data relative to field oscillations (Grenier et al., 2001; Klausberger et al., 2003; Hasenstaub et al., 2005; Foffani et al., 2007). Studies of physiological gamma (Hasenstaub et al., 2005) and ripple rhythms (Grenier et al., 2001) in vivo show that regular spiking (RS) neurons (presumptive pyramidal cells) tend to fire at the positive peaks (just as shown in Fig. 7A) with a marked trough in firing shortly after the discharge of the fast spiking (FS) cells, which are often presumed to be basket cells. Notably, if EGABA is altered in RS cells by Cl−-loading, the cells increase their firing rate and the spikes show an inversion of the phase relationship to the extracellular signal, strongly indicative of a powerful GABAergic drive at the appropriate frequency. In contrast, FS neurons show a sharp peak in their firing ∼2–4 ms before the negative peak of the extracellular signal: notably this is exactly the interval between action potential and peak IPSC found in unitary recordings of the basket cell to pyramidal cell synapse (Kraushaar and Jonas, 2000; Maccaferri et al., 2000).
Some features of physiological HFOs are lost, however, in the immediate preictal period. FS lose their phase relation to the high-frequency rhythm (Grenier et al., 2003). Furthermore, RS cells no longer show a phase shift in their firing when switching from K-acetate- and KCl-based electrode filling solutions (Grenier et al., 2003). Finally, regular spiking cells show increased interspike jitter (Foffani et al., 2007), indicative of a loss of the entraining inhibitory drive. These results are all consistent with a collapse of the inhibitory restraint at this time (Trevelyan et al., 2006), either by presynaptic or postsynaptic depression, or by a shift in EGABA. A collapse of the inhibitory restraint may thus also explain the progression from HFOs (80–200 Hz) to very fast oscillations (200–400 Hz) through the increased jitter in spike timing (Bragin et al., 1999b, 2002; Staba et al., 2002; Foffani et al., 2007; Staley, 2007) with an associated reduction in millisecond hypersynchrony (Netoff and Schiff, 2002).
How does this inhibitory restraint theory of HFOs relate to other proposed mechanisms? Clearly the inhibitory restraint cannot explain all HFOs in the extracellular field. The correspondence between the inhibitory drive and the HFOs becomes progressively worse as the local population spike rate increases. This is likely to be a twofold effect, partly explained by the increasing contribution of fast currents associated with action potentials, and partly by the reduced IPSCs. In addition, IPSCs cannot explain HFOs in “nonsynaptic” models induced by removing Ca2+ ions from the extracellular medium (Draguhn et al., 1998)), nor in disinhibition models. One suggestion is that pathological ripple activity arises through a gap-junction coupled, pyramidal axonal plexus (Traub and Bibbig, 2000; Traub et al., 2001). Support for this view comes from the demonstration that various drugs that block gap junctions also prevent HFOs and seizures. These drugs, however, also have other pharmacological actions, and furthermore, will also affect the coordinated firing of the fast spiking interneurons and the behavior of glial cells that have also been implicated in ictogenesis. Thus, the mechanism by which gap junction blockers prevent HFOs and seizures remains far from clear. The available data does not distinguish between the different models of HFOs, although it seems likely that in synaptically intact networks, several mechanisms may contribute to the HFO signal, some mechanisms opposing ictogenesis and others promoting it. If the network does progress to a full seizure, the dominant source of the HFOs will change over this period, from initially reflecting the IPSC barrages onto pyramidal cells, to reflecting the synchronized action potentials in increasing numbers of neurons.
The functional significance of field oscillations
If EEG signals merely reflected action potentials, then the signal would have a democratic quality: all cells would be equivalently visible. If on the other hand, the signal is dominated by postsynaptic currents, then the output of cells that project with an especially dense coverage, and thus produce tightly synchronized, large currents in many cells, are likely to be highly visible. One such case is the output of basket cells, making these cells' activity peculiarly visible.
These same interneurons are thought to play a pivotal role in other brain rhythms too (Whittington and Traub, 2003). This presumably is a reflection of the power of inhibition provided by these interneurons: models and experimental evidence suggest that the pattern of proximal inhibition that these neurons provide can veto excitatory inputs (Vu and Krasne, 1992; Trevelyan and Watkinson, 2005; Pouille et al., 2008). The veto will also synchronize the discharge of the postsynaptic cells (Cobb et al., 1995), if the interval between IPSCs is long enough (and deep enough) to permit firing. The lower frequency of basket cell discharge in γ-rhythms (<80 Hz, as opposed to >100 Hz for the rhythms explored in this paper) could in this sense be viewed as a relatively weak restraint, and one that also adds temporal structure to the network activity.
The visibility of basket cell activity also depends on there being a large driving force for the IPSC (viz. Em − EGABA must be large). HFOs then may be signatures of critical battles in the balance between inhibition and excitation. These battles may have other distinctive features, notably in the topographic arrangement of the inhibitory and excitatory activity. The inhibitory restraint means that the local pyramidal population is quiescent, so the prime excitatory drive must derive from elsewhere. In a pathological context, a large component of HFOs appears to be an epiphenomenon of a protective inhibitory mechanism that resists epileptic spread (Prince and Wilder, 1967; Trevelyan et al., 2006), although other HFOs may also reflect network activity that is driving ictogenesis (Traub and Bibbig, 2000). With propagating epileptiform events (both full ictal and interictal events), this excitatory drive is from adjacent cortical territories (Trevelyan et al., 2006), although there is a potential local source from glial cells (Parri et al., 2001). With respect to physiological activity (Devor et al., 2007), surround inhibition may contribute to the precision of topographic representations. For instance, HFOs have been recorded in somatosensory cortex in response to peripheral nerve stimulation (Haueisen et al., 2001). A close examination of topographic relations between the excitatory and inhibitory drives may reveal similar patterns with physiological HFOs, with high-frequency interneuronal activity being laterally displaced from, and restraining, the main focus of pyramidal activity. In this way, information is directed in a focused manner through cortical areas rather than spreading across topographic representations.
Footnotes
This work was supported by grants from The Wolfson Trust and the Wellcome Trust (074454/2/04/2). A.J.T. currently holds a fellowship from Epilepsy Research UK. I thank Doug Turnbull, Bob Lightowlers, Jenny Read, Rafa Yuste, Clarke Slater, Igor Timofeev, and Massimo Scanziani for their generous help, support, and advice.
The author declares no competing financial interests.
References
- Adrian EB, Yamagiwa K. The origin of the Berger rhythm. Brain. 1935;58:323–351. [Google Scholar]
- Berger H. Uber das Elektroenekephalogramm des Menschen. Arch Psychiatr Nervenkrankh. 1929;87:527–570. [Google Scholar]
- Box GEP, Jenkins GM, Reinsel GC. Ed 4. Oxford: Wiley; 2008. Time series analysis: forecasting and control. [Google Scholar]
- Bragin A, Engel J, Jr, Wilson CL, Fried I, Buzsáki G. High-frequency oscillations in human brain. Hippocampus. 1999a;9:137–142. doi: 10.1002/(SICI)1098-1063(1999)9:2<137::AID-HIPO5>3.0.CO;2-0. [DOI] [PubMed] [Google Scholar]
- Bragin A, Engel J, Jr, Wilson CL, Fried I, Mathern GW. Hippocampal and entorhinal cortex high-frequency oscillations (100–500 Hz) in human epileptic brain and in kainic acid–treated rats with chronic seizures. Epilepsia. 1999b;40:127–137. doi: 10.1111/j.1528-1157.1999.tb02065.x. [DOI] [PubMed] [Google Scholar]
- Bragin A, Jandó G, Nádasdy Z, Hetke J, Wise K, Buzsáki G. Gamma (40–100 Hz) oscillation in the hippocampus of the behaving rat. J Neurosci. 1995;15:47–60. doi: 10.1523/JNEUROSCI.15-01-00047.1995. [DOI] [PMC free article] [PubMed] [Google Scholar]
- Bragin A, Wilson CL, Staba RJ, Reddick M, Fried I, Engel J., Jr Interictal high-frequency oscillations (80–500 Hz) in the human epileptic brain: entorhinal cortex. Ann Neurol. 2002;52:407–415. doi: 10.1002/ana.10291. [DOI] [PubMed] [Google Scholar]
- Buzsáki G. Theta oscillations in the hippocampus. Neuron. 2002;33:325–340. doi: 10.1016/s0896-6273(02)00586-x. [DOI] [PubMed] [Google Scholar]
- Buzsaki G. Oxford: Oxford UP; 2006. Rhythms in the brain. [Google Scholar]
- Buzsáki G, Horvath Z, Urioste R, Hetke J, Wise K. High-frequency network oscillation in the hippocampus. Science. 1992;256:1025–1027. doi: 10.1126/science.1589772. [DOI] [PubMed] [Google Scholar]
- Cobb SR, Buhl EH, Halasy K, Paulsen O, Somogyi P. Synchronization of neuronal activity in hippocampus by individual GABAergic interneurons. Nature. 1995;378:75–78. doi: 10.1038/378075a0. [DOI] [PubMed] [Google Scholar]
- Devor A, Trevelyan A, Kleinfeld D. Is there a common origin to surround-inhibition as seen through electrical activity versus hemodynamic changes? Focus on “Duration-dependent response in SI to vibrotactile stimulation in squirrel monkey.”. J Neurophysiol. 2007;97:1880–1882. doi: 10.1152/jn.01218.2006. [DOI] [PubMed] [Google Scholar]
- Draguhn A, Traub RD, Schmitz D, Jefferys JG. Electrical coupling underlies high-frequency oscillations in the hippocampus in vitro. Nature. 1998;394:189–192. doi: 10.1038/28184. [DOI] [PubMed] [Google Scholar]
- Fatt P, Katz B. Spontaneous subthreshold activity at motor nerve endings. J Physiol. 1952;117:109–128. [PMC free article] [PubMed] [Google Scholar]
- Foffani G, Uzcategui YG, Gal B, Menendez de la Prida L. Reduced spike-timing reliability correlates with the emergence of fast ripples in the rat epileptic hippocampus. Neuron. 2007;55:930–941. doi: 10.1016/j.neuron.2007.07.040. [DOI] [PubMed] [Google Scholar]
- Freund TF, Buzsáki G. Interneurons of the hippocampus. Hippocampus. 1996;6:347–470. doi: 10.1002/(SICI)1098-1063(1996)6:4<347::AID-HIPO1>3.0.CO;2-I. [DOI] [PubMed] [Google Scholar]
- Galarreta M, Hestrin S. A network of fast-spiking cells in the neocortex connected by electrical synapses. Nature. 1999;402:72–75. doi: 10.1038/47029. [DOI] [PubMed] [Google Scholar]
- Gibson JR, Beierlein M, Connors BW. Two networks of electrically coupled inhibitory neurons in neocortex. Nature. 1999;402:75–79. doi: 10.1038/47035. [DOI] [PubMed] [Google Scholar]
- Grenier F, Timofeev I, Steriade M. Focal synchronization of ripples (80–200 Hz) in neocortex and their neuronal correlates. J Neurophysiol. 2001;86:1884–1898. doi: 10.1152/jn.2001.86.4.1884. [DOI] [PubMed] [Google Scholar]
- Grenier F, Timofeev I, Steriade M. Neocortical very fast oscillations (ripples, 80–200 Hz) during seizures: intracellular correlates. J Neurophysiol. 2003;89:841–852. doi: 10.1152/jn.00420.2002. [DOI] [PubMed] [Google Scholar]
- Hasenstaub A, Shu Y, Haider B, Kraushaar U, Duque A, McCormick DA. Inhibitory postsynaptic potentials carry synchronized frequency information in active cortical networks. Neuron. 2005;47:423–435. doi: 10.1016/j.neuron.2005.06.016. [DOI] [PubMed] [Google Scholar]
- Haueisen J, Schack B, Meier T, Curio G, Okada Y. Multiplicity in the high-frequency signals during the short-latency somatosensory evoked cortical activity in humans. Clin Neurophysiol. 2001;112:1316–1325. doi: 10.1016/s1388-2457(01)00504-1. [DOI] [PubMed] [Google Scholar]
- Jack J, Noble D, Tsien RW. Ed 2. Oxford: Oxford UP; 1983. Electric current flow in excitable cells. [Google Scholar]
- Kawaguchi Y. Distinct firing patterns of neuronal subtypes in cortical synchronized activities. J Neurosci. 2001;21:7261–7272. doi: 10.1523/JNEUROSCI.21-18-07261.2001. [DOI] [PMC free article] [PubMed] [Google Scholar]
- Klausberger T, Magill PJ, Márton LF, Roberts JD, Cobden PM, Buzsáki G, Somogyi P. Brain-state- and cell-type-specific firing of hippocampal interneurons in vivo. Nature. 2003;421:844–848. doi: 10.1038/nature01374. [DOI] [PubMed] [Google Scholar]
- Kraushaar U, Jonas P. Efficacy and stability of quantal GABA release at a hippocampal interneuron-principal neuron synapse. J Neurosci. 2000;20:5594–5607. doi: 10.1523/JNEUROSCI.20-15-05594.2000. [DOI] [PMC free article] [PubMed] [Google Scholar]
- Maccaferri G, Roberts JD, Szucs P, Cottingham CA, Somogyi P. Cell surface domain specific postsynaptic currents evoked by identified GABAergic neurones in rat hippocampus in vitro. J Physiol. 2000;524:91–116. doi: 10.1111/j.1469-7793.2000.t01-3-00091.x. [DOI] [PMC free article] [PubMed] [Google Scholar]
- Miles R, Tóth K, Gulyás AI, Hájos N, Freund TF. Differences between somatic and dendritic inhibition in the hippocampus. Neuron. 1996;16:815–823. doi: 10.1016/s0896-6273(00)80101-4. [DOI] [PubMed] [Google Scholar]
- Netoff TI, Schiff SJ. Decreased neuronal synchronization during experimental seizures. J Neurosci. 2002;22:7297–7307. doi: 10.1523/JNEUROSCI.22-16-07297.2002. [DOI] [PMC free article] [PubMed] [Google Scholar]
- Parri HR, Gould TM, Crunelli V. Spontaneous astrocytic Ca2+ oscillations in situ drive NMDAR-mediated neuronal excitation. Nat Neurosci. 2001;4:803–812. doi: 10.1038/90507. [DOI] [PubMed] [Google Scholar]
- Pouille F, Watkinson O, Scanziani M, Trevelyan AJ. Differential control of pyramidal neurons' dynamic range by somatic and dendritic inhibition. Soc Neurosci Abstr. 2008;34 136.11/F8. [Google Scholar]
- Prince DA, Wilder BJ. Control mechanisms in cortical epileptogenic foci. “Surround” inhibition. Arch Neurol. 1967;16:194–202. doi: 10.1001/archneur.1967.00470200082007. [DOI] [PubMed] [Google Scholar]
- Schelter B, Timmer J, Schulze-Bonhage A. Weinheim, Germany: Wiley-VCH; 2008. Seizure prediction in epilepsy. From basic mechanisms to clinical applications. [Google Scholar]
- Soltesz I, Deschênes M. Low- and high-frequency membrane potential oscillations during theta activity in CA1 and CA3 pyramidal neurons of the rat hippocampus under ketamine-xylazine anesthesia. J Neurophysiol. 1993;70:97–116. doi: 10.1152/jn.1993.70.1.97. [DOI] [PubMed] [Google Scholar]
- Staba RJ, Wilson CL, Bragin A, Fried I, Engel J., Jr Quantitative analysis of high-frequency oscillations (80–500 Hz) recorded in human epileptic hippocampus and entorhinal cortex. J Neurophysiol. 2002;88:1743–1752. doi: 10.1152/jn.2002.88.4.1743. [DOI] [PubMed] [Google Scholar]
- Staley KJ. Neurons skip a beat during fast ripples. Neuron. 2007;55:828–830. doi: 10.1016/j.neuron.2007.09.005. [DOI] [PubMed] [Google Scholar]
- Staley KJ, Soldo BL, Proctor WR. Ionic mechanisms of neuronal excitation by inhibitory GABAA receptors. Science. 1995;269:977–981. doi: 10.1126/science.7638623. [DOI] [PubMed] [Google Scholar]
- Steriade M. Cambridge, UK: Cambridge UP; 2003. Neuronal substrates of sleep and epilepsy. [Google Scholar]
- Thompson SM, Gähwiler BH. Activity-dependent disinhibition. II. Effects of extracellular potassium, furosemide, and membrane potential on ECl- in hippocampal CA3 neurons. J Neurophysiol. 1989a;61:512–523. doi: 10.1152/jn.1989.61.3.512. [DOI] [PubMed] [Google Scholar]
- Thompson SM, Gähwiler BH. Activity-dependent disinhibition. I. Repetitive stimulation reduces IPSP driving force and conductance in the hippocampus in vitro. J Neurophysiol. 1989b;61:501–511. doi: 10.1152/jn.1989.61.3.501. [DOI] [PubMed] [Google Scholar]
- Timofeev I, Grenier F, Steriade M. The role of chloride-dependent inhibition and the activity of fast-spiking neurons during cortical spike-wave electrographic seizures. Neuroscience. 2002;114:1115–1132. doi: 10.1016/s0306-4522(02)00300-7. [DOI] [PubMed] [Google Scholar]
- Traub RD, Bibbig A. A model of high-frequency ripples in the hippocampus based on synaptic coupling plus axon-axon gap junctions between pyramidal neurons. J Neurosci. 2000;20:2086–2093. doi: 10.1523/JNEUROSCI.20-06-02086.2000. [DOI] [PMC free article] [PubMed] [Google Scholar]
- Traub RD, Whittington MA, Buhl EH, LeBeau FE, Bibbig A, Boyd S, Cross H, Baldeweg T. A possible role for gap junctions in generation of very fast EEG oscillations preceding the onset of, and perhaps initiating, seizures. Epilepsia. 2001;42:153–170. doi: 10.1046/j.1528-1157.2001.26900.x. [DOI] [PubMed] [Google Scholar]
- Trevelyan AJ, Watkinson O. Does inhibition balance excitation in neocortex? Prog Biophys Mol Biol. 2005;87:109–143. doi: 10.1016/j.pbiomolbio.2004.06.008. [DOI] [PubMed] [Google Scholar]
- Trevelyan AJ, Sussillo D, Watson BO, Yuste R. Modular propagation of epileptiform activity: evidence for an inhibitory veto in neocortex. J Neurosci. 2006;26:12447–12455. doi: 10.1523/JNEUROSCI.2787-06.2006. [DOI] [PMC free article] [PubMed] [Google Scholar]
- Trevelyan AJ, Sussillo D, Yuste R. Feedforward inhibition contributes to the control of epileptiform propagation speed. J Neurosci. 2007;27:3383–3387. doi: 10.1523/JNEUROSCI.0145-07.2007. [DOI] [PMC free article] [PubMed] [Google Scholar]
- Vu ET, Krasne FB. Evidence for a computational distinction between proximal and distal neuronal inhibition. Science. 1992;255:1710–1712. doi: 10.1126/science.1553559. [DOI] [PubMed] [Google Scholar]
- Whittington MA, Traub RD. Inhibitory interneurons and network oscillations in vitro. Trends Neurosci. 2003;26:676–682. doi: 10.1016/j.tins.2003.09.016. [DOI] [PubMed] [Google Scholar]
- Ylinen A, Bragin A, Nádasdy Z, Jandó G, Szabó I, Sik A, Buzsáki G. Sharp wave-associated high-frequency oscillation (200 Hz) in the intact hippocampus: network and intracellular mechanisms. J Neurosci. 1995;15:30–46. doi: 10.1523/JNEUROSCI.15-01-00030.1995. [DOI] [PMC free article] [PubMed] [Google Scholar]