

Abstract
Recent anatomical studies have revealed strong cerebellar projections into parietal and prefrontal cortex. These findings suggest that the cerebellum might not only play a functional role in motor control but also cognitive domains, an idea also supported by neuropsychological testing of patients with cerebellar lesions that has revealed specific deficits. The goal of the present study was to test whether or not cognitive impairments after cerebellar damage are resulting from changes in cerebro-cortical signal processing. The detection of global visual motion embedded in noise, a faculty compromised after cerebellar lesions, was chosen as a model system. Using magnetoencephalography, cortical responses were recorded in a group of patients with cerebellar lesions (n = 8) and controls (n = 13) who observed visual motion of varied coherence, i.e., motion strength, presented in the peripheral visual field during controlled stationary fixation. Corroborating earlier results, the patients showed a significant impairment in global motion discrimination despite normal fixation behavior. This deficit was paralleled by qualitative differences in responses recorded from parieto-temporal cortex, including a reduced responsiveness to coherent visual motion and a striking loss of bilateral representations of motion coherence. Moreover, the perceptual thresholds correlated with the cortical representation of motion strength on single subject basis. These results demonstrate that visual motion processing in cerebral cortex critically depends on an intact cerebellum and establish a correlation between cortical activity and impaired visual perception resulting from cerebellar damage.
Introduction
Traditionally, the cerebellum has been viewed as a part of the brain exclusively supporting motor functions, with a specific role in the acquisition of motor memory (Flourens, 1824; Glickstein, 2007). This view has recently been challenged by anatomical, clinical, and imaging studies suggesting a role of the cerebellum not only in motor but also cognitive domains (Ito, 1993, 2008; Schmahmann and Sherman, 1998; Ramnani, 2006; Strick et al., 2009). First, it has become clear that the projection from the dentate nucleus, the largest of the cerebellar nuclei in man and higher primates, is not confined to motor cortex but also innervates prefrontal and posterior parietal areas of cerebral cortex (Middleton and Strick, 2000; Dum and Strick, 2003; Strick et al., 2009), parts of the brain essential for cognitive functions. Second, neuropsychological testing of patients with cerebellar lesions has demonstrated deficits in different faculties, including visual perception (Ivry and Diener, 1991; Nawrot and Rizzo, 1995, 1998; Schmahmann and Sherman, 1998; Thier et al., 1999; Jokisch et al., 2005; Maschke et al., 2006), short-term memory (Schmahmann and Sherman, 1998; Ravizza et al., 2006; Haarmeier and Thier, 2007), or verbal fluency (Richter et al., 2007).
The mechanisms underlying impaired cognitive functioning after cerebellar damage have not yet been unraveled. Based on the well known, quasi-crystalline organization of cerebellar cortex it is usually assumed that the basic transformation of input into output signals is the same in the different contexts (motor, vestibular, cognitive, etc.) in which the cerebellum operates in its various regions. Accordingly, the cerebellum is widely considered a neuronal machine that performs one basic and unique algorithm that is offered to different circuits. An important implication of this view is that the cerebellum provides support function for the rest of the nervous system, but does not itself directly participate in their computations (Bower, 1997). In other words, cerebellar activity is not believed to directly encode cognitive events in an explicit manner. Rather, cognitive deficits after cerebellar lesioning are thought to reflect remote effects in cerebral cortex induced by the loss of cerebellar input.
Although cerebellar damage or inactivation induces changes in cerebro-cortical metabolism, a phenomenon referred to as (crossed) cerebello-cerebral diaschisis (Broich et al., 1987; Gómez Beldarrain et al., 1997; Tecco et al., 1998; Gasparini et al., 1999; Gold and Lauritzen, 2002; Vokaer et al., 2002; Enager et al., 2004), a thorough description of cerebral activity after loss of cerebellar input is missing to date. The goal of this study was to provide a detailed description of cerebro-cortical functioning after cerebellar lesions and to correlate cognitive performance with neurophysiological properties of cerebral cortex such as recorded by magnetoencephalography (MEG). To this end we used a visual motion detection paradigm which has consistently revealed perceptual deficits in cerebellar patients (Nawrot and Rizzo, 1995; Thier et al., 1999; Jokisch et al., 2005). As a main result, we found that the perception deficit due to lesions of the cerebellum was fully represented by specific changes in the activity of cortical areas involved in visual motion processing.
Materials and Methods
Subjects.
Eight patients (4 females, mean age 38 ± 8 years, range: 26–50) and 13 age matched healthy controls (8 females, mean age 36 ± 11 years, range 23–58) participated in this study. Informed consent was obtained from all subjects according to the Declaration of Helsinki and the guidelines of the local ethics committee of the medical faculty of the University of Tübingen, which approved the study. All of the subjects had normal or corrected to normal vision, controls had no history of neurological disease. The patient group included only subjects with lesions/degeneration confined to the cerebellum as revealed by clinical examination and magnetic resonance imaging. Three of the patients had suffered from an ischemic stroke in the PICA territory (two on the right side, the third on the left side and touching also parts of the SCA territory) and were tested 1 week, two weeks and one year, respectively, after the ischemic event. Two further patients had undergone removal of a cerebellar tumor. The first one was tested 2 months after surgical excision of a medulloblastoma infiltrating large parts of the left cerebellar hemisphere. A second patient participated 4 weeks after surgery of a glioblastoma which was also located in the left cerebellar hemisphere. Adjuvant therapy had not been started at the time of testing and the two patients showed no signs of increased intracranial pressure. The remaining three patients presented with isolated cerebellar atrophy the underlying cause of which could not be specified despite rigorous clinical workup including screening for genetic, metabolic or inflammatory conditions as well as malignancies. According to clinical guidelines these three patients were classified as sporadic adult-onset ataxia (SAOA) (Abele et al., 2002). Since magnetoencephalography is extremely sensitive to muscle activity we also made sure to only include cerebellar patients who, in addition to being able to maintain stable stationary fixation, showed no signs of tremor.
Procedure and stimulus material.
Subjects were seated upright in a magnetically shielded room (Vakuum-Schmelze) and were instructed to sit without moving during the MEG recording. Stable posture was supported by a chinrest attached to the MEG chair. The computer generated visual stimuli were rear projected onto a large translucent screen (DLP-projector, frame rate 60 Hz, 800 × 600 pixel) positioned at a viewing distance of 92 cm in the magnetically shielded room. Viewing was binocular.
The visual stimulus consisted of 5 periods (Fig. 1) (Händel et al., 2007, 2008) each being observed by the subjects during controlled stationary fixation. During the first 500 ms, only a stationary red dot (diameter 10 minarc) was presented in the middle of the screen which served as the fixation target and which remained visible for a total of 2 s. The first 500 ms period was followed by a second one introducing a random dot kinematogram (RDK) which covered a square of 16 × 16 deg and was centered 15 deg away from the fixation point. The RDK was presented right of the fixation point in all controls and all patients except those with lesions of the left cerebellum. For the latter, the stimulus was presented in the left hemifield and the corresponding MEG responses were flipped for group analysis. The RDK consisted of 1500 white squares (side length = 8 arcmin, lifetime = 1000 ms, dot density ∼6 dots/deg2, luminance 47cd/m2) all moving incoherently, i.e., in all possible directions, at a common speed of 6deg/s. After the presentation of this first RDK that we will also refer to as the “prestimulus”, a second RDK, the “test stimulus”, started. The properties of this second RDK were identical to those in the prestimulus period except that it lasted only 200 ms and that a certain amount of dot elements moved coherently in the same direction (either to the left or to the right). Specifically, the percentage of coherently moving dots was either 0, 20, 40, 60, 80, or 100% of all dots in the given trial. After a subsequent second fixation period, an arrow was presented in the middle of the screen pointing either to the left or to the right side as randomly chosen by the stimulus generator. Subjects were instructed to keep fixation as accurately as possible during the whole trial and to indicate by lifting their right or left index finger whether the motion direction of the dots of the test stimulus was identical (right index finger) or opposite (left index finger) to the pointing direction of the arrow. Note that the motor response could not be planned until the arrow had been presented, thus, guaranteeing that the MEG signals during the first 700 ms after test stimulus onset were not related to movement preparation. The individual measurement consisted of 720 single trials with each coherence level (n = 6) being presented 120 times in a randomized sequence. To assess the ability to discriminate the motion direction embedded in noise, the percentage of correct responses in the individual measurement was plotted as function of motion coherence and fitted by a probit function. The perceptual threshold was defined by the coherence level for which the probit function predicted 75% correct responses.
Figure 1.

Time course of the stimulus. The stimulus consisted of 5 periods each lasting 500 ms except the presentation of the coherent motion which lasted only 200 ms. In contrast to the “prestimulus,” a random dot kinematogram (RDK) consisting of incoherent motion, the following “test stimulus” involved the presentation of coherent motion the percentage of which was systematically varied between 0 and 100%. The coherent motion signal was directed either to the left or to the right. Subjects had to indicate whether the motion direction of the coherently moving dots of the test stimulus was identical or opposite to the pointing direction of the arrow presented at the end of the trial.
During all experiments, eye movements were monitored using a custom-made video system taking the pupil's center as measure of eye position. Recordings were stored at a sampling rate of 50 Hz and analyzed offline to assess the quality of fixation. In particular, the influence of visual motion coherence on the following oculomotor parameters was determined, i.e., slow eye drifts (eye velocity), deviations from the fixation point (eye position) and the number and amplitude of saccades. To this end, the means of the different oculomotor measures were calculated across trials for the given subject and then tested for group differences between patients and controls by means of a t test. In 2 patients who had temporarily failed to maintain fixation, all trials in which fixation deviated >2 deg in horizontal direction from the fixation spot were excluded from the MEG analysis. For these patients at least 60 trials were valid for each coherence level and the MEG-analysis was conducted using this reduced number of trials. Since the MEG responses were qualitatively the same as in the other patients, we considered this trial number sufficient and group analysis was thus conducted on all the 8 patients. For one patient, eye movement recordings were not available for off-line analysis. However, fixation was controlled online during the recording and revealed no disturbance.
Recording and analysis of the MEG signals.
Neuromagnetic activity was recorded using a whole-head MEG system (CTF Inc., Vancouver, Canada) comprising 151 first-order magnetic axial gradiometers. The signals were sampled at a rate of 625 Hz. Recording epochs lasted from stimulus onset to arrow offset plus 500 ms, leaving 2700 ms of recording time for each trial. The subject's head position was determined at the beginning and at the end of each recording by means of localization coils fixed to the nasion and preauricular positions to ensure that head movements did not exceed channel separation.
To search for MEG activity reflecting the amount of visual motion coherence or differences between patients and controls, we analyzed the global field power (GFP). To obtain the GFP, the MEG recordings were first of all baseline corrected with respect to an interval ranging from 400 to 500 ms after stimulus onset which corresponded to the last 100 ms of the first interval of fixation preceding the presentation of the RDK. Trials contaminated by muscle activation or other artifacts defined by activity surpassing 3 times the normal MEG amplitude were excluded. The GFP was then calculated for each of the six coherence levels and each subject separately as the root of the mean squared magnetic fields (RMS) over all 151 sensors for each sample resulting in the time course of the GFP for each subject and each coherence level.
To test for a main difference in cortical responses between patients and controls independent of the coherence level, the mean MEG response averaged over all coherence levels was compared between groups. Specifically, GFP data were averaged over 500 ms for all stimulus periods except the test stimulus, which lasted only 200 ms, and a t test was applied to each of the different time periods.
In a second step, the influence of motion coherence on cortical activity was analyzed for the two groups separately, to test whether this influence is altered in cerebellar patients. Since it has been shown previously that there is a linear increase in brain activity with increasing motion coherence (Händel et al., 2007), a (running) linear regression between the GFP values and the coherence levels was calculated for each point in time, separately for the group of patients and the group of controls. This analysis made it possible to determine how strongly the GFP depended on motion coherence and also at which point in time brain activity was influenced most strongly by motion coherence. The strength of the influence of motion coherence on cortical activity was given by the steepness of the running linear regression, expressed in β values. The time point of strongest influence of motion coherence on brain activity was determined by the one linear regression which revealed the highest β value.
In a further step, analysis was performed on single subject basis to correlate individual MEG responses with perceptual performance. For this, again a running linear regression was conducted between the GFP values and the 6 coherence levels, this time for time bins of 6 consecutive samples and for each individual subject, separately, using 6 × 6 values for each regression. The time bin of 6 samples was shifted from 150 to 600 ms after test stimulus onset and the maximal β value within this time period and the corresponding latency were extracted for each individual. Since the linear regressions were statistically highly significant in all subjects (p < 0.001), the resulting maximal β values could be used for further statistical testing. Specifically, to investigate whether the individual perceptual thresholds depended on the representation of motion coherence by the cortical responses, the individual perceptual thresholds were correlated with the maximal β value and its latency, respectively, by means of a further linear regression.
Finally, to pin down the localization of the brain activity modulated by motion coherence we again conducted a running linear regression for the two groups (patients and controls respectively) but now for each sensor separately. Specifically, the absolute values of field size were averaged across all trials within a given coherence level providing the time course of activity for each sensor. Samples within a 50 ms bin were now averaged for each coherence level and a linear regression over the group data was conducted. The 50 ms time bin was shifted from 100 ms to 600 ms after test stimulus onset in steps of 50 ms. By this means, β as well as p values were obtained for each sensor over time (with a resolution of 50 ms) and for each group. All analyses were calculated using MATLAB (version 6.5.1).
Results
Corroborating earlier reports on perceptual deficits in cerebellar patients (Ivry and Diener, 1991; Nawrot and Rizzo, 1995, 1998; Thier et al., 1999; Jokisch et al., 2005; Haarmeier and Thier, 2006), the present study revealed a significant impairment of the ability to extract global visual motion information in the patient group. The perceptual threshold for motion direction discrimination was 24.5% (±14.7% SD) in the controls but approximately twice as large in the patients (48.4% ± 25.6 SD). This difference was statistically significant (t test, p = 0.014). Comparison of the oculomotor parameters, i.e., mean eye velocity, eye position, and number of saccades showed no significant difference between groups (p > 0.13 for all comparisons), thus ensuring that the perceptual impairment was not the consequence of fixation disturbances, and differences in MEG would not reflect influences of altered oculomotor behavior.
To explore whether this perceptual difference was indicated by changes in cerebro-cortical activity, we first of all compared the overall brain activity as given by the GFP between groups. The time course of the GFP (averaged over all trials, sensors, coherence levels, and subjects) is depicted in Figure 2A. A first peak at ∼150 ms after prestimulus onset, reflecting incoherent motion onset and the inherent luminance changes, was present in both the patient and the control group. As evident from Figure 2A, the peak amplitude of this response and also its latency was indistinguishable for the two groups compared. A second prominent increase in magnetic activity started at ∼150 ms after test stimulus onset, i.e., after onset of the motion stimulus comprising coherent motion (Fig. 2A, pools the different coherence levels). This second response, albeit somewhat smaller in the patient group, was also similar for both groups of subjects with mean responses largely overlapping until ∼100 ms after onset of the arrow, which provided instructional information on how to report the motion direction seen. From here on, magnetic activity observed in the control group clearly surpassed the one of the patient group. For statistical analysis, the averaged responses were compared between groups for the different stimulus epochs, separately. Only for the time period between 1700 to 2200 ms, namely the period of arrow presentation, was the difference between GFP of the two groups statistically significant (t test, p = 0.0015), while all other comparisons were nonsignificant (p > 0.05). As shown in Figure 2B, brain activity in the controls during arrow presentation was maximal in parieto-temporal sensors located contralateral to the visual motion stimuli. This emphasis on parieto-temporal sensors, so prominent in the controls, was largely missing in the patient subjects.
Figure 2.

Time course of GFP and spatial distribution of the MEG responses. A, Global field power (RMS of all sensors and subjects) depicted for patients (blue line, means ± SE) and controls (red line, means ± SE) over time. For each stimulus period (indicated by vertical broken lines and corresponding insets), the responses were averaged and compared between groups. Only during arrow presentation (1700 to 2200 ms) a significant difference between groups was present (t test, p = 0.0015). B, Spatial distribution of MEG activity (seen from above) averaged over the time period from 1700 to 2200 ms, i.e., the time period with significant differences between patients and controls. The upper plot was derived from the patient group, the lower one from the controls.
As shown in previous MEG studies, healthy subjects show a linear increase of cortical activity with increasing motion coherence (Maruyama et al., 2002; Nakamura et al., 2003; Händel et al., 2007; Siegel et al., 2007). This is why we in a second step searched for group differences in the dependencies of cortical responses on motion coherence. To reveal these dependencies, the GFP obtained for the different motion coherence levels was subjected to a linear regression analysis for each time sample. This analysis provided the time course of β values (and corresponding p values) expressing the strength of the influence of motion coherence on cortical activity. As shown in Figure 3, the power of the global MEG response in the control group (right upper panel) started to diverge into higher and lower values for different coherence levels shortly after test stimulus onset. Specifically, a positive correlation between GFP and motion coherence was confirmed by the positive slope (= β value) of the running linear regression (see right middle panel of Fig. 3), which started to be significant around test stimulus offset (right lower panel of Fig. 3). While this correlation was highly robust in the controls, it was much weaker and less enduring in the patients (Fig. 3, left panels), as indicated by a smaller peak in β values and the fact that linear regressions surpassed the level of statistical significance just barely at isolated points in time. A closer look at the amplitudes of GFP observed for the different motion coherence levels (Fig. 4) revealed that cortical responses were very similar for the two groups with respect to low motion coherence but differences emerged with higher levels. In contrast to the monotonic increase in GFP as function of motion coherence present in the control subjects, GFP values saturated and in fact tended to decrease for motion coherence levels >60% in the patients. Statistical analysis showed that MEG responses collected in the 0 to 60% coherence trials showed no difference between groups, whereas 80 and 100% coherency levels elicited significantly (p < 0.05 corrected for multiple comparisons) lower GFPs in the patients (Fig. 4).
Figure 3.

Dependency of the GFP on visual motion coherence. Diagrams on the left and right depict results of the patient and control group, respectively. RMS values averaged over the subjects are plotted for the six coherence levels (indicated by different colors: blue = 0%, green = 20%, red = 40%, cyan = 60%, magenta = 80%, yellow = 100%) as function of time. The lower panels show the corresponding β and p values, respectively, obtained from a linear regression between RMS values and motion coherence for each sample point. The broken horizontal line in the two lower plots marks a p value of 0.05. Time of the test stimulus presentation is indicated by a gray bar.
Figure 4.

Global field power as function of motion coherence shown for the group of patients (gray bars, means ± SEM) and controls (black bars, means ± SEM). Six samples around the time point for which regression analysis had started to reveal a significant (p < 0.05) linear correlation between GFP and motion coherence were averaged for each coherence level and for the two groups, separately (controls: 230 ms, patients: 280 ms after test stimulus onset, compare Fig. 3). Responses obtained for 80 and 100% motion coherence were significantly lower in the patient group as compared to controls (p < 0.05, t test, corrected for multiple comparisons).
To correlate perceptual thresholds with the cortical representations of motion coherence in more detail, running linear regressions were also calculated on single subject basis with a time resolution of 10 ms. To this end, the maximal β value between 150 and 600 ms after test stimulus onset was extracted for each subject and plotted against the individual perceptual threshold. As shown in Figure 5A, there was a significant negative correlation between β values and motion coherence thresholds (linear regression: p = 0.047, β= −0.24). In other words, the more robust visual motion coherence was represented by the GFP, the better was the discrimination of global motion direction. A second correlation was observed between perceptual thresholds and the latency, after which the strongest coherence dependency of GFP was observed in the given subject (Fig. 5B) (linear regression: p = 0.005, β = 3.13). The shorter the latency, the better was global motion discrimination. While this second correlation was statistically significant also for the group of patients when analyzed separately (p = 0.033), it was not significant for the group of controls. Likewise, correlation analysis did not reach the level of statistical significance for the maximal β values when calculated in the two groups of subjects, separately.
Figure 5.
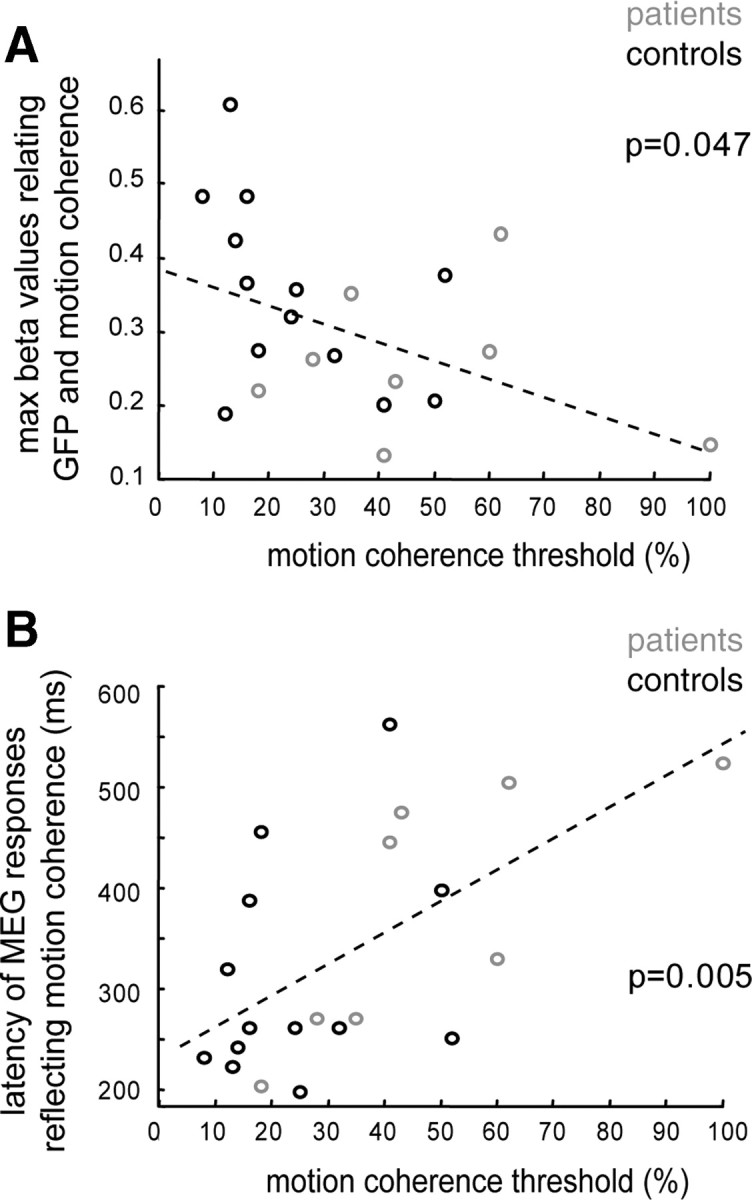
Correlation between the individual perceptual thresholds and the individual dependencies of GFP on motion coherence. A, Maximal β values (y-axis) of linear regressions relating the GFP and the coherence levels in each individual subject (time period: 150 – 600 ms after test stimulus onset), plotted against the individual perceptual threshold (x-axis). The maximal β values significantly decrease with increasing perceptual thresholds as indicated by a significant linear regression with negative slope (dashed line, β= −0.24, p = 0.047). B, Correlation between the latencies of the maximal β values and the perceptual threshold (black = controls, gray = patients). The stronger the impairment in motion perception (x-axis), the larger the latencies of the GFP reflecting motion coherence (y-axis, β = 3.1, p = 0.005).
The goal of a final analysis step was to pinpoint the stage of the cortical hierarchy of visual motion processing that was functionally impaired in the patients group. For this purpose, the dependency of cortical responses on motion coherence was assessed again by running linear regressions for the two groups of subjects, but this time for each sensor separately. The result of this analysis provided a topography of the dependency of cortical activity on motion coherence (Fig. 6), given by the β values of the regression performed for time bins of 50 ms each. In both groups of subjects, β values increased and became significant in parieto-temporal sensors lying contralateral to the stimulated visual hemifield after ∼150–200 ms following motion onset. The subsequent spread of this initial cortical activity reflecting motion coherence, however, was strikingly different for the two groups. While the first unilateral representation of visual motion coherence was followed by a robust and enduring bilateral parieto-temporal pattern of activity in the controls, activity which was significantly modulated by motion coherence in the patients remained unilateral throughout the whole period of recording and never engendered a bilateral representation.
Figure 6.

Mapping of dependencies of MEG responses on motion coherence projected onto two-dimensional MEG sensor maps (seen from above, nose up). Spatial distribution of β values derived from group analysis (linear regression of magnetic field size over coherence levels) performed for each sensor separately. Results are plotted for the group of patients (upper plots) and controls (lower plots) in time bins of 50 ms starting with a first period covering 100–150 ms after test stimulus onset. Maps are color coded with bluish colors signifying low β values, i.e., low or missing dependencies of MEG responses on motion coherence, and warm colors indicating high β values. Significant sensors (p < 0.05) are marked with a black circle.
Discussion
After a long standing debate there is now growing agreement that the cerebellum plays a functional role not only in motor but also in nonmotor processes including cognitive faculties (Ito, 1993; Schmahmann and Sherman, 1998; Ramnani, 2006; Timmann and Daum, 2007; Ito, 2008; Strick et al., 2009; for a more skeptic view, see Glickstein, 2007). This emerging view suggests that functioning of parts of associative cortex critically depends on the availability of cerebellar projections. To test this idea, we assessed whether or not cognitive impairments after cerebellar damage result from detectable changes in cerebro-cortical signal processing. For this, visual motion perception, i.e., the detection of global motion embedded in noise, was chosen as a model system because it offers two main advantages. First, impairments in visual motion perception are among the most consistent observed after cerebellar lesions (Nawrot and Rizzo, 1995, 1998; Thier et al., 1999; Jokisch et al., 2005; Haarmeier and Thier, 2006) and have been validated in an animal model using awake behaving rhesus monkeys (Ignashchenkova et al., 2009). Second, the cortical mechanisms underlying global visual motion perception are quite well understood. Specifically, studies in monkeys (Newsome et al., 1989; Britten et al., 1992) have made it possible to establish a direct link between neuronal discharges in visual motion areas like area MT/V5 [middle temporal (MT)], medial superior temporal (MST), or LIP (lateral intraparietal) and motion perception. As a main functional signature, the neurons in these areas share a preference for coherent visual motion as compared to motion noise (Newsome et al., 1989; Britten et al., 1992, 1996; Shadlen and Newsome, 2001; Roitman and Shadlen, 2002), a feature also present on the population level such as assessed by functional magnetic resonance imaging (Rees et al., 2000) or MEG (Aspell et al., 2005; Händel et al., 2007). This dependency of neuronal discharge on motion coherence has been demonstrated to account for and predict perception: the discrimination of visual motion will be better the more, the stronger, and more reliably the responses would depend on motion coherence (Britten et al., 1992).
Against this background, we measured activity of cerebral cortex using MEG while subjects had to discriminate the global motion direction (left or right) of a random dot kinematogram whose strength was systematically varied by the percentage of coherently moving dots. Corroborating earlier results (Nawrot and Rizzo, 1995, 1998; Thier et al., 1999; Jokisch et al., 2005), our patient group showed higher perceptual thresholds; i.e., they needed higher coherence levels to correctly indicate global motion direction. The analysis of eye movements did not suggest that this deficit was resulting from oculomotor disturbances that have indeed been demonstrated to induce visual deficits in cerebellar patients (Haarmeier and Thier, 1999, 2006). In fact, all the parameters analyzed here showed that fixation was not significantly different for the two groups compared. This result is in line with a recent animal study that provided eye movement control at a much higher resolution using scleral search coil techniques (Ignashchenkova et al., 2009). Improvements in experimental control notwithstanding, two features of fixation have not been addressed so far by the studies on motion perception in cerebellar patients, i.e., the occurrence of microsaccades, recently suggested to play a role in visual perception (Bosman et al., 2009), and fixation alignment between the two eyes, a faculty that can indeed be compromised after cerebellar lesioning (Versino et al., 1996; Straube et al., 2009).
While the eye movement recording device used in this study did not allow us to contribute to that debate, the MEG analysis clearly demonstrated that the perceptual deficit had its reflection in altered cerebro-cortical signal processing. Specifically, the deficit was paralleled by two principal differences in cerebro-cortical processing, the first one related to the representation of motion coherence, the second one observed during the period giving instructional cues on how to indicate the motion direction perceived. In a previous study using almost identical stimulus configurations in normal subjects, we could show that neuromagnetic responses linearly increased with rising motion coherence and that the first development of this increase could be attributed to the human area MT+ complex (Händel et al., 2007), i.e., the complex housing the human homologues of areas MT and MST. In the healthy controls of the present study, we also found a strong coherence dependent modulation at the same latency as in our previous experiment, namely ∼200 ms. Also, sensor localization was very comparable between studies indicating a similar origin of modulatory activity as could be shown for the previous study. A first peak in contralateral parieto-temporal cortex reflecting motion coherence was present also in the patient group; however, the following spread of activity was qualitatively different. While responses which linearly increased with motion coherence were forwarded also to the other cortical hemisphere in the controls, activation patterns remained unilateral in the patients. We suggest that the spread of activity from a purely unilateral into a bilateral representation marks the border between areas MT and MST, since only area MST, via input relayed through the corpus callosum, shows ipsilateral activation to unilateral visual input (Desimone and Ungerleider, 1986; Saito et al., 1986; Duffy and Wurtz, 1991; Britten et al., 1992; Becker et al., 2008). Accordingly, the unilateral representation of motion coherence and the loss of a bilateral representation in the patient group would reflect spared MT, but compromised MST functioning, respectively. For this interpretation to be plausible, area MST or other visual areas located downstream from area MT, like intraparietal cortex, should receive significant cerebellar input. While this is true for parts of parietal cortex (Middleton and Strick, 2000; Dum and Strick, 2003), cerebellar projections to areas MT and MST have not been characterized in detail. Regardless of its specific allocation, the qualitative difference in cortical responses reflecting motion coherence in the patients demonstrates a significant impairment of extrastriate cortex in visual motion processing. As shown in Figure 4, this impairment largely affected the representation of motion stimuli with high coherence, i.e., strong global motion.
As far as we can tell, this is the first study which does not only reveal a change in cerebro-cortical activity after cerebellar damage, such as recently reported by other groups (Restuccia et al., 2001; Ziemus et al., 2007), but demonstrates a correlation between cortical activity and impaired behavior. Two determinants of global motion perception were observed. First, there was a correlation between the extent to which cortical activity depended on motion coherence and the perceptual measure; i.e., the stronger the activity was modulated by motion coherence the better was the ability to perceive the motion direction. Second, also the latency of the maximal coherence modulation was correlated with the percept. The later the peak of modulation was reached, the poorer was the ability to detect the direction of global motion. Both correlations demonstrate that the perception of patients with cerebellar pathology was fully determined by cerebro-cortical activity, i.e., patients behaved like predicted on the basis of cortical activity alone. We therefore reject the idea that cerebellar activity might encode cognitive events in an explicit manner (Vokaer et al., 2002) but find strong support for cerebro-cortical dysfunction as the final basis for the cognitive impairment. The correlation between perception and the latencies of responses reflecting motion coherence is of particular interest because it is reminiscent of the temporal integration of sensory signals described in parietal cortex, usually taken as a reflection of processes generating decisional categories in perception (Shadlen and Newsome, 2001; Gold and Shadlen, 2007). The high latencies observed in patients with strong perceptual deficits might, thus, indicate an impairment in the integration of sensory signals over time. In line with this interpretation, patients with cerebellar damage show stronger deficits in motion perception with shorter presentation times (Thier et al., 1999). Moreover, the changes in latency observed in the perceptual task used in this study are congruent with the increasing delays of movement related cortical potentials that have been reported in patients with cerebellar atrophy (Wessel et al., 1994).
A final difference between cerebellar patients and controls not addressed so far was a significant reduction of overall activity in the patients, when perceptual sensations had to be recalled and compared to the instructional cue to prepare the movement response. Due to the posterior and clearly lateralized maximum of the cortical activity during this period, this difference could be related to short-term memory (Ziemus et al., 2007) offered by visual motion sensitive cortex (Pasternak and Greenlee, 2005). However, activity at that time also involved motor preparation. Therefore, this finding cannot be taken as unequivocal evidence for a cerebellar involvement in working memory. In contrast, the preceding differences in cortical responses reflecting motion coherence were not contaminated by motor processes and, thus, clearly demonstrate that the functioning of parts of associative cortex critically depends on an intact cerebellum. Future studies will be needed to precisely delineate the cortical region critical for the perceptual impairment and to study the mechanisms underlying cerebellar influences on visual motion processing in cerebral cortex.
Footnotes
This work was supported by the Deutsche Forschungsgemeinschaft (Sonderforschungsbereich 550, Projects A2, A7).
References
- Abele M, Bürk K, Schöls L, Schwartz S, Besenthal I, Dichgans J, Zühlke C, Riess O, Klockgether T. The aetiology of sporadic adult-onset ataxia. Brain. 2002;125:961–968. doi: 10.1093/brain/awf107. [DOI] [PubMed] [Google Scholar]
- Aspell JE, Tanskanen T, Hurlbert AC. Neuromagnetic correlates of visual motion coherence. Eur J Neurosci. 2005;22:2937–2945. doi: 10.1111/j.1460-9568.2005.04473.x. [DOI] [PubMed] [Google Scholar]
- Becker HG, Erb M, Haarmeier T. Differential dependency on motion coherence in subregions of the human MT+ complex. Eur J Neurosci. 2008;28:1674–1685. doi: 10.1111/j.1460-9568.2008.06457.x. [DOI] [PubMed] [Google Scholar]
- Bosman CA, Womelsdorf T, Desimone R, Fries P. A microsaccadic rhythm modulates gamma-band synchronization and behavior. J Neurosci. 2009;29:9471–9480. doi: 10.1523/JNEUROSCI.1193-09.2009. [DOI] [PMC free article] [PubMed] [Google Scholar]
- Bower J. Control of sensory data acquisition. In: Schmahmann J, editor. The cerebellum and cognition. London, UK: Academic; 1997. pp. 489–513. [DOI] [PubMed] [Google Scholar]
- Britten KH, Shadlen MN, Newsome WT, Movshon JA. The analysis of visual motion: a comparison of neuronal and psychophysical performance. J Neurosci. 1992;12:4745–4765. doi: 10.1523/JNEUROSCI.12-12-04745.1992. [DOI] [PMC free article] [PubMed] [Google Scholar]
- Britten KH, Newsome WT, Shadlen MN, Celebrini S, Movshon JA. A relationship between behavioral choice and the visual responses of neurons in macaque MT. Vis Neurosci. 1996;13:87–100. doi: 10.1017/s095252380000715x. [DOI] [PubMed] [Google Scholar]
- Broich K, Hartmann A, Biersack HJ, Horn R. Crossed cerebello-cerebral diaschisis in a patient with cerebellar infarction. Neurosci Lett. 1987;83:7–12. doi: 10.1016/0304-3940(87)90207-2. [DOI] [PubMed] [Google Scholar]
- Desimone R, Ungerleider LG. Multiple visual areas in the caudal superior temporal sulcus of the macaque. J Comp Neurol. 1986;248:164–189. doi: 10.1002/cne.902480203. [DOI] [PMC free article] [PubMed] [Google Scholar]
- Duffy CJ, Wurtz RH. Sensitivity of MST neurons to optic flow stimuli. I. A continuum of response selectivity to large-field stimuli. J Neurophysiol. 1991;65:1329–1345. doi: 10.1152/jn.1991.65.6.1329. [DOI] [PubMed] [Google Scholar]
- Dum RP, Strick PL. An unfolded map of the cerebellar dentate nucleus and its projections to the cerebral cortex. J Neurophysiol. 2003;89:634–639. doi: 10.1152/jn.00626.2002. [DOI] [PubMed] [Google Scholar]
- Enager P, Gold L, Lauritzen M. Impaired neurovascular coupling by transhemispheric diaschisis in rat cerebral cortex. J Cereb Blood Flow Metab. 2004;24:713–719. doi: 10.1097/01.WCB.0000121233.63924.41. [DOI] [PubMed] [Google Scholar]
- Flourens P. Recherches expérimentales sur les propriétés et les fonctions du système nerveux dans les animaux vertébrés. In: Clarke, O'Malley C, translators. The Human Brain and Spinal Cord. University of California 1968; 1824. pp. 657–661. Reprint. [Google Scholar]
- Gasparini M, Di Piero V, Ciccarelli O, Cacioppo MM, Pantano P, Lenzi GL. Linguistic impairment after right cerebellar stroke: a case report. Eur J Neurol. 1999;6:353–356. doi: 10.1046/j.1468-1331.1999.630353.x. [DOI] [PubMed] [Google Scholar]
- Glickstein M. What does the cerebellum really do? Curr Biol. 2007;17:R824–R827. doi: 10.1016/j.cub.2007.08.009. [DOI] [PubMed] [Google Scholar]
- Gold JI, Shadlen MN. The neural basis of decision making. Annu Rev Neurosci. 2007;30:535–574. doi: 10.1146/annurev.neuro.29.051605.113038. [DOI] [PubMed] [Google Scholar]
- Gold L, Lauritzen M. Neuronal deactivation explains decreased cerebellar blood flow in response to focal cerebral ischemia or suppressed neocortical function. Proc Natl Acad Sci U S A. 2002;99:7699–7704. doi: 10.1073/pnas.112012499. [DOI] [PMC free article] [PubMed] [Google Scholar]
- Gómez Beldarrain M, García-Moncó JC, Quintana JM, Llorens V, Rodeño E. Diaschisis and neuropsychological performance after cerebellar stroke. Eur Neurol. 1997;37:82–89. doi: 10.1159/000117415. [DOI] [PubMed] [Google Scholar]
- Haarmeier T, Thier P. Impaired analysis of moving objects due to deficient smooth pursuit eye movements. Brain. 1999;122:1495–1505. doi: 10.1093/brain/122.8.1495. [DOI] [PubMed] [Google Scholar]
- Haarmeier T, Thier P. Detection of speed changes during pursuit eye movements. Exp Brain Res. 2006;170:345–357. doi: 10.1007/s00221-005-0216-6. [DOI] [PubMed] [Google Scholar]
- Haarmeier T, Thier P. The attentive cerebellum - myth or reality? Cerebellum. 2007;6:177–183. doi: 10.1080/14734220701286187. [DOI] [PubMed] [Google Scholar]
- Händel B, Lutzenberger W, Thier P, Haarmeier T. Opposite dependencies on visual motion coherence in human area MT+ and early visual cortex. Cereb Cortex. 2007;17:1542–1549. doi: 10.1093/cercor/bhl063. [DOI] [PubMed] [Google Scholar]
- Händel B, Lutzenberger W, Thier P, Haarmeier T. Selective attention increases the dependency of cortical responses on visual motion coherence in man. Cereb Cortex. 2008;18:2902–2908. doi: 10.1093/cercor/bhn049. [DOI] [PubMed] [Google Scholar]
- Ignashchenkova A, Dash S, Dicke PW, Haarmeier T, Glickstein M, Thier P Advance online publication. Normal spatial attention but impaired saccades and visual motion perception after lesions of the monkey cerebellum. J Neurophysiol. 2009 doi: 10.1152/jn.00659.2009. [DOI] [PubMed] [Google Scholar]
- Ito M. Movement and thought: identical control mechanisms by the cerebellum. Trends Neurosci. 1993;16:448–450. doi: 10.1016/0166-2236(93)90073-u. [DOI] [PubMed] [Google Scholar]
- Ito M. Control of mental activities by internal models in the cerebellum. Nat Rev Neurosci. 2008;9:304–313. doi: 10.1038/nrn2332. [DOI] [PubMed] [Google Scholar]
- Ivry RB, Diener HC. Impaired velocity perception in patients with lesions of the cerebellum. J Cogn Neurosci. 1991;3:355–366. doi: 10.1162/jocn.1991.3.4.355. [DOI] [PubMed] [Google Scholar]
- Jokisch D, Troje NF, Koch B, Schwarz M, Daum I. Differential involvement of the cerebellum in biological and coherent motion perception. Eur J Neurosci. 2005;21:3439–3446. doi: 10.1111/j.1460-9568.2005.04145.x. [DOI] [PubMed] [Google Scholar]
- Maruyama K, Kaneoke Y, Watanabe K, Kakigi R. Human cortical responses to coherent and incoherent motion as measured by magnetoencephalography. Neurosci Res. 2002;44:195–205. doi: 10.1016/s0168-0102(02)00129-3. [DOI] [PubMed] [Google Scholar]
- Maschke M, Gomez CM, Tuite PJ, Pickett K, Konczak J. Depth perception in cerebellar and basal ganglia disease. Exp Brain Res. 2006;175:165–176. doi: 10.1007/s00221-006-0535-2. [DOI] [PubMed] [Google Scholar]
- Middleton FA, Strick PL. Basal ganglia and cerebellar loops: motor and cognitive circuits. Brain Res Brain Res Rev. 2000;31:236–250. doi: 10.1016/s0165-0173(99)00040-5. [DOI] [PubMed] [Google Scholar]
- Nakamura H, Kashii S, Nagamine T, Matsui Y, Hashimoto T, Honda Y, Shibasaki H. Human V5 demonstrated by magnetoencephalography using random dot kinematograms of different coherence levels. Neurosci Res. 2003;46:423–433. doi: 10.1016/s0168-0102(03)00119-6. [DOI] [PubMed] [Google Scholar]
- Nawrot M, Rizzo M. Motion perception deficits from midline cerebellar lesions in human. Vision Res. 1995;35:723–731. doi: 10.1016/0042-6989(94)00168-l. [DOI] [PubMed] [Google Scholar]
- Nawrot M, Rizzo M. Chronic motion perception deficits from midline cerebellar lesions in human. Vision Res. 1998;38:2219–2224. doi: 10.1016/s0042-6989(97)00297-6. [DOI] [PubMed] [Google Scholar]
- Newsome WT, Britten KH, Movshon JA. Neuronal correlates of a perceptual decision. Nature. 1989;341:52–54. doi: 10.1038/341052a0. [DOI] [PubMed] [Google Scholar]
- Pasternak T, Greenlee MW. Working memory in primate sensory systems. Nat Rev Neurosci. 2005;6:97–107. doi: 10.1038/nrn1603. [DOI] [PubMed] [Google Scholar]
- Ramnani N. The primate cortico-cerebellar system: anatomy and function. Nat Rev Neurosci. 2006;7:511–522. doi: 10.1038/nrn1953. [DOI] [PubMed] [Google Scholar]
- Ravizza SM, McCormick CA, Schlerf JE, Justus T, Ivry RB, Fiez JA. Cerebellar damage produces selective deficits in verbal working memory. Brain. 2006;129:306–320. doi: 10.1093/brain/awh685. [DOI] [PubMed] [Google Scholar]
- Rees G, Friston K, Koch C. A direct quantitative relationship between the functional properties of human and macaque V5. Nat Neurosci. 2000;3:716–723. doi: 10.1038/76673. [DOI] [PubMed] [Google Scholar]
- Restuccia D, Valeriani M, Barba C, Le Pera D, Capecci M, Filippini V, Molinari M. Functional changes of the primary somatosensory cortex in patients with unilateral cerebellar lesions. Brain. 2001;124:757–768. doi: 10.1093/brain/124.4.757. [DOI] [PubMed] [Google Scholar]
- Richter S, Gerwig M, Aslan B, Wilhelm H, Schoch B, Dimitrova A, Gizewski ER, Ziegler W, Karnath HO, Timmann D. Cognitive functions in patients with MR-defined chronic focal cerebellar lesions. J Neurol. 2007;254:1193–1203. doi: 10.1007/s00415-006-0500-9. [DOI] [PubMed] [Google Scholar]
- Roitman JD, Shadlen MN. Response of neurons in the lateral intraparietal area during a combined visual discrimination reaction time task. J Neurosci. 2002;22:9475–9489. doi: 10.1523/JNEUROSCI.22-21-09475.2002. [DOI] [PMC free article] [PubMed] [Google Scholar]
- Saito H, Yukie M, Tanaka K, Hikosaka K, Fukada Y, Iwai E. Integration of direction signals of image motion in the superior temporal sulcus of the macaque monkey. J Neurosci. 1986;6:145–157. doi: 10.1523/JNEUROSCI.06-01-00145.1986. [DOI] [PMC free article] [PubMed] [Google Scholar]
- Schmahmann JD, Sherman JC. The cerebellar cognitive affective syndrome. Brain. 1998;121:561–579. doi: 10.1093/brain/121.4.561. [DOI] [PubMed] [Google Scholar]
- Shadlen MN, Newsome WT. Neural basis of a perceptual decision in the parietal cortex (area LIP) of the rhesus monkey. J Neurophysiol. 2001;86:1916–1936. doi: 10.1152/jn.2001.86.4.1916. [DOI] [PubMed] [Google Scholar]
- Siegel M, Donner TH, Oostenveld R, Fries P, Engel AK. High-frequency activity in human visual cortex is modulated by visual motion strength. Cereb Cortex. 2007;17:732–741. doi: 10.1093/cercor/bhk025. [DOI] [PubMed] [Google Scholar]
- Straube A, Scheuerer W, Robinson FR, Eggert T. Temporary lesions of the caudal deep cerebellar nucleus in nonhuman primates. Gain, offset, and ocular alignment. Ann N Y Acad Sci. 2009;1164:119–126. doi: 10.1111/j.1749-6632.2008.03734.x. [DOI] [PubMed] [Google Scholar]
- Strick PL, Dum RP, Fiez JA. Cerebellum and nonmotor function. Annu Rev Neurosci. 2009;32:413–434. doi: 10.1146/annurev.neuro.31.060407.125606. [DOI] [PubMed] [Google Scholar]
- Tecco JM, Wuilmart P, Lasseaux L, Wikler D, Jr, Damhaut P, Goldman S, Gilles C. Cerebello-thalamo-cerebral diaschisis: a case report. J Neuroimaging. 1998;8:115–116. doi: 10.1111/jon199882115. [DOI] [PubMed] [Google Scholar]
- Thier P, Haarmeier T, Treue S, Barash S. Absence of a common functional denominator of visual disturbances in cerebellar disease. Brain. 1999;122:2133–2146. doi: 10.1093/brain/122.11.2133. [DOI] [PubMed] [Google Scholar]
- Timmann D, Daum I. Cerebellar contributions to cognitive functions: a progress report after two decades of research. Cerebellum. 2007;6:159–162. doi: 10.1080/14734220701496448. [DOI] [PubMed] [Google Scholar]
- Versino M, Hurko O, Zee DS. Disorders of binocular control of eye movements in patients with cerebellar dysfunction. Brain. 1996;119:1933–1950. doi: 10.1093/brain/119.6.1933. [DOI] [PubMed] [Google Scholar]
- Vokaer M, Bier JC, Elincx S, Claes T, Paquier P, Goldman S, Bartholomé EJ, Pandolfo M. The cerebellum may be directly involved in cognitive functions. Neurology. 2002;58:967–970. doi: 10.1212/wnl.58.6.967. [DOI] [PubMed] [Google Scholar]
- Wessel K, Verleger R, Nazarenus D, Vieregge P, Kömpf D. Movement-related cortical potentials preceding sequential and goal-directed finger and arm movements in patients with cerebellar atrophy. Electroencephalogr Clin Neurophysiol. 1994;92:331–341. doi: 10.1016/0168-5597(94)90101-5. [DOI] [PubMed] [Google Scholar]
- Ziemus B, Baumann O, Luerding R, Schlosser R, Schuierer G, Bogdahn U, Greenlee MW. Impaired working-memory after cerebellar infarcts paralleled by changes in BOLD signal of a cortico-cerebellar circuit. Neuropsychologia. 2007;45:2016–2024. doi: 10.1016/j.neuropsychologia.2007.02.012. [DOI] [PubMed] [Google Scholar]