

Abstract
ATP released during hypoxia from the ventrolateral medulla activates purinergic receptors (P2Rs) to attenuate the secondary hypoxic depression of breathing by a mechanism that likely involves a P2Y1R-mediated excitation of preBötzinger complex (preBötC) inspiratory rhythm-generating networks. In this study, we used rhythmically active in vitro preparations from embryonic and postnatal rats and ATP microinjection into the rostral ventral respiratory group (rVRG)/preBötC to reveal that these networks are sensitive to ATP when rhythm emerges at embryonic day 17 (E17). The peak frequency elicited by ATP at E19 and postnatally was the same (∼45 bursts/min), but relative sensitivity was threefold greater at E19, reflecting a lower baseline frequency (5.6 ± 0.9 vs 19.0 ± 1.3 bursts/min). Combining microinjection techniques with ATP biosensors revealed that ATP concentration in the rVRG/preBötC falls rapidly as a result of active processes and closely correlates with inspiratory frequency. A phosphate assay established that preBötC-containing tissue punches degrade ATP at rates that increase perinatally. Thus, the agonist profile [ATP/ADP/adenosine (ADO)] produced after ATP release in the rVRG/preBötC will change perinatally. Electrophysiology further established that the ATP metabolite ADP is excitatory and that, in fetal but not postnatal animals, ADO at A1 receptors exerts a tonic depressive action on rhythm, whereas A1 antagonists extend the excitatory action of ATP on inspiratory rhythm. These data demonstrate that ATP is a potent excitatory modulator of the rVRG/preBötC inspiratory network from the time it becomes active and that ATP actions are determined by a dynamic interaction between the actions of ATP at P2 receptors, ectonucleotidases that degrade ATP, and ATP metabolites on P2Y and P1 receptors.
Introduction
ATP as a neurotransmitter acts via seven subtypes of ionotropic purinergic receptors (P2XRs) (North, 2002) and eight subtypes of metabotropic P2YRs (Abbracchio et al., 2003). The widespread expression of purinergic receptors (P2Rs) in the CNS early in fetal life, the influence of P2 signaling on intracellular Ca2+ dynamics, and electrophysiological evidence support diverse functions for P2R signaling in CNS development and intercellular communication (Ralevic and Burnstock, 1998; Norenberg and Illes, 2000; Burnstock and Knight, 2004; Illes and Ribeiro, 2004; Burnstock, 2006). In the brainstem, recent data highlight the importance of P2R signaling for respiratory control. Neurons of brainstem respiratory nuclei, putative rhythmogenic neurons of the preBötzinger complex (preBötC) [proposed site of inspiratory rhythm generation (Smith et al., 1991)], and respiratory motoneurons express P2Rs and are sensitive to their activation (Funk et al., 1997; Yao et al., 2000; Miles et al., 2002; Lorier et al., 2004, 2007, 2008). ATP contributes to central respiratory responses to hypercapnia through P2Rs on the ventral medullary surface (Gourine et al., 2005b) and the biphasic hypoxic ventilatory response by partially offsetting the secondary respiratory depression (Gourine et al., 2005a).
The actions of ATP are unlikely to be limited to P2R-mediated effects. ATP is rapidly broken down by diverse ectonucleotidase enzymes to produce neuroactive metabolites, including ADP and adenosine (ADO) (Zimmermann, 2001). ADP is a P2YR agonist (Burnstock, 2006) and, therefore, could excite preBötC networks (Lorier et al., 2007). ADO is a P1R agonist whose actions are unclear, but, in premature and neonatal mammals, it is primarily reported to inhibit breathing (Herlenius et al., 1997, 1999, 2002). It is also implicated in apnea of prematurity (Bhatt-Mehta and Schumacher, 2003).
The potential importance of this three-part system in shaping ATP responses is recognized, but the data are sparse. Aside from the demonstration in Xenopus tadpoles in which ATP initiates and ADO accumulation helps terminate activity (Dale and Gilday, 1996), evidence of its significance for sensorimotor integration in functioning mammalian motor networks is lacking. The objective of this study is to explore the potential significance of ATP signaling for preBötC inspiratory rhythm-generating networks during perinatal development. We hypothesize that the net effect of ATP within the preBötC is determined by the actions of ATP on P2Rs, ectonucleotidase activity, and ATP metabolites on P2 and P1Rs, and that the dynamics of the interaction between these three components changes perinatally. We, therefore, determined the following between embryonic day 17 (E17) and postnatal day 4 (P4): (1) when the sensitivity of preBötC networks to ATP emerges and how it changes; (2) whether ectonucleotidase activity changes; and (3) the influence of ATP metabolites on inspiratory network responses to ATP.
Given the widespread but heterogeneous expression of P2Rs, P1Rs, and ectonucleotidases in the CNS, defining these basic mechanisms will provide fundamental insight into the role of this three-part signaling system in the modulation of respiratory and other motor behaviors during perinatal development. It is also essential to understand how the three limbs might be manipulated to enhance its excitatory/stabilizing influence on breathing but minimize its inhibitory/destabilizing influence.
Materials and Methods
All experiments were conducted in accordance with Canadian Council on Animal Care and the University of Alberta Animal Ethics Committees.
Preparations.
Rhythmically active brainstem–spinal cord (BSSC) and rhythmic medullary slice preparations were prepared from Sprague Dawley rats ranging in age from E17 to P4. To obtain embryos, timed-pregnant Sprague Dawley rats bred at the University of Alberta were placed under continuous isoflurane anesthesia (2.5–4 L/min; Surgivet/Anesco Isotec 4) in which the paw-withdrawal reflex was used to assess sufficient level of anesthesia before delivery of pups at the desired gestation day (measured from time of sperm plug appearance). Embryos were delivered by cesarean section and removed sequentially from the distal portion of the uterine horn. Crown-rump lengths were measured to ensure correct gestational age (Anguio y Gonzalez, 1932).
BSSCs from embryonic and neonatal animals were isolated as described previously (Suzue, 1984; Smith et al., 1989; Greer et al., 1992; Ren and Greer, 2003). Briefly, animals were anesthetized through inhalation of isoflurane and decerebrated. The BSSC was isolated in cold, artificial CSF (aCSF), pH 7.4, containing the following (in mm): 120 NaCl, 3 KCl, 1.0 CaCl2, 2.0 MgSO4, 26 NaHCO3, 1.25 NaH2PO4, and 20 d-glucose (equilibrated with 95% O2/5%CO2). For preparations that were E19 or older, a dorsal laminectomy was performed to expose the spinal cord. Preparations were then placed ventral side up, the lower jaw was removed, the palate was cut along the midline, and the skull was opened. Cranial nerve roots were dissected. A ventral laminectomy was then performed, spinal ventral nerve rootlets were cut, and the BSSC was removed. For E17 preparations, the brainstem was isolated as described above but the spinal cord was left intact, as were the contents of the thoracic cavity, phrenic nerve, and diaphragm. This permitted recording of inspiratory activity directly from the diaphragm rather than spinal ventral roots, which is advantageous at E17 because pronounced slow waves of nonrespiratory activity in the nerve roots are less pronounced on the diaphragm (Ren and Greer, 2003; Ren et al., 2006). Preparations from animals E19 or older extended from the ponto-medullary junction rostrally to caudally. Preparations were pinned in a Sylgard-coated chamber (12 ml).
Rhythmic medullary slice preparations were produced using methods originally described for postnatal animals (Smith et al., 1991; Funk et al., 1993) and subsequently adapted for embryos (Greer et al., 1992; Ren and Greer, 2003; Ren et al., 2006). The BSSC was isolated as described above, pinned on a wax chuck, and sectioned serially (200 μm thick) in the rostrocaudal direction on a Leica VT 1000S Vibratome. Serial sections from E21 and postnatal slices were transilluminated, visualized for anatomical landmarks, and referenced against the neonatal rat brainstem atlas (Ruangkittisakul et al., 2006). In the last thin slice taken before the rhythmic slice, the compact division of nucleus ambiguus was no longer evident, and the inferior olive was well developed (−0.35 to −0.45 mm distance to VIIc) (Ruangkittisakul et al., 2006). The spatial relationships between reference nuclei and molecular markers of the preBötC (NK1 receptor labeling) is only available in the parasagittal plane for embryonic animals (Pagliardini et al., 2003), not in the transverse plane of rhythmic medullary slices. Therefore, to provide an accurate description of embryonic slice boundaries, we generated a series of transverse sections (50 μm) through the medulla of E19 rats, counterstained with cresyl violet to reveal tissue ultrastructure and NK1R immunohistochemistry. This atlas is included as supplemental material (Fig. S1, available at www.jneurosci.org as supplemental material). For E19 and E17 preparations, rhythmic 700-μm-thick slices were taken when the last thin section no longer contained the facial (VII) nucleus, but the compact division of nucleus ambiguus was still evident (between 0.10 and 0.20 mm distance to VIIc) (Fig. S1, available at www.jneurosci.org as supplemental material). Slices were transferred to the recording chamber and pinned on Sylgard with the rostral surface exposed. Activity was recorded initially in 3 mm K+. Once rhythmic activity was lost (15–45 min in E17–E21; ≥60 min in P0–P4), it was reactivated by raising extracellular K+. In P0–P4 slices, rhythm was reactivated with 9 mm K+, as is typical for postnatal slice preparations (range is 8–10 mm K+) (Smith et al., 1991; Funk et al., 1993; Tryba et al., 2003; Ruangkittisakul et al., 2006). However, as reported anecdotally, 9 mm K+ was associated with the generation of slow, large-amplitude, intermittent bursts of nonrespiratory activity in E17–E21 slices (Ren and Greer, 2003; Ren et al., 2006) that prevents measurement of baseline inspiratory activity and drug effects. Embryonic preparations were therefore examined at 7 mm K+, at which nonrespiratory activity was reduced. A minimum of 20 min was allowed for preparations to equilibrate to a change in K+ concentration.
Recording of inspiratory activity.
Inspiratory activity generated by BSSC preparations was recorded through suction electrodes placed directly on the diaphragm (E17) or the cut ends of C4 spinal ventral nerve rootlets (≥E19). Inspiratory activity generated by rhythmic medullary slice preparations was recorded through suction electrodes placed on XII nerve rootlets (internal diameter of 60 μm for E17, 80–90 μm for E19 and E21, and 90 μm for P0–P4) and the rostral surface of the slice overlying the ventral respiratory column (VRC) (internal diameter of 90 μm for E17, E19, and E21, and 110 μm for P4). Placement of the VRC suction electrode was determined by systematically moving the suction electrode across the surface of the slice to detect the location that produced the largest amplitude signal that was in-phase with rhythmic XII nerve activity. Signals were amplified and filtered with an A-M Systems Differential AD Amplifier (model 1700) (300 Hz to 1 K; gain, ×10 K), full-wave rectified and integrated with MA-821/RSP Moving Averager (τ = 50 ms; gain ×10 K; CWE), and displayed using Axoscope 9.2 (Molecular Devices). Data were saved to the computer using a Molecular Devices Digidata 1322A (16 bit) for offline analysis. All recordings were made at 28°C in aCSF containing 3 mm K+ for BSSC preparations or 3, 7, or 9 mm K+ for slice preparations.
Drugs and their application.
ATP (0.1 mm) was obtained from Sigma-Aldrich. Substance P (SP) (1 μm), MRS 2179 (2′-deoxy-N6-methyladenosine-3′, 5′-bisphosphate) (0.1 mm), MRS 2365 [[(1R,2R,3S,4R,5S)-4-[6-amino-2-(methylthio)-9H-purin-9-yl]-2,3-dihydroxybicyclo[3.1.0]hex-1-yl]methyl]diphosphoric acid] (0.1 mm), and DPCPX (8-cyclopentyl-1,3-dipropylxanthine) (2 μm) were obtained from Tocris Bioscience. Drugs were prepared as stock solutions in aCSF and frozen in aliquots. Exceptions were ATP, which was made fresh on the day of the experiment, and DPCPX, which was made up in DMSO and diluted such that the final concentration of DMSO never exceeded 0.1%.
When using the BSSC preparations, drugs were applied to the recirculating aCSF (volume of 50 ml, 8 ml/min). With slice preparations, drugs were unilaterally applied locally to the rostral ventral respiratory group (rVRG)/preBötC by a triple-barreled pipette (5–6 μm outer diameter per barrel) pulled from borosilicate glass capillaries (World Precision Instruments). Care was taken to ensure that the outer tip diameter was within this range because fluorescent imaging (40× objective) of Lucifer yellow-filled triple-barreled pipettes established that pipettes in this range did not leak, but they did leak if tip diameter exceeded 6.5 μm. Avoiding leakage was essential because of the potential for agonist evoked P2R desensitization or internalization. Drug microinjections were controlled by a programmable stimulator (Master-8; A.M.P.I. Instruments) connected to a picospritzer (Spritzer4 Pressure Micro-Injector, ∼18 psi) for 10 s application, unless otherwise stated. Consecutive agonist applications were separated by a minimum of 15 min. We did not systematically assess whether this was the minimum time interval required for consistent responses, but it was sufficient for reproducible responses. The concentrations of drugs used in the present study should not be directly compared with those in experiments in which similar agents are applied in the bath or directly to isolated cells. The concentration of drug decreases exponentially with distance from the pipette tip, and previous experiments with this preparation have established that drug concentration in the pipette must be ∼10-fold greater than the bath-applied concentration to produce similar effects.
The drug injection site was established by first using the VRC suction electrode to guide the placement of the drug pipette. Because the outside diameter of the suction electrode was quite large (110 μm), the drug pipette was then systematically moved in the dorsoventral and mediolateral directions until ATP (0.1 mm, 10 s) evoked a frequency increase that was at least twofold greater than baseline. Based on these criteria, we are confident that positive injections sites were in, or in close proximity to the rVRG/preBötC. In addition, because ATP diffuses minimally through the tissue (Funk et al., 2008), the injection site must be very close to the ATP “hotspot,” which has been established previously histologically and immunohistochemically in postnatal animals as corresponding to the preBötC (Lorier et al., 2007).
ATP detection.
The enzyme-based ATP biosensor system (Sarissa Biomedial Ltd.) used in these studies to monitor tissue ATP levels has been described in detail previously (Llaudet et al., 2003, 2005). Sensors consist of a platinum/iridium (Pt/Ir) microelectrode (50 μm diameter, 500 μm in length) coated with a polymer containing two enzymes, glycerol kinase and glycerol-3-phosphate oxidase, that produce H2O2 in proportion to ATP concentration. The Pt/Ir microelectrode is polarized to +500 mV (MicroC Potentiostat, serial #76183; World Precision Instruments), allowing amperometric detection of H2O2. The polarized Pt/Ir microelectrodes, however, can detect other electroactive compounds. Thus, the ATP biosensors were used in conjunction with null sensors, which are identical in all aspects except that they lack the enzymes that hydrolyze ATP. Null sensors detect all non-ATP electroactive species present in the local environment. Therefore, the current produced by ATP is the difference between that recorded at the ATP and null sensors (ATP sensor current − null sensor current). In rhythmic slices, sensors were gradually advanced into the tissue adjacent to the VRC suction electrode and drug injection pipette, whose site was determined as described above. Slice and sensors were then given a minimum of 15 min to stabilize before experimentation. Settling potentials of the sensors within the tissue were not presented because it is not known whether these potentials, when different from the settling potential in the bath, were attributable to ATP.
A new pair of sensors was used on each experimental day. Hydration and conditioning of the sensors was performed as described by Sarissa Biomedical Ltd. Sensors were calibrated immediately before and after each experiment by testing responses to 0.01 mm ATP in the experimental chamber and/or responses to locally applied ATP from the drug pipette (0.1 mm ATP, 10 s). The purpose of the sensor measurements was not to assess the absolute concentration of ATP but to assess how various manipulations affected the ATP profile within the tissue. Thus, a dose-dependent calibration curve was not generated.
Potentiostat output from the ATP and null sensors was acquired using Axoscope 9.2 and saved to the computer using an Molecular Devices Digidata 1322A (16 bit) for later analysis with Clampfit 9.2 (pClamp). Null sensor currents were subtracted from ATP sensor currents to determine the ATP current (or sensor difference current). Area under the sensor difference curve, which reflects the total amount of ATP detected by the sensor, was calculated using GraphPad Prism version 4 (GraphPad Software).
Phosphate assay.
To gain insight into the ability of brainstem tissue to degrade ATP and the degree to which this phosphate production reflects ectonucleotidase activity, 300 μm medullary slices from P0–P4 animals were incubated in ATP or ATP with an ectonucleotidase inhibitor, POM-1 (0.1 mm), and the rate of phosphate production was measured using a colorimetric phosphate assay (PiBlue Phosphate Assay kit; BioAssay Systems).
For each experiment, BSSCs from two animals were serially sectioned in the rostrocaudal direction, and two 300-μm-thick slices were taken from each brainstem. One slice from the rostral medulla served as a control slice. The second slice, containing the preBötC, was cut after the compact division of nucleus ambiguus was no longer evident and the three lobes of the inferior olive appeared in the landmark sections. Slices were incubated in phosphate-free aCSF for 1 h before experimentation. Each slice was transferred to a well in a temperature-controlled (27°C), eight-well, custom-built aluminum chamber, resting inside a Boekel Grant PDB-2 heating block (Boekel Scientific) atop a reciprocal shaker for mild agitation. Each well contained phosphate-free aCSF (oxygenated with 95% O2/5% CO2) in which the slices were preincubated for 10 min. ATP (50 μm) was added to one preBötC slice, whereas ATP and POM-1 were applied to the other preBötC slice. ATP was not applied to rostral medullary control slices because these were used to measure background phosphate release.
To compare phosphate production in live versus dead slices, four 600 μm rhythmic medullary slices (produced as described above) were incubated in phosphate-free aCSF for 15 min and then transferred to a well in the custom-built aluminum chamber (27°C). Each experiment used two live slices and two dead rhythmic slices (produced as described previously). ATP was added to one live and one dead slice to assess phosphate production, whereas the other two slices were controls to measure baseline phosphate release.
To assess phosphate production by specific respiratory-related nuclei at different ages, three 600 μm slices were taken from E19 and P0–P4 animals. The first section (slice 1) was taken from the pons. The rostral boundary of the second slice was the caudal edge of the compact division of nucleus ambiguus (slice 2, corresponded to rhythmic slices). The third slice was taken immediately caudal to slice 2. The slices were pinned rostral surface up, and punches (18 gauge needle) were taken bilaterally from the ventrolateral quadrants of slices 1 and 2 (which included the VRC and surrounding regions) and the XII nucleus and surrounding premotor areas of slice 3. Punches were incubated in oxygenated aCSF for 10 min, and then four punches from each area (from two animals) were placed in each well of a temperature-controlled (31°C), 24-well plate, of which eight wells had been modified for continuous delivery of humidified carbogen (95% O2/5% CO2). Each well contained 400 μl of phosphate-free aCSF. Once in these wells, punches were allowed an additional 10 min equilibration period. Wells 1–4 were experimental and contained ATP and bilateral tissue punches from two animals from slices 2 and 3. Wells 5 and 6 contained bilateral tissue punches from two animals but no ATP and were used to control for background levels of tissue phosphate release. Well 7 contained ATP but no tissue to assess the baseline rate of nonenzymatic ATP breakdown and phosphate production. The chamber was placed on an orbital shaker. At time 0, 10 μl of 2 mm ATP (to produce a final ATP concentration of 0.05 mm) was added to wells 1–4 and 7. Control wells 5 and 6 received 10 μl of phosphate-free aCSF and were used to assess background rates of phosphate release from tissue. Well 7 was an additional control containing no tissue.
Seventy-five microliters of solution were removed from each of the wells at 10, 20, and 30 min after ATP (or aCSF, or ATP and POM-1) application and placed in separate wells of a 96-well plate. A standard curve was simultaneously generated in duplicate for each experiment according to procedures described in the BioAssay Systems kit using phosphate concentrations of 0, 1, 2.5, 5, 10, 20, 30, 40, and 50 μm in the 96-well plate. After the last experimental samples were removed, 100 μl of PiBlue reagent was added to each well (including the standard wells), gently mixed, and incubated at room temperature on an orbital shaker for 30 min. The colored complexes free orthophosphate forms with PiBlue were quantified on a spectrophotometer (OD630 nm) (Bio-Tek Instruments). Phosphate concentrations were obtained from the standard curve (an example is shown in Fig. 7C) from which the total amount of phosphate produced was calculated based on known sample volumes. Enzymatic phosphate production (i.e., that attributable to ectonucleotidase activity) was calculated by subtracting baseline phosphate release (average of wells 5 and 6) from total phosphate measured in the experimental wells 1–4. Enzymatic phosphate production for the VRC and XII punches of E19 and P0–P4 preparations was then plotted against time, and the slope of this relationship was taken as the rate of phosphate produced by each region.
Figure 7.

Ectonucleotidase activity measured through the rate of phosphate production from medullary slices or tissue punches containing the VRC and XII nuclei. A, Group data showing phosphate produced by P0–P4 rhythmic medullary slices under control conditions (no ATP or POM-1 only; n = 7) and in the presence of ATP (0.05 mm; n = 7) or ATP and the ectonucleotidase inhibitor POM-1 (0.1 mm; n = 7). ***p < 0.001, significant difference between ATP and all other conditions. B, Phosphate production in live and dead P0–P4 rhythmic medullary slices. *p < 0.05 (n = 3). C, An example standard curve, like that generated for each experiment, shows the relationship between optical density (OD630 nm) and phosphate concentration. Group data showing the relationship between amount of phosphate produced and time for VRC (gray lines) and XII (black lines) punches for E19 (D; n = 11) and P0–P4 (E; n = 9) preparations. The slope of the relationship indicates rate of phosphate production. F, Histograms of group data showing average rate of phosphate produced by VRC and XII punches for E19 (black bars) and P0–P4 (white bars) preparations. **p < 0.01, ***p < 0.001, significant difference between E19 and P0–P4.
Data analysis.
The effects of drugs on inspiratory frequency were analyzed offline using Clampfit 9.2. Changes in frequency were assessed in the BSSC preparations through monitoring frequency during the last 5 min of the 15 min bath drug application. The maximum frequency evoked by local drug application was determined from the maximum value of the moving average that occurred within the first minute of drug application. For slice preparations, instantaneous frequency [i.e., the frequency for each burst; (1/burst period) × 60] was determined for a period spanning 2–3 min before and 5 min after the onset of drug application. Deviations of baseline tonic activity (oscillatory bursting behavior) were not included in analyses of baseline frequency for embryonic preparations. A moving average based on three bursts was then calculated from this time series. The duration of a frequency change was calculated by the amount of time that frequency differed by more than 2 SDs from the mean baseline frequency. The effects of drugs on XII burst amplitude were assessed by using Clampfit 9.2, whereby five XII inspiratory bursts were averaged from either the control period or immediately after application of ATP. Statistical comparison of mean frequency and amplitude data was based on raw data (rather than relative data) and compared using a t test, one-way ANOVA with Dunnett's multiple comparison test or Tukey's multiple comparison test, or two-way ANOVA with Bonferroni's correction for multiple comparisons when appropriate (GraphPad Prism version 4; GraphPad Software). For analysis of phosphate production, a two-way ANOVA (Bonferroni's correction) was used to determine differences between age group and medullary regions (p < 0.05 was considered significant). Data are expressed as mean ± SEM.
Histology and NK1 receptor immunohistochemistry at E19.
Embryos were removed from anesthetized dams at E19 as described above and perfused transcardially (4% paraformaldehyde). Brains were removed and postfixed overnight in 4% paraformaldehyde. The medulla was then cut transversely (50 μm) on a Leica VT 1000S Vibratome. Alternate sections were processed for cresyl violet to reveal brainstem architecture and for NK1 receptor immunohistochemistry, as described previously to examine the relationship of medullary structures to the preBötC (Gray et al., 2001; Pagliardini et al., 2003; Lorier et al., 2007). In brief, sections were washed with PBS, pH 7.2, and pretreated with 3% H2O2. Subsequently, sections were blocked [1% bovine serum albumin (BSA) and 0.3% Triton X-100] before incubation with the NK1R antibody (1:1000 dilution; Jackson ImmunoResearch) in 0.1% BSA and 0.03% Triton X-100 overnight. Tissue sections were then incubated for 2 h in a biotinylated donkey anti-rabbit secondary antibody (1:1000; Jackson ImmunoResearch) before being reacted with the ABC complex (1.5 h) and washed with PBS and Tris-HCl, pH 8, and DAB (1:100; Sigma) in 0.1% Tris-HCl, pH 8, for 3–5 min before being placed on slides and imaged. Images were taken on an Olympus upright microscope at 2.5 and 20× magnification using a Spot Digital Camera and Advanced Software.
Results
Perinatal development of respiratory network sensitivity to purinergic modulation
Respiratory networks of the postnatal rat isolated in the rhythmic medullary slice are sensitive to excitatory modulation by ATP, whether the ATP is bath applied to the entire slice or locally applied to the preBötC (Lorier et al., 2004, 2007).
To determine when during perinatal development respiratory networks become sensitive to ATP, we assessed the dose-dependent effect of bath-applied ATP (0.1 and 1 mm) on inspiratory frequency of BSSC preparations from the time that respiratory rhythm first emerges at E17 (Di Pasquale et al., 1992; Greer et al., 1992; Pagliardini et al., 2003) through to the early postnatal period. Consistent with previous reports (Di Pasquale et al., 1992; Greer et al., 1992; Onimaru and Homma, 2002; Viemari et al., 2003), baseline frequency increased significantly over this developmental window (data not shown; one-way ANOVA). At E17, rhythmic activity (recorded as contractions of the diaphragm) was slow, averaging 2.5 ± 0.3 bursts/min (n = 33). It increased further from 4.8 ± 0.5 bursts/min at E19 (n = 34), 6.4 ± 0.3 at E21 (n = 32), to 9.7 ± 0.4 bursts/min at P0–P4 (n = 22).
A subset of preparations was tested for their sensitivity to bath-applied ATP. At E17 and E19, inspiratory-related frequencies were 3.0 ± 0.7 (n = 12) and 5.5 ± 0.9 (n = 14) bursts/min, respectively, under baseline conditions and did not change significantly in response to ATP (Fig. 1A,C). In contrast, E21 and P0–P4 preparations responded with significant increases in frequency to ATP (Fig. 1C) (one-way ANOVA, Dunnett's multiple comparison). E21 preparations (n = 10) responded to ATP with a 41 ± 4% increase in frequency from 6.0 ± 0.3 to 8.6 ± 0.4 bursts/min (Fig. 1B,C). P0–P4 preparations (n = 6) responded similarly to ATP with a 39 ± 11% increase in frequency from 11.2 ± 1.0 bursts/min in control to 15.5 ± 1.2 bursts/min (Fig. 1C). Thus, despite different baseline frequencies, the relative sensitivities of E21 and P0–P4 preparations were similar.
Figure 1.

Sensitivity of BSSC preparations to bath-applied ATP emerges between E19 and E21. Inspiratory frequency of E19 (A) and E21 (B) BSSC preparations during control (left) and in the presence of bath-applied ATP (1 mm; right). C, Group data showing the effects of bath-applied ATP (0.1 and 1.0 mm) on inspiratory frequency of BSSC preparations from E17 (n = 12; ♦), E19 (n = 14; ■), E21 (n = 10; ▲), and P0–P4 (n = 6; ●) preparations. *p < 0.01, significant difference from control.
Responses of medullary BSSC preparations to bath-applied ATP suggest that the sensitivity of rhythm-generating networks to ATP emerges between E19 and E21. There are three potential limitations of these data. First, when drugs are bath applied, the concentration increases gradually, permitting receptor desensitization (including internalization), which could attenuate responses. Second, recent ATP sensor data (Funk et al., 2008) and observations that the frequency of rhythmic medullary slices is more sensitive to locally applied (Lorier et al., 2007) than bath-applied (Lorier et al., 2004) ATP suggests that bath-applied ATP has limited access to rhythm-generating regions of the in vitro preparations. Third, bath application of drugs does not allow direct evaluation of rVRG/preBötC sensitivity to ATP. Thus, to confirm that the data generated in BSSC preparations accurately reflect developmental changes in the ATP sensitivity of the rVRG/preBötC, we locally applied ATP to the rVRG/preBötC of rhythmically active medullary slice preparations. Experiments were performed on E17, E19, and P0–P4 preparations. Because respiratory rhythm in vitro (Di Pasquale et al., 1992; Greer et al., 1992; Pagliardini et al., 2003) and fetal breathing movements (Kobayashi et al., 2001) emerge at E17, this was the earliest age group examined. In addition, we examined only E17, E19, and P0–P4 age groups because the objective was to determine whether ATP sensitivity emerges before E21.
ATP (0.1 mm, 10 s) and SP (1 μm, 10 s) were systematically applied to the ventrolateral medulla of 13 slice preparations that exhibited rhythmic behavior at E17. Five of the 13 rhythmic preparations did not respond to either drug and had very low baseline activity with pronounced nonrespiratory oscillatory activity, reminiscent of that previously described in embryonic BSSC and spinal cord preparations (Ren and Greer, 2003; Ren et al., 2006). The average baseline frequency for these eight preparations after 15 min of incubation in 7 mm K+ was 3.2 ± 1.3 bursts/min (Fig. 2A). SP (1 μm, 10 s) was applied as a positive control because previous work has established that embryonic networks are sensitive to SP at this early age (Pagliardini et al., 2003). The peak frequency in response to SP was 34 ± 7.0 bursts/min (n = 8) (Fig. 2B,C, right). Of the eight SP-sensitive preparations, four responded to ATP with a peak frequency of 22.4 ± 8.8 bursts/min (n = 4) (Fig. 2C, left). The fact that only four of eight SP-sensitive E17 preparations responded to ATP should not be over-interpreted as suggesting that SP sensitivity emerges before ATP or that inspiratory networks are just developing P2R sensitivity at E17. The region at which ATP evokes a frequency increase in neonates is much smaller than SP (Lorier et al., 2007), likely reflecting hydrolysis-limited diffusion of ATP (Funk et al., 2008). Thus, we cannot exclude the possibility that a response to SP but not ATP simply reflects that the injection site was too distant from the hotspot for ATP to affect frequency.
Figure 2.

Sensitivity of medullary slice preparations to local application of ATP in the rVRG/preBötC emerges near E17. A, E17 preparations exhibited slow, irregular bursting behavior in 7 mm K+. Integrated XII nerve root recordings from two E17 rhythmic medullary slices showing that, in one slice, brief bouts of rhythmic activity could be evoked only by local application of SP (1 μm, 10 s) into the rVRG/preBötC (B), whereas in another slice, both ATP (0.1 mm, 10 s) and SP evoked brief rhythmic activity (C).
We next assessed developmental changes in sensitivity of inspiratory rhythm-generating networks to ATP. The possibility that sensitivity increases perinatally is first suggested by the observation that only 50% of E17 slice preparations responded to ATP with an increase in frequency, but 100% of E19 and postnatal preparations responded. However, quantification of the ATP response of the E17 slice preparations was confounded by the instability of inspiratory network activity at this age and the prominence of nonrespiratory activity. Thus, we limited the statistical comparison of ATP sensitivity during development to E19 and P0–P4 age groups. In E19 preparations, locally applied ATP evoked a significant increase in frequency from 5.6 ± 0.9 to 45.2 ± 3.4 bursts/min (Fig. 3A,B) (n = 24), whereas in P0–P4 preparations, frequency increased significantly from 19.0 ± 1.3 to 45.9 ± 2.1 bursts/min (Fig. 3A,B) (n = 25). Although the baseline frequency differed significantly between age groups, there was no significant difference in the maximum absolute frequency reached in response to ATP (Fig. 3B) (two-way ANOVA, Bonferroni's correction). The duration of the ATP-evoked frequency increase was also similar between age groups (E19 13.6 ± 1.0 s, n = 24; P0–P4, 12.2 ± 0.8 s, n = 25) (unpaired t test). However, if ATP sensitivity is considered in relative terms (defined as the frequency increase relative to baseline), then the ATP sensitivity is significantly greater at E19 (1509 ± 418%) than P0–P4 (271 ± 25%) preparations, reflecting the lower baseline frequency of the E19 age group (unpaired t test, p < 0.01).
Figure 3.
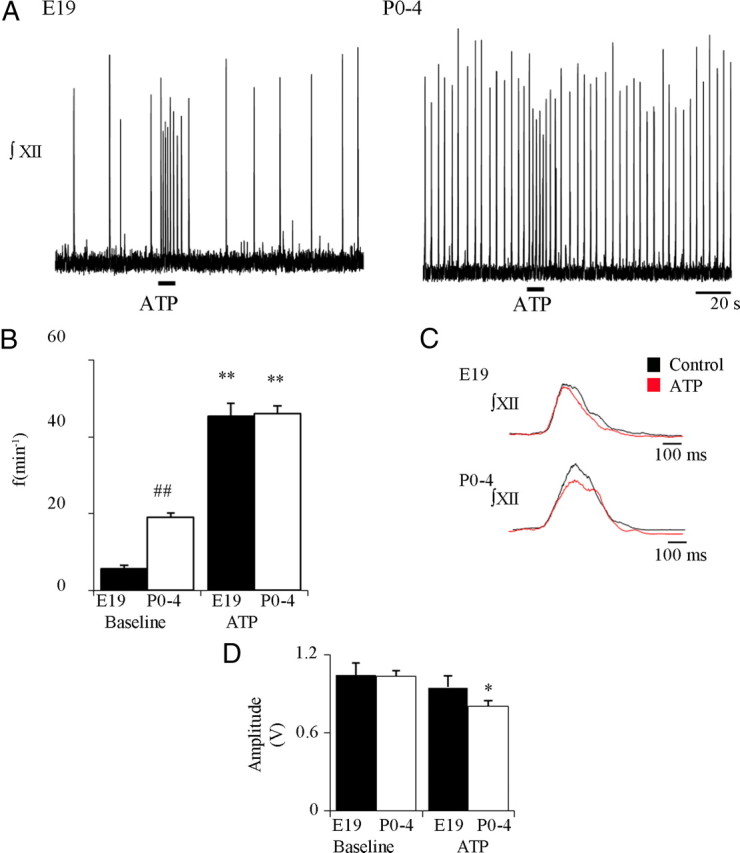
Perinatal changes in the sensitivity of the medullary slice preparations to local application of ATP to the rVRG/preBötC. A, Integrated XII nerve recordings from E19 and P0–P4 rhythmic medullary slice preparations showing responses to local application of ATP (0.1 mm, 10 s) to the rVRG/preBötC. B, Group data for E19 (n = 24; black bars) and P0–P4 (n = 25; white bars) showing baseline and maximum frequency evoked by ATP. C, Burst profiles averaged from five cycles under control conditions and in the presence of ATP for a representative E19 and a P0–P4 rhythmic slice. D, Effects of locally applied ATP on XII inspiratory burst amplitude (n = 10) for E19 and P0–P4 preparations. *p < 0.01, **p < 0.001, significant difference from baseline within an age group; ##p < 0.001, significant difference between age groups.
Despite the profound frequency effects, local application of ATP the rVRG/preBötC was without effect on XII inspiratory burst profile (Fig. 3C) or amplitude (Fig. 3D) at E19 (n = 10). However, there was a small but significant reduction in burst amplitude during the ATP-evoked frequency increase (Fig. 3D) (n = 10). Importantly, the profile of the XII inspiratory burst envelop was unaffected by the ATP application (n = 10) (Fig. 3C). This is shown for an average of typical bursts for E19 and P0–P4 preparations in Figure 3C, where aside from small reductions in burst amplitude in the P0–P4 preparation, the shape of the burst envelopes averaged from five bursts during control and during ATP application are very similar.
Receptor mechanisms: perinatal changes in the sensitivity of inspiratory rhythm to P2Y1 receptor activation
ATP acts primarily by a P2Y1R mechanism in the preBötC of postnatal rhythmic medullary slices to increase inspiratory frequency (Lorier et al., 2007). Based on the observation that E17 networks are sensitive to ATP, we tested the hypothesis that they are also sensitive to P2Y1R activation by locally applying a P2Y1R agonist (0.1 mm MRS 2365, 10 s) and SP to the rVRG/preBötC. SP caused frequency to increase in six of seven preparations to 31.2 ± 8.2 bursts/min, whereas MRS 2365 caused frequency to increase in four of these seven preparations to 35.5 ± 15.8 bursts/min (Fig. 4A) (n = 4). ATP was applied to three of the four MRS 2365-sensitive preparations, in which it caused frequency to increase to 15.5 ± 5.2 bursts/min.
Figure 4.

Activation of P2Y1Rs in the rVRG/preBötC with MRS 2365 evokes a response in E17, E19, and P0–P4 medullary slices. Integrated XII nerve recording from an E17 (A) rhythmic slice shows that MRS 2365 (left; a P2Y1R agonist, 0.1 mm, 10 s) and SP (right; 1 μm, 10 s) applied to the rVRG/preBötC evokes rhythmic bursting. Integrated XII nerve recordings from E19 (B) and P0–P4 (C) rhythmic medullary slice preparations show responses to local application of ATP (left; 0.1 mm, 10 s) and MRS 2365 (right; 0.1 mm, 10 s) to the rVRG/preBötC. D, Group data for E19 (n = 6) and P0–P4 (n = 8) slices showing baseline frequencies (black bars) and frequencies evoked by ATP (white bars) and MRS 2365 (gray bars). E, Average duration of responses evoked by ATP (white bars) and MRS 2365 (gray bars) for E19 (n = 4) and P0–P4 (n = 8). *p < 0.05, **p < 0.001, significant difference between response in MRS 2365 and ATP within an age group.
We next assessed whether the effects of P2Y1R activation on rhythm changes during perinatal development by applying MRS 2365 (0.1 mm, 10 s) to the rVRG/preBötC of E19 (Fig. 4B) (n = 6) and P0–P4 (Fig. 4C) (n = 8) preparations. MRS 2365 caused a significant increase in frequency (Fig. 4D) (two-way ANOVA, Bonferroni's correction) in both age groups. At E19, frequency increased from 10.9 ± 3.4 to 64.7 ± 7.4 bursts/min, whereas at P0–P4, it increased from 18.3 ± 1.3 to 49.8 ± 2.6 bursts/min. Similar to the ATP results, the relative increase in frequency of the E19 preparations to MRS 2365 was significantly greater for E19 (1027 ± 375%) than postnatal preparations (280 ± 21%) (unpaired t test, p < 0.05) as a result of the lower baseline frequency at E19.
Within each age group, the peak frequency evoked by MRS 2365 was significantly greater than that evoked by ATP, but there were no significant differences between age groups. Peak values evoked by MRS 2365 and ATP were 67.5 ± 7.1 and 51.9 ± 6.0 bursts/min in E19 preparations and 49.8 ± 2.6 and 43.4 ± 3.9 bursts/min in P0–P4 preparations (Fig. 4D). The duration of the MRS 2365-evoked frequency increase was significantly greater than the ATP-evoked response duration within E19 and P0–P4 age groups, but there was no significant difference between age groups (Fig. 4E). Two of six E19 preparations were excluded from the analysis of response duration because of the occurrence of large-amplitude, low-frequency, oscillatory activity after the peak frequency was reached, which made it impossible to determine when the response terminated. In the remaining four E19 preparations, MRS 2365-evoked frequency increases, which sometimes included tonic discharge on the XII nerve (Fig. 4B, right), lasted 35.7 ± 7.8 s. ATP responses were significantly shorter at 18.4 ± 2.8 s. Similarly, postnatal responses to MRS 2365 lasted 24.4 ± 3.2 s and were significantly longer than the ATP responses and lasted 13.9 ± 7.8 s (Fig. 4E) (two-way ANOVA, Bonferroni's correction).
As an additional test of P2Y1R involvement in the ATP-evoked frequency increase, we compared both within and between age groups the effects of preapplying the P2Y1R antagonist MRS 2179 (0.1 mm, 120 s) on the response evoked by locally applying ATP (0.1 mm, 10 s) to the rVRG/preBötC. MRS 2179 had similar inhibitory actions on the ATP-evoked frequency response in E19 (n = 5) and P0–P4 (n = 12) preparations (data not shown). ATP applications in E19 preparations evoked peak frequencies of 40.4 ± 7.4 bursts/min (from a baseline of 5.8 ± 1.4 bursts/min) and a similar increase in P0–P4 preparations to 44.6 ± 2.9 bursts/min (from a baseline of 18.2 ± 1.7 bursts/min). Preapplication with MRS 2179 significantly reduced the ATP-evoked frequency increase to 23.0 ± 9.7 and 30.9 ± 2.9 bursts/min in E19 and P0–P4 preparations, respectively (two-way ANOVA, Bonferroni's correction). After washout of the antagonist, the ATP-evoked frequency increase recovered to 34.5 ± 10.2 bursts/min in E19 and 41.4 ± 2.2 bursts/min in P0–P4. The duration of the ATP-evoked frequency increase was also reduced in both age groups by preapplication of MRS 2179, but the reduction was only significant in the P0–P4 preparations (two-way ANOVA, Bonferroni's correction). The ATP response durations were 13.4 ± 2.0 and 12.1 ± 1.5 s for E19 and P0–P4 preparations, respectively, whereas after MRS 2179, it was reduced to 7.5 ± 3.1 and 6.7 ± 2.0 s. After washout of MRS 2179, ATP response durations were 11.3 ± 1.9 s at E19 and 11.9 ± 1.8 s at P0–P4.
ATP metabolism and perinatal development of ectonucleotidase activity
The distribution of ectonucleotidases in the brainstem at any stage of development is poorly characterized. However, recent work, demonstrating at macroscopic levels of CNS differential distribution of individual enzyme activities, emphasizes the importance of understanding how enzyme expression/activity varies microscopically between functionally distinct brain regions (Langer et al., 2008). In addition, because of the lack of effective and subtype-specific antagonists that can be used with functioning networks, evidence of their involvement in shaping network responses to extracellular ATP is primarily limited to comparing the actions of ATP with nonhydrolyzable agonists. For example, the prolonged frequency responses to adenosine 5-O-(thiotriphosphate) (ATPγS) (a hydrolysis-resistant ATP analog) (Lorier et al., 2007) and MRS 2365 in the rVRG/preBötC compared with ATP (Fig. 4) suggest that the ATP effects on inspiratory rhythm are attenuated by ectonucleotidase-mediated breakdown of ATP or accumulation of inhibitory ATP byproducts.
The objective here was to further explore the role of ectonucleotidases in determining ATP response kinetics. We reasoned that, because there are no transporters for extracellular ATP, the rapid frequency decline after stimulation with ATP could reflect ATP receptor desensitization/internalization, diffusion, and/or ATP degradation, the latter of which would include the accumulation of metabolites. If the former process dominates, then the kinetics of the ATP-evoked frequency response and the concentration of ATP in the rVRG/preBötC would follow distinct profiles, i.e., frequency would decrease faster than the ATP concentration. If diffusion and/or degradation are the prime determinants, then the concentration of ATP and frequency response profile should closely match. To test this, we placed ATP and null sensors and an ATP injection pipette into the rVRG/preBötC of P0–P4 rhythmic slice preparations and monitored both the ATP sensor difference current (reflecting ATP concentration) and the frequency response evoked by local application of ATP (0.1 mm, 10 s). As shown for a single P0–P4 rhythmic slice in Figure 5, left, ATP application was associated with a rapid increase in the ATP difference current from 0 to 40 pA and a fourfold increase in inspiratory frequency. The response to a second ATP application in the same site demonstrates that both the ATP concentration profile and frequency responses were highly reproducible (Fig. 5, middle). Importantly, the profile of the inspiratory frequency response closely followed the ATP difference current. A similarly tight relationship between the ATP difference current and inspiratory frequency was observed in a total of six preparations. To further assess the relationship between relative ATP concentration at the sensor within the rVRG/preBötC and inspiratory frequency, the drug injection pipette was moved 140 μm lateral to the initial site to produce a different ATP concentration profile in the rVRG/preBötC (Fig. 5, right). As expected, movement of the pipette away from the rVRG/preBötC produced a much lower ATP difference current at the sensors that remained situated in the rVRG/preBötC. Most importantly, the frequency response was diminished in proportion to the ATP difference current and followed the new ATP response profile (n = 5).
Figure 5.

Local application of ATP into the rVRG/preBötC evokes a frequency response that closely follows the ATP concentration profile. Plots show, in a single medullary slice preparation, the effects of locally applying ATP within the rVRG/preBötC (0.1 mm, 10 s, starting at t = 0) on inspiratory frequency measured from integrated XII nerve recording (black traces) and the ATP difference current (ATP sensor current − null sensor current) within the rVRG/preBötC (gray traces). Consecutive responses to ATP applied at the same site, 15 min apart (left and middle). Inspiratory frequency and ATP difference current recorded in response to locally applying ATP at a site 140 μm medial to the initial site in the rVRG/preBötC (0.1 mm, 10 s; right).
While excluding desensitization/internalization as a major factor, the close correlation between the ATP sensor difference current and frequency responses does not distinguish between whether diffusion or degradation determines the ATP profile. If diffusion is the main determinant, then the movement of ATP through tissue from a point source should be similar in live tissue with enzymatic processes intact and dead tissue in which enzymatic processes have been stopped (assuming the diffusion coefficient is similar in live and dead tissue), e.g., rhythmic medullary slice preparations that had been stored at room temperature in unoxygenated aCSF for 12–16 h. Freshly cut and dead slices from P0–P4 animals were placed side-by-side in the recording chamber, sensors were calibrated, and then ATP and null sensors and the drug injection pipette were placed in the rVRG/preBötC of either the live or dead slice. Dead slices were visually indistinguishable from the live slices.
The ATP difference current produced by local application of ATP (0.1 mm, 10 s) (Fig. 6A) in the rVRG/preBötC was recorded. The drug injection pipette was then moved, and the drug injection was repeated at 140 μm steps away from the rVRG/preBötC (Fig. 6B,C). This protocol was then repeated on the other slice. The same sensor pair was used for each set of dead and live tissue slices, but new sensors were used on each experimental day to ensure consistent sensitivity.
Figure 6.

ATP movement is restricted in live compared with dead medullary tissue. Plot showing the ATP difference current evoked in live (gray lines) and dead (black lines) slices by local application of ATP (0.1 mm, 10 s) into the VRC (Site 1, A) and at distances 140 μm (Site 2, B), and 280 μm (Site 3, C) medial to site 1. D, Histogram of group data (n = 4) showing the area under the ATP difference current versus time curve (proportional to the amount of ATP detected) of a control application in which ATP was applied adjacent to the sensors when both were above the tissue (calibration) and again when sensors were in the VRC and the injection pipette was at sites 1, 2, and 3. *p < 0.05, significant difference from site 1; #p < 0.05, significant difference from calibration; @p < 0.05, significant difference between dead and live sites.
As shown for a live and dead slice in Figure 6A, the peak ATP difference current was 4.5 ± 1.3-fold (n = 4) greater in the dead slices than in the live slices when ATP was applied at the initial sensor site (Fig. 6D, Site 1). The area under the ATP difference current versus time curve (which corresponds to the amount of ATP detected) was also at least fourfold greater for dead compared with live slices for all injection sites. At site 1, the area in dead slices corresponded to 160.1 ± 62.1 pA/min compared with live slices at 41.5 ± 22.4 pA/min (Fig. 6D) (two-way ANOVA, Bonferroni's correction). The difference in the ATP difference current between dead and live tissue (whether measured as peak current or area) increased as the distance between the sensor and the site of drug injection increased (Fig. 6). The peak current in dead slices was 8.0 ± 3.8 and 48.8 ± 51.2 times higher than in live slices at 140 μm (site 2) and 280 μm (site 3) distant from site 1, respectively. Similarly, the area under the curve was approximately eightfold greater in dead (138.5 ± 52.5 pA/min) than live (17.1 ± 8.0 pA/min) tissue at site 2 and ∼10-fold greater at site 3 (dead tissue, 47.0 ± 23.4 pA/min; live tissue, 4.6 ± 2.8 pA/min). Similar results were obtained when albumin (cooked egg white, n = 1; data not shown) was substituted for dead tissue. At site 1, the current in egg white was 4.0 times greater than in live tissue, whereas at sites 2 and 3, the currents were 4.2 and 2.1 times greater than that in live tissue.
Also of interest is that both the peak and area of the ATP difference current for dead tissue was greater than the calibration response when ATP was applied to the sensors in solution, whereas the response in live tissue was lower than the calibration response (Fig. 6D). This indicates that, compared with the calibration injection in which ATP removal is primarily determined by flow through the chamber, ATP removal is slower in dead but faster in live tissue. These data suggest that, when injected into dead tissue, ATP is protected from direct washout in the recirculating aCSF, whereas in live tissue, ATP degradation occurs faster than ATP can be washed away by flowing solution. Although still indirect, these sensor data provide additional support for the hypothesis that ectonucleotidase activity influences ATP responses.
An important assumption of these experiments is that enzymatic breakdown of extracellular ATP into phosphate is lower in dead compared with live slices. This assumption was tested in two steps using a colorimetric phosphate assay (PiBlue Phosphate Assay kit; BioAssay Systems). First, to establish that the phosphate produced by P0–P4 slices incubated in ATP-containing aCSF (0.05 mm) is attributable to the action of ectonucleotidase enzymes, the amount of phosphate produced under control conditions (bath-applied ATP) was compared with that when slices were incubated in aCSF containing both ATP (0.05 mm) and the ectonucleotidase inhibitor POM-1 (0.1 mm). Addition of ATP increased phosphate production more than fourfold. POM-1 greatly reduced this phosphate production (Fig. 7A) (n = 7), indicating that the ectonucleotidases are responsible for the majority of the phosphate produced by slices incubated in extracellular ATP. Second, comparison of the amount of phosphate produced by live and dead medullary slices revealed that live slices produce significantly more phosphate than dead slices (Fig. 7B) (n = 3). An example standard curve generated in each experiment to calculate the phosphate concentration is shown in Figure 7C. Background phosphate release from tissue measured from wells containing tissue but no ATP was minimal and subtracted from experimental wells (containing tissue and ATP) to give the amount of phosphate produced per well. Phosphate was not detectable in control wells containing ATP in aCSF but no tissue, indicating that ATP was stable in solution.
Next we tested the hypotheses that ectonucleotidase activity varies between specific respiratory nuclei and changes perinatally by using the phosphate assay. The rate of phosphate production was compared between tissue punches taken from specific medullary regions of E19 and P0–P4 preparations when incubated in ATP containing aCSF. The hypothesis that enzyme activity changes perinatally was based on the observations that, although MRS 2365 (which is hydrolysis resistant) evokes a longer-lasting, higher-frequency response than ATP at both E19 and P0–P4 (Fig. 4), the magnitude of the difference in response duration is greater at E19. This could reflect the following in E19 animals: (1) developmental changes in the compliment of P2Rs underlying the ATP response; (2) greater ectonucleotidase activity at E19; or (3) decreased inhibitory actions of ATP metabolites on the frequency response (see below).
The phosphate produced at 10, 20, and 30 min for VRC and XII punches is plotted in Figure 7 for E19 (Fig. 7D) (n = 11) and P0–P4 (Fig. 7E) (n = 9). The slope of this relationship, which corresponds to the rate of phosphate production, was not significantly different between the VRC and XII punches within an age group but was significantly greater (approximately twofold) in P0–P4 (0.001 ± 0.0001 μmol/min) compared with E19 slices (0.0005 ± 0.00003 μmol/min) (Fig. 7F) (two-way ANOVA, Bonferroni's correction).
ATP byproducts influence rhythm and ATP responses perinatally
The duration of the frequency increase evoked by MRS 2365, a relatively nonhydrolyzable agonist, in the rVRG/preBötC was greater than that evoked by ATP in both E19 and postnatal animals. We hypothesized that the longer duration MRS 2365 response was attributable to the degradation of ATP (but not MRS 2365) by ectonucleotidases and the actions of ATP byproducts, ADP and ADO, on rhythm.
ADP is an agonist at P2Y1Rs (Ralevic and Burnstock, 1998) and therefore was expected to have excitatory effects on rhythm. This was confirmed in four postnatal preparations in which local application of ADP (0.1 mm, 10 s) to the rVRG/preBötC caused frequency to increase from 15.2 ± 1.2 bursts/min in control to 25.4 ± 4.2 bursts/min (data not shown; p < 0.05, one-tailed t test; n = 4). Generation of ADP from ATP is therefore unlikely to account for the shorter-duration effect of ATP compared with MRS 2365.
Adenosine, conversely, is an agonist at P1Rs in which the effect that has been primarily reported in fetal and neonatal animals to inhibit frequency through an A1R mechanism (Lagercrantz et al., 1984; Bissonnette et al., 1991; Herlenius and Lagercrantz, 1999). Its effects, however, are confounded by possible actions at excitatory A2a receptors, and developmental studies have yielded inconsistent results (Yamamoto et al., 1994; Kawai et al., 1995; Herlenius and Lagercrantz, 1999; Mironov et al., 1999; Brockhaus and Ballanyi, 2000; Wang et al., 2005; Mayer et al., 2006).
We first tested for the presence of tonic adenosinergic inhibitory tone in rhythmic medullary slices from E19 and P0–P4 animals by assessing the effects on rhythm of locally applying an A1R antagonist (2 μm DPCPX, 120 s) in the rVRG/preBötC (Fig. 8). DPCPX caused a significant increase in baseline inspiratory frequency from 4.4 ± 0.9 to 12.2 ± 3.0 busts/min in E19 slice preparations (paired t test; n = 9) (Fig. 8A,C) but was without effect on the rhythm in postnatal preparations (paired t test; n = 6) (Fig. 8B,C). These results suggest that there is endogenous activation of A1Rs during the embryonic period in vitro that is absent postnatally.
Figure 8.

Perinatal changes in the influence of A1R receptors on baseline frequency. Local application of an A1R antagonist (2 μm DPCPX, 120 s) into the rVRG/preBötC alters baseline frequency in E19 (A) but not P0–P4 (B) slices. Group data (C) showing the influence of A1R antagonism on baseline frequency for E19 (n = 9) and P0–P4 (n = 6) slices. *p < 0.01, significant difference from control.
We next compared in E19 and postnatal slices the effects of A1R antagonism on the duration and peak frequency of the ATP-evoked frequency increase by assessing responses to ATP alone (0.1 mm, 10 s) and after a 2 min preapplication of the A1R antagonist DPCPX (2 μm, 120 s) (Fig. 9). DPCPX did not significantly alter response duration in either age group (Fig. 9D). The control-ATP and antagonist-ATP response durations were 13.1 ± 1.2 and 15.9 ± 2.0 s for E19 preparations (n = 9) compared with 13.0 ± 1.3 and 9.0 ± 3.7 s for P0–P4 preparations (n = 4). A1R antagonism with DPCPX, however, did differentially alter the peak frequency evoked by ATP in the rVRG/preBötC (Fig. 9C). At E19, the peak frequency evoked by ATP in DPCPX (51.6 ± 5.7 bursts/min) was significantly greater than in control (43.0 ± 5.4 bursts/min; two-way ANOVA, Bonferroni's correction) (Fig. 9A–C). At P0–P4, however, DPCPX did not significantly change the peak frequency, which was 42.5 ± 10.7 bursts/min in DPCPX and 44.3 ± 9.2 bursts/min in control (two-way ANOVA, Bonferroni's correction) (Fig. 9A–C).
Figure 9.

Perinatal changes in the effects of A1R antagonism on the ATP-evoked frequency increase. Integrated XII recordings from E19 (A) and P0–P4 (B) rhythmic slices after local application of ATP (0.1 mm, 10 s; left) under control conditions and after a 2 min preapplication of an A1R antagonist (2 μm DPCPX; right). C, Group data for E19 (n = 9) and P0–P4 (n = 4) slices showing baseline frequency (black bars) and the peak frequency evoked by ATP alone (white bars) and after DPCPX (gray bars). D, Duration of the response evoked by ATP alone (white bars) and after preapplication of DPCPX (gray bars) in E19 and P0–P4 preparations. *p < 0.001, difference from ATP response.
Discussion
Perinatal changes in ATP sensitivity
In rats, inspiratory rhythm emerges in vitro (Di Pasquale et al., 1992; Greer et al., 1992; Pagliardini et al., 2003) and in utero (Jansen and Chernick, 1991; Kobayashi et al., 2001) at E17. Baseline frequency then increases into the postnatal period (Di Pasquale et al., 1992; Greer et al., 1992). We demonstrate that, when these rVRG/preBötC networks first produce oscillatory motor output at E17, they are sensitive to ATP. The insensitivity of BSSC preparations to bath-applied ATP until after E19, although apparently inconsistent with slice responses to locally applied ATP, most likely reflects the limited diffusion/rapid degradation of ATP in the medulla (Fig. 6) (Funk et al., 2008). Because bath-applied ATP is unlikely to reach the preBötC, responses most likely reflect activation of chemosensitive sites on the medullary surface (Gourine et al., 2003, 2005a).
Developmentally, rVRG/preBötC network activation by ATP evoked similar peak frequencies at E19 and P0–P4. Relative sensitivity, however, was much higher at E19 than P0–P4 as a result of the threefold lower baseline frequency. The slower fetal rhythm likely reflects immature membrane and synaptic properties but also immature modulatory systems (Greer et al., 2006). For example, antagonists of inhibitory modulators, including A1 ADO receptor antagonists (Fig. 8) (Herlenius et al., 1997, 2002), can raise fetal rhythm toward that of the neonate, suggesting a fetus-specific inhibition. Conversely, fetal preparations may lack excitation, as suggested by the observation that ATP, like SP, 5-HT, and thyrotropin-releasing hormone (Thoby-Brisson and Greer, 2008) can increase frequency in fetal and postnatal preparations to similar absolute levels. Whether absolute or relative sensitivity is physiologically most relevant is uncertain, but data demonstrate that fetal networks can operate at frequencies much higher than baseline.
P2Y1Rs are primarily responsible for the ATP-evoked frequency increase in the preBötC of postnatal rats (Lorier et al., 2007). P2R expression in the developing CNS, however, is dynamic (Cheung et al., 2003, 2005; Franke and Illes, 2006; Burnstock, 2007). Thus, an important contribution is establishing, based on MRS 2365 responses, that the emerging E17 inspiratory network is sensitive to P2Y1R modulation. The fact that responses were greater to MRS 2365 than ATP at E19 and P0–P4 could reflect either the greater affinity of P2Y1R for MRS 2365 or the greater resistance of MRS 2365 to hydrolysis. Attenuation of the ATP-evoked frequency increase by MRS 2179 in E19 and P0–P4 preparations further supports P2Y1R involvement; however, the incomplete block suggests involvement of other P2Rs.
Role of ectonucleotidases in shaping ATP responses
An assumption of ATP signaling in the CNS is that responses are influenced by ectonucleotidases that dynamically modify the P2R and P1R agonist profiles by rapidly degrading ATP and producing ADP (P2YR agonist), AMP, and ADO (P1R agonist) (Dunwiddie et al., 1997; Zimmermann, 2000). The biochemistry and molecular biology of this enzyme group, which comprises four main families, are rapidly emerging. However, aside from the demonstration of their involvement in establishing swimming episode duration in tadpoles (Dale and Gilday, 1996), the lack of specific ectonucleotidase inhibitors means that little is known about how these enzymes contribute to ATP signaling in functioning mammalian motor networks. Most evidence is indirect, including observations that hydrolysis-resistant ATP analogs, such as ATPγS (Lorier et al., 2007) and MRS 2365 (Fig. 4), evoke greater responses than ATP.
ATP biosensor and the phosphate assay data are, therefore, significant because they provide novel evidence that ectonucleotidases shape motor network responses to ATP. ATP frequency responses closely followed ATP concentration profiles, indicating that processes other than P2R desensitization/internalization, such as diffusion or ATP degradation, underlie the rapid termination of rVRG/preBötC ATP responses. The limited diffusion of ATP in live compared with dead tissue suggests that active processes determine the fate of ATP. Phosphate assays establish that phosphate production by rVRG/preBötC tissue is attributable to ectonucleotidase activity and that phosphate production is reduced in dead tissue. Together, these data strongly suggest that ATP hydrolysis is likely an active processes limiting ATP diffusion in rVRG/preBötC tissue.
Understanding the significance of ectonucleotidase diversity for ATP signaling in respiratory networks and brain function in general will require that their developmental and spatial distributions are characterized. Enzyme isoforms differ in their substrate affinities and end products (Zimmermann, 2000, 2001). Thus, agonist profiles will depend on local enzyme expression. For example, ectonucleoside triphosphate diphosphohydrolase 2, which is most prominent in the CNS and possibly the brainstem, will cause ADP accumulation favoring P2YR activation (Alvarado-Castillo et al., 2005). Developmentally, phosphate production increased between E17 and P0–P4, reflecting increased enzyme activity or a shift to isoforms that generate more phosphate per ATP. Phosphate production within age groups was similar in VRC and XII punches, but additional analyses are required to determine whether this reflects homogenous ectonucleotidase expression.
ATP metabolites shape ATP response dynamics
ADP and ADO are the main neuroactive byproducts of ATP. ADP is an endogenous P2Y agonist (Burnstock, 2006; von Kügelgen, 2006) that, as predicted based on the P2Y1R excitation of rVRG/preBötC networks, increases frequency. Therefore, the effect of ATP hydrolysis to ADP on the excitatory component of the ATP response would shift the relative contribution of P2XRs and P2YRs.
ADO, in contrast, is primarily reported to inhibit frequency through A1Rs (Lagercrantz et al., 1984; Bissonnette et al., 1991; Herlenius and Lagercrantz, 1999). Systemically administered ADO agonists depress respiration (Lagercrantz et al., 1984; Koos and Matsuda, 1990; Bissonnette and Reddington, 1991; Bissonnette et al., 1991), whereas A1R antagonism increases respiratory frequency in vivo (Schmidt et al., 1995), fetal breathing movements (Kobayashi et al., 2001), and inspiratory-related activity in vitro (Fig. 8) (Herlenius and Lagercrantz, 1999; Herlenius et al., 2002). Whether ADO directly inhibits central respiratory networks, however, is uncertain because systemic administration can also affect peripheral sites. Moreover, ADO agonists applied to ventral respiratory circuits in vitro do not consistently inhibit rhythm (Brockhaus and Ballanyi, 2000). The ontogeny of this effect is also uncertain. Reports suggest that the inhibition is limited to embryonic stages with only weak effects in adults (Yamamoto et al., 1994; Herlenius and Lagercrantz, 1999) or that it extends from embryonic to neonatal (Kawai et al., 1995; Wang et al., 2005) or juvenile (Mironov et al., 1999) stages.
Our main focus was on whether the breakdown of ATP within the rVRG/preBötC modifies the ATP-evoked frequency increase. In this context, results were clear. ATP excitation was enhanced if A1Rs were blocked, i.e., ATP degradation and ADO receptor activation attenuates rVRG/preBötC responses to ATP. A1R antagonism also revealed an endogenous adenosinergic inhibitory tone in the rVRG/preBötC. Neither of these effects were apparent in P0–P4 preparations, suggesting, as reported previously (Herlenius et al., 2002), that the inhibitory actions of ATP metabolites are strongest in fetal stages.
Physiological significance
Under conditions when ATP is released in the preBötC, we have shown that its actions will be influenced by a developmentally changing, interactive system involving the actions of ATP at P2Rs, ectonucleotidases, and ATP byproducts at P2 and P1 receptors. At E17, ATP evoked bursts of inspiratory activity; hence, ATP may contribute to the endogenous activation of fetal breathing movements, which are important for respiratory muscle and lung development (Mantilla and Sieck, 2008). However, a major challenge to understanding the physiological significance of P2R signaling for central respiratory control is defining the conditions that evoke ATP release. Hypercapnia in adult rats in vivo evokes ATP release from ventral medullary chemosensitive sites, which contributes to the ventilatory response (Gourine et al., 2005b). Within the VRC/preBötC, only hypoxia at present is known to evoke ATP release (Gourine et al., 2005a). This occurs after the peak increase in ventilation (Gourine et al., 2005a). Thus, ATP attenuates the secondary depressive phase of the biphasic hypoxic ventilatory response. Underlying mechanisms may involve a preBötC-specific, P2Y1R-mediated excitation (Lorier et al., 2007) that reflects, in part, a moderate but ubiquitous sensitivity of preBötC neurons to ATP (Lorier et al., 2008).
Developmentally, the capacity for ATP to drive rhythm, in absolute terms, appears constant between E19 and P0–P4. In contrast, developmental increases in ectonucleotidase activity will more rapidly degrade ATP, but the consequences will depend on the enzyme complement. Enzymes favoring ADP production will further offset the hypoxic ventilatory depression, whereas those favoring ADO will likely depress ventilation in fetal but not postnatal stages. Indeed, the greater sensitivity of fetal preparations to ADO (Herlenius et al., 2002) is a hypothesized factor in the greater sensitivity of premature mammals to hypoxic ventilatory depression. It also has implications for apnea of prematurity in which a premature, ADO-sensitive respiratory network is a hypothesized contributor to respiratory instability (Barrington and Finer, 1991). In fact, despite ongoing debate as to whether the beneficial effects of caffeine are attributable to A1 receptor antagonism, caffeine administration is a primary therapy for apnea of prematurity (Hascoet et al., 2000; Bhatt-Mehta and Schumacher, 2003; Schmidt, 2005; Schmidt et al., 2006).
Defining the basic mechanisms and developmental dynamics of this three-limb system is essential to understand the role of ATP signaling in motor networks. It may also provide novel methods of manipulating each limb and overall system dynamics to increase or decrease network excitability and stability.
Footnotes
This work was supported by the Alberta Heritage Foundation for Medical Research (AHFMR), Canadian Institute for Health Research (CIHR), Canadian Foundation for Innovation, and Alberta Science and Research Authority. A.G.H. and J.D.Z. were supported by studentships from Natural Sciences and Engineering Research Council of Canada and CIHR, respectively; both received support from the CIHR training program in Maternal Fetal and Newborn Health. J.J.G. and G.D.F. are AHFMR Scientists. We thank Prof. N. Dale for his invaluable assistance with application of the ATP sensor technology.
References
- Abbracchio MP, Boeynaems JM, Barnard EA, Boyer JL, Kennedy C, Miras-Portugal MT, King BF, Gachet C, Jacobson KA, Weisman GA, Burnstock G. Characterization of the UDP-glucose receptor (re-named here the P2Y14 receptor) adds diversity to the P2Y receptor family. Trends Pharmacol Sci. 2003;24:52–55. doi: 10.1016/S0165-6147(02)00038-X. [DOI] [PMC free article] [PubMed] [Google Scholar]
- Alvarado-Castillo C, Harden TK, Boyer JL. Regulation of P2Y1 receptor-mediated signaling by the ectonucleoside triphosphate diphosphohydrolase isozymes NTPDase1 and NTPDase2. Mol Pharmacol. 2005;67:114–122. doi: 10.1124/mol.104.006908. [DOI] [PubMed] [Google Scholar]
- Anguio y Gonzalez. The prenatal growth of the albino rat. Anat Rec. 1932;52:117–138. [Google Scholar]
- Barrington K, Finer N. The natural history of the appearance of apnea of prematurity. Pediatr Res. 1991;29:372–375. doi: 10.1038/pr.1991.72500. [DOI] [PubMed] [Google Scholar]
- Bhatt-Mehta V, Schumacher RE. Treatment of apnea of prematurity. Paediatr Drugs. 2003;5:195–210. doi: 10.2165/00128072-200305030-00006. [DOI] [PubMed] [Google Scholar]
- Bissonnette JM, Reddington M. Autoradiographic localization of adenosine A1 receptors in brainstem of fetal sheep. Brain Res Dev Brain Res. 1991;61:111–115. doi: 10.1016/0165-3806(91)90120-8. [DOI] [PubMed] [Google Scholar]
- Bissonnette JM, Hohimer AR, Knopp SJ. The effect of centrally administered adenosine on fetal breathing movements. Respir Physiol. 1991;84:273–285. doi: 10.1016/0034-5687(91)90123-z. [DOI] [PubMed] [Google Scholar]
- Brockhaus J, Ballanyi K. Anticonvulsant A(1) receptor-mediated adenosine action on neuronal networks in the brainstem-spinal cord of newborn rats. Neuroscience. 2000;96:359–371. doi: 10.1016/s0306-4522(99)00544-8. [DOI] [PubMed] [Google Scholar]
- Burnstock G. Historical review: ATP as a neurotransmitter. Trends Pharmacol Sci. 2006;27:166–176. doi: 10.1016/j.tips.2006.01.005. [DOI] [PubMed] [Google Scholar]
- Burnstock G. Physiology and pathophysiology of purinergic neurotransmission. Physiol Rev. 2007;87:659–797. doi: 10.1152/physrev.00043.2006. [DOI] [PubMed] [Google Scholar]
- Burnstock G, Knight GE. Cellular distribution and functions of P2 receptor subtypes in different systems. Int Rev Cytol. 2004;240:31–304. doi: 10.1016/S0074-7696(04)40002-3. [DOI] [PubMed] [Google Scholar]
- Cheung KK, Ryten M, Burnstock G. Abundant and dynamic expression of G protein-coupled P2Y receptors in mammalian development. Dev Dyn. 2003;228:254–266. doi: 10.1002/dvdy.10378. [DOI] [PubMed] [Google Scholar]
- Cheung KK, Chan WY, Burnstock G. Expression of P2X purinoceptors during rat brain development and their inhibitory role on motor axon outgrowth in neural tube explant cultures. Neuroscience. 2005;133:937–945. doi: 10.1016/j.neuroscience.2005.03.032. [DOI] [PubMed] [Google Scholar]
- Dale N, Gilday D. Regulation of rhythmic movements by purinergic neurotransmitters in frog embryos. Nature. 1996;383:259–263. doi: 10.1038/383259a0. [DOI] [PubMed] [Google Scholar]
- Di Pasquale E, Monteau R, Hilaire G. In vitro study of central respiratory-like activity of the fetal rat. Exp Brain Res. 1992;89:459–464. doi: 10.1007/BF00228263. [DOI] [PubMed] [Google Scholar]
- Dunwiddie TV, Diao L, Proctor WR. Adenine nucleotides undergo rapid, quantitative conversion to adenosine in the extracellular space in rat hippocampus. J Neurosci. 1997;17:7673–7682. doi: 10.1523/JNEUROSCI.17-20-07673.1997. [DOI] [PMC free article] [PubMed] [Google Scholar]
- Franke H, Illes P. Involvement of P2 receptors in the growth and survival of neurons in the CNS. Pharmacol Ther. 2006;109:297–324. doi: 10.1016/j.pharmthera.2005.06.002. [DOI] [PubMed] [Google Scholar]
- Funk GD, Smith JC, Feldman JL. Generation and transmission of respiratory oscillations in medullary slices: role of excitatory amino acids. J Neurophysiol. 1993;70:1497–1515. doi: 10.1152/jn.1993.70.4.1497. [DOI] [PubMed] [Google Scholar]
- Funk GD, Kanjhan R, Walsh C, Lipski J, Comer AM, Parkis MA, Housley GD. P2 receptor excitation of rodent hypoglossal motoneuron activity in vitro and in vivo: a molecular physiological analysis. J Neurosci. 1997;17:6325–6337. doi: 10.1523/JNEUROSCI.17-16-06325.1997. [DOI] [PMC free article] [PubMed] [Google Scholar]
- Funk GD, Huxtable AG, Lorier AR. ATP in central respiratory control: a three-part signaling system. Respir Physiol Neurobiol. 2008;164:131–142. doi: 10.1016/j.resp.2008.06.004. [DOI] [PubMed] [Google Scholar]
- Gourine AV, Atkinson L, Deuchars J, Spyer KM. Purinergic signalling in the medullary mechanisms of respiratory control in the rat: respiratory neurones express the P2X2 receptor subunit. J Physiol. 2003;552:197–211. doi: 10.1113/jphysiol.2003.045294. [DOI] [PMC free article] [PubMed] [Google Scholar]
- Gourine AV, Llaudet E, Dale N, Spyer KM. Release of ATP in the ventral medulla during hypoxia in rats: role in hypoxic ventilatory response. J Neurosci. 2005a;25:1211–1218. doi: 10.1523/JNEUROSCI.3763-04.2005. [DOI] [PMC free article] [PubMed] [Google Scholar]
- Gourine AV, Llaudet E, Dale N, Spyer KM. ATP is a mediator of chemosensory transduction in the central nervous system. Nature. 2005b;436:108–111. doi: 10.1038/nature03690. [DOI] [PubMed] [Google Scholar]
- Gray PA, Janczewski WA, Mellen N, McCrimmon DR, Feldman JL. Normal breathing requires preBotzinger complex neurokinin-1 receptor-expressing neurons. Nat Neurosci. 2001;4:927–930. doi: 10.1038/nn0901-927. [DOI] [PMC free article] [PubMed] [Google Scholar]
- Greer JJ, Smith JC, Feldman JL. Respiratory and locomotor patterns generated in the fetal rat brain stem-spinal cord in vitro. J Neurophysiol. 1992;67:996–999. doi: 10.1152/jn.1992.67.4.996. [DOI] [PubMed] [Google Scholar]
- Greer JJ, Funk GD, Ballanyi K. Preparing for the first breath: prenatal maturation of respiratory neural control. J Physiol. 2006;570:437–444. doi: 10.1113/jphysiol.2005.097238. [DOI] [PMC free article] [PubMed] [Google Scholar]
- Hascoet JM, Hamon I, Boutroy MJ. Risks and benefits of therapies for apnoea in premature infants. Drug Saf. 2000;23:363–379. doi: 10.2165/00002018-200023050-00002. [DOI] [PubMed] [Google Scholar]
- Herlenius E, Lagercrantz H. Adenosinergic modulation of respiratory neurones in the neonatal rat brainstem in vitro. J Physiol. 1999;518:159–172. doi: 10.1111/j.1469-7793.1999.0159r.x. [DOI] [PMC free article] [PubMed] [Google Scholar]
- Herlenius E, Lagercrantz H, Yamamoto Y. Adenosine modulates inspiratory neurons and the respiratory pattern in the brainstem of neonatal rats. Pediatr Res. 1997;42:46–53. doi: 10.1203/00006450-199707000-00008. [DOI] [PubMed] [Google Scholar]
- Herlenius E, Adén U, Tang LQ, Lagercrantz H. Perinatal respiratory control and its modulation by adenosine and caffeine in the rat. Pediatr Res. 2002;51:4–12. doi: 10.1203/00006450-200201000-00004. [DOI] [PubMed] [Google Scholar]
- Illes P, Ribeiro JA. Neuronal P2 receptors of the central nervous system. Curr Top Med Chem. 2004;4:831–838. doi: 10.2174/1568026043451032. [DOI] [PubMed] [Google Scholar]
- Jansen AH, Chernick V. Fetal breathing and development of control of breathing. J Appl Physiol. 1991;70:1431–1446. doi: 10.1152/jappl.1991.70.4.1431. [DOI] [PubMed] [Google Scholar]
- Kawai A, Okada Y, Mückenhoff K, Scheid P. Theophylline and hypoxic ventilatory response in the rat isolated brainstem-spinal cord. Respir Physiol. 1995;100:25–32. doi: 10.1016/0034-5687(94)00124-i. [DOI] [PubMed] [Google Scholar]
- Kobayashi K, Lemke RP, Greer JJ. Ultrasound measurements of fetal breathing movements in the rat. J Appl Physiol. 2001;91:316–320. doi: 10.1152/jappl.2001.91.1.316. [DOI] [PubMed] [Google Scholar]
- Koos BJ, Matsuda K. Fetal breathing, sleep state, and cardiovascular responses to adenosine in sheep. J Appl Physiol. 1990;68:489–495. doi: 10.1152/jappl.1990.68.2.489. [DOI] [PubMed] [Google Scholar]
- Lagercrantz H, Yamamoto Y, Fredholm BB, Prabhakar NR, von Euler C. Adenosine analogues depress ventilation in rabbit neonates. Theophylline stimulation of respiration via adenosine receptors? Pediatr Res. 1984;18:387–390. doi: 10.1203/00006450-198404000-00018. [DOI] [PubMed] [Google Scholar]
- Langer D, Hammer K, Koszalka P, Schrader J, Robson S, Zimmermann H. Distribution of ectonucleotidases in the rodent brain revisited. Cell Tissue Res. 2008;334:199–217. doi: 10.1007/s00441-008-0681-x. [DOI] [PubMed] [Google Scholar]
- Llaudet E, Botting NP, Crayston JA, Dale N. A three-enzyme microelectrode sensor for detecting purine release from central nervous system. Biosens Bioelectron. 2003;18:43–52. doi: 10.1016/s0956-5663(02)00106-9. [DOI] [PubMed] [Google Scholar]
- Llaudet E, Hatz S, Droniou M, Dale N. Microelectrode biosensor for real-time measurement of ATP in biological tissue. Anal Chem. 2005;77:3267–3273. doi: 10.1021/ac048106q. [DOI] [PubMed] [Google Scholar]
- Lorier AR, Peebles K, Brosenitsch T, Robinson DM, Housley GD, Funk GD. P2 receptors modulate respiratory rhythm but do not contribute to central CO2 sensitivity in vitro. Respir Physiol Neurobiol. 2004;142:27–42. doi: 10.1016/j.resp.2004.04.007. [DOI] [PubMed] [Google Scholar]
- Lorier AR, Huxtable AG, Robinson DM, Lipski J, Housley GD, Funk GD. P2Y1 receptor modulation of the pre-Botzinger complex inspiratory rhythm generating network in vitro. J Neurosci. 2007;27:993–1005. doi: 10.1523/JNEUROSCI.3948-06.2007. [DOI] [PMC free article] [PubMed] [Google Scholar]
- Lorier AR, Lipski J, Housley GD, Greer JJ, Funk GD. ATP sensitivity of preBotzinger complex neurones in neonatal rat in vitro: mechanism underlying a P2 receptor-mediated increase in inspiratory frequency. J Physiol. 2008;586:1429–1446. doi: 10.1113/jphysiol.2007.143024. [DOI] [PMC free article] [PubMed] [Google Scholar]
- Mantilla CB, Sieck GC. Key aspects of phrenic motoneuron and diaphragm muscle development during the perinatal period. J Appl Physiol. 2008;104:1818–1827. doi: 10.1152/japplphysiol.01192.2007. [DOI] [PMC free article] [PubMed] [Google Scholar]
- Mayer CA, Haxhiu MA, Martin RJ, Wilson CG. Adenosine A2A receptors mediate GABAergic inhibition of respiration in immature rats. J Appl Physiol. 2006;100:91–97. doi: 10.1152/japplphysiol.00459.2005. [DOI] [PubMed] [Google Scholar]
- Miles GB, Parkis MA, Lipski J, Funk GD. Modulation of phrenic motoneuron excitability by ATP: consequences for respiratory-related output in vitro. J Appl Physiol. 2002;92:1899–1910. doi: 10.1152/japplphysiol.00475.2001. [DOI] [PubMed] [Google Scholar]
- Mironov SL, Langohr K, Richter DW. A1 adenosine receptors modulate respiratory activity of the neonatal mouse via the cAMP-mediated signaling pathway. J Neurophysiol. 1999;81:247–255. doi: 10.1152/jn.1999.81.1.247. [DOI] [PubMed] [Google Scholar]
- Nörenberg W, Illes P. Neuronal P2X receptors: localisation and functional properties. Naunyn Schmiedebergs Arch Pharmacol. 2000;362:324–339. doi: 10.1007/s002100000311. [DOI] [PubMed] [Google Scholar]
- North RA. Molecular physiology of P2X receptors. Physiol Rev. 2002;82:1013–1067. doi: 10.1152/physrev.00015.2002. [DOI] [PubMed] [Google Scholar]
- Onimaru H, Homma I. Development of the rat respiratory neuron network during the late fetal period. Neurosci Res. 2002;42:209–218. doi: 10.1016/s0168-0102(01)00322-4. [DOI] [PubMed] [Google Scholar]
- Pagliardini S, Ren J, Greer JJ. Ontogeny of the pre-Botzinger complex in perinatal rats. J Neurosci. 2003;23:9575–9584. doi: 10.1523/JNEUROSCI.23-29-09575.2003. [DOI] [PMC free article] [PubMed] [Google Scholar]
- Ralevic V, Burnstock G. Receptors for purines and pyrimidines. Pharmacol Rev. 1998;50:413–492. [PubMed] [Google Scholar]
- Ren J, Greer JJ. Ontogeny of rhythmic motor patterns generated in the embryonic rat spinal cord. J Neurophysiol. 2003;89:1187–1195. doi: 10.1152/jn.00539.2002. [DOI] [PubMed] [Google Scholar]
- Ren J, Momose-Sato Y, Sato K, Greer JJ. Rhythmic neuronal discharge in the medulla and spinal cord of fetal rats in the absence of synaptic transmission. J Neurophysiol. 2006;95:527–534. doi: 10.1152/jn.00735.2005. [DOI] [PubMed] [Google Scholar]
- Ruangkittisakul A, Schwarzacher SW, Secchia L, Poon BY, Ma Y, Funk GD, Ballanyi K. High sensitivity to neuromodulator-activated signaling pathways at physiological [K+] of confocally imaged respiratory center neurons in on-line-calibrated newborn rat brainstem slices. J Neurosci. 2006;26:11870–11880. doi: 10.1523/JNEUROSCI.3357-06.2006. [DOI] [PMC free article] [PubMed] [Google Scholar]
- Schmidt B. Methylxanthine therapy for apnea of prematurity: evaluation of treatment benefits and risks at age 5 years in the international Caffeine for Apnea of Prematurity (CAP) trial. Biol Neonate. 2005;88:208–213. doi: 10.1159/000087584. [DOI] [PubMed] [Google Scholar]
- Schmidt B, Roberts RS, Davis P, Doyle LW, Barrington KJ, Ohlsson A, Solimano A, Tin W. Caffeine therapy for apnea of prematurity. N Engl J Med. 2006;354:2112–2121. doi: 10.1056/NEJMoa054065. [DOI] [PubMed] [Google Scholar]
- Schmidt C, Bellingham MC, Richter DW. Adenosinergic modulation of respiratory neurones and hypoxic responses in the anaesthetized cat. J Physiol. 1995;483:769–781. doi: 10.1113/jphysiol.1995.sp020621. [DOI] [PMC free article] [PubMed] [Google Scholar]
- Smith JC, Morrison DE, Ellenberger HH, Otto MR, Feldman JL. Brainstem projections to the major respiratory neuron populations in the medulla of the cat. J Comp Neurol. 1989;281:69–96. doi: 10.1002/cne.902810107. [DOI] [PubMed] [Google Scholar]
- Smith JC, Ellenberger HH, Ballanyi K, Richter DW, Feldman JL. Pre-Botzinger complex: a brainstem region that may generate respiratory rhythm in mammals. Science. 1991;254:726–729. doi: 10.1126/science.1683005. [DOI] [PMC free article] [PubMed] [Google Scholar]
- Suzue T. Respiratory rhythm generation in the in vitro brain stem-spinal cord preparation of the neonatal rat. J Physiol. 1984;354:173–183. doi: 10.1113/jphysiol.1984.sp015370. [DOI] [PMC free article] [PubMed] [Google Scholar]
- Thoby-Brisson M, Greer JJ. Anatomical and functional development of the pre-Botzinger complex in prenatal rodents. J Appl Physiol. 2008;104:1213–1219. doi: 10.1152/japplphysiol.01061.2007. [DOI] [PubMed] [Google Scholar]
- Tryba AK, Peña F, Ramirez JM. Stabilization of bursting in respiratory pacemaker neurons. J Neurosci. 2003;23:3538–3546. doi: 10.1523/JNEUROSCI.23-08-03538.2003. [DOI] [PMC free article] [PubMed] [Google Scholar]
- Viemari JC, Burnet H, Bévengut M, Hilaire G. Perinatal maturation of the mouse respiratory rhythm-generator: in vivo and in vitro studies. Eur J Neurosci. 2003;17:1233–1244. doi: 10.1046/j.1460-9568.2003.02561.x. [DOI] [PubMed] [Google Scholar]
- von Kügelgen I. Pharmacological profiles of cloned mammalian P2Y-receptor subtypes. Pharmacol Ther. 2006;110:415–432. doi: 10.1016/j.pharmthera.2005.08.014. [DOI] [PubMed] [Google Scholar]
- Wang JL, Wu ZH, Pan BX, Li J. Adenosine A1 receptors modulate the discharge activities of inspiratory and biphasic expiratory neurons in the medial region of Nucleus Retrofacialis of neonatal rat in vitro. Neurosci Lett. 2005;379:27–31. doi: 10.1016/j.neulet.2004.12.042. [DOI] [PubMed] [Google Scholar]
- Yamamoto M, Nishimura M, Kobayashi S, Akiyama Y, Miyamoto K, Kawakami Y. Role of endogenous adenosine in hypoxic ventilatory response in humans: a study with dipyridamole. J Appl Physiol. 1994;76:196–203. doi: 10.1152/jappl.1994.76.1.196. [DOI] [PubMed] [Google Scholar]
- Yao ST, Barden JA, Finkelstein DI, Bennett MR, Lawrence AJ. Comparative study on the distribution patterns of P2X(1)-P2X(6) receptor immunoreactivity in the brainstem of the rat and the common marmoset (Callithrix jacchus): association with catecholamine cell groups. J Comp Neurol. 2000;427:485–507. [PubMed] [Google Scholar]
- Zimmermann H. Extracellular metabolism of ATP and other nucleotides. Naunyn Schmiedebergs Arch Pharmacol. 2000;362:299–309. doi: 10.1007/s002100000309. [DOI] [PubMed] [Google Scholar]
- Zimmermann H. Ectonucleotidases: some recent developments and a note on nomenclature. Drug Dev Res. 2001;52:44–56. [Google Scholar]