

Abstract
In the present study, we investigated the role of Neuroligin 2 (NL2) in synaptic transmission and network function using the mouse retina as a model circuit. We show that NL2 is preferentially located at GABAergic rather than glycinergic or glutamatergic postsynapses. The absence of NL2 from the retina resulted in a severe reduction of GABAA receptor clustering, and in subtle alterations of the retinal circuitry. Light processing was impaired accordingly, and retinal ganglion cells, the output neurons of the retina, showed increased basal activity and altered coding of visual information. Together, our data indicate that NL2 is essential for the functional integrity of GABAergic signaling and as a consequence, for information processing in the retina.
Introduction
Neuroligins (NLs) are ubiquitous postsynaptic transmembrane adhesion proteins. They are present at developing and mature synapses of the CNS and play a pivotal role in synapse organization and function (Chih et al., 2005; Varoqueaux et al., 2006) (for review, see Lisé and El-Husseini, 2006; Craig and Kang, 2007).
Of the four NL isoforms described in rodents (Ichtchenko et al., 1995, 1996; Jamain et al., 2008), NL1 and NL2 have been studied most extensively. NL1 is present at excitatory postsynapses (Song et al., 1999), and its deletion compromises NMDA-receptor-driven neurotransmission (Chubykin et al., 2007). In contrast, NL2 localizes to inhibitory postsynapses in the brain (Varoqueaux et al., 2004). In the forebrain, where GABAergic neurotransmission dominates inhibitory signaling, NL2 deletion specifically impairs evoked inhibitory responses in the barrel cortex (Chubykin et al., 2007). In the brainstem, where GABA and glycine are often coreleased, lack of NL2 leads to deficits in both GABAergic and glycinergic neurotransmission (G. Aramuni and W. Zhang, personal communication). Furthermore, NL2 clusters are detected at very early stages of inhibitory postsynapse differentiation (Varoqueaux et al., 2004; Patrizi et al., 2008), and in vitro studies have suggested that NL2 may contribute to the recruitment of GABAA receptors (Dong et al., 2007). Thus, there is emerging evidence for a central role of NL2 in organizing inhibitory synapse assembly and function.
We chose to investigate the importance of NL2 in synapse function and in shaping information processing in vivo using the retina as a model system. Devoted to the transduction, encoding, and transfer of visual information to higher brain areas, the retina is a highly structured circuit (Boycott and Wässle, 1991, 1999; Masland, 2001a,b; Wässle, 2004), in which a main excitatory, glutamatergic pathway is modulated by inhibitory inputs at two synaptic (plexiform) layers. At the inner synaptic layer, in contrast to other areas of the CNS, GABA and glycine receptors segregate into distinct synapse populations on amacrine, ganglion, and bipolar cells (Fischer et al., 2000). Moreover, the inhibitory scaffold protein gephyrin is preferentially localized at glycinergic postsynapses in the retina and associates with only a subset of GABAA receptor clusters (Sassoè-Pognetto et al., 1995; Sassoè-Pognetto and Wässle, 1997). This unique compartmentalization of gephyrin, GABA, and glycine receptors in the retina provides an interesting framework wherein to explore the role of NL2. The well characterized retinal network is also ideally suited for a detailed anatomical and electrophysiological investigation, and therefore is an optimal system to detect subtle impairments in synapse dysfunction and circuit miswiring.
In the present study, we characterized the distribution of NL2 at retinal synapses. Furthermore, we explored the morphological and functional alterations occurring at the synaptic and network levels in NL2-deficient retina. Our data demonstrate the importance of NL2 for GABAergic but not glycinergic synapse composition and for retinal information processing.
Materials and Methods
All experiments were performed on 8- to 12-week-old adult wild-type (WT) and NL2 deletion-mutant (KO) mice (Varoqueaux et al., 2006), in compliance with the guidelines for the welfare of experimental animals issued by the Federal Government of Germany, the National Institutes of Health, and the Max Planck Society. Functional analyses were performed on male age-matched littermates.
Antibodies.
For immunolabeling, a NL2-specific polyclonal rabbit antibody was used (1:8000) (Varoqueaux et al., 2004). To detect GABA and glycine receptors, polyclonal guinea-pig antibodies against GABAAα1, α2, α3, GABAAγ2 subunits (1:10,000; 1:5000; 1:4000; and 1:2500, respectively) (Fritschy and Mohler, 1995), a polyclonal rabbit antibody against GABAC (1:200; kindly provided by H. Wässle, Max Planck Institute for Brain Research, Frankfurt, Germany) (Wässle et al., 1998), and a monoclonal mouse antibody against all glycine receptor subunits (mAb4a, 1:200, Synaptic Systems) were used.
Specific retinal cell populations, ribbon, and excitatory and inhibitory presynapses or postsynapses were detected with the following antibodies: monoclonal mouse anti-PKCα (1:1000, Biodesign), -Goα (1:1000, Millipore Bioscience Research Reagents), -calbindin (1:2000, Swant), -GAD65 (1:1000, Millipore Bioscience Research Reagents), -bassoon (1:1000, Stressgen), -PSD95 (1:1000, Abcam), and -gephyrin (3B11, 1:1000, Synaptic Systems); polyclonal rabbit anti-glycine transporter1 (1:1000; kindly provided by N.C. Danbolt, University of Oslo, Oslo, Norway), -piccolo (1:1000, Synaptic Systems), -synapsin (1:2000, Synaptic Systems), or guinea pig anti-VGLUT1 (1:2000, Millipore Bioscience Research Reagents).
For Western blot analysis, selected antibodies were used at the following concentrations: monoclonal mouse antibodies against NL1 (4C12, 1:4000), glycine receptors (mAb4a, 1:2000, Synaptic Systems), gephyrin (3B11, 1:30,000, Synaptic Systems), and actin (1:10,000, Sigma); polyclonal rabbit antibodies against NL2 (1:500), GABAAγ2 (1:500, Abcam), and glycine transporter1 (1:5000).
Immunofluorescence.
The animals were deeply anesthetized with isofluran (DeltaSelect) and decapitated. The eyes were quickly removed, the lens dissected out, and the eyecups immersed in 2% paraformaldehyde in 0.1 m phosphate buffer (PB), pH 7.4, for 20 min. Alternatively, the fixation time was reduced to 5 min for GABA and glycine receptors labeling. After fixation, the eyecups were rinsed in PB, and the retinas isolated and cryoprotected overnight in 30% sucrose in PB. Alternating pieces of WT and KO retinas were frozen on top of each other in tissue-freezing medium (Leica). These “retina sandwiches” were then sectioned vertically at 14 μm at the cryostat (Greferath et al., 1995).
For immunohistochemistry, sections were preincubated in PB containing 0.2% gelatin and 0.1% Triton X-100 (PGT), and incubated overnight in primary antibodies in PGT followed by a 1 h incubation in secondary antibodies conjugated to either Alexa-488 or Alexa-555 (1:2000, Invitrogen) in PGT. Fluorescein-peanut agglutinin (PNA; Vector) was used at a concentration of 5 mg/ml.
Electron microscopy.
For photoreceptor quantification, animals were perfused with 2% paraformaldehyde, 2.5% glutaraldehyde, and 0.3% tannic acid in PB. The retinas were isolated, washed, osmicated for 1 h (1% OsO4 in PB), dehydrated through graded series of ethanol and propylene oxide, and embedded in Durcupan (ACM, Fluka). Semithin (500 nm) sections were stained with methylene blue.
Postembedding immunolabeling was performed following the procedure described by Matsubara et al. (1996) with minor changes. Briefly, retinas were prepared by freeze substitution and low-temperature embedding in Lowicryl HM20. Ultrathin sections (70–90 nm) were incubated overnight with the polyclonal rabbit anti-NL2 antibody in Tris-buffered saline–Triton X-100 (TBST) containing 0.1% BSAc (acetylated BSA; Aurion). Secondary goat anti-rabbit IgG coupled to 10 nm gold (Aurion) was used at a dilution of 1:20 in TBST containing 1% BSA and polyethyleneglycol (5 mg/ml, 2 h). The sections were then contrasted with uranyl acetate and lead citrate and observed in a LEO 912AB transmission electron microscope (Zeiss). Digital images were taken using a ProScan charge-coupled device camera and analyzed with the AnalySIS software (Olympus).
Imaging and quantification.
Immunofluorescent sections were viewed with an inverted confocal laser scanning microscope (LSM 510, Zeiss). All images were acquired as single optical slices with a 40× water-immersion objective (numerical aperture, 1.2) and a digital zoom of 4.5 for quantification. During acquisition, gain and offset were kept constant for a given labeling to allow for intensity comparisons between images. Images were further processed with AnalySIS. They were smoothened with an open filter and objects (i.e., fluorescent clusters, corresponding to synaptic puncta) were isolated after application of a separation filter. In a selected region of interest (ROI) covering the entire width of the inner plexiform layer (IPL), the number, size, gray value (minimum, maximum, mean), and integral intensity of all objects above an intensity threshold designated as background (set to a gray value of 50) and maintained constant for all images were measured. For colocalization studies, ROIs were drawn for each fluorescent puncta in a given channel, superimposed on the complementary channel, and the number of colocalized puncta was determined manually (Fletcher et al., 1998). For photoreceptor quantification, semithin sections were observed with an upright Olympus BX-61 light microscope with a 20× objective, and images were acquired with a black and white digital camera (F-ViewII) and analyzed with AnalySIS. The number of photoreceptors was determined by touch-count of photoreceptor nuclei in retina stretches of comparable widths. For immunogold quantification, the number of gold particles at the synapse and the distance between the center of the gold particles and the center of the synapse was measured.
Western blot.
Retinas from adult littermate mice (20 mice, pooled into n = 5 × 2 WT and n = 5 × 2 KO) were prepared on ice and homogenized in 320 mm sucrose containing a protease inhibitors cocktail. The protein concentration was adjusted to 2 mg/ml. Samples (20 μl per lane) were run by SDS-PAGE, blotted onto nitrocellulose membranes, incubated with antibodies, and visualized with ECL. Each blot was stained in parallel for actin as a reference protein.
Electroretinogram recordings.
Mice were dark adapted overnight, anesthetized by intraperitoneal injection of ketamine (125 μg/g) and xylazine (2.5 μg/g), and one pupil was dilated with 1% atropine sulfate. Surgery and subsequent handling were done under dim red light. A moistened ring-like AgCl-wire-electrode was placed on the cornea, a needle reference electrode was inserted subcutaneously above the nose, and a ground electrode into the tail. A full-field illumination [25 white light-emitting diodes (LEDs)] was used to produce light flashes of incremental calibrated intensities (0.0002–14 cds/m2; Mavolux, IPL 10530). Scotopic responses were recorded for three different stimulus durations (0.1, 1, and 5 ms) with an interstimulus interval of 5 s (<1 cds/m2) or 17 s (>1 cds/m2) (Seeliger et al., 2001). The mice (WT, n = 5; KO, n = 4) were then light adapted for 10 min using a background illumination of 30 cds/m2 and kept constant for recording photopic responses using the aforementioned stimulus paradigm. Recorded potentials were amplified, filtered (bandpass: 400–4000 Hz), and sampled at a rate of 24 kHz. Ten responses were averaged per light intensity. For analysis, amplitudes of the a-wave were measured relative to the baseline, whereas the b-wave amplitudes were estimated relative to the trough of the a-wave. Oscillatory potentials were sorted using a 30 Hz high-pass filter and the peak-to-peak amplitudes were assessed. Latencies of the a- and b-waves were determined as the temporal difference between light onset and time of peak. All data were analyzed using the MATLAB software.
Multielectrode array recordings.
Recordings were performed using 200/30 multielectrode arrays (MEAs; 60 electrodes, 30 μm diameter, 200 μm spacing, 8 × 8 grid) and the MEA60BC amplifier (Multi Channel Systems). Retinas were quickly dissected under dim red light and kept in oxygenated artificial CSF at 37°C, containing in mm: NaCl 125, KCl 2.5, CaCl2 2, MgCl2 1, NaHCO2 26, Na3PO4 1.25, glucose 25, equilibrated with 95% O2 and 5% CO2. For recordings, retinas were placed with the ganglion cell layer facing the MEA. Potentials were digitized at 10 kHz and high-pass filtered at 100 Hz. To limit files size, 3 ms spike cutouts were saved every time a threshold of −10 μV was crossed. These spike cutouts were sorted off-line into individual units using Off-line Sorter 2 (Plexon). Light stimuli were delivered by a green LED placed at the camera port of an inverted microscope (BX-51, Olympus) triggered by a STG1004 stimulus generator and MC-Stimulus 2.0 (Multi Channel Systems). Either an ON/OFF stimulus, consisting of a 1 s light pulse every 3 s, or a 10-s-long “white noise” stimulus was delivered 200 times. The latter stimulus was generated by randomly assigning values of 0 or 1 to 30 ms bins (sdev/avg = 0.97). The trigger signal (light on or off) was recorded together with the action potentials and used to calculate the spike-triggered average (STA) stimulus for each recorded cell. For the 1 s light stimulus, perievent histograms (10 ms bins) were calculated by Neuroexplorer 3 (NEX Technologies) and expressed either in spikes per second (in Hertz) or in percentage of all spikes. Subsequent analysis and illustrations were performed using IGOR Pro 5.03 (Wavemetrics). To determine amplitudes and latencies, perievent histograms were smoothed by convolution with a Gaussian (σ 30 ms) as described previously (Nirenberg and Meister, 1997). Cells were classified manually as “ON,” “OFF,” or “ON-OFF” blinded for genotype. STAs were calculated and analyzed in IGOR. Classification of response traces as monophasic or biphasic and having a predominant positive or negative peak was performed manually and blinded for genotype. Statistical analyses were performed with JMP 5 (SAS Institute) and Graph Pad Prism 4. Graphs represent mean ± SEM. p values were derived from t tests in Figure 6 and from two-way ANOVA in supplemental Figures 4, 5, available at www.jneurosci.org as supplemental material.
Figure 6.

Lack of NL2 leads to altered retinal ganglion cell activity. A–G, Action potential firing of retinal ganglion cells was recorded in response to a 1 s light pulse (A–C) or a flickering “white noise” stimulus (D–G) using multielectrode arrays. A, Example responses to light of an “ON” type (left) and an “OFF” type (right) ganglion cell. B, Frequency of action potentials during the second preceding light onset (“baseline”) from WT and NL2 KO retina patches. C, Amplitude of the “ON” response expressed as percentage of all spikes. D, Example STA with a predominant positive (left), respectively negative (right) peak. E, Maximum distance from 0.5 reached by STA in WT versus KO ganglion cells. F, Peak-to-peak amplitude for biphasic STA. G, Latency of the predominant peak from E. **p < 0.01, ***p < 0.001.
Results
NL2 is preferentially localized to GABAA receptor-containing synapses in the retina
The distribution of NL2 in the retina was assessed by immunostaining with an isoform-specific antibody (Fig. 1; supplemental Fig. 1A,B, available at www.jneurosci.org as supplemental material, for antibody characterization), which yielded an abundant punctate labeling throughout the outer plexiform layer (OPL) and IPL (supplemental Fig. 1B, available at www.jneurosci.org as supplemental material). A series of colocalization experiments with landmark postsynaptic receptor and scaffold proteins was performed to assess whether NL2 is specifically segregated to certain synaptic subtypes in the retina (Fig. 1). We found that NL2 never colocalized with the ubiquitous excitatory scaffold protein PSD-95 (Fig. 1B,E), demonstrating its general absence from glutamatergic postsynaptic sites.
Figure 1.
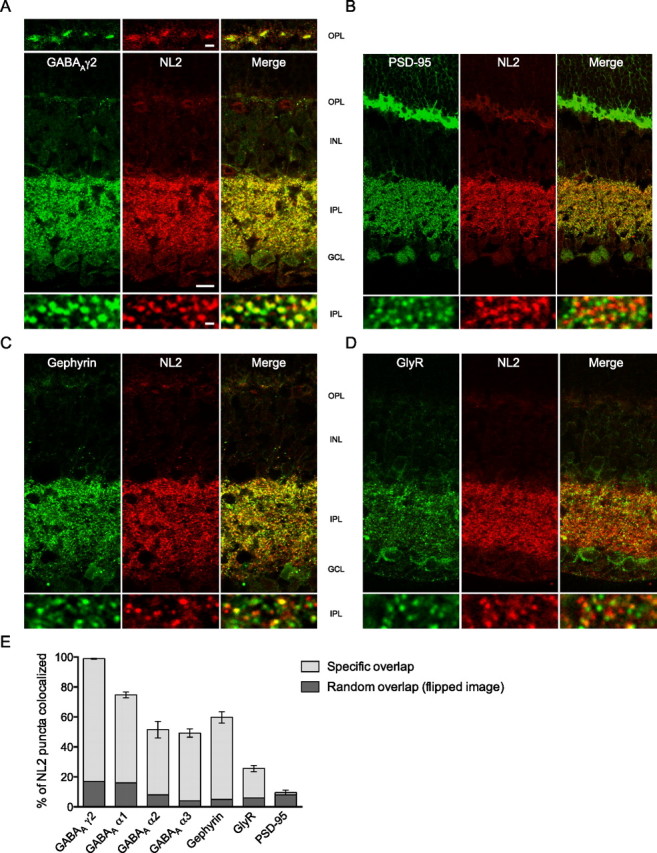
NL2 is confined to GABAergic postsynapses in the mouse retina. A–E, During colabeling of NL2 with the γ2 subunit of GABAA receptors (A), PSD-95 (B), gephyrin (C), and glycine receptors (GlyR, D), it appeared that NL2 clusters most extensively codistributed with GABAA receptors (as quantified in E, n = 5 mice). In contrast, NL2 overlap was partial with gephyrin (C, E), minimal with glycine receptors (D, E), and negligible with PSD-95 (B, E). INL, Inner nuclear layer; GCL, ganglion cell layer. Scale bars: Overview, 10 μm; detail (in OPL panel), 1.5 μm, (in IPL panel) 0.6 μm.
In the retina, inhibition is mediated by GABAergic horizontal cells at the OPL, and by GABAergic and glycinergic amacrine neurons at the IPL. Their processes contact postsynaptic specializations that bear segregated populations of GABAA and glycine receptors, respectively. GABAC receptors are also found, which cluster mainly at bipolar axon terminals (Wässle et al., 1998). Multiple GABAA receptor subtypes have been described; eight GABAA receptor subunits (α1–3; β1–3; γ2 and δ) are expressed in various combination and are distributed within characteristic strata of the IPL (Greferath et al., 1995). The GABAAγ2 subunit is the core component of the vast majority of GABAA receptors in the retina as is the case in the brain (Fritschy and Mohler, 1995; Wässle et al., 1998). We found that virtually all NL2 puncta were also positive for GABAAγ2 at both the OPL and IPL (Fig. 1A,E), indicating that NL2 is associated preferentially with GABAergic postsynaptic specializations. The presence of NL2 at inhibitory, symmetric synapses of the IPL was independently confirmed at the ultrastructural level by postembedding immunogold labeling (Fig. 2A–C). The tangential distribution of NL2-related gold particles within 100 nm from the center of the postsynaptic membrane (Fig. 2A–C) resembles the distribution pattern of GABAA receptor subunits in other brain regions (Panzanelli et al., 2004).
Figure 2.
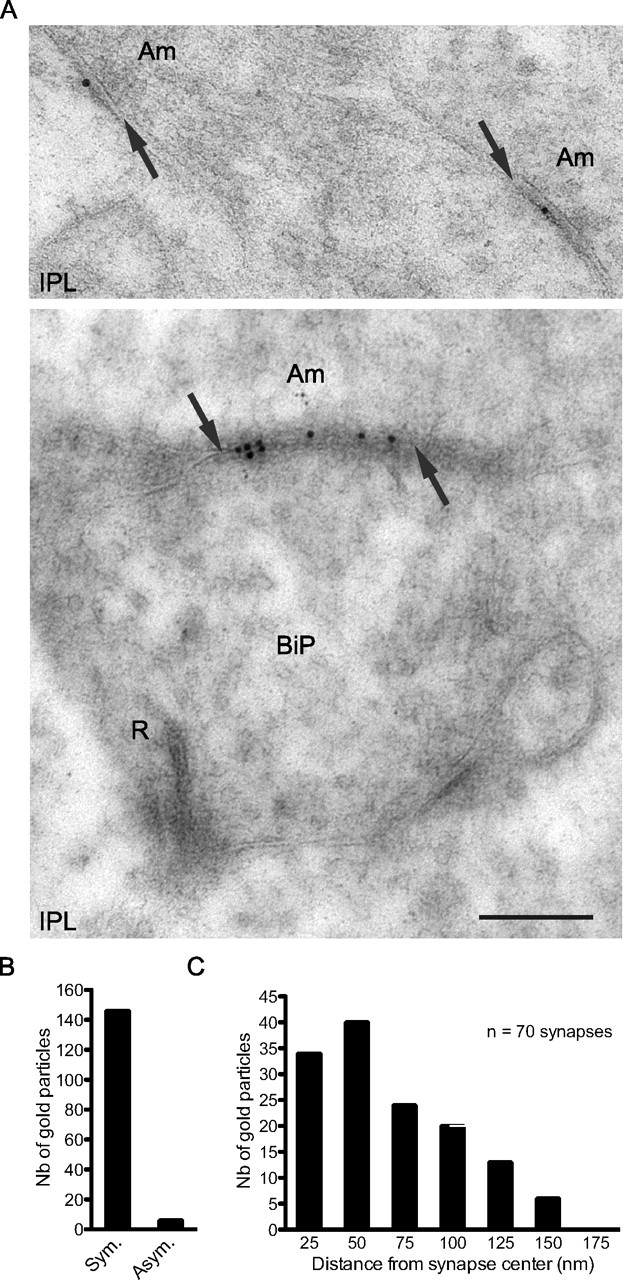
Ultrastructural analysis of NL2 distribution at the IPL. A, During postembedding immunolabeling, gold particles corresponding to NL2 were repeatedly observed at symmetric, inhibitory synapses (arrows) of the IPL, formed by amacrine cells processes (Am). In particular, they were abundant at amacrine-to-bipolar symmetric contacts but were excluded from excitatory ribbon synapses (R) formed by bipolar cell terminals (BiP, lower panel). B, C, During quantification, gold particles showed a preferential association with symmetric contacts (B), where they spread tangentially from the center of the synapse (C). Scale bar, 500 nm. Sym., Symmetric; Asym., asymmetric.
Conversely, only half of NL2-positive puncta at the IPL were also positive for the inhibitory scaffold protein gephyrin (Fig. 1C,E), suggesting that NL2 does not associate with all inhibitory postsynapses. In turn, 45% of gephyrin clusters colocalized with NL2 (supplemental Fig. 2D, available at www.jneurosci.org as supplemental material). In the retina, gephyrin has been shown to mediate the clustering of all glycine receptors (Fischer et al., 2000) and to associate with approximately two-thirds of GABAA receptor clusters, depending on their composition (Sassoè-Pognetto et al., 1995). This observation prompted us to examine the extent of colocalization of NL2 with glycine receptors. Indeed, NL2 was present only in a minor fraction of glycinergic postsynapses that were detected with an antibody recognizing both α and β subunits (mAb4a) (Kirsch and Betz, 1993) (supplemental Fig. 2D, available at www.jneurosci.org as supplemental material); only 19% of NL2-positive puncta were mAb4a-positive (Fig. 1D,E).
In summary, the above results indicate that NL2 is specifically present at GABAergic synapses in the retina. However, not all GABAergic synapses were NL2 positive, as only two-thirds of GABAAγ2 puncta associated with NL2 (supplemental Fig. 2D, available at www.jneurosci.org as supplemental material). We therefore considered the possibility that NL2 may preferentially associate with specific subsets of inhibitory GABAergic synapses, which can be identified by immunolabeling for GABAA α1, α2, or α3 subunits (Koulen et al., 1996). NL2 colocalized quite extensively with GABAA α1 (58% of NL2 puncta) (Fig. 1E; supplemental Fig. 2A, available at www.jneurosci.org as supplemental material), but also significantly with GABAA α2 (43%) (Fig. 1E; supplemental Fig. 2B, available at www.jneurosci.org as supplemental material) and GABAA α3 (45%) (Fig. 1E; supplemental Fig. 2C, available at www.jneurosci.org as supplemental material) clusters. Overall, these findings show that NL2 function is not limited to a specific subset of GABAergic synapses.
NL2 deficiency does not affect the core architecture of the retina
The relay between amacrine and ganglion cells constitutes the first functional synaptic circuit in the retina and is key to establishing proper retinal connectivity (Mumm et al., 2005). GABAA receptors are important components of this circuitry and modulate network excitability in the developing retina (Wang et al., 2007). Previous studies in the brain have shown NL2 to be present at the earliest stages of synapse development and to be required for early synapse maturation (Graf et al., 2004; Varoqueaux et al., 2006; Chubykin et al., 2007). Therefore, we examined whether the deletion of NL2 affects the organization of the mature retinal circuitry, by comparing the abundance of major cell and synapse populations in KO and WT retinas.
We found that the entire width of the retina (Fig. 3) and the relative sizes of nuclear and synaptic (plexiform) layers were comparable in KO and WT samples (Fig. 3) (outer nuclear layer/total: WT: 0.321 ± 0.024, n = 4; KO: 0.324 ± 0.024, n = 5), indicative of a normal overall development of the retina in the absence of NL2. Furthermore, the number of photoreceptors as determined on semithin sections were comparable in WT and KO (WT: 191 ± 17 per 100 μm length, n = 4; KO: 197 ± 13 per 100 μm length, n = 5). The integrity of photoreceptor connectivity in the OPL was examined by labeling for bassoon [a marker of rod and cone ribbon synapses (Brandstätter et al., 1999)], peanut agglutinin [PNA; specific for cone pedicles (Haverkamp et al., 2001)], Goα [specific for rod and ON-cone bipolar cells (Vardi, 1998)], and calbindin [a marker of horizontal cells (Peichl and González-Soriano, 1994)] (Fig. 3A). Together, these markers indicated that the number and spread of photoreceptor synapses was normal and that horizontal and bipolar arborizations were maintained in the NL2 KO. Thus, the OPL organization is preserved in the absence of NL2.
Figure 3.
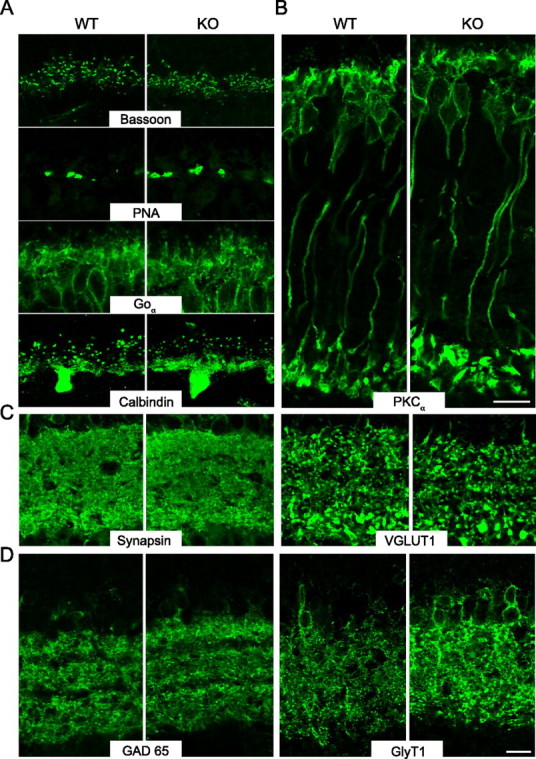
In the absence of NL2, the retina is well formed but displays increased levels of the glycinergic amacrine marker GlyT1. A, In WT and NL2 KO retinas, the comparison of labelings for bassoon, PNA, Goα, and calbindin reflected the intact number and connectivity of photoreceptor and horizontal cells at the NL2 KO OPL. B, Likewise, rod-bipolar cells labeled by PKCα testified of the intact retinal architecture in the absence of NL2. C, At the IPL, staining for synapsin and VGLUT1 showed a normal distribution and density of synapses. D, GABAergic amacrine cells as labeled by GAD65 showed intact lamination profile in the NL2 KO retinas; however, labeling for GlyT1, a marker of glycinergic amacrine cells was brighter and more spread-out in the NL2 deficient retina. Scale bar, 10 μm.
Rod bipolar cells, which are central to dim light vision, were identified by PKCα labeling (Haverkamp and Wässle, 2000), and no changes were observed in their number or lamination in the NL2 deficient retina (Fig. 3B). Similarly, in the IPL, conventional and bipolar ribbon synapses [respectively labeled with synapsin (Mandell et al., 1992), and VGLUT1 (Johnson et al., 2003)] were present at normal densities (Fig. 3C).
Finally, wide-field GABAergic and small-field glycinergic amacrine cells, responsible for inhibition in the IPL (Pourcho and Goebel, 1985; Pow and Hendrickson, 1999), were stained for glutamic acid decarboxylase (GAD) 65 and 67 (Vardi and Auerbach, 1995; Haverkamp and Wässle, 2000) and the glycine transporter GlyT1 (Zafra et al., 1995; Menger et al., 1998; Pow and Hendrickson, 1999), respectively. The arborization and lamination profile of GABAergic cells was unaltered in the NL2 KO retina (GAD 65) (Fig. 3D) (GAD 67 showed similar results). In contrast, fluorescence intensities for GlyT1, which can be reliably compared between samples in the chosen experimental paradigm (Greferath et al., 1995) (see Materials and Methods), were higher throughout all KO samples observed (Figs. 3D, 4C) and distributed over a larger surface of the IPL in the KO compared with control (WT: 24.84 ± 4.8 μm2/100 μm2, n = 5; KO: 47.55 ± 6.18 μm2/100 μm2, n = 5; p = 0.023), indicating elevated levels of GlyT1 in the NL2 KO retina. Consistently, Western blot analysis uncovered slightly increased levels of GlyT1 in the NL2 deficient retina (supplemental Fig. 3, available at www.jneurosci.org as supplemental material).
Figure 4.

GABAA receptor clustering is altered in the NL2-deficient retina. A–C, Representative single-plane confocal micrographs (A), numbers (B), and fluorescence intensity histograms (C) of puncta immunoreactive for gephyrin, glycine receptors, and GABAA α1, α3, or γ2 receptor subunits in the IPL of WT and NL2-deficient retinas (n > 6 mice). Whereas gephyrin and glycine receptor (GlyR) clusters distributed normally, GABAA γ2 and GABAA α3 receptors subunits immunoreactive puncta were far less abundant in the NL2 KO retina. GABAAα1 clusters appeared fainter, albeit present in normal amount. Of note, GlyT1 labeling was dimmer in the WT as in the NL2 KO, as represented by the high occurrence of low-intensity values (see also Fig. 3D). Scale bar, 10 μm. *p < 0.05.
Thus, the absence of NL2 did not compromise the accurate formation of the basic cellular and synaptic architecture of the adult retina. However, it yielded altered intensity and distribution of the glycinergic amacrine marker GlyT1. This finding was unexpected given the copartitioning of NL2 with GABAA (and not glycine) receptors, and might reflect subtle homeostatic rearrangements within the retinal circuitry. We went on to characterize the composition of inhibitory postsynaptic elements in the NL2 deficient retina.
Lack of NL2 results in a specific reduction of GABAA receptor clustering
The distribution patterns of gephyrin, GABA, and glycine receptors were compared in NL2 KO and WT retinas by quantifying both numbers and fluorescence intensities of immunolabeled puncta (Fig. 4A–C); total protein expression levels were also determined in retina homogenates (supplemental Fig. 3, available at www.jneurosci.org as supplemental material).
We first evaluated the distribution of the GABAA γ2 subunit of GABAA receptors, which largely colocalized with NL2 in WT retina (Fig. 1). The number of GABAA γ2-immunoreactive puncta was drastically decreased and the expression level of the GABAA γ2 subunit reduced in the absence of NL2 (Fig. 4A,B; supplemental Fig. 3, available at www.jneurosci.org as supplemental material). Because the GABAA γ2 subunit has been shown to confer GABAA receptors their functional properties (Essrich et al., 1998; Moss and Smart, 2001; Alldred et al., 2005), this result indicates a reduced number of functional GABAA receptors in the NL2 deficient retina. GABAA α3 clusters were also significantly reduced in numbers (Fig. 4A,B). In contrast, GABAA α1 clusters were detected in normal numbers (Fig. 4A,B), but were markedly dimmer in the KO retina than in the WT (Fig. 4C). The average number of GABAC receptor puncta also tended to be lower in KO retina (Fig. 4B), but the difference did not reach statistical significance. In summary, NL2 colocalized with GABAA receptors in WT retina, and NL2 deficiency decreased the abundance of specific populations of GABAA receptors.
Next, we examined the distribution of gephyrin, which only partially colocalized with NL2 in WT retina (Fig. 1). Neither the number, distribution, nor intensity of gephyrin clusters varied noticeably in the NL2 mutant retina (Fig. 4A–C).
We then tested the levels of glycine receptors, a minor fraction of which colocalized with NL2. Glycine receptor clusters did not vary in number, fluorescence intensity, distribution, or expression levels (Fig. 4A–C; supplemental Fig. 3, available at www.jneurosci.org as supplemental material). In summary, we conclude that NL2 is required for the integrity of GABAA receptors but not glycine receptors. We went on to investigate whether the reported alterations would entail functional consequences on retinal processing of visual stimuli.
Lack of NL2 induces slight alterations of light processing at the inner plexiform layer
Both rod-dependent (dark-adapted) and cone-dependent (light-adapted) visions were tested in anesthetized NL2 KO and WT mice by recording electroretinograms (ERGs) using a standard illumination paradigm [interstimulus interval (ISI) of 5 s for light flashes <1 cds/m2, ISI of 17 s for light flashes >1 cds/m2]. ERGs reflect global electrical responses of the retina to a series of light flashes of increasing intensities. We analyzed the three main signal components: the a-wave, corresponding to the ionic currents generated by photoreceptor cells, the b-wave, reflecting primarily the activity of ON bipolar cells, and the oscillatory potentials, thought to be generated by the combined activity of glycinergic amacrine cells in the IPL.
Responses were unaltered in dark-adapted NL2 KO mice compared with WT (Fig. 5A,B). The amplitudes and latencies of the a- and b-waves and the frequency of the oscillatory potentials were similar in NL2 KO and WT animals across the range of light intensities applied. The integrity of the a- and b-waves correlates well with the normal number of photoreceptors and ON-bipolar cells observed morphologically, and indicates normal transmission along the main excitatory pathway (Fig. 3). The oscillatory potentials showed a tendency toward smaller amplitudes at the strongest light intensities tested, although without reaching statistical significance (Fig. 5B). This may indicate a subtle impairment of amacrine cell activity at the IPL and could reflect the inhibitory circuit-related alterations of GABAA receptors clustering and GlyT1 distribution observed morphologically (Figs. 3, 4). To test whether NL2 deficiency translated into alterations of retinal output, we next recorded the spiking activity of ganglion cells.
Figure 5.
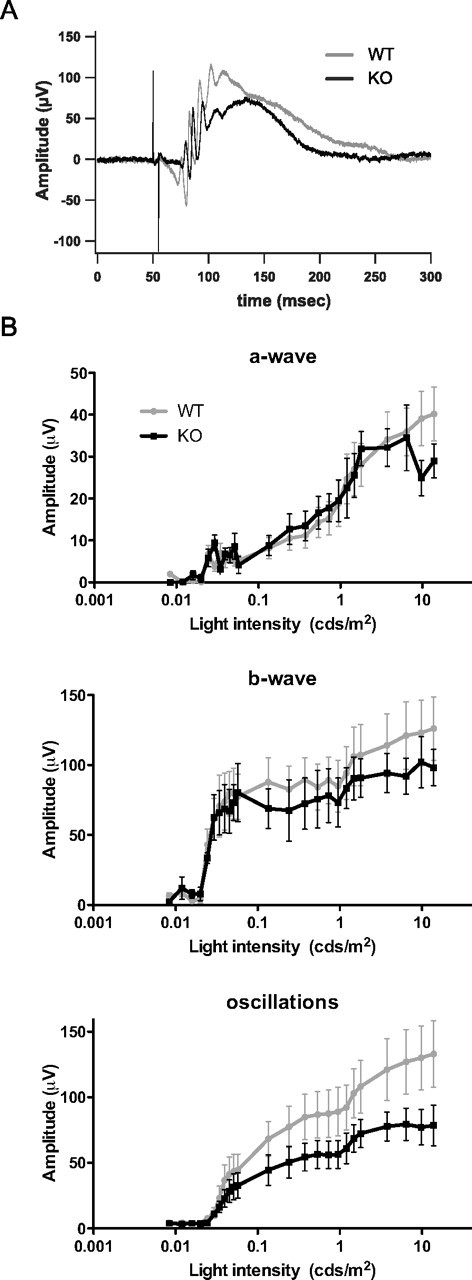
Global retinal activity in the absence of NL2. Dark adapted ERG recordings were performed in WT (n = 5) and NL2 KO (n = 4) mice, during which light flashes were delivered with 5–17 s ISI. A, Representative ERG traces obtained during application of a 5-ms-long, 0.295 cds/m2 stimulus. B, Amplitudes of the a-wave, b-wave, and oscillatory potentials plotted as a function of increasing light stimulus intensities. The amplitudes of the a- and b-wave remained intact in NL2 KO mice compared with WT. Oscillatory potentials, however, showed reduced amplitude in the NL2 KO mice at higher light intensities.
Ganglion cells in NL2-deficient retina show increased baseline firing rate and impaired responses to light onset
Action potential firing of individual retinal ganglion cells was recorded in retina patches using MEAs (Sakai and Naka, 1992; Berry et al., 1997; Chichilnisky, 2001; Chichilnisky and Kalmar, 2002; Fairhall et al., 2006). Neurons were classified as ON, OFF, or ON-OFF cells based on their response to a 1 s light stimulus (Fig. 6A) (WT, n = 350; KO, n = 366 cells). No significant differences in the relative occurrences of ON, OFF, and ON-OFF cells were observed between retina patches from WT and NL2-deficient animals (supplemental Fig. 4A, available at www.jneurosci.org as supplemental material), indicating that NL2 deficiency did not lead to the loss of either of these pathways. Baseline activity (action potentials per second during the second preceding light onset) was significantly increased in cells from NL2-deficient animals (Fig. 6B), whereas the maximum absolute firing rate during light stimulation (supplemental Fig. 4E,H, available at www.jneurosci.org as supplemental material) was similar between WT and KO ganglion cells. The difference in baseline activity was most pronounced in ON-type ganglion cells (supplemental Fig. 4B, available at www.jneurosci.org as supplemental material) and is consistent with a GABAergic deficit. For neurons receiving information from retinal ganglion cells, the distribution of spikes over time (and in relation to the stimulus) is more important than the overall number of spikes in a given time period. We therefore scaled each light response to the total number of spikes recorded from a given cell. With this normalization, the amplitude of light responses was significantly reduced in KO cells (Fig. 6C). Again, this effect was most pronounced in ON-type ganglion cells, and a higher percentage of spikes was fired during baseline (supplemental Fig. 4C,D, available at www.jneurosci.org as supplemental material). The amplitude after light offset was unaltered (supplemental Fig. 4G,H, available at www.jneurosci.org as supplemental material), as were the latencies of light responses (supplemental Fig. 4F,J, available at www.jneurosci.org as supplemental material). Together, these observations suggest that in retinal ganglion cells from NL2-deficient animals, an increased baseline activity impairs the coding of light stimuli.
As retinal ganglion cells rapidly desensitized in the course of the application of the 1-s-long light stimulus (Fig. 6A), we next used a pseudo-random flickering (“white noise”) stimulus to better assay their dynamic properties. White noise analysis has been used quite extensively to study the visual system (Sakai and Naka, 1992; Chichilnisky and Baylor, 1999; Chichilnisky and Kalmar, 2002; Fairhall et al., 2006). For each neuron, the 500 ms of stimulus preceding each action potential were averaged (0 representing light off, 1 representing light on). This STA is regarded as the “typical” stimulus that evokes an action potential, or as the information carried by an average action potential. We therefore measured for each STA the distance of the most prominent peak from its theoretical average of 0.5 and its latency (Fig. 6D).
Many more cells responded to the white noise stimulus than did to the 1 s light pulse (WT, n = 553; KO, n = 634 cells). STA peak amplitudes were significantly smaller in NL2-deficient retinas (less distant to 0.5) (Fig. 6E). Peak-to-peak amplitudes of biphasic STA were also smaller (Fig. 6F), indicating that the average information carried by a ganglion cell action potential was reduced in NL2-deficient animals. This is consistent with the increased baseline activity and the decreased amplitude in response to the 1 s stimulus (Fig. 6B,C).
The latencies of peaks in the STA were also significantly shorter in NL2-deficient animals (Fig. 6G), as were the latencies of the inflection point (point of the steepest slope) in biphasic STA (supplemental Fig. 5E, available at www.jneurosci.org as supplemental material). Shortened latencies can be a sign of increased neuronal excitability, and thus are in line with a GABAergic deficit. Separately analyzing monophasic versus biphasic STA, and STA with primarily positive-going versus negative-going peaks yielded similar results (supplemental Fig. 5, available at www.jneurosci.org as supplemental material).
Taking these results together, we observed in retinal ganglion cells from NL2 KO animals an increased rate of basal action potential firing, decreased latencies in the STA, and decreased amplitudes of responses to light stimuli. We consider these changes in coding visual stimuli to be the functional correlate of the GABAergic deficit seen in morphological studies.
Discussion
NLs are ubiquitous postsynaptic adhesion proteins involved in synapse formation and function (for review, see Lisé and El-Husseini, 2006; Craig and Kang, 2007). NL2 in particular is ubiquitously present at inhibitory synapses in the brain (Varoqueaux et al., 2004), and there is emerging evidence for a central role of NL2 in their organization and function (Chubykin et al., 2007; Dong et al., 2007; Patrizi et al., 2008). To dissect the interactions of NL2 at the synapse, and also to determine its role in establishing synaptic connectivity and regulating network performance, we chose the retina as a well established model-system.
In this work, we show that NL2 is present at GABAergic, but not at glycinergic synapses in the retina. Furthermore, we demonstrate that the lack of NL2 led to a reduced clustering of GABAA receptors at inhibitory synapses of the IPL, and functionally translated into impaired visual signal processing and ganglion cells spiking. These changes were accompanied by subtle alterations in GlyT1 levels, a marker of the glycinergic amacrine pathway. Hence, we show that NL2 is crucial for maintaining the stability and functional integrity of GABAergic postsynapses and important for information processing in the retina.
GABA receptors
Quite uniquely throughout the CNS, inhibitory transmission in the retina is mediated to similar extents by glycinergic and GABAergic amacrine cells. The specificity of NL2 for GABAA receptor- but not glycine receptor-bearing synapses unraveled herein suggests a preferential link between NL2 and GABAA at the inhibitory postsynaptic apparatus. In particular, we show that the absence of NL2 resulted in impaired clustering of γ2-containing GABAA receptors. This core subunit is ubiquitous to synaptic GABAA receptors and essential to their functional integrity (Schweizer et al., 2003). Residual γ2 clusters observed during NL2 deletion likely correspond to the fraction of GABAA receptor clusters that did not associate with NL2. They might represent nonsynaptic clusters or associate with other NL isoforms, possibly NL3, which has been reported at inhibitory synapses in cultured hippocampal neurons (Budreck and Scheiffele, 2007). The alteration of clustering differed among the specific GABAA α subunits, because α1 clusters were reduced in size, α2 clusters were unaltered, and α3 clusters were reduced in numbers.
Overall, we conclude that NL2 is a specific organizer of the GABAA receptor complement and crucial for the proper clustering/stabilization of receptors in the retina. The interaction between NL2 and GABAA receptors has also been suggested in a previous study in vitro (Dong et al., 2007). The tangential distribution of NL2 at inhibitory synapses observed herein at the ultrastructural level is compatible with such a scenario. Interestingly, NL2 distribution is intact at inhibitory synapses in the GABAA α1 KO mouse (Patrizi et al., 2008), placing NL2 upstream of GABA receptor clustering in the chain of events underlying inhibitory synapse formation and maintenance.
NL2 also interacts with gephyrin (A. Poulopoulos, N. Brose, and F. Varoqueaux, pesonal communications). However, the lack of a preferential association of NL2 and gephyrin in the retina suggests that NL2 may act independently of gephyrin at the GABAergic postsynapse. Consistently, absence of gephyrin in the retina disrupts the clustering of all glycine receptors but only half of GABAA γ2 receptors (Fischer et al., 2000).
Glycinergic synapses
Glycine receptors associated infrequently with NL2. Accordingly, they were not altered in numbers, distribution, or composition after NL2 deletion. It will be interesting in the future to address whether they may associate with other NL isoforms.
Interestingly, we observed an increased expression of the glycine transporter GlyT1, which provide glycinergic amacrine cells with a high affinity uptake system for glycine (Pourcho and Goebel, 1985; Wässle et al., 1986). In the retina, glycine and GABA inhibitory networks develop in parallel (Kerschensteiner and Wong, 2008) and have been attributed specific roles. Glycinergic transmission likely mediates vertical inhibition (Wässle, 2004) and shapes the temporal properties of ganglion cells (O'Brien et al., 2003), whereas GABAergic transmission likely mediates lateral surround inhibition (Wässle, 2004; Majumdar et al., 2007) and shapes the spatial properties of ganglion cells (Dong and Werblin, 1998). The observed alteration in GlyT1 expression might reflect some adaptive remodeling of the retinal network, resulting indirectly from the NL2 loss and/or the GABAergic network deficit. Further experiments will be required to determine whether these alterations might reflect an increased dendritic coverage by glycinergic amacrine cells, and to evaluate whether these might also contribute to the functional deficits observed.
Functional consequences of NL2 deficiency
Both ERG and MEA recordings indicated a significant role of NL2 in retinal information processing.
The net electrical activity of the retina was assayed by ERG recordings. ERG traces of NL2 KO were normal and comparable to WT age-matched littermates (for both the a- and b-waves). This indicates the absence of unspecific developmental or degenerative defects in NL2 KO mice. It also confirms that the main excitatory pathway (phototransduction and signal transmission to the bipolar dendrites) operates normally in the absence of NL2. In contrast, we observed a subtle impairment in the amplitude of oscillatory potentials in the NL2 KO mice. At the IPL, inhibitory feedback loops (involving bipolar terminals, amacrine processes, and ganglion cell dendrites) contribute to the generation of these potentials (Wachtmeister, 1998). In particular, pharmacological disruption of GABA-mediated pathways selectively abolishes oscillations in the mudpuppy retina (Wachtmeister and Dowling, 1978; Wachtmeister, 1980). Consequently, it is likely that NL2-dependent alteration of oscillatory potentials relates to the deficit in GABAA receptor clustering observed at the IPL. The absence of a more severe alteration in inner retinal processing may be attributable to the fact that some populations of GABAA receptors remain functional—because NL2 loss impairs, but does not fully abolish, the clustering of specific receptor subsets. Moreover, GABAergic and glycinergic amacrine cells are mutually inhibitory i.e., blocking inhibition mediated by GABA often enhances inhibition mediated by glycine and vice versa (Zhang et al., 1997). Finally, the genetic ablation of GABAC receptors yields increased oscillatory potential amplitudes (McCall et al., 2002). Accordingly, the slight yet not significant reduction in GABAC cluster numbers observed at the IPL of NL2 KO mice might also preclude large oscillatory potential alterations.
Altogether, the results from the ERG recordings correlate well to the morphological analysis of NL2 deficient retinas, wherein specific deficits of the amacrine pathway were unraveled, leaving the core architecture of the retina intact.
Through MEA recordings, we could further show that NL2-driven alterations are sufficient to modify the coding of visual signals by retinal ganglion cells. The relative proportions of ON, OFF, and ON-OFF ganglion cells and their average basal firing rate in WT paralleled earlier findings (Nirenberg and Meister, 1997; Demas et al., 2003), confirming the validity of our recordings. In the NL2 KO, this distribution was unchanged, reflecting the integrity of retinal neuron populations. Also, ON and OFF KO cells fired maximally in response to plain flashes of light, consistent with intact excitatory transmission and unaltered ERG a- and b-waves.
We observed two signs of increased excitability in NL2 KO retinal ganglion cells. First, the cells had a significantly higher basal firing rate. Second, latencies of peak and inflection point were shorter in STA of NL2 KO. It is conceivable that the increased excitability results from the altered GABAAergic receptor clustering observed at the IPL, as GABAergic amacrine cells modulate ganglion cell activity (for review, see MacNeil and Masland, 1998).
Moreover, we observed impaired coding of light stimuli by NL2 KO retinal ganglion cells. The average information per action potential was smaller in NL2 KO as suggested by the smaller amplitudes in STA of the white noise analysis. Consistently, the peak response to a 1 s light pulse was also reduced when expressed relative to the total number of spikes fired by a given cell. Thus, fewer of the spikes received by postsynaptic neurons relate to the light stimulus. One possible reason for this impaired coding might be the “dilution” of light-triggered action potentials by the increased baseline activity. In addition, coding might be impaired directly when GABAA receptors are missing at the IPL.
In conclusion, we showed that NL2 removal disrupts the integrity of GABAergic postsynapses and leads to subtle reorganizations of the retinal network. These alterations functionally translate into impaired visual processing and retinal output, and suggest that deletion or mutation in NLs may induce important alterations already at sensory synapses and not only in higher brain areas. Of note, mutations in NLs are linked to cases of autism and mental retardation (Jamain et al., 2003; Laumonnier et al., 2004; Chocholska et al., 2006; Lawson-Yuen et al., 2008; Yan et al., 2008), and NL deletion-mutant mice have been introduced as genetic models of autism (Tabuchi et al., 2007; Jamain et al., 2008). In particular, visual alterations have been described in some cases of autism (Cook, 1990; Bertone et al., 2005; Dakin and Frith, 2005), and it will be interesting to explore the impact of other NL isoforms on the organization and function of the retinal network.
Footnotes
This work was supported by funding from the Cure Autism Now Foundation (F.V.), the European Community (NEUREST MEST-CT-2004-504193 to M.H; Eurohear, T.M), the DFG Center for Molecular Physiology of the Brain (T.M., B.F., F.V.), the Bernstein Center for Computational Neuroscience (BMBF to T.M.), and the Max Planck Society (Tandem project to Nils Brose and T.M.). We would like to thank Josef Ammermüller, Tim Gollisch, Fred Rieke, Marco Sassoè-Pognetto, Heinz Wässle, and Rachel Wong for precious suggestions during early stages of the study. We are indebted to Niels Christian Danbolt and Heinz Wässle for generously providing antibodies, and Christian Rüdiger and Klaus Hellmann for excellent technical help. We warmly thank Alexandros Poulopoulos and Nils Brose for careful reading of this manuscript and helpful suggestions and discussions throughout the course of this study.
References
- Alldred MJ, Mulder-Rosi J, Lingenfelter SE, Chen G, Lüscher B. Distinct gamma2 subunit domains mediate clustering and synaptic function of postsynaptic GABAA receptors and gephyrin. J Neurosci. 2005;25:594–603. doi: 10.1523/JNEUROSCI.4011-04.2005. [DOI] [PMC free article] [PubMed] [Google Scholar]
- Berry MJ, Warland DK, Meister M. The structure and precision of retinal spike trains. Proc Natl Acad Sci U S A. 1997;94:5411–5416. doi: 10.1073/pnas.94.10.5411. [DOI] [PMC free article] [PubMed] [Google Scholar]
- Bertone A, Mottron L, Jelenic P, Faubert J. Enhanced and diminished visuo-spatial information processing in autism depends on stimulus complexity. Brain. 2005;128:2430–2441. doi: 10.1093/brain/awh561. [DOI] [PubMed] [Google Scholar]
- Boycott BB, Wässle H. Morphological classification of bipolar cells of the primate retina. Eur J Neurosci. 1991;3:1069–1088. doi: 10.1111/j.1460-9568.1991.tb00043.x. [DOI] [PubMed] [Google Scholar]
- Boycott B, Wässle H. Parallel processing in the mammalian retina: the Proctor Lecture. Invest Ophthalmol Vis Sci. 1999;40:1313–1327. [PubMed] [Google Scholar]
- Brandstätter JH, Fletcher EL, Garner CC, Gundelfinger ED, Wässle H. Differential expression of the presynaptic cytomatrix protein bassoon among ribbon synapses in the mammalian retina. Eur J Neurosci. 1999;11:3683–3693. doi: 10.1046/j.1460-9568.1999.00793.x. [DOI] [PubMed] [Google Scholar]
- Budreck EC, Scheiffele P. Neuroligin-3 is a neuronal adhesion protein at GABAergic and glutamatergic synapses. Eur J Neurosci. 2007;26:1738–1748. doi: 10.1111/j.1460-9568.2007.05842.x. [DOI] [PubMed] [Google Scholar]
- Chichilnisky EJ. A simple white noise analysis of neuronal light responses. Network. 2001;12:199–213. [PubMed] [Google Scholar]
- Chichilnisky EJ, Baylor DA. Receptive-field microstructure of blue-yellow ganglion cells in primate retina. Nat Neurosci. 1999;2:889–893. doi: 10.1038/13189. [DOI] [PubMed] [Google Scholar]
- Chichilnisky EJ, Kalmar RS. Functional asymmetries in ON and OFF ganglion cells of primate retina. J Neurosci. 2002;22:2737–2747. doi: 10.1523/JNEUROSCI.22-07-02737.2002. [DOI] [PMC free article] [PubMed] [Google Scholar]
- Chih B, Engelman H, Scheiffele P. Control of excitatory and inhibitory synapse formation by neuroligins. Science. 2005;307:1324–1328. doi: 10.1126/science.1107470. [DOI] [PubMed] [Google Scholar]
- Chocholska S, Rossier E, Barbi G, Kehrer-Sawatzki H. Molecular cytogenetic analysis of a familial interstitial deletion Xp22.2–22.3 with a highly variable phenotype in female carriers. Am J Med Genet A. 2006;140:604–610. doi: 10.1002/ajmg.a.31145. [DOI] [PubMed] [Google Scholar]
- Chubykin AA, Atasoy D, Etherton MR, Brose N, Kavalali ET, Gibson JR, Südhof TC. Activity-dependent validation of excitatory versus inhibitory synapses by neuroligin-1 versus neuroligin-2. Neuron. 2007;54:919–931. doi: 10.1016/j.neuron.2007.05.029. [DOI] [PMC free article] [PubMed] [Google Scholar]
- Cook EH. Autism: review of neurochemical investigation. Synapse. 1990;6:292–308. doi: 10.1002/syn.890060309. [DOI] [PubMed] [Google Scholar]
- Craig AM, Kang Y. Neurexin-neuroligin signaling in synapse development. Curr Opin Neurobiol. 2007;17:43–52. doi: 10.1016/j.conb.2007.01.011. [DOI] [PMC free article] [PubMed] [Google Scholar]
- Dakin S, Frith U. Vagaries of visual perception in autism. Neuron. 2005;48:497–507. doi: 10.1016/j.neuron.2005.10.018. [DOI] [PubMed] [Google Scholar]
- Demas J, Eglen SJ, Wong RO. Developmental loss of synchronous spontaneous activity in the mouse retina is independent of visual experience. J Neurosci. 2003;23:2851–2860. doi: 10.1523/JNEUROSCI.23-07-02851.2003. [DOI] [PMC free article] [PubMed] [Google Scholar]
- Dong CJ, Werblin FS. Temporal contrast enhancement via GABAC feedback at bipolar terminals in the tiger salamander retina. J Neurophysiol. 1998;79:2171–2180. doi: 10.1152/jn.1998.79.4.2171. [DOI] [PubMed] [Google Scholar]
- Dong N, Qi J, Chen G. Molecular reconstitution of functional GABAergic synapses with expression of neuroligin-2 and GABAA receptors. Mol Cell Neurosci. 2007;35:14–23. doi: 10.1016/j.mcn.2007.01.013. [DOI] [PubMed] [Google Scholar]
- Essrich C, Lorez M, Benson JA, Fritschy JM, Lüscher B. Postsynaptic clustering of major GABAA receptor subtypes requires the gamma 2 subunit and gephyrin. Nat Neurosci. 1998;1:563–571. doi: 10.1038/2798. [DOI] [PubMed] [Google Scholar]
- Fairhall AL, Burlingame CA, Narasimhan R, Harris RA, Puchalla JL, Berry MJ., 2nd Selectivity for multiple stimulus features in retinal ganglion cells. J Neurophysiol. 2006;96:2724–2738. doi: 10.1152/jn.00995.2005. [DOI] [PubMed] [Google Scholar]
- Fischer F, Kneussel M, Tintrup H, Haverkamp S, Rauen T, Betz H, Wässle H. Reduced synaptic clustering of GABA and glycine receptors in the retina of the gephyrin null mutant mouse. J Comp Neurol. 2000;427:634–648. doi: 10.1002/1096-9861(20001127)427:4<634::aid-cne10>3.0.co;2-x. [DOI] [PubMed] [Google Scholar]
- Fletcher EL, Koulen P, Wässle H. GABAA and GABAC receptors on mammalian rod bipolar cells. J Comp Neurol. 1998;396:351–365. doi: 10.1002/(sici)1096-9861(19980706)396:3<351::aid-cne6>3.0.co;2-1. [DOI] [PubMed] [Google Scholar]
- Fritschy JM, Mohler H. GABAA-receptor heterogeneity in the adult rat brain: differential regional and cellular distribution of seven major subunits. J Comp Neurol. 1995;359:154–194. doi: 10.1002/cne.903590111. [DOI] [PubMed] [Google Scholar]
- Graf ER, Zhang X, Jin SX, Linhoff MW, Craig AM. Neurexins induce differentiation of GABA and glutamate postsynaptic specializations via neuroligins. Cell. 2004;119:1013–1026. doi: 10.1016/j.cell.2004.11.035. [DOI] [PMC free article] [PubMed] [Google Scholar]
- Greferath U, Grünert U, Fritschy JM, Stephenson A, Möhler H, Wässle H. GABAA receptor subunits have differential distributions in the rat retina: in situ hybridization and immunohistochemistry. J Comp Neurol. 1995;353:553–571. doi: 10.1002/cne.903530407. [DOI] [PubMed] [Google Scholar]
- Haverkamp S, Wässle H. Immunocytochemical analysis of the mouse retina. J Comp Neurol. 2000;424:1–23. [PubMed] [Google Scholar]
- Haverkamp S, Grünert U, Wässle H. The synaptic architecture of AMPA receptors at the cone pedicle of the primate retina. J Neurosci. 2001;21:2488–2500. doi: 10.1523/JNEUROSCI.21-07-02488.2001. [DOI] [PMC free article] [PubMed] [Google Scholar]
- Ichtchenko K, Hata Y, Nguyen T, Ullrich B, Missler M, Moomaw C, Südhof TC. Neuroligin 1: a splice site-specific ligand for beta-neurexins. Cell. 1995;81:435–443. doi: 10.1016/0092-8674(95)90396-8. [DOI] [PubMed] [Google Scholar]
- Ichtchenko K, Nguyen T, Südhof TC. Structures, alternative splicing, and neurexin binding of multiple neuroligins. J Biol Chem. 1996;271:2676–2682. doi: 10.1074/jbc.271.5.2676. [DOI] [PubMed] [Google Scholar]
- Jamain S, Quach H, Betancur C, Råstam M, Colineaux C, Gillberg IC, Soderstrom H, Giros B, Leboyer M, Gillberg C, Bourgeron T. Mutations of the X-linked genes encoding neuroligins NLGN3 and NLGN4 are associated with autism. Nat Genet. 2003;34:27–29. doi: 10.1038/ng1136. [DOI] [PMC free article] [PubMed] [Google Scholar]
- Jamain S, Radyushkin K, Hammerschmidt K, Granon S, Boretius S, Varoqueaux F, Ramanantsoa N, Gallego J, Ronnenberg A, Winter D, Frahm J, Fischer J, Bourgeron T, Ehrenreich H, Brose N. Reduced social interaction and ultrasonic communication in a mouse model of monogenic heritable autism. Proc Natl Acad Sci U S A. 2008;105:1710–1715. doi: 10.1073/pnas.0711555105. [DOI] [PMC free article] [PubMed] [Google Scholar]
- Johnson J, Tian N, Caywood MS, Reimer RJ, Edwards RH, Copenhagen DR. Vesicular neurotransmitter transporter expression in developing postnatal rodent retina: GABA and glycine precede glutamate. J Neurosci. 2003;23:518–529. doi: 10.1523/JNEUROSCI.23-02-00518.2003. [DOI] [PMC free article] [PubMed] [Google Scholar]
- Kerschensteiner D, Wong RO. A precisely timed asynchronous pattern of ON and OFF retinal ganglion cell activity during propagation of retinal waves. Neuron. 2008;58:851–858. doi: 10.1016/j.neuron.2008.04.025. [DOI] [PMC free article] [PubMed] [Google Scholar]
- Kirsch J, Betz H. Widespread expression of gephyrin, a putative glycine receptor-tubulin linker protein, in rat brain. Brain Res. 1993;621:301–310. doi: 10.1016/0006-8993(93)90120-c. [DOI] [PubMed] [Google Scholar]
- Koulen P, Sassoè-Pognetto M, Grünert U, Wässle H. Selective clustering of GABA(A) and glycine receptors in the mammalian retina. J Neurosci. 1996;16:2127–2140. doi: 10.1523/JNEUROSCI.16-06-02127.1996. [DOI] [PMC free article] [PubMed] [Google Scholar]
- Laumonnier F, Bonnet-Brilhault F, Gomot M, Blanc R, David A, Moizard MP, Raynaud M, Ronce N, Lemonnier E, Calvas P, Laudier B, Chelly J, Fryns JP, Ropers HH, Hamel BC, Andres C, Barthélémy C, Moraine C, Briault S. X-linked mental retardation and autism are associated with a mutation in the NLGN4 gene, a member of the neuroligin family. Am J Hum Genet. 2004;74:552–557. doi: 10.1086/382137. [DOI] [PMC free article] [PubMed] [Google Scholar]
- Lawson-Yuen A, Saldivar JS, Sommer S, Picker J. Familial deletion within NLGN4 associated with autism and Tourette syndrome. Eur J Hum Genet. 2008;16:614–618. doi: 10.1038/sj.ejhg.5202006. [DOI] [PubMed] [Google Scholar]
- Lisé MF, El-Husseini A. The neuroligin and neurexin families: from structure to function at the synapse. Cell Mol Life Sci. 2006;63:1833–1849. doi: 10.1007/s00018-006-6061-3. [DOI] [PMC free article] [PubMed] [Google Scholar]
- MacNeil MA, Masland RH. Extreme diversity among amacrine cells: implications for function. Neuron. 1998;20:971–982. doi: 10.1016/s0896-6273(00)80478-x. [DOI] [PubMed] [Google Scholar]
- Majumdar S, Heinze L, Haverkamp S, Ivanova E, Wässle H. Glycine receptors of A-type ganglion cells of the mouse retina. Vis Neurosci. 2007;24:471–487. doi: 10.1017/S0952523807070174. [DOI] [PubMed] [Google Scholar]
- Mandell JW, Czernik AJ, De Camilli P, Greengard P, Townes-Anderson E. Differential expression of synapsins I and II among rat retinal synapses. J Neurosci. 1992;12:1736–1749. doi: 10.1523/JNEUROSCI.12-05-01736.1992. [DOI] [PMC free article] [PubMed] [Google Scholar]
- Masland RH. The fundamental plan of the retina. Nat Neurosci. 2001a;4:877–886. doi: 10.1038/nn0901-877. [DOI] [PubMed] [Google Scholar]
- Masland RH. Neuronal diversity in the retina. Curr Opin Neurobiol. 2001b;11:431–436. doi: 10.1016/s0959-4388(00)00230-0. [DOI] [PubMed] [Google Scholar]
- Matsubara A, Laake JH, Davanger S, Usami S, Ottersen OP. Organization of AMPA receptor subunits at a glutamate synapse: a quantitative immunogold analysis of hair cell synapses in the rat organ of Corti. J Neurosci. 1996;16:4457–4467. doi: 10.1523/JNEUROSCI.16-14-04457.1996. [DOI] [PMC free article] [PubMed] [Google Scholar]
- McCall MA, Lukasiewicz PD, Gregg RG, Peachey NS. Elimination of the rho1 subunit abolishes GABA(C) receptor expression and alters visual processing in the mouse retina. J Neurosci. 2002;22:4163–4174. doi: 10.1523/JNEUROSCI.22-10-04163.2002. [DOI] [PMC free article] [PubMed] [Google Scholar]
- Menger N, Pow DV, Wässle H. Glycinergic amacrine cells of the rat retina. J Comp Neurol. 1998;401:34–46. doi: 10.1002/(sici)1096-9861(19981109)401:1<34::aid-cne3>3.0.co;2-p. [DOI] [PubMed] [Google Scholar]
- Moss SJ, Smart TG. Constructing inhibitory synapses. Nat Rev Neurosci. 2001;2:240–250. doi: 10.1038/35067500. [DOI] [PubMed] [Google Scholar]
- Mumm JS, Godinho L, Morgan JL, Oakley DM, Schroeter EH, Wong RO. Laminar circuit formation in the vertebrate retina. Prog Brain Res. 2005;147:155–169. doi: 10.1016/S0079-6123(04)47012-5. [DOI] [PubMed] [Google Scholar]
- Nirenberg S, Meister M. The light response of retinal ganglion cells is truncated by a displaced amacrine circuit. Neuron. 1997;18:637–650. doi: 10.1016/s0896-6273(00)80304-9. [DOI] [PubMed] [Google Scholar]
- O'Brien BJ, Richardson RC, Berson DM. Inhibitory network properties shaping the light evoked responses of cat alpha retinal ganglion cells. Vis Neurosci. 2003;20:351–361. doi: 10.1017/s0952523803204016. [DOI] [PubMed] [Google Scholar]
- Panzanelli P, Homanics GE, Ottersen OP, Fritschy JM, Sassoè-Pognetto M. Pre- and postsynaptic GABA receptors at reciprocal dendrodendritic synapses in the olfactory bulb. Eur J Neurosci. 2004;20:2945–2952. doi: 10.1111/j.1460-9568.2004.03776.x. [DOI] [PubMed] [Google Scholar]
- Patrizi A, Scelfo B, Viltono L, Briatore F, Fukaya M, Watanabe M, Strata P, Varoqueaux F, Brose N, Fritschy JM, Sassoè-Pognetto M. Synapse formation and clustering of neuroligin-2 in the absence of GABAA receptors. Proc Natl Acad Sci U S A. 2008;105:13151–13156. doi: 10.1073/pnas.0802390105. [DOI] [PMC free article] [PubMed] [Google Scholar]
- Peichl L, González-Soriano J. Morphological types of horizontal cell in rodent retinae: a comparison of rat, mouse, gerbil, and guinea pig. Vis Neurosci. 1994;11:501–517. doi: 10.1017/s095252380000242x. [DOI] [PubMed] [Google Scholar]
- Pourcho RG, Goebel DJ. Immunocytochemical demonstration of glycine in retina. Brain Res. 1985;348:339–342. doi: 10.1016/0006-8993(85)90453-6. [DOI] [PubMed] [Google Scholar]
- Pow DV, Hendrickson AE. Distribution of the glycine transporter glyt-1 in mammalian and nonmammalian retinae. Vis Neurosci. 1999;16:231–239. doi: 10.1017/s0952523899162047. [DOI] [PubMed] [Google Scholar]
- Sakai HM, Naka K. Response dynamics and receptive-field organization of catfish amacrine cells. J Neurophysiol. 1992;67:430–442. doi: 10.1152/jn.1992.67.2.430. [DOI] [PubMed] [Google Scholar]
- Sassoè-Pognetto M, Wässle H. Synaptogenesis in the rat retina: subcellular localization of glycine receptors, GABA(A) receptors, and the anchoring protein gephyrin. J Comp Neurol. 1997;381:158–174. doi: 10.1002/(sici)1096-9861(19970505)381:2<158::aid-cne4>3.0.co;2-2. [DOI] [PubMed] [Google Scholar]
- Sassoè-Pognetto M, Kirsch J, Grünert U, Greferath U, Fritschy JM, Möhler H, Betz H, Wässle H. Colocalization of gephyrin and GABAA-receptor subunits in the rat retina. J Comp Neurol. 1995;357:1–14. doi: 10.1002/cne.903570102. [DOI] [PubMed] [Google Scholar]
- Schweizer C, Balsiger S, Bluethmann H, Mansuy IM, Fritschy JM, Mohler H, Lüscher B. The gamma 2 subunit of GABA(A) receptors is required for maintenance of receptors at mature synapses. Mol Cell Neurosci. 2003;24:442–450. doi: 10.1016/s1044-7431(03)00202-1. [DOI] [PubMed] [Google Scholar]
- Seeliger MW, Zrenner E, Apfelstedt-Sylla E, Jaissle GB. Identification of Usher syndrome subtypes by ERG implicit time. Invest Ophthalmol Vis Sci. 2001;42:3066–3071. [PubMed] [Google Scholar]
- Song JY, Ichtchenko K, Südhof TC, Brose N. Neuroligin 1 is a postsynaptic cell-adhesion molecule of excitatory synapses. Proc Natl Acad Sci U S A. 1999;96:1100–1105. doi: 10.1073/pnas.96.3.1100. [DOI] [PMC free article] [PubMed] [Google Scholar]
- Tabuchi K, Blundell J, Etherton MR, Hammer RE, Liu X, Powell CM, Südhof TC. A neuroligin-3 mutation implicated in autism increases inhibitory synaptic transmission in mice. Science. 2007;318:71–76. doi: 10.1126/science.1146221. [DOI] [PMC free article] [PubMed] [Google Scholar]
- Vardi N. Alpha subunit of Go localizes in the dendritic tips of ON bipolar cells. J Comp Neurol. 1998;395:43–52. [PubMed] [Google Scholar]
- Vardi N, Auerbach P. Specific cell types in cat retina express different forms of glutamic acid decarboxylase. J Comp Neurol. 1995;351:374–384. doi: 10.1002/cne.903510305. [DOI] [PubMed] [Google Scholar]
- Varoqueaux F, Jamain S, Brose N. Neuroligin 2 is exclusively localized to inhibitory synapses. Eur J Cell Biol. 2004;83:449–456. doi: 10.1078/0171-9335-00410. [DOI] [PubMed] [Google Scholar]
- Varoqueaux F, Aramuni G, Rawson RL, Mohrmann R, Missler M, Gottmann K, Zhang W, Südhof TC, Brose N. Neuroligins determine synapse maturation and function. Neuron. 2006;51:741–754. doi: 10.1016/j.neuron.2006.09.003. [DOI] [PubMed] [Google Scholar]
- Wachtmeister L. Further studies of the chemical sensitivity of the oscillatory potentials of the electroretinogram (ERG). I. GABA- and glycine antagonists. Acta Ophthalmol (Copenh) 1980;58:712–725. doi: 10.1111/j.1755-3768.1980.tb06684.x. [DOI] [PubMed] [Google Scholar]
- Wachtmeister L. Oscillatory potentials in the retina: what do they reveal. Prog Retin Eye Res. 1998;17:485–521. doi: 10.1016/s1350-9462(98)00006-8. [DOI] [PubMed] [Google Scholar]
- Wachtmeister L, Dowling JE. The oscillatory potentials of the mudpuppy retina. Invest Ophthalmol Vis Sci. 1978;17:1176–1188. [PubMed] [Google Scholar]
- Wang CT, Blankenship AG, Anishchenko A, Elstrott J, Fikhman M, Nakanishi S, Feller MB. GABA(A) receptor-mediated signaling alters the structure of spontaneous activity in the developing retina. J Neurosci. 2007;27:9130–9140. doi: 10.1523/JNEUROSCI.1293-07.2007. [DOI] [PMC free article] [PubMed] [Google Scholar]
- Wässle H. Parallel processing in the mammalian retina. Nat Rev Neurosci. 2004;5:747–757. doi: 10.1038/nrn1497. [DOI] [PubMed] [Google Scholar]
- Wässle H, Schäfer-Trenkler I, Voigt T. Analysis of a glycinergic inhibitory pathway in the cat retina. J Neurosci. 1986;6:594–604. doi: 10.1523/JNEUROSCI.06-02-00594.1986. [DOI] [PMC free article] [PubMed] [Google Scholar]
- Wässle H, Koulen P, Brandstätter JH, Fletcher EL, Becker CM. Glycine and GABA receptors in the mammalian retina. Vision Res. 1998;38:1411–1430. doi: 10.1016/s0042-6989(97)00300-3. [DOI] [PubMed] [Google Scholar]
- Yan J, Feng J, Schroer R, Li W, Skinner C, Schwartz CE, Cook EH, Jr, Sommer SS. Analysis of the neuroligin 4Y gene in patients with autism. Psychiatr Genet. 2008;18:204–207. doi: 10.1097/YPG.0b013e3282fb7fe6. [DOI] [PubMed] [Google Scholar]
- Zafra F, Aragón C, Olivares L, Danbolt NC, Giménez C, Storm-Mathisen J. Glycine transporters are differentially expressed among CNS cells. J Neurosci. 1995;15:3952–3969. doi: 10.1523/JNEUROSCI.15-05-03952.1995. [DOI] [PMC free article] [PubMed] [Google Scholar]
- Zhang J, Jung CS, Slaughter MM. Serial inhibitory synapses in retina. Vis Neurosci. 1997;14:553–563. doi: 10.1017/s0952523800012219. [DOI] [PubMed] [Google Scholar]