

Abstract
Complexins (CPXs I–IV) presumably act as regulators of the SNARE (soluble N-ethylmaleimide-sensitive factor attachment protein receptor) complex, but their function in the intact mammalian nervous system is not well established. Here, we explored the role of CPXs in the mouse auditory system. Hearing was impaired in CPX I knock-out mice but normal in knock-out mice for CPXs II, III, IV, and III/IV as measured by auditory brainstem responses. Complexins were not detectable in cochlear hair cells but CPX I was expressed in spiral ganglion neurons (SGNs) that give rise to the auditory nerve. Ca2+-dependent exocytosis of inner hair cells and sound encoding by SGNs were unaffected in CPX I knock-out mice. In the absence of CPX I, the resting release probability in the endbulb of Held synapses of the auditory nerve fibers with bushy cells in the cochlear nucleus was reduced. As predicted by computational modeling, bushy cells had decreased spike rates at sound onset as well as longer and more variable first spike latencies explaining the abnormal auditory brainstem responses. In addition, we found synaptic transmission to outlast the stimulus at many endbulb of Held synapses in vitro and in vivo, suggesting impaired synchronization of release to stimulus offset. Although sound encoding in the cochlea proceeds in the absence of complexins, CPX I is required for faithful processing of sound onset and offset in the cochlear nucleus.
Introduction
Hearing relies on faithful synaptic transmission along the auditory pathway. Auditory synapses are specialized for maintaining temporally precise and reliable synaptic transmission at high rates of activity (Oertel, 1999; Trussell, 1999; Fuchs, 2005). This is particularly evident at synapses early in the auditory pathway [i.e., the ribbon synapse of inner hair cells (IHCs) (Moser et al., 2006; Nouvian et al., 2006), the endbulb of Held synapses in the anteroventral cochlear nucleus (AVCN) (Oertel, 1983; Isaacson and Walmsley, 1995; Oertel, 1999), and the calyx of Held in the medial nucleus of the trapezoid body (Rollenhagen and Lübke, 2006)]. These synapses use different structural designs. Specializations at the molecular level have also been documented (for review, see Nouvian et al., 2006; Schneggenburger and Forsythe, 2006). For example, hair cell synapses specifically express the ribbon protein RIBEYE (Khimich et al., 2005) and the C2-domain protein otoferlin (Roux et al., 2006), but lack synaptotagmins 1 and 2 (Safieddine and Wenthold, 1999).
We examined the role of the complexin (CPX) family of synaptic proteins for synaptic transmission in the auditory pathway and asked whether auditory synapses differ in their use of CPX isoforms. CPXs form a family of four evolutionarily conserved regulators of the soluble N-ethylmaleimide-sensitive factor attachment protein receptor (SNARE) complex at synapses (CPXs I–IV) (Reim et al., 2001; Brose, 2008). All neurosecretory preparations studied so far appear to require CPX expression for normal exocytosis (Reim et al., 2001; Cai et al., 2008; Xue et al., 2008). Although different models of the exact function of CPXs have been proposed (Reim et al., 2001; Giraudo et al., 2006, 2009; Schaub et al., 2006; Tang et al., 2006; Maximov et al., 2009), there is a general consensus that they are required for a late step of exocytosis (for review, see Rosenmund et al., 2003; Melia, 2007; Brose, 2008; Südhof and Rothman, 2009). CPXs I and II are widely expressed in the CNS. Synaptic function appears normal in hippocampal cell cultures taken from mice with genetic deletion of CPX I or II, but synapses show significant deficits in CPX I/II double knock-outs (Reim et al., 2001). CPX III is found at very low levels in the brain, but is abundant in the retina, and CPX IV is specifically localized to retinal ribbon synapses (Reim et al., 2005).
Here, we characterized the effect of a single CPX gene deletion (CPX I) on hearing at several stages of the mammalian auditory system from the level of gross auditory physiology down to the level of single synapse transmission. We demonstrate a hearing impairment and attribute it primarily to a reduced initial release probability in the endbulb of Held synapse resulting in longer latencies and increased timing variability of bushy cell spiking in the AVCN. Moreover, we demonstrate that CPX I is required for the accurate termination of release on stimulus offset at these synapses. Our findings show that CPX I is critical for synchronous synaptic transmission of sensory information in the central auditory pathway and suggest a novel, CPX-independent release mechanism at the hair cell ribbon synapse.
Materials and Methods
Animals
The generation of CPX I, CPX II, and CPX III knock-out mice has been described previously (Reim et al., 2001; Xue et al., 2008). The generation of CPX IV knock-outs will be described elsewhere, together with the retina phenotype of mice lacking CPX III and/or CPX IV (Reim et al., 2009). Littermates at the age of 3–4 and 6–10, or 15–16 weeks were included in this study. All experiments complied with national animal care guidelines and were approved by the University of Göttingen Board for Animal Welfare and the Animal Welfare Office of the State of Lower Saxony or by the Saxonian District Government, Leipzig, and were done according to European Communities Council Directive of 24 November 1986 (86/609/EEC).
In vivo auditory physiology
Animals were anesthetized by intraperitoneal injection of a combination of ketamine (100–125 μg/g) and xylazine (2.5–5 μg/g), and the heart rate was constantly monitored. The core temperature was maintained constant at 37°C using a rectal temperature-controlled heat blanket (Hugo Sachs Elektronik–Harvard Apparatus GmbH). For stimulus generation, presentation, and data acquisition, we used the TDT II or III Systems (Tucker Davis Technologies) run by BioSig32 software (TDT) or MATLAB (Mathworks) routines. Sound pressure levels are provided in decibels sound pressure level (SPL) rms (tonal stimuli) or decibels SPL peak equivalent (clicks) and were calibrated using a ¼ inch Brüel & Kjaer microphone (D 4039; Brüel & Kjaer). Stimuli were presented ipsilaterally in the free field using a JBL 2402 speaker (JBL), except for recordings of otoacoustic emissions (EC1; TDT).
Auditory brainstem responses (ABRs), auditory steady-state responses (ASSRs), and distortion product otoacoustic emissions (DPOAEs) were recorded as described by Pauli-Magnus et al. (2007) (supplemental data 1, Experimental Procedures, available at www.jneurosci.org as supplemental material).
Recordings from single-unit auditory nerve fibers and AVCN principal neurons
Auditory nerve fiber recordings were performed essentially as described by Taberner and Liberman (2005) using the TDT System 3 and an ELC-03XS amplifier (NPI Electronics) controlled by Matlab software and using free-field stimulation with a HF-250 tweeter (Fane). Adult mice were anesthetized with urethane (1.3 mg/kg, i.p.) and xylazine (5 mg/kg, i.p.), tracheostomized, and placed in a stereotactic apparatus. After partial removal of the left occipital bone and cerebellum, the auditory nerve was approached through the cochlear nucleus with a glass micropipette filled with 3 m NaCl and 2% methylene blue using an Inchworm manipulator (EXFO Burleigh). On audiovisual detection of single-unit spiking activity, auditory nerve fibers were identified by their stereotactic position, irregular firing pattern, and their primary-like poststimulus time histogram (PSTH). Characteristic frequency (CF) and best threshold (defined by a significant rate increase by 20 spikes/s in 20 ms after a 15 ms tone pip, Wald's probability ratio test) were obtained with a 1/32 octave and 2 dB precision and further characterization was performed at CF. Subsequent off-line spike detection using Matlab was based on amplitudes, waveforms reproducibility, and signal-to-noise ratio.
Ventral cochlear nucleus (VCN) neuron recordings were performed as previously described (Kopp-Scheinpflug et al., 2002). In brief, after anesthesia, the skull was exposed along the dorsal midsagittal line. Two holes were drilled in the skull 2000–2300 μm caudal to the lambda suture. The first drill hole, located 1500 μm lateral to the midline, was used to position the reference electrode in the superficial cerebellum. For the insertion of electrodes, the second drill hole (500 μm diameter) was located over the midline, and the electrodes were angled at 28–30° to the midsagittal plane. The recording site was verified histologically using Fluorogold marking.
In vitro physiology
Patch clamp of IHCs.
IHCs from the apical coil of freshly dissected organs of Corti from 6- to 9-week-old CPX I−/− mice and their wild-type (WT) littermates were patch clamped at room temperature (20–25°C) in the perforated-patch configuration as described by Brandt et al. (2003). The pipette solution contained the following (in mm): 130 Cs-gluconate, 10 tetraethylammonium-Cl (TEA-Cl), 10 Cs-HEPES, 1 MgCl2, and amphotericin B (250 μg/ml; Calbiochem). The extracellular solution contained the following (in mm): 113 NaCl, 2 CaCl2, 35 TEA-Cl, 2.8 KCl, 1 MgCl2, 10 Na-HEPES, and 10 d-glucose. The pH was adjusted to 7.2 with NaOH, and the osmolarity was between 290 and 310 mmol/kg. An EPC-9 amplifier (HEKA) controlled by “Pulse” software (HEKA) was used for measurements. Currents were low-pass filtered at 2 kHz and sampled at 10 kHz. Cells that displayed a membrane current exceeding −50 pA at our standard holding potential of −84 mV were discarded. C m was measured as described previously using the Lindau–Neher technique (Lindau and Neher, 1988). ΔC m was estimated as the difference of the mean C m over 400 ms after the depolarization (the initial 200 ms were skipped) and the mean prepulse capacitance (400 ms).
Patch clamp of bushy cells.
Slices in the cochlear nucleus were prepared as described previously (Yang and Xu-Friedman, 2008). Briefly, 160 μm parasagittal brain slices were cut from mice aged postnatal day 15 (P15) to P21 into ice-cold solution containing the following (in mm): 76 NaCl, 75 sucrose, 25 NaHCO3, 25 glucose, 2.5 KCl, 1.25 NaH2PO4, 7 MgCl2, 0.5 CaCl2. Slices were incubated at 33°C for 20 min in standard recording solution containing the following (in mm): 125 NaCl, 26 NaHCO3, 20 glucose, 2.5 KCl, 1.25 NaH2PO4, 1 MgCl2, 1.5 CaCl2, 4 Na l-lactate, 2 Na-pyruvate, 0.4 Na l-ascorbate. Bushy cells in the AVCN were patched under an Olympus BX51WI microscope with a Multiclamp 700B (Molecular Devices) controlled by a National Instruments PCI-6221 interface driven by custom-written software (mafPC) running in Igor (Wavemetrics). Pipettes were 1–2 MΩ, filled with the following (for voltage clamp; in mm): 35 CsF, 100 CsCl, 10 EGTA, 10 HEPES; or with the following (for current clamp; in mm): 130 KMeSO3, 10 NaCl, 10 HEPES, 2 MgCl2, 0.5 EGTA, 0.16 CaCl2, 4 Na2ATP, 0.4 NaGTP, 14 Tris-creatine phosphate, with pH adjusted to 7.3, 310 mOsm. The holding potential for voltage clamp was −70 mV. All recordings were made at 34°C in the presence of 10 μm strychnine. SGN axons were stimulated using a glass micropipette placed 30–50 μm away from the cell being recorded with currents of 6–14 μA through a stimulus isolator (WPI A360). It was verified that single SGN inputs were being stimulated by slightly decreasing stimulus amplitude and seeing the EPSCs (in voltage clamp) or EPSPs/spikes (in current clamp) completely disappear. Bushy cells were identified in current clamp by their undershooting spikes in response to depolarizing current steps, and in voltage clamp by extremely rapid EPSC and miniature EPSC (mEPSC) kinetics. Mini-EPSCs were quantified in the presence of 0.5 μm TTX. The readily releasable pool of vesicles (RRP) and probability of release (P r) were estimated by the method of integration (Schneggenburger et al., 1999). Briefly, EPSCs in a train were integrated, and the last 5–10 points of the train were fit to a line, extrapolated back to the beginning of the train, which estimates the size of the RRP. P r for a given cell was estimated as the ratio between the average initial EPSC and average intercept over all train frequencies examined. For some CPX I−/− endbulbs, we did these measurements in both normal recording solution and high calcium solution (replacing 1.5 Ca/1 Mg with 3 Ca/0 Mg).
Immunohistochemistry
For whole mounts, freshly dissected apical cochlear turns were fixed with 4% paraformaldehyde (PFA) in PBS for 1 h on ice. For cochlear cryosections, the cochlea was removed, fixed by cochlear perfusion (4% PFA in PBS), postfixed for 1 h, and decalcified. For brainstem cryosections, animals were deeply anesthetized by intraperitoneal injection of ketamine (250 μg/g) and xylazine (5 μg/g) and killed/fixed by cardiac perfusion of 4% formaldehyde (FA) in PBS. The brain was gently removed to preserve part of the VIII nerve, postfixed for 2 h in 4% FA. Cochleae and brain were cryoprotected overnight at 4°C in 25% sucrose and embedded in Tissue Tek (Shandon Cryomatrix; Thermo Scientific). Thirty-micrometer-thick coronal sections of the brain or 14-μm-thick cochlear sections were cut at −20°C and placed onto SuperFrost microscope slides.
Thereafter, the cochlear turns or cryosections were washed three times for 10 min each time in PBS and incubated for 1 h in goat serum dilution buffer (GSDB) (16% normal goat serum, 450 mm NaCl, 0.3% Triton X-100, 20 mm phosphate buffer, pH 7.4) in a wet chamber at room temperature. Primary antibodies were dissolved in GSDB buffer and applied overnight at 4°C in a wet chamber. After washing three times for 10 min each time (wash buffer: 450 mm NaCl, 20 mm phosphate buffer, 0.3% Triton X-100), the tissue was incubated with secondary antibodies in GSDB in a wet light-protected chamber for 1 h at room temperature. Then the preparations were washed three times for 10 min each time in wash buffer and one time for 10 min in 5 mm phosphate buffer, placed onto the glass microscope slides with a drop of fluorescence mounting medium (Dako), and covered with thin glass coverslips. The following antibodies were used: mouse IgG1 anti-CtBP2 (BD Biosciences; 1:200), rabbit anti-glutamate receptors 2 and 3 (GluR2/3) (Millipore Bioscience Research Reagents; 1:200), mouse anti-synaptophysin (Synaptic Systems; 1:400), rabbit anti-CPX I/II (Synaptic Systems; 1:300–700), rabbit anti-CPX III (Synaptic Systems; 1:200), rabbit anti-CPX IV (Synaptic Systems; 1:200), mouse monoclonal anti-NF-200 (1:400; Sigma-Aldrich), guinea pig anti-vesicular glutamate transporter 1 (VGLUT1) (Synaptic Systems; 1:4000), and secondary Alexa Fluor 488- and Alexa Fluor 568-labeled antibodies (Invitrogen; 1:200).
Confocal microscopy and image analysis
Confocal images were acquired using a laser-scanning confocal microscope (Leica TCS SP5, Leica Microsystems CMS) with 488 nm (Ar) and 561 nm (He–Ne) lasers for excitation and 10× air or 40×/63× oil-immersion objectives. To produce three-dimensional reconstructions of the specimen, a z-axis stack of two-dimensional images was taken with a step size of 0.2 μm at a pixel size of 0.09 × 0.09 μm. Images were processed using ImageJ and assembled for display in Adobe Photoshop and Illustrator software. Whole-mount preparations of the organ of Corti provided the possibility to analyze several IHCs in a row (Khimich et al., 2005). The RIBEYE immunofluorescence spots in the basolateral portion of the IHCs (up to the apical end of the CtBP2 stained nucleus) were counted in three-dimensional reconstructions of the organ of Corti and divided by the number of IHCs (number of nuclei in the field of view).
Reverse transcription–PCR
Three sources of RNA were used: (1) mechanically dissected organs of Corti, modioli (containing the spiral ganglion), retinas, or cerebella; (2) single IHCs, aspirated into patch pipettes; and (3) ensembles of IHCs captured by laser-assisted microdissection. For (1), we isolated total RNA from six to eight organs of Corti, six to eight modioli, six to eight retinas, or three to four cerebella from P15–P29 NMRI or C57BL/6 mice for each experiment using TRIzol reagent (Invitrogen). Reverse transcription (1 h at 42°C and 10 min at 70°C) of the total RNA (250–400 ng per sample) was performed in first-strand cDNA synthesis mix containing the following (after the final dilution) (in mm): 50 Tris-HCl, 75 KCl, 5 MgCl2, and 5 DTT adjusted to pH 8.3 and 100 U of SuperScript II reverse transcriptase (Invitrogen), 40 U of RNaseOUT ribonuclease inhibitor (Invitrogen), as well as 12.5 ng/μl oligo-dT primers (Invitrogen). After the reverse transcription (RT) reaction, cDNA was subjected to nested PCR with CPX I–IV cDNA-specific primers (listed in supplemental data 2, available at www.jneurosci.org as supplemental material).
For (2), single-cell RT-PCR, IHCs from the apical turn of the organ of Corti were aspirated into the 3 MΩ patch pipette, which contained 6 μl of filtered pipette solution (contained 155 mm KCl, 10 mm HEPES, 1 mm MgCl2, pH 7.2). The pipette content was expirated into the first-strand cDNA synthesis mix [with 200 U of SuperScript II reverse transcriptase (Invitrogen), 40 U of RNaseOUT ribonuclease inhibitor (Invitrogen), and oligo-dT primer]. Bath solution aspirated nearby cells was used as a negative control. Nested PCR was performed for mRNA of CPX isoforms and otoferlin (as hair cell-specific positive control).
For (3), we used a pulsed ultraviolet laser microbeam (wavelength, 337 nm; P.A.L.M. Microlaser Technologies) coupled to an inverted microscope (Axiovert 200; Zeiss). For details, see supplemental data 2, Experimental Procedures (available at www.jneurosci.org as supplemental material).
Computational model
Auditory processing was modeled beginning with action potential (AP) generation in the SGN fibers through synaptically evoked action potentials in the bushy cells. From the model, we extracted first-spike latencies (FSLs) of bushy cell firing. Model parameters were adjusted to match experimental observations wherever possible. To determine whether the effect of CPX I knock-out on P r accounted for the in vivo data, we held all other model features the same (i.e., identical statistics of action potential firing in SGN axons, identical convergence of SGNs onto the modeled bushy cell, identical maximally possible EPSC amplitude at the individual endbulbs, and identical intrinsic properties of bushy cells). Only the realized EPSC amplitude and short-term synaptic plasticity changed as a result of the decrease in P r (supplemental data 4, available at www.jneurosci.org as supplemental material). The first step of the model consists of a Poisson process that determines spike times in the auditory nerve fiber. The rate of the Poisson process is chosen such that modeled AP rates match the rates observed in auditory nerve fibers of C57BL/6 mice. In brief, the action potential firing changes from a spontaneous rate before sound onset, rapidly increases to a peak rate shortly after sound onset, and exponentially drops to the adapted rate. The action potential times in a number of individual fibers generated by the first step drove synaptic transmission at the endbulb of Held in the second step. For a train of activity, the ith EPSC amplitude is given by the following: EPSCi = EPSCamp × Fi × Di, where Di is the fraction of the releasable pool of vesicles that is available, and Fi is the probability of release at that moment, and EPSCamp was the maximum possible EPSC amplitude (i.e., resulting from simultaneous release of the entire readily releasable pool of vesicles). Di and Fi change with each EPSC and recover over time to their steady-state values D 1 = 1 and Fi = Pr (initial release probability). After the relative EPSC amplitudes are convolved with the experimentally determined EPSC time course, they are used as the input to a conductance based model of bushy cell action potential generation. In this third step, the bushy cell membrane potential was given by the following:
 |
where V mem is the membrane potential; C mem is membrane capacitance; GX represents the conductance for K, Na, or leak channels; Vx reversal is the reversal potential for conductance X; and G syn is the summed synaptic conductance determined in step 2 for multiple SGN inputs (N fiber). The times of action potential firing are determined by a threshold criterion, and the first action potential after stimulus onset determines the FSL.
Data analysis
Means are presented with their SE and were statistically compared using unpaired, two-tailed t tests, unless stated otherwise.
Results
Auditory function in mice lacking CPXs: CPX I is required for normal hearing
First, we tested hearing in 3- to 4- and 6- to 10-week-old CPX I knock-out (CPX I−/−) mice and their wild-type littermates (CPX I+/+) by recording ABRs. CPX I−/− mice displayed a small threshold increase (∼15 dB) in the midfrequency region when tested by tone burst ABR at 3–4 weeks (Fig. 1 A). The hearing impairment was larger (threshold shift of ∼30 dB) when tested at 6–10 weeks of age (Fig. 1 B) but was not increased further when tested at 4 months of age (data not shown). Figure 1, C and D, compares the average ABR waveforms in response to 80 dB clicks (peak equivalent) at both ages. Young CPX I−/− mice showed an amplitude reduction and progressive delay of the central auditory ABR peaks (Fig. 1 C, peak II and later; supplemental data 1, available at www.jneurosci.org as supplemental material). At 8 weeks, all peaks of suprathreshold ABR were significantly smaller and peaks II–V were considerably delayed (see Fig. 3 D; supplemental data 1, available at www.jneurosci.org as supplemental material). The delay was disproportionately increased by hypothermia, but not by elevating the stimulus rate (supplemental data 1, available at www.jneurosci.org as supplemental material).
Figure 1.

CPX I−/− mice are hearing impaired. A, B, ABR audiograms with average thresholds ± SEM of CPX I−/− (gray) and CPX I+/+ (black) littermate mice. The asterisks denote data points with significant threshold differences (*p < 0.05,**p < 0.001, unpaired t test). A, Three- to 4-week-old CPX I−/− mice showed a significant but mild increase of ABR threshold in the midfrequency range. B, Hearing impairment of CPX I−/− mice was more prominent at 6–10 weeks of age [n (CPX I−/−) = 7; n (CPX I+/+) = 9]. The empty squares in B represent the mean ASSR threshold for a 12 kHz tone that was sinusoidally amplitude modulated using individually chosen modulation frequencies >400 Hz (see F). C, D, Average ABR waveforms of individual mice in response to 80 dB click stimuli in animals aged 3–4 weeks (C) [n (CPX I−/−) = 6; n (CPX I+/+) = 5] or 6–10 weeks (D) [n (CPX I−/−) = 8; n (CPX I+/+) = 11]. The bold overlaid traces represent grand averages. E, ASSR, The mean modulation transfer functions (at 80 dB SPL) of 8-week-old CPX I−/− mice (n = 5) showed reduced ASSR amplitudes for all modulation frequencies when compared with the CPX I+/+ littermates (n = 5). F, Amplitude growth functions of ABR wave I and the ASSR peak (individually chosen modulation frequencies between 200 and 400 Hz) of 8-week-old CPX I−/− mice were shifted toward higher stimulation levels but showed comparable slopes as those of the CPX I+/+ littermates. G, DPOAEs at 2f1-f2 were recorded at different primary tone frequencies at stimulus levels of 60 dB and are displayed relative to the noise floor (n = 8 each). H, Growth functions of DPOAE amplitude (n = 7 each; displayed relative to the noise floor) in response to 10/12 kHz primary tones at varying levels. No significant differences in DPOAE levels across frequencies or amplitudes were observed between CPX I−/− and CPX I+/+ mice.
Figure 3.
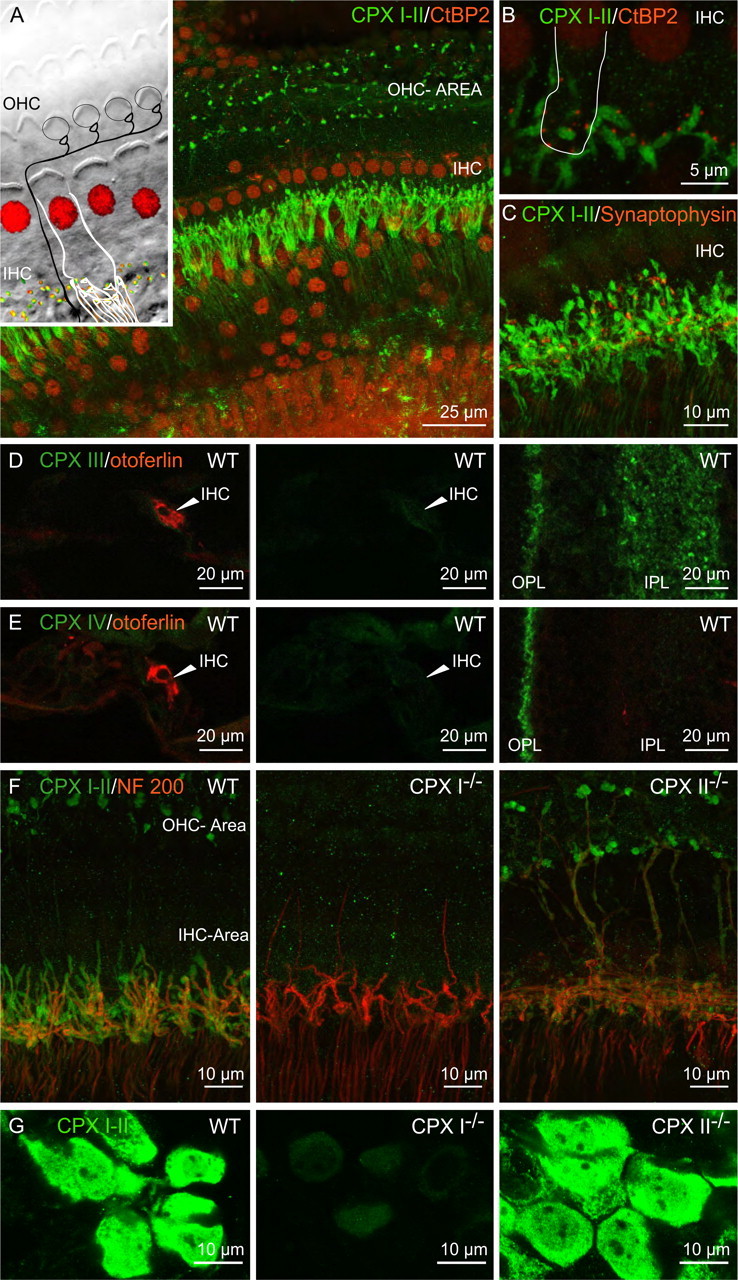
Distribution of CPX I and II protein in the cochlea. The inset of A sketches the afferent innervation of IHCs (white, nucleus stained red) and OHCs by type I (white) and type II (black) SGNs in the organ of Corti. Each of the type I SGNs possesses one peripheral axon, which forms one ribbon synapse with one IHC. Type II SGNs form synapses with several OHCs (not considered in this study). A, B, Representative projections of confocal sections of wild-type organs of Corti that were costained for CPX I/II (green) and CtBP2/RIBEYE (red) at different magnifications. The image represents a projection of confocal sections. The row of IHCs was devoid of a cytosolic CPX I/II immunoreactivity. CPX-positive fibers targeted the row of IHCs and some spot-like immunoreactivity was seen underneath the OHCs (A). CPX-positive fiber endings were juxtaposed to the RIBEYE-labeled ribbons at their contact with the IHCs. No overlap of CPX and RIBEYE immunofluorescence (B). C, Representative projection of confocal sections of a wild-type organ of Corti costained for CPX I/II (green) and synaptophysin (red; efferent synapse marker): juxtaposition rather than merge indicates that CPX resides within afferent SGNs. D, E, Cryosections of cochleae (left, middle panels) and retinas (right panels) of 17-d-old wild-type mice were processed as comparably as possible and stained on the same glass slide for CPX III (D) or IV (E) and otoferlin (IHC marker). The left and right panels show overlay of immunofluorescence for otoferlin (red) and the respective CPX (green). The middle panels show CPX immunofluorescence only. The arrowheads point to IHC in the cochlea sections. OPL, Outer plexiform layer; IPL, inner plexiform layer in the retina sections. The images were acquired with identical microscope settings. F, G, CPX I–II-labeled organs of Corti (projections of confocal sections) (F) and spiral ganglions (single confocal sections) (G) of WT (left panels), CPX I−/− (middle panels), and CPX II−/− (right panels) mice. In F, the colabeling for NF-200 is shown. Experiments were performed in parallel using identical conditions for staining and imaging. To illustrate the weak staining in CPX I−/− SGN somata (G), confocal microscope settings were chosen that resulted in some saturation in the images of wild-type and CPX II−/− SGNs.
A comparable threshold increase was observed in recordings of ASSRs in response to sinusoidally amplitude-modulated 12 kHz tones (Fig. 1 B, open squares). The suprathreshold ASSR of CPX I−/− mice were reduced in amplitude at all modulation frequencies (ASSR modulation transfer function) (Fig. 1 E). Although the steepness of the ABR and ASSR amplitude growth functions appeared normal, both curves were shifted toward higher levels and showed smaller maxima in the mutants (Fig. 1 F; supplemental data 1, available at www.jneurosci.org as supplemental material). The apparent latency estimated from ASSR phase was not significantly changed (2.48 ± 0.25 ms in CPX I−/− mice vs 2.91 ± 0.27 ms in controls).
To examine whether these changes resulted from defects in outer hair cell (OHC) activity, we recorded DPOAEs. DPOAE were obtained at levels comparable with WT mice for stimulus frequencies (f2) equal or larger than 12 kHz (Fig. 1 G) and DPOAE amplitude growth functions recorded at a stimulus frequency of 12 kHz were normal (Fig. 1 H). These data demonstrate that auditory function is impaired in CPX I−/− mice downstream of mechanoelectrical transduction and amplification in the cochlea, most likely because of defective synaptic transmission along the auditory pathway. The normal ABR wave I amplitude and latency in young CPX I−/− mice suggested that the hearing impairment originates downstream of sound encoding at the IHC–SGN synapse. This was studied in detail and is demonstrated below.
To determine whether any other CPX isoforms may be important, we tested auditory function in mice lacking CPXs II, III, IV, or III and IV at the age of 8 weeks. ABR audiograms and ABR to suprathreshold clicks of these mutants were comparable with wild-type littermates (supplemental data 1, available at www.jneurosci.org as supplemental material). Therefore, CPXs II, III, and IV seem to play minor if any roles in normal hearing.
Sound encoding at the IHC synapse is independent of CPXs
We used nested RT-PCR to detect CPX mRNAs in the organ of Corti (which contains IHCs and OHCs, supporting cells, and nerve terminals of afferent and efferent neurons) and modiolus (which contains SGNs) of mice after the onset of hearing (2–4 weeks of age; 3 experiments; 12 mice). In both tissues and in all three experiments, we detected mRNAs for CPXs I, II, and IV, but not for CPX III (Fig. 2 A), which, therefore, was excluded from the additional mRNA expression analysis. Comparative quantitative PCR (qPCR) corroborated these results and further showed that CPX IV had ∼25,000 times weaker expression in the organ of Corti, spiral ganglion, and cerebellum than in the retina (supplemental data 2, available at www.jneurosci.org as supplemental material).
Figure 2.

Analysis of CPX mRNA expression in the cochlea. A, Nested RT-PCR after RNA extraction from brain, retina, and cochlea (manually dissected into modiolus, containing SGNs, and organ of Corti, containing the hair cells). Although CPXs I–IV were readily found in the retina, only CPXs I and II were detected in brain and cochlea after the first round of amplification. After the second round of amplification, we additionally found weak bands for CPX IV but no signal for CPX III in organ of Corti and modiolus. The product sizes of the first round of the PCR are 304, 422, 323, and 300 bp for CPXs I, II, III, and IV, and 127, 292, 202, and 222 bp for the nested PCR. B, The three top panels from the left to right show result of nested single-cell RT-PCR using the primers for CPXs I, II, and IV (PCR products as described in A): None of the investigated IHCs was positive for CPX I, II, or IV RNA. The three bottom panels show corresponding otoferlin cDNA-specific PCR product (217 bp) serving as the positive control of sampling and reverse transcription (detected in each case). No PCR products were observed in the negative controls. The faint bands present in lanes negative for CPX-specific bands and running faster than molecular weight marker represent primers initially added to the PCRs.
To test CPX expression specifically in IHCs, we performed nested single-cell RT-PCR. Although all IHCs (n = 30) expressed otoferlin mRNA (positive control), none contained mRNAs of CPX I, II, or IV (Fig. 2 B) (two experiments; two mice; 3 weeks of age). This result was confirmed by “few-cell” RT-PCR (7 × 5 cells from four mice) (data not shown) and laser-assisted microdissection and subsequent qPCR of tens of IHCs from organs of Corti of 2-week-old mice (five experiments on eight mice) (data not shown). We conclude that the RT-PCR from organs of Corti detects expression of CPXs I, II, and IV in cell types of the organ of Corti other than IHC, perhaps SGNs (see below). In summary, CPX III was not detected in organs of Corti containing thousands of IHCs and CPXs I, II, and IV were not detected by three more specific approaches in IHCs (nested single-cell RT-PCR, “few-cell” RT-PCR and microdissection followed by qPCR). Therefore, analysis of mRNA expression suggests the absence of CPX expression in IHCs.
We confirmed this using immunohistochemical analysis of the abundance of CPX proteins in the cochlea after onset of hearing. For clarity, the diagram (Fig. 3 A, inset) lays out the morphology of the organ of Corti. IHCs and OHCs were labeled using an antibody to C-terminal binding protein 2 (nuclear CtBP2) and the partially homologous ribbon component RIBEYE (Khimich et al., 2005). Both cell types were devoid of immunoreactivity for CPXs I and II in whole mounts of organ of Corti from 8-week-old mice (Fig. 3 A,B) as well as for CPX III and CPX IV immunoreactivity in cochlear cryosections of 3-week-old mice (Fig. 3 D,E). Although we did not detect specific CPX III or IV immunofluorescence in the cochlea, anti-CPX I/II antibodies stained the peripheral axons and postsynaptic terminals of type I SGNs (contacting IHCs) and type II SGNs (contacting OHCs) (Fig. 3 A–C;F, left) and their somata (Fig. 3 G, left). The presence of CPXs I/II in postsynaptic type I SGN terminals but its absence from IHCs is illustrated by the nonoverlapping juxtaposition with hair cell ribbons in Figure 3 B. Moreover, efferent terminals, labeled with antibodies against the presynaptic marker synaptophysin, were not colabeled by CPX I/II antibodies (Fig. 3 C), suggesting that CPXs I and II are not expressed in efferent terminals.
Immunolabeling in knock-outs gave additional insights into CPX expression. Costaining of peripheral SGN by CPX I/II and neurofilament 200 (NF-200) antibodies, as observed in WT mice (Fig. 3 F, left), was found also in CPX II knock-out mice (CPX II−/−) (Fig. 3 F, right). In contrast, CPX I−/− mice had very weak CPX I/II immunoreactivity (Fig. 3 F, middle). The residual staining could indicate low levels of CPX II expression. We tested this by immunohistochemistry of spiral ganglions of newborn CPX I/II double knock-outs, in which we detected a weak staining with the CPX I/II antibody (supplemental data 2, available at www.jneurosci.org as supplemental material). This suggests that the weak CPX I/II immunoreactivity in CPX I−/− mice in Figure 3, F and G (middle), results from nonspecific labeling of the antibody, and not from compensatory expression of CPX II. Together, these results indicate that CPX I is the main CPX isoform expressed in SGNs, whereas IHCs and OHCs do not express any CPX.
Consistent with the lack of CPX I in IHCs, we found a normal presynaptic function of apical IHCs from CPX I−/− mice by in vitro patch-clamp recordings of Ca2+ current and exocytic membrane capacitance increments (at the age of 6–9 weeks; same apical cochlear region) (Fig. 4 A,B). In vivo extracellular recordings from single auditory nerve fibers of 6- to 9-week-old CPX I−/− mice showed normal spontaneous and sound-evoked rates of SGN (Fig. 4 E,F). First-spike latency distributions (data not shown), peak and adapted rates in suprathreshold responses (Fig. 4 F) as well as thresholds (Fig. 4 G) were indistinguishable from those of CPX I+/+ mice and other C57BL/6 wild-type animals.
Figure 4.

Normal presynaptic function of IHCs of 8-week-old CPX I KO mice. A, Representative Ca2+ current (I Ca 2+; bottom panel) and background-subtracted capacitance traces (C m; top panel) recorded from CPX I−/− and CPX I+/+ IHCs stimulated by a 20 ms step depolarization. B, Testing fast (responses to 5 and 20 ms) and sustained (50 ms stimuli) exocytosis in IHC of CPX I+/+ (n = 4 cells) and CPX I−/− (n = 5 cells) mice: C m increments and peak Ca2+ current amplitudes did not differ significantly. C, D, Representative projections of confocal sections obtained from organs of Corti from CPX I+/+ (C) and CPX I−/− (D) mice after staining with antibodies to CtBP2/RIBEYE (red) and glutamate receptors (GluR2/3; green). The line was drawn to illustrate the approximate position of one of the IHCs. Scale bar, 5 μm. E, Representative auditory nerve fiber recordings from CPX I+/+ (black) and CPX I−/− (red) mice illustrating sound-evoked (50 ms tone burst at CF; 30 dB re threshold; 200 repetitions) and spontaneous (50 ms silence) spikes with good (left) and acceptable (right) amplitudes (5 repetitions each). Recordings with inferior signal-to-noise ratios were excluded. F, Average PSTH ± SEM, bin width of 0.5 ms for CPX I−/− (red; n = 21), CPX I+/+ (black; n = 16), and C57BL/6 wild-type (gray; n = 13) mouse auditory nerve fibers for stimulation with 50 ms tone bursts at CF at 30 dB re threshold showing comparable spike rates for both genotypes. G, Thresholds at CF for CPX I−/− (red; n = 31), CPX I+/+ (black; n = 19), and C57BL/6 wild-type (gray; n = 26) auditory nerve fibers.
These cell-physiological presynaptic and postsynaptic findings, together with the expression and ABR data, argue that IHCs use a CPX-independent mechanism of transmitter release. It was possible that the hearing impairment in CPX I−/− mice results from changes in the number of hair cells, SGNs, or in the number of synaptic contacts. We tested this by quantitative analysis of the immunohistochemical data. First, we counted hair cell-to-SGN synapses, by counting presynaptic ribbons (labeled with CtBP2/RIBEYE antibody) that colocalized with postsynaptic clusters of GluR2/3 in whole mounts of the apical cochlear coil (Khimich et al., 2005). In each stack of confocal sections, we counted all synapses and divided them by the number of IHCs (usually five), which we identified by their nuclear CtBP2 labeling (Fig. 4 C,D). We found 9.2 ± 1.7 synapses per IHC (1076 synapses in 113 IHCs, three mice) and 9.9 ± 2.6 synapses per IHC (1186 synapses in 120 IHCs, three mice) for CPX I+/+ and CPX I−/− mice, respectively. Thus, there was no change in the number of synapses. Second, we estimated the density of SGN somata in the cochlear middle turn in hematoxylin/eosin stained midmodiolar sections taken from 16-week-old mice. SGN density was identical in CPX I+/+ (4428 ± 685 SGN per mm2; two mice) and CPX I−/− mice (4465 ± 340 SGN per mm2; two mice). Thus, there appeared to be no differences in the synaptic contacts of type I SGN or in the densities of SGNs.
CPX I is required for normal synaptic transmission in the cochlear nucleus
Since cochlear function seemed mostly unaffected in CPX I−/− mice, we turned to the central auditory pathway to determine the mechanism of the hearing impairment in CPX I−/− mice. First, we explored CPX expression in the AVCN, in which SGN axons in the auditory nerve make synaptic terminals. Labeling by the CPX I/II antibody of brainstem sections from 8-week-old CPX I+/+ mice showed expression in SGN axons and glutamatergic presynaptic terminals (Fig. 5 C, white arrowheads) (costaining for VGLUT1) as well as in the principal cells of the VCN (Fig. 5 A,C). This labeling was mostly absent in CPX I−/− mice (Fig. 5 B,D). Some presynaptic terminals contacting principal cells in the VCN of CPX I−/− (and CPX I+/+) mice were positive for CPX I/II but not for VGLUT1 (Fig. 5 C,D, gray arrowheads), suggesting the expression of CPX II in inhibitory synapses. Our data are in agreement with a previous expression analysis showing CPX I and to a lesser extent CPX II mRNA in the cochlear nucleus by in situ hybridization (Freeman and Morton, 2004). Staining for CPXs III (Fig. 5 E,F) and IV (Fig. 5 G,H) revealed expression of these isoforms neither in the VCN of CPX I+/+ (Fig. 5 E,G) nor of CPX I−/− (Fig. 5 F,H) mice. Both antibodies gave intense staining of the retina (Fig. 5 I,J).
Figure 5.
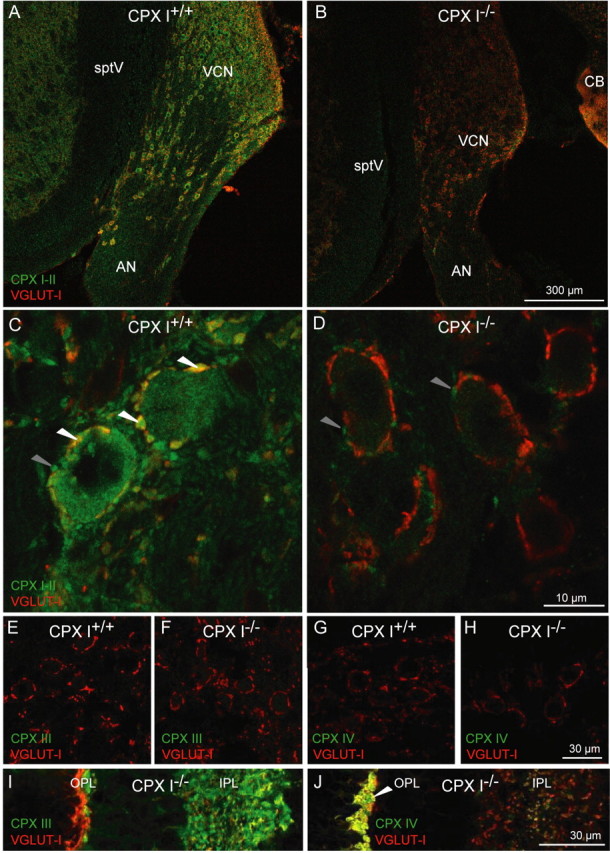
Distribution of CPX I and II protein in the cochlear nucleus. A, B, CPX I is expressed in the cochlear nucleus. Brainstem cryosections of 8-week-old mice were stained using antibodies against CPX I/II (green) and VGLUT1 (red). The VCN showed CPX I/II immunoreactivity in CPX I+/+ (A), but the staining was strongly reduced in CPX I−/− (B) sections. AN, Auditory nerve; CB, cerebellum; sptV, spinal tract of the trigeminal nerve; OPL, outer plexiform layer; IPL, inner plexiform layer. C, D, Higher-resolution confocal images of the auditory nerve entry zone into the cochlear nucleus of 8-week-old CPX I+/+ (C) and CPX I−/− (D) mice. In the wild type, CPX I/II immunofluorescent principal cells of the AVCN are engulfed by a ring-like array of CPX- and VGLUT1-positive spots (white arrowheads). In both CPX I+/+ and CPX I−/−, there were some CPX I/II-positive spots that were not costained with VGLUT1, presumably representing CPX II-expressing inhibitory synapses (gray arrowheads). The images in A,B and C,D were acquired at the same settings to illustrate the much-reduced CPX I/II immunofluorescence in the presynaptic and postsynaptic compartments of the CPX I−/− cochlear nucleus. E–J, Absence of CPX III and CPX IV in the cochlear nucleus. Brainstem cryosections of 8-week-old CPX I+/+ (E, G) and CPX I−/− (F, H) mice were stained using antibodies against CPX III (green; E, F) or CPX IV (green; G, H) and VGLUT1 (red). I, J, Cryosections of the retina of a CPX I−/− animal processed together with E–H and imaged with the same settings to demonstrate the absence of CPX III and IV immunofluorescence in the brainstem.
Next, we performed recordings from bushy cells in the AVCN in acute brainstem slices taken from mice aged 15–21 d. We stimulated single presynaptic SGN inputs to bushy cells and characterized synaptic transmission at the endbulb of Held. The initial EPSC of endbulb synapses in CPX I−/− mice was approximately fivefold smaller [p < 0.01, Kolmogorov–Smirnov (KS) test] (Fig. 6 A, left, gray) than in CPX I+/+ littermates (Fig. 6 A, left, black), but EPSC kinetics were unchanged (half-width: 0.38 ± 0.02 ms for CPX I+/+ vs 0.42 ± 0.02 ms for CPX I−/−; n = 11 for each; p = 0.2, t test) (Fig. 6 A, right). In addition, we observed a significantly lower mEPSC frequency (p < 0.001, KS test) (Fig. 6 B, left). However, the mEPSC amplitude was unchanged (p > 0.5), indicating that vesicular transmitter load and postsynaptic AMPA receptors are unaffected in CPX I−/− mice (Fig. 6 B, right).
Figure 6.

CPX I has a positive role in synaptic transmission from spiral ganglion neurons to bushy cells in the AVCN—slice physiology. Data are from patch-clamp recordings in brain slices from CPX I+/+ or CPX I+/− (black) and CPX I−/− (gray) mice. A, Left, Representative EPSCs measured in CPX I+/+ and CPX I−/− slices. These EPSCs are also shown scaled to the same peak height, showing no effect of CPX I on EPSC time course. Right, Cumulative histograms of EPSC amplitude for 11 CPX I+/+ cells and 20 CPX I−/− cells. EPSCs are significantly smaller in CPX I−/− cells (see Results). B, Effect of CPX I on average mEPSC frequency (left) and amplitude (right). Data are shown as cumulative histograms of 25 CPX I+/+ and 21 CPX I−/− cells. Frequency is significantly lower, but amplitude is unchanged (see Results). C, CPX I−/− endbulbs have a higher paired-pulse ratio (PPR). Data are averages of six CPX I+/+ and nine CPX I−/− cells. The lines here and in D are fits to the data using a model of short-term plasticity at the endbulb (supplemental data 4, available at www.jneurosci.org as supplemental material), in which all model parameters were held constant, except for the initial probability of release. D, CPX I ablation affects short-term plasticity during high-frequency firing. The top traces are representative EPSCs in response to trains of 20 stimuli at 100 Hz in CPX I+/+ or CPX I−/− cells. The bottom graph summarizes average EPSC amplitudes throughout the train normalized to the amplitude of the first EPSC (EPSC1) for CPX I+/+ cells (n = 8) and CPX I−/− cells (top gray symbols; n = 18). To compare absolute amplitudes, the CPX I−/− data were scaled by the ratio of the average EPSC1 in CPX I−/− to the average EPSC1 in CPX I+/+, yielding the bottom gray symbols. This shows that EPSC amplitudes are similar after the second pulse in the train. E, Effect of CPX I on RRP (left) and initial P r (right). Data are shown as cumulative histograms for 8 CPX I+/+ cells and 17 CPX I−/− cells. RRP is not significantly different in CPX I−/−, but P r is significantly lower (see Results). F, Example traces and spike rasters showing effects of CPX I−/− on bushy cell firing in response to 200 Hz auditory nerve fiber stimulation. The vertical marks indicate stimulus times. The dashed line in the rasters indicates the start of the stimulus train. G, Effects of CPX I on bushy cell firing. Early in trains, the probability of spiking is greatly reduced (top). The latency (middle) and jitter (bottom) were also slightly greater. Data are averages of 7 CPX I+/− and 12 CPX I−/− cells. Error bars indicate SEM. The asterisks indicate points that are significantly different (p ≤ 0.05) between the two strains for at least two of the three frequencies analyzed (for details, see supplemental Table S1, available at www.jneurosci.org as supplemental material).
Next, we studied short-term plasticity in CPX I+/+ and CPX I−/− endbulb synapses using pairs and trains of pulses. Paired-pulse responses in CPX I+/+ mice differed somewhat from other mouse strains [CBA/CaJ (Yang and Xu-Friedman, 2008); black Swiss (M. A. Xu-Friedman and W. G. Regehr, unpublished observations)], in that depression was not as pronounced and was partially occluded by a briefly facilitating component (Fig. 6 C). We did not examine the basis for this further. Importantly, CPX I−/− littermates showed no depression at any interval tested, consistent with a decrease in probability of release (P r) (Zucker and Regehr, 2002; Wang and Manis, 2005). Using trains, we observed facilitation of CPX I−/− endbulb synapses at all stimulation frequencies tested (100, 200, and 333 Hz) (Fig. 6 D), which are in the range of spike rates that are observed in vivo (Fig. 4) (Sachs and Abbas, 1974; Taberner and Liberman, 2005). To compare EPSC amplitudes between the two strains throughout the train, we scaled the normalized train data from CPX I−/− slices by a factor of 0.2 (to match the amplitudes of the first EPSC) (Fig. 6 D, bottom gray traces). This indicated that EPSCs after the first two pulses of the train were quite similar in amplitude in CPX I+/+ and CPX I−/− slices (Fig. 6 D), suggesting they might be similarly effective at driving bushy cell spiking later in trains of activity.
To determine the mechanism underlying reduced EPSC size and mEPSC frequency as well as altered short-term plasticity, we estimated the size of the RRP and P r by the integration method (Schneggenburger et al., 1999) (see Materials and Methods). We found that the RRP was not significantly affected in CPX I−/− endbulbs (p > 0.2, KS test) (Fig. 6 E, left) but P r was fourfold lower (0.08 ± 0.01 vs 0.35 ± 0.02; p < 0.01, KS test) (Fig. 6 E, right). Using the integration method, Lou et al. (2008) found that estimates of pool size in the calyx of Held depended on the external calcium concentration, suggesting that Pr might affect the ability to deplete the releasable pool, which is a necessary step for this method to yield accurate results. This is potentially an issue here, as the Pr in CPX I−/− mice appears to be low. Increasing extracellular [Ca2+] to 3 mm increased the initial EPSC amplitude and switched short-term plasticity from facilitation to depression in CPX I−/− endbulbs consistent with an increase in Pr. When applying the integration approach in both 1.5 mm [Ca2+] and 3 mm [Ca2+] for eight CPX I−/− synapses, the pool size estimates were not significantly different [RRP(3 mm [Ca2+])/RRP(1.5 mm [Ca2+]) = 1.06 ± 0.13; p < 0.001]. Thus, the integration approach appears to yield consistent estimates under our conditions. For our overall measurement of RRP in KOs, we pooled the results of these cells (averaged across the two calcium conditions) with cells measured in only 1.5 mm [Ca2+].
To understand whether the simple change in P r could account for the differences observed in voltage clamp, we used a model of endbulb short-term plasticity (see Fig. 9). This model incorporates facilitation and depletion of synaptic vesicles and is based on kinetic models of other synapses (Tsodyks and Markram, 1997; Dittman et al., 2000). We adjusted parameters to duplicate the average behavior of endbulbs in control mice, using a least-square approach. We used the average P r values measured in Figure 6 E (0.35 for CPX I+/+ and 0.08 for CPX I−/−) to drive the model while keeping all other parameters the same, and found that it matched reasonably well the EPSC amplitudes measured in voltage clamp (Fig. 6 C,D).
Figure 9.

Flow chart of the computational modeling. The model consists of several modules, each mimicking the behavior of a part of the auditory pathway, including inner hair cell synaptic transmission and triggering of action potentials in SGNs (step 1), synaptic plasticity at the endbulb of Held (step 2), and the synaptically driven action potential generation in bushy cells (step 3). The figures show the output of the individual steps for a single run of an example configuration: three SGNs with a low spontaneous rate and one SGN with a high spontaneous rate driving one wild-type bushy cell. EPSCamp was set to 3.2 times the threshold for action potential initiation at rest (i.e., suprathreshold fibers).
To evaluate how the reduction of P r could affect the reliability and timing of bushy cell action potential generation, we made recordings from bushy cells in current clamp and stimulated presynaptic auditory nerve fibers (Fig. 6 F). In normal CPX I+/− mice, bushy cells fired spikes highly reliably in response to 100 and 200 Hz stimulation, and less so for 333 Hz stimulation (Fig. 6 F,G). Spike latency and jitter (SD) increased slightly throughout the train (Fig. 6 G), similar to other mouse strains [Black Swiss (Xu-Friedman and Regehr, 2005); CBA/CaJ and DBA/2J (Wang and Manis, 2006)]. All these effects are consistent with the short-term depression seen in voltage clamp, as smaller EPSPs would be expected to cross threshold later. Bushy cell spiking in CPX I−/− mice was quite different. Spike probability was much lower at the beginning of the train but increased to the values of CPX I+/− control mice by the fifth stimulation (Fig. 6 F,G). We tested whether the initial difference in spike probability arose from differences in bushy cell intrinsic properties. We measured spike threshold, resting membrane potential, and input resistance, and found no significant differences (supplemental data 3, available at www.jneurosci.org as supplemental material). Instead, the difference in spiking appears to result from the differences in synaptic transmission visible in the voltage-clamp data, in which the first EPSC was small, and subsequent EPSCs showed facilitation (Fig. 6 A,D). In the current-clamp experiments, the combination of facilitating and summating EPSPs probably eventually crossed spike threshold. When spikes were elicited by synaptic transmission, they occurred at slightly longer latency than in CPX I+/− mice and with slightly higher jitter (Fig. 6 G), but there are evidently no gross defects in spike generation in CPX I−/− mice. Thus, the effects in current clamp are all consistent with the lower P r seen in voltage clamp (Fig. 6 A,C–E).
CPX I−/− endbulbs also showed increased delayed release. Delayed release, also called asynchronous release, is influenced by presynaptic calcium levels but shows much lower temporal precision than the normal, synchronous EPSC (Goda and Stevens, 1994; Atluri and Regehr, 1998; Sun et al., 2007). Delayed release is found at all synapses, including normal endbulbs (Fig. 7 A,D), and was quantified by detecting individual release events. Delayed release increased with the stimulation rate (Fig. 7 B,C) and was threefold to fourfold greater in CPX I−/− endbulbs than in CPX I+/+ endbulbs (Fig. 7 B,C). We saw parallel effects in current clamp, with some cells showing considerable depolarization long after the end of the train (Fig. 7 D). One consequence we observed was the appearance of spikes that were not triggered by SGN stimulation (Fig. 7 D). These misplaced spikes were observed in 7 of 11 CPX I−/− endbulbs, but never in CPX I+/− endbulbs (Fig. 7 E). Misplaced spikes contributed up to 4 spikes/s after trains of the highest stimulation rates.
Figure 7.

Delayed release is enhanced in CPX I−/− endbulbs. A, Example voltage-clamp traces in CPX I+/+ and CPX I−/− bushy cells, showing increased delayed release after 333 Hz stimulation. The insets are magnified fivefold for the time period after the train. The horizontal calibration applies to all traces in A and D. B, Average time course of delayed release in the first 100 ms after the end of 20 pulse, high-frequency trains. The symbols are as in Figure 6, D and G. Data are averages of eight (CPX I+/+) or nine (CPX I−/−) experiments. C, Total delayed release integrated over the first 100 ms after a train. Delayed release increases with stimulation frequency. Delayed release in CPX I−/− endbulbs is significantly greater than in CPX I+/+ for all frequencies (p < 0.01). D, Example current-clamp traces in CPX I+/− and CPX I−/− bushy cells showing increased delayed release, as well as misplaced spikes (inverted triangle). The dashed line corresponds to a membrane voltage of −60 mV. E, Average number of misplaced spikes, measured over the first 40 ms after the train. No misplaced spikes were detected in any CPX I+/− endbulbs (n = 7 cells), and CPX I−/− endbulbs showed considerable variability (n = 11 cells). Misplaced spikes were significantly elevated for 100 and 333 Hz cases (p < 0.05). Error bars indicate SEM.
The auditory system provides the opportunity to directly test the functional consequences of a synaptic deficit in SGN afferents, by examining the spiking of auditory neurons in response to acoustic stimuli in vivo. We focused on the responses of single units in the VCN of 8- to 11-week-old CPX I−/− and CPX I+/+ mice. Principal AVCN neurons were functionally identified based on FSL, interspike interval, and spike waveform (Kopp-Scheinpflug et al., 2002; Taberner and Liberman, 2005). Bushy cells were identified based on discharge patterns that were primary-like or primary-like with notch (Fig. 8). We quantified the degree of frequency tuning using Q 10, which is the CF divided by the bandwidth at 10 dB above threshold. Q 10 was normal in both classes of neurons of CPX I−/− mice (CPX I−/−, 2.26; CPX I+/+, 2.69; p = 0.8), which provides additional confirmation that cochlear amplification is normal. We found sound thresholds (measured at the CF) (Fig. 8 A) to be significantly elevated in mutant AVCN cells (Mann–Whitney rank sum test, p = 0.032; chopper cells, p = 0.006). On suprathreshold stimulation, we found reduced onset rates but increased adapted rates, whereas both the average evoked and spontaneous rates were indistinguishable between CPX I−/− and CPX I+/+ bushy cells (Fig. 8 B,C). The FSL was significantly prolonged in CPX I−/− bushy cells (median latency CPX I−/−, 11.2 ms, vs CPX I+/+, 4.1 ms) and had larger jitter across the sampled population (Fig. 8 D). Several CPX I+/+ bushy cells showed extremely low FSL jitter (exemplified by the cell shown in Fig. 8 E, top right, white bars), which approached the synaptic jitter observed in vitro in response to the regular and reliable activation of a single endbulb of Held synapse (Fig. 6 G). Such low jitter was never observed in the mutants. Most CPX I−/− bushy cells exhibited very broad FSL distributions (exemplified by the cell in Fig. 8 E, top left, gray bars), which were greater than those found in CPX I+/+ bushy cells. Thus, CPX I appears to play a role in reducing the latency and jitter of AVCN neuron spiking in response to sound onset.
Figure 8.

CPX I has a role in synaptic transmission from spiral ganglion neurons to neurons of the ventral cochlear nucleus—in vivo experiments. A, Sound thresholds of AVCN neurons (bushy and multipolar neurons) at their CF: threshold elevation in CPX I-deficient mutants. B, Dot raster displays of CPX I+/+ and CPX I−/− bushy cells in response to 100 ms tone bursts (at CF and 80 dB SPL, 50 stimulus repetitions: see schematic representation in the top panel). The example cells were chosen to represent cases of narrow FSLs distributions (right column) and broad FSL distributions (left column). The FSL distributions are shown in E, top panel. Bottom panel, Average PSTH of CPX I+/+ (black) and CPX I−/− (gray) bushy cells (bin width, 1 ms). The pronounced onset activity seen in the initial peak in the CPX I+/+ cell was reduced and delayed in the CPX I−/− cells (left arrow). Moreover, activity of many CPX I−/− cells outlasted the stimulus offset, which is in stark contrast to the poststimulus reduction in spontaneous rate typically observed in CPX I+/+ (right arrow). C, Spontaneous and sound-evoked firing rates of CPX I−/− and CPX I+/+ bushy cells were recorded before, during, and after a 100-ms-long stimulus. Average rates were calculated for the whole stimulation time of 100 ms, onset rates were averaged over 10 ms beginning at the respective FSL of the unit, adapted rates were acquired during the plateau phase of the PSTH (50–100 ms), and offset rates were averaged over 10 ms after the end of the stimulus. Error bars indicate SEM. D, Distribution of FSLs for CPX I−/− and CPX I+/+ bushy cells: averaged from all cells in each groups after normalization for the number of trials: delayed mean latency and broader distribution in CPX I−/− bushy cells (bin width, 2 ms; each cell contributes the same area to the histogram regardless of the number of trials). E, Examples of FSL distributions from individual bushy cells (top panels) and corresponding simulated distributions (bottom panels) created to match experiments. Wild-type cells (open bars) in the top panels are chosen as typical examples from the group of cells with very high FSL jitter (left) and very low FSL jitter (right) (see Results). The model was used to approximate the experimental data: the sharp distribution was reproduced when assuming subthreshold input from 20 SGNs (for details, see supplemental material, available at www.jneurosci.org). The broader distribution could be reproduced assuming input from only two SGNs, each of which could drive AP generation in the bushy cell. The gray bars in the bottom panel result from models with identical input but reduced initial release probability at the endbulb of Held. This resembles the effects of CPX I ablation and leads in the model to FSL distributions that resemble experimental findings on mutant bushy cells (gray bars, top panels). F, Analysis of FSLs in responses to sounds of 80 dB SPL: increased latency and jitter in VCN units of CPX I−/− mice.
To determine whether the changes in P r seen in voltage clamp in vitro could underlie bushy cell FSLs observed in vivo, we turned to computational modeling of the signaling cascade from auditory nerve activity to bushy cell spiking. The model consisted of three modules, describing first the sound-driven action potential generation in the SGNs; second, the synaptic transmission at the endbulb of Held; and third, the action potential generation in the bushy cell itself (Fig. 9). Some of the parameters that determine bushy cell firing are not yet well established in the mouse (e.g., number of auditory nerve fiber inputs per bushy cell, firing rates, and dynamic ranges of the converging SGN inputs). However, operationally, we were able to replicate the FSL patterns observed in CPX I+/+ bushy cells in vivo using a model with reasonable parameters (for details, see supplemental data 4, available at www.jneurosci.org as supplemental material). Importantly, P r was set to values close to the average for CPX I+/+ bushy cells determined in vitro (Fig. 6), whereas the parameters describing the SGN input were chosen to match the in vivo findings for wild-type bushy cells. When P r was lowered to 25% as observed on average for CPX I−/− endbulbs of Held, while all other parameters of the model were fixed, the FSL distributions changed dramatically, resembling the observations for CPX I−/− bushy cells in vivo (Fig. 8 E).
Because of the variability in response types in vivo, we considered two categories separately. The first category comprises those bushy cells that display extremely narrow FSL distributions with SDs <300 μs. In control animals, almost 25% fall in this category. Our simulations suggested that input from 20 to 40 SGNs is necessary to achieve such a reliable timing of the first spike (but see below for an alternative possibility). However, CPX I−/− cells generally had SDs larger than 2 ms (Fig. 8 F). To replicate this difference between CPX I+/+ and CPX I−/− bushy cells in our model by a change in Pr alone, the majority of the respective 20–40 synapses had to operate far below the threshold of action potential generation in the bushy cell (i.e., subthreshold input) (Fig. 8 E, right panels).
We therefore looked for alternative schemes that could explain highly reliable FSLs without the need of fine-tuned parameters. One possibility is a two-step convergence in which few subthreshold fibers converge onto bushy cells, which are in turn coupled by gap junctions to create small networks of 5–10 bushy cells (supplemental data 4, available at www.jneurosci.org as supplemental material). If such an electrical coupling implemented a simple “first triggers all” mechanism, it would sharpen the first spike latency distribution in the connected bushy cells. Initial simulations showed that, in a network of eight bushy cells, each receiving five SGNs, the first spike times are as reliable as in a bushy cell receiving 20 SGNs with the same EPSCamp. Because of the lower redundancy of input, a reduction of Pr to 25% has a very strong impact on the network of bushy cells, leading to sparse firing with large variability in first spike timing (data not shown). Although the presence of the morphological structures that correspond to gap junctions has been demonstrated in the cochlear nucleus (Sotelo et al., 1976; Gomez-Nieto and Rubio, 2009), it is not clear whether these structures are functional and in which way they influence bushy cell firing. The hypothesis of a bushy cell network needs to be explored in the future.
The second category of cells, which comprises another 25% of the recorded CPX I+/+ bushy cells, displays broad distributions with a SD of >2.5 ms. The model mimicked these response properties provided the bushy cells received few SGN inputs, and each input could drive AP generation in the bushy cell (i.e., suprathreshold inputs). When P r was reduced to match the CPX I−/− condition, the inputs became subthreshold, causing an increase in variability of the FSL, similar to the in vivo results (Fig. 8 E, left panels). Thus, a change in Pr alone was fully able to account for the changes in FSL seen in CPX I−/− cells compared with CPX I+/+ bushy cells.
Discussion
We studied hearing in CPX knock-out mice to analyze CPX function in a system that naturally operates synaptic transmission at high rates and with precise timing. We demonstrated that the lack of CPX I reduced the normally high resting release probability at the endbulb of Held synapse in the AVCN. This elevated the auditory threshold of AVCN neurons and diminished their ability to reliably convey precise timing information about sound onset. In addition, we found that the mutation enhanced asynchronous spiking of bushy cells after the stimulus offset. Together, these changed properties degrade the synchronization of afferent transmission to the stimulus envelope, which is likely to impair the discrimination of temporally structured acoustic stimuli. Unlike the retina, CPXs III and IV seem not to operate at the sensory ribbon synapses of the cochlea, which we propose to be the first documented case showing CPX-independent synchronous neurosecretion.
Role of CPX I in auditory function
Our analysis of CPX mRNA and protein expression in the cochlea shows that SGN, but not hair cells, express CPX I. Consistent with previous findings (McMahon et al., 1995; Reim et al., 2001, 2005), the CPX I immunofluorescence was diffusely distributed in the SGN cytosol including their peripheral postsynaptic terminals that contact the IHCs. It remains to be tested whether those terminals contain additional presynaptic specializations, potentially enabling them for reciprocal transmission (Sobkowicz et al., 1993; Thiers et al., 2008). Interestingly, we did not find positive evidence for CPX expression in olivocochlear efferent fibers. We also observed CPX I immunoreactivity in the principal neurons of the cochlear nucleus. Our study demonstrated a requirement for CPX I in transmission at the endbulb of Held synapse in the cochlear nucleus. There, we found a near fivefold reduction of initial EPSC size and a fourfold lower resting release probability in the absence of CPX I. The size of the RRP of vesicles, estimated by the integration method, was not significantly changed, which agrees with previous work on CPX I/II-deficient cultured neonatal hippocampal neurons (Reim et al., 2001) but contrasts with CPX II-deficient chromaffin cells (Cai et al., 2008). Whether this reflects methodological differences or disparities between synaptic vesicle and large dense core exocytosis remains to be clarified.
Lack of CPX I altered short-term synaptic plasticity. The observed switch from short-term depression to initial facilitation reflects the lowered release probability (Zucker and Regehr, 2002), which is in agreement with previous studies on CPX I/II-deficient cultured neonatal hippocampal neurons (Reim et al., 2001). Our findings indicate that CPX I ensures the high resting release probability at physiological [Ca2+]e at the endbulb of Held synapse, which is consistent with a positive function of CPXs in vesicle fusion. This may involve SNARE complex stabilization and/or a facilitating action of the CPX N terminus (Brose, 2008). Endbulbs of CPX I−/− mice recorded in the third postnatal week showed a reduced rate of spontaneous synaptic transmission, which is in line with a recent report on CPX I/II/III-deficient neonatal hippocampal neurons in culture and neonatal neurons of the pre-Bötzinger complex in slices (Xue et al., 2008), but in contrast to the increased spontaneous release observed in Drosophila neuromuscular junction lacking CPX (Huntwork and Littleton, 2007) and a recent report on cultured neonatal hippocampal neurons (Maximov et al., 2009). Interestingly, we found enhanced asynchronous release at the endbulb synapse, contributing to continued postsynaptic firing after the cessation of the stimulus. At present, we cannot rule out that changes of presynaptic Ca2+ signaling, of presynaptic and/or postsynaptic inhibition, or of postsynaptic excitability contribute to these phenomena. Where measured, Ca2+ currents were found unaltered in CPX-deficient neurosecretory preparations (Cai et al., 2008). Moreover, VGLUT-1-negative (most likely representing inhibitory) terminals contacting the bushy cells seemed positive for CPX II (Fig. 5), which would probably compensate the loss of CPX I (Reim et al., 2001). Deaf mice have enhanced delayed release at synapses of the auditory brainstem [dn/dn mice (Oleskevich et al., 2004); Black Swiss (M.A. Xu-Friedman and W.G. Regehr, unpublished observations)]. This may result from some form of homeostatic plasticity related to their auditory insensitivity, which could potentially also apply to CPX I−/− mice. If, however, delayed release was specifically caused by the lack of CPX from the endbulb synapse, it could reflect a more general perturbation of the fusion reaction (e.g., because of impaired interaction of synaptotagmin 1 with the SNARE complex in the absence of CPX I). Future experiments will be required to distinguish these possibilities.
Here, we combined the in vitro analysis of synaptic transmission at the endbulb of Held with in vivo analysis of sound-evoked firing of single cochlear bushy cells, and with population responses of the auditory pathway. This enabled us to demonstrate a number of functional consequences of the CPX knock-out: decreased reliability and temporal precision of sound onset and offset coding, and reduced size and increased delay of central auditory ABR peaks. Transmission of sound onset information in CPX I−/− mice was poor, because the low initial release probability of endbulb of Held synapses permitted only very small EPSPs. Only as the EPSPs facilitate, they reliably cross spike threshold. The subthreshold EPSPs were evident in the in vitro recordings (Fig. 6 F), and the resulting synaptic failures were observable as prolonged FSL and reduced onset rate in the in vivo experiments (Fig. 8 C,F) and as peak delay and amplitude decrement in ABR measurements (Fig. 1). The reasons for the worsening of ABR from 3 to 8 weeks in CPX I−/− remain uncertain. We did not observe a significant reduction of SGN or IHC synapse number or in auditory nerve fiber function when compared with wild-type littermates. Moreover, there was no additional relative increase in ABR thresholds up to 4 months of age, which would have been expected for an ongoing degeneration.
In both CPX I+/+ and CPX I−/−, there was a broad range of FSL distributions. However, removal of CPX I led to an increase in average latency and jitter (Fig. 8 F). Most notably, no distributions with average latencies <4 ms or SDs <1 ms could be found in CPX I−/− mice. This suggests that most, if not all, of the SGN synapses are affected by the loss of CPX I. This notion is corroborated by the fact that all endbulbs characterized in voltage clamp showed a reduced resting probability of release and further by the absence of CPX I/II immunofluorescence from VGLUT1-positive synapses in the CPX I−/− mice. The large range of FSL distributions can be replicated in the model if the number and synaptic strength of the inputs is varied over a large range or if electrical coupling is assumed for clusters of bushy cells. It seems plausible that the impaired transmission of information on sound onset and offset in CPX I mutant may cause difficulties to discriminate temporally structured stimuli such as vocalizations that are relevant for maternal and mating behavior. Future behavioral studies will be required to properly address this question.
Can synapses work without CPXs?
One surprising observation of our study was that CPXs seem dispensable for synaptic transmission at the IHC ribbon synapse. Although we cannot ultimately exclude CPX expression by IHCs, the data obtained by various approaches argue against a role of CPXs in hair cell synaptic transmission. First, we did not detect mRNAs of any CPX isoform by single-cell RT-PCR. Second, none of the anti-CPX antibodies at our disposal resulted in a specific labeling of IHCs. Third, we found normal hearing in CPX II single mutants, as well as in CPX III and/or CPX IV knock-out mice, which have impaired vision probably because of impaired transmission at retinal ribbon synapses (Reim et al., 2009). Finally, synaptic transmission at the IHC synapse, assayed by recordings of Ca2+ currents and exocytic membrane capacitance changes as well as by preliminary in vivo recordings of auditory nerve fiber responses to sound stimulation, was normal in CPX I−/− mice and hence cannot account for their hearing impairment.
How does the hair cell synapse then achieve synchronous transmitter release in the absence of CPX? One of the few currently established differences of the molecular composition of ribbon synapses of eye and ear is the expression of the large-multi-C2 domain protein otoferlin (Roux et al., 2006), which is restricted to inner ear hair cells. Otoferlin has been suggested to play a role as Ca2+ sensor of hair cell transmitter release, based on the exocytosis phenotype of otoferlin-deficient hair cells and similarities to synaptotagmins such as Ca2+ and SNARE binding (Roux et al., 2006). A cooperation of synaptotagmin and CPX in SNARE complex regulation has been proposed (Tang et al., 2006), whereby synaptotagmin displaces CPXs from SNARE complexes in a Ca2+-dependent manner. It is tempting to speculate that a synapse using otoferlin instead of synaptotagmin does not require CPXs either.
Footnotes
This work was supported by a Max Planck Society Tandem-Project grant (N.B., T.M.); the German Federal Ministry of Education and Research [Bernstein Center Grant 01GQ0433 (T.M.)]; the German Research Foundation [fellowship (N.S.); Center for Molecular Physiology of the Brain Grant FZT-103 (N.B., T.M.); a grant to Dr. R. Rübsamen, University of Leipzig, Leipzig, Germany (supporting C.K.-S.)]; a European Council Eurohear grant (T.M.); and National Institutes of Health Grant DC008125 (M.A.X.-F.). A.N. is a Fellow of the Bernstein Center for Computational Neuroscience Göttingen. We thank M.C. Liberman for ample mentoring concering auditory nerve fiber recordings and A. Gehrt, M. Köppler, M. Degenhardt, and C. Rüdiger for expert technical assistance. This study was designed by T.M. and N.B. with contributions of N.S., M.A.X.-F., D.K., C.K.-S., and K.R. The experimental work was performed by N.S., D.K., K.R., C.K.-S., A.V.B., and S.C. A.N. performed the computational modeling, collaborating with M.A.X.-F. T.M., N.S., D.K., M.A.X.-F., C.K.-S., A.N., and N.B. prepared this manuscript.
References
- Atluri PP, Regehr WG. Delayed release of neurotransmitter from cerebellar granule cells. J Neurosci. 1998;18:8214–8227. doi: 10.1523/JNEUROSCI.18-20-08214.1998. [DOI] [PMC free article] [PubMed] [Google Scholar]
- Brandt A, Striessnig J, Moser T. CaV1.3 channels are essential for development and presynaptic activity of cochlear inner hair cells. J Neurosci. 2003;23:10832–10840. doi: 10.1523/JNEUROSCI.23-34-10832.2003. [DOI] [PMC free article] [PubMed] [Google Scholar]
- Brose N. For better or for worse: complexins regulate SNARE function and vesicle fusion. Traffic. 2008;9:1403–1413. doi: 10.1111/j.1600-0854.2008.00758.x. [DOI] [PubMed] [Google Scholar]
- Cai H, Reim K, Varoqueaux F, Tapechum S, Hill K, Sørensen JB, Brose N, Chow RH. Complexin II plays a positive role in Ca2+-triggered exocytosis by facilitating vesicle priming. Proc Natl Acad Sci U S A. 2008;105:19538–19543. doi: 10.1073/pnas.0810232105. [DOI] [PMC free article] [PubMed] [Google Scholar]
- Dittman JS, Kreitzer AC, Regehr WG. Interplay between facilitation, depression, and residual calcium at three presynaptic terminals. J Neurosci. 2000;20:1374–1385. doi: 10.1523/JNEUROSCI.20-04-01374.2000. [DOI] [PMC free article] [PubMed] [Google Scholar]
- Freeman W, Morton AJ. Differential messenger RNA expression of complexins in mouse brain. Brain Res Bull. 2004;63:33–44. doi: 10.1016/j.brainresbull.2003.12.003. [DOI] [PubMed] [Google Scholar]
- Fuchs PA. Time and intensity coding at the hair cell's ribbon synapse. J Physiol. 2005;566:7–12. doi: 10.1113/jphysiol.2004.082214. [DOI] [PMC free article] [PubMed] [Google Scholar]
- Giraudo CG, Eng WS, Melia TJ, Rothman JE. A clamping mechanism involved in SNARE-dependent exocytosis. Science. 2006;313:676–680. doi: 10.1126/science.1129450. [DOI] [PubMed] [Google Scholar]
- Giraudo CG, Garcia-Diaz A, Eng WS, Chen Y, Hendrickson WA, Melia TJ, Rothman JE. Alternative zippering as an on-off switch for SNARE-mediated fusion. Science. 2009;323:512–516. doi: 10.1126/science.1166500. [DOI] [PMC free article] [PubMed] [Google Scholar]
- Goda Y, Stevens CF. Two components of transmitter release at a central synapse. Proc Natl Acad Sci U S A. 1994;91:12942–12946. doi: 10.1073/pnas.91.26.12942. [DOI] [PMC free article] [PubMed] [Google Scholar]
- Gomez-Nieto R, Rubio ME. A bushy cell network in the rat ventral cochlear nucleus. J Comp Neurol. 2009 doi: 10.1002/cne.22139. in press. [DOI] [PMC free article] [PubMed] [Google Scholar]
- Huntwork S, Littleton JT. A complexin fusion clamp regulates spontaneous neurotransmitter release and synaptic growth. Nat Neurosci. 2007;10:1235–1237. doi: 10.1038/nn1980. [DOI] [PubMed] [Google Scholar]
- Isaacson JS, Walmsley B. Receptors underlying excitatory synaptic transmission in slices of the rat anteroventral cochlear nucleus. J Neurophysiol. 1995;73:964–973. doi: 10.1152/jn.1995.73.3.964. [DOI] [PubMed] [Google Scholar]
- Khimich D, Nouvian R, Pujol R, Tom Dieck S, Egner A, Gundelfinger ED, Moser T. Hair cell synaptic ribbons are essential for synchronous auditory signalling. Nature. 2005;434:889–894. doi: 10.1038/nature03418. [DOI] [PubMed] [Google Scholar]
- Kopp-Scheinpflug C, Dehmel S, Dörrscheidt GJ, Rübsamen R. Interaction of excitation and inhibition in anteroventral cochlear nucleus neurons that receive large endbulb synaptic endings. J Neurosci. 2002;22:11004–11018. doi: 10.1523/JNEUROSCI.22-24-11004.2002. [DOI] [PMC free article] [PubMed] [Google Scholar]
- Lindau M, Neher E. Patch-clamp techniques for time-resolved capacitance measurements in single cells. Pflügers Arch. 1988;411:137–146. doi: 10.1007/BF00582306. [DOI] [PubMed] [Google Scholar]
- Lou X, Korogod N, Brose N, Schneggenburger R. Phorbol esters modulate spontaneous and Ca2+-evoked transmitter release via acting on both Munc13 and protein kinase C. J Neurosci. 2008;28:8257–8267. doi: 10.1523/JNEUROSCI.0550-08.2008. [DOI] [PMC free article] [PubMed] [Google Scholar]
- Maximov A, Tang J, Yang X, Pang ZP, Südhof TC. Complexin controls the force transfer from SNARE complexes to membranes in fusion. Science. 2009;323:516–521. doi: 10.1126/science.1166505. [DOI] [PMC free article] [PubMed] [Google Scholar]
- McMahon HT, Missler M, Li C, Südhof TC. Complexins: cytosolic proteins that regulate SNAP receptor function. Cell. 1995;83:111–119. doi: 10.1016/0092-8674(95)90239-2. [DOI] [PubMed] [Google Scholar]
- Melia TJ., Jr Putting the clamps on membrane fusion: how complexin sets the stage for calcium-mediated exocytosis. FEBS Lett. 2007;581:2131–2139. doi: 10.1016/j.febslet.2007.02.066. [DOI] [PubMed] [Google Scholar]
- Moser T, Brandt A, Lysakowski A. Hair cell ribbon synapses. Cell Tissue Res. 2006;326:347–359. doi: 10.1007/s00441-006-0276-3. [DOI] [PMC free article] [PubMed] [Google Scholar]
- Nouvian R, Beutner D, Parsons TD, Moser T. Structure and function of the hair cell ribbon synapse. J Membr Biol. 2006;209:153–165. doi: 10.1007/s00232-005-0854-4. [DOI] [PMC free article] [PubMed] [Google Scholar]
- Oertel D. Synaptic responses and electrical properties of cells in brain slices of the mouse anteroventral cochlear nucleus. J Neurosci. 1983;3:2043–2053. doi: 10.1523/JNEUROSCI.03-10-02043.1983. [DOI] [PMC free article] [PubMed] [Google Scholar]
- Oertel D. The role of timing in the brain stem auditory nuclei of vertebrates. Annu Rev Physiol. 1999;61:497–519. doi: 10.1146/annurev.physiol.61.1.497. [DOI] [PubMed] [Google Scholar]
- Oleskevich S, Youssoufian M, Walmsley B. Presynaptic plasticity at two giant auditory synapses in normal and deaf mice. J Physiol. 2004;560:709–719. doi: 10.1113/jphysiol.2004.066662. [DOI] [PMC free article] [PubMed] [Google Scholar]
- Pauli-Magnus D, Hoch G, Strenzke N, Anderson S, Jentsch TJ, Moser T. Detection and differentiation of sensorineural hearing loss in mice using auditory steady-state responses and transient auditory brainstem responses. Neuroscience. 2007;149:673–684. doi: 10.1016/j.neuroscience.2007.08.010. [DOI] [PubMed] [Google Scholar]
- Reim K, Mansour M, Varoqueaux F, McMahon HT, Südhof TC, Brose N, Rosenmund C. Complexins regulate a late step in Ca2+-dependent neurotransmitter release. Cell. 2001;104:71–81. doi: 10.1016/s0092-8674(01)00192-1. [DOI] [PubMed] [Google Scholar]
- Reim K, Wegmeyer H, Brandstätter JH, Xue M, Rosenmund C, Dresbach T, Hofmann K, Brose N. Structurally and functionally unique complexins at retinal ribbon synapses. J Cell Biol. 2005;169:669–680. doi: 10.1083/jcb.200502115. [DOI] [PMC free article] [PubMed] [Google Scholar]
- Reim K, Regus-Leidig H, Ammermüller J, El-Kordi A, Radyushkin K, Ehrenreich H, Brandstätter JH, Brose N. Aberrant function and structure of retinal ribbon synapses in the absence of complexin 3 and complexin 4. J Cell Sci. 2009;122:1352–1361. doi: 10.1242/jcs.045401. [DOI] [PubMed] [Google Scholar]
- Rollenhagen A, Lübke JH. The morphology of excitatory central synapses: from structure to function. Cell Tissue Res. 2006;326:221–237. doi: 10.1007/s00441-006-0288-z. [DOI] [PubMed] [Google Scholar]
- Rosenmund C, Rettig J, Brose N. Molecular mechanisms of active zone function. Curr Opin Neurobiol. 2003;13:509–519. doi: 10.1016/j.conb.2003.09.011. [DOI] [PubMed] [Google Scholar]
- Roux I, Safieddine S, Nouvian R, Grati M, Simmler MC, Bahloul A, Perfettini I, Le Gall M, Rostaing P, Hamard G, Triller A, Avan P, Moser T, Petit C. Otoferlin, defective in a human deafness form, is essential for exocytosis at the auditory ribbon synapse. Cell. 2006;127:277–289. doi: 10.1016/j.cell.2006.08.040. [DOI] [PubMed] [Google Scholar]
- Sachs MB, Abbas PJ. Rate versus level functions for auditory-nerve fibers in cats: tone-burst stimuli. J Acoust Soc Am. 1974;56:1835–1847. doi: 10.1121/1.1903521. [DOI] [PubMed] [Google Scholar]
- Safieddine S, Wenthold RJ. SNARE complex at the ribbon synapses of cochlear hair cells: analysis of synaptic vesicle- and synaptic membrane-associated proteins. Eur J Neurosci. 1999;11:803–812. doi: 10.1046/j.1460-9568.1999.00487.x. [DOI] [PubMed] [Google Scholar]
- Schaub JR, Lu X, Doneske B, Shin YK, McNew JA. Hemifusion arrest by complexin is relieved by Ca2+-synaptotagmin I. Nat Struct Mol Biol. 2006;13:748–750. doi: 10.1038/nsmb1124. [DOI] [PubMed] [Google Scholar]
- Schneggenburger R, Forsythe ID. The calyx of Held. Cell Tissue Res. 2006;326:311–337. doi: 10.1007/s00441-006-0272-7. [DOI] [PubMed] [Google Scholar]
- Schneggenburger R, Meyer AC, Neher E. Released fraction and total size of a pool of immediately available transmitter quanta at a calyx synapse. Neuron. 1999;23:399–409. doi: 10.1016/s0896-6273(00)80789-8. [DOI] [PubMed] [Google Scholar]
- Sobkowicz HM, Slapnick SM, August BK. Presynaptic fibres of spiral neurons and reciprocal synapses in the organ of Corti in culture. J Neurocytol. 1993;22:979–993. doi: 10.1007/BF01218355. [DOI] [PubMed] [Google Scholar]
- Sotelo C, Gentschev T, Zamora AJ. Gap junctions in ventral cochlear nucleus of the rat. A possible new example of electrotonic junctions in the mammalian C.N.S. Neuroscience. 1976;1:5–7. doi: 10.1016/0306-4522(76)90041-5. [DOI] [PubMed] [Google Scholar]
- Südhof TC, Rothman JE. Membrane fusion: grappling with SNARE and SM proteins. Science. 2009;323:474–477. doi: 10.1126/science.1161748. [DOI] [PMC free article] [PubMed] [Google Scholar]
- Sun J, Pang ZP, Qin D, Fahim AT, Adachi R, Südhof TC. A dual-Ca2+-sensor model for neurotransmitter release in a central synapse. Nature. 2007;450:676–682. doi: 10.1038/nature06308. [DOI] [PMC free article] [PubMed] [Google Scholar]
- Taberner AM, Liberman MC. Response properties of single auditory nerve fibers in the mouse. J Neurophysiol. 2005;93:557–569. doi: 10.1152/jn.00574.2004. [DOI] [PubMed] [Google Scholar]
- Tang J, Maximov A, Shin OH, Dai H, Rizo J, Südhof TC. A complexin/synaptotagmin 1 switch controls fast synaptic vesicle exocytosis. Cell. 2006;126:1175–1187. doi: 10.1016/j.cell.2006.08.030. [DOI] [PubMed] [Google Scholar]
- Thiers FA, Nadol JB, Jr, Liberman MC. Reciprocal synapses between outer hair cells and their afferent terminals: evidence for a local neural network in the mammalian cochlea. J Assoc Res Otolaryngol. 2008;9:477–489. doi: 10.1007/s10162-008-0135-x. [DOI] [PMC free article] [PubMed] [Google Scholar]
- Trussell LO. Synaptic mechanisms for coding timing in auditory neurons. Annu Rev Physiol. 1999;61:477–496. doi: 10.1146/annurev.physiol.61.1.477. [DOI] [PubMed] [Google Scholar]
- Tsodyks MV, Markram H. The neural code between neocortical pyramidal neurons depends on neurotransmitter release probability. Proc Natl Acad Sci U S A. 1997;94:719–723. doi: 10.1073/pnas.94.2.719. [DOI] [PMC free article] [PubMed] [Google Scholar]
- Wang Y, Manis PB. Synaptic transmission at the cochlear nucleus endbulb synapse during age-related hearing loss in mice. J Neurophysiol. 2005;94:1814–1824. doi: 10.1152/jn.00374.2005. [DOI] [PMC free article] [PubMed] [Google Scholar]
- Wang Y, Manis PB. Temporal coding by cochlear nucleus bushy cells in DBA/2J mice with early onset hearing loss. J Assoc Res Otolaryngol. 2006;7:412–424. doi: 10.1007/s10162-006-0052-9. [DOI] [PMC free article] [PubMed] [Google Scholar]
- Xue M, Stradomska A, Chen H, Brose N, Zhang W, Rosenmund C, Reim K. Complexins facilitate neurotransmitter release at excitatory and inhibitory synapses in mammalian central nervous system. Proc Natl Acad Sci U S A. 2008;105:7875–7880. doi: 10.1073/pnas.0803012105. [DOI] [PMC free article] [PubMed] [Google Scholar]
- Xu-Friedman MA, Regehr WG. Dynamic-clamp analysis of the effects of convergence on spike timing. I. Many synaptic inputs. J Neurophysiol. 2005;94:2512–2525. doi: 10.1152/jn.01307.2004. [DOI] [PubMed] [Google Scholar]
- Yang H, Xu-Freidman MA. Relative roles of different mechanisms of depression at the mouse endbulb of Held. J Neurophysiol. 2008;99:2510–2521. doi: 10.1152/jn.01293.2007. [DOI] [PMC free article] [PubMed] [Google Scholar]
- Zucker RS, Regehr WG. Short-term synaptic plasticity. Annu Rev Physiol. 2002;64:355–405. doi: 10.1146/annurev.physiol.64.092501.114547. [DOI] [PubMed] [Google Scholar]