

Abstract
The pathophysiology of major depressive disorder (MDD) includes both affective and cognitive dysfunctions. We aimed to clarify how regions regulating affective processing interact with those involved in attention, and how such interaction impacts perceptual processing within sensory cortices. Based on previous work showing that top-down influences from attention can determine the processing of external inputs within early sensory cortices, we tested with functional magnetic resonance imaging (fMRI) whether MDD alters attentional (“top-down”) effects on the neural filtering of irrelevant, nonemotional visual stimuli. The present fMRI study was conducted in 14 nonmedicated patients with a first episode of unipolar MDD and 14 matched controls. During scanning, subjects performed two tasks imposing two different levels of attentional load at fixation (easy or difficult), while irrelevant colored stimuli were presented in the periphery. Analyses of fMRI data revealed that MDD patients show (1) an abnormal filtering of irrelevant information in visual cortex, (2) an altered functional connectivity between frontoparietal networks and visual cortices, and (3) a hyperactivity in subgenual cingulate/medial orbitofrontal cortex that was modulated by attentional load. These results demonstrate that biological abnormalities contribute to the cognitive deficits seen in major depression, and clarify how neural networks implicated in mood regulation influence executive control and perceptual processes. These findings not only improve our understanding of the pathophysiological mechanisms underlying cognitive dysfunctions in MDD, but also shed new light on the interaction between cognition and mood regulation.
Keywords: depression, attention, sensory processing, affective regulation, vmPFC, subgenual cingulate cortex, medial orbitofrontal, frontoparietal network, functional magnetic resonance imaging, functional connectivity
Introduction
Major depressive disorder (MDD) is characterized by affective and cognitive dysfunctions (Chamberlain and Sahakian, 2006). Understanding the neurobiology underlying this multifaceted psychiatric disorder emerges as a major health and research challenge (Nestler et al., 2002).
Brain imaging studies in MDD have documented abnormalities in regions involved in affective and cognitive regulation, such as the anterior cingulate cortex and the orbitofrontal cortex (OFC), as well as frontoparietal networks subserving attention and executive functions (Mayberg et al., 1999). In addition, MDD patients may recruit greater prefrontal processing to achieve similar (or poorer) task performance than control subjects, suggesting that a disturbed emotional state intensifies cognitive interference (Harvey et al., 2005). These findings indicate that a dysfunction implicating frontal–limbic circuits might cause both cognitive and emotional disturbances (Mayberg, 1997; Mayberg et al., 1999; Drevets, 2000). A plausible pathophysiological mechanism for MDD would thus involve a disordered neural network with two distinct and interacting components: an enhanced activation within limbic circuits and an altered engagement of prefrontal executive circuits. It is unclear (1) whether a dysfunction within frontal–limbic networks also affects lower-level processing by altering top-down influences (Fales et al., 2008); and (2) to what extent perceptual processes are biased by a dysregulation of affective (limbic) versus cognitive (prefrontal) control circuitry. Yet, impairments in perception secondary to changes in top-down factors can significantly worsen cognitive deficits observed in MDD. The study of functional changes at early levels of perceptual integration is thus required to get a comprehensive model of the neural dysfunctions underlying neuropsychological deficits in MDD and to better understand how affective regulation might impact perceptual processing.
Previous neuroimaging studies in healthy and brain-damaged participants demonstrated that top-down influences from emotion or attention can determine the processing of external inputs within early sensory cortices by enhancing attended information while suppressing unattended information. Recently, we showed that high attentional load at fixation can lead to a suppression of functional magnetic resonance imaging (fMRI) response to irrelevant peripheral stimulation in visual cortex (Schwartz et al., 2005). These findings provided a neural foundation for Lavie's theory of attention (Lavie, 2005), which predicts that increasing processing load of a relevant task determines the extent to which irrelevant distractors are processed.
Based on these previous findings, here we tested with fMRI whether changing attentional demands of a central task would affect the processing of task-irrelevant colored visual stimuli presented in the periphery. By modulating attentional load at central fixation without changing sensory inputs, we hypothesized that mood changes would interfere with top-down control of activity in visual regions. A second main aim of the study was to directly assess distant effects of frontoparietal executive networks on the processing of irrelevant stimuli in visual cortices by applying functional connectivity analyses. By implementing an affective neuroscience approach to depression, our fMRI study constitutes a useful test of the relevance of biological abnormalities to the cognitive deficits seen in major depression. More generally, our study provides new insights into the functional interaction between neural networks implicated in mood regulation and those involved in executive control and perceptual processes.
Materials and Methods
Subjects
Over a 2 year period, we recruited unmedicated subjects who presented with a first episode of major unipolar depression and agreed to perform an fMRI experiment. Sixteen patients could complete the whole MRI protocol; age- and education-matched healthy controls were also scanned. The inclusion criteria for the MDD and control groups were age between 18 and 56 years, willingness to participate, and ability to provide signed informed consent. The protocol was approved by the research ethics committee of the Faculty of Medicine of the University of Liège. The exclusion criteria were current or past cardiovascular or neurological disorder (e.g., Parkinson's disease). Subjects were excluded if they were pregnant, lactating, or had conditions for which an MRI would be contraindicated (e.g., metallic implants).
Depressed subjects were recruited through the psychiatric outpatients consultation of the Liege University Hospital by a team of trained psychiatrists who performed a medical examination and conducted the Structured Clinical Interview for Axis I DSM-IV Disorders (SCID-IV) (Spitzer et al., 1994). Sixteen subjects with a first lifetime episode of unipolar major depressive disorder, with no prior antidepressant or antipsychotic treatment, were included in the experimental protocol. Two patients could not maintain reliable central visual fixation (as monitored by eye tracking, see below). Data from these two patients were excluded from further analysis, and 14 subjects were thus included in the final analyses (seven males, drug-free, Hamilton Depression Rating Scale ≥17) (Table 1).
Table 1.
Clinical characteristics of depressed patients and control subjectsa
| MDD group |
Control group |
||||||||||
|---|---|---|---|---|---|---|---|---|---|---|---|
| ID | Age (years) | Sex | HDRS | HARS | Education (years) | ID | Age (years) | Sex | HDRS | HARS | Education (years) |
| 1 | 21 | f | 21 | 15 | 15 | 1 | 21 | f | 0 | 0 | 14 |
| 2 | 28 | f | 33 | 19 | 15 | 2 | 27 | f | 1 | 2 | 16 |
| 3 | 29 | f | 32 | 16 | 13 | 3 | 32 | f | 1 | 2 | 15 |
| 4 | 29 | f | 34 | 12 | 13 | 4 | 24 | f | 3 | 4 | 15 |
| 5 | 32 | f | 37 | 19 | 15 | 5 | 31 | f | 2 | 0 | 14 |
| 6 | 38 | f | 30 | 18 | 14 | 6 | 32 | f | 0 | 0 | 17 |
| 7 | 54 | f | 20 | 17 | 15 | 7 | 56 | f | 2 | 0 | 12 |
| 8 | 19 | m | 30 | 22 | 14 | 8 | 20 | m | 1 | 0 | 12 |
| 9 | 19 | m | 30 | 10 | 13 | 9 | 19 | m | 1 | 0 | 13 |
| 10 | 36 | m | 21 | 14 | 13 | 10 | 34 | m | 1 | 0 | 13 |
| 11 | 39 | m | 27 | 14 | 13 | 11 | 35 | m | 6 | 7 | 13 |
| 12 | 38 | m | 24 | 18 | 12 | 12 | 34 | m | 0 | 0 | 16 |
| 13 | 40 | m | 26 | 17 | 14 | 13 | 36 | m | 3 | 3 | 17 |
| 14 | 42 | m | 25 | 15 | 14 | 14 | 39 | m | 1 | 0 | 14 |
| Meanb | 33.1 ± 9.84 | 7:7 | 27.86 ± 5.27 | 16.14 ± 3.11 | 13.78 ± 0.97 | 31.4 ± 9.51c | 7:7 | 1.57 ± 1.60d | 1.29 ± 2.13d | 14.35 ± 1.69c | |
aPatients were selected by a team of psychiatrists with extensive experience in depression. All subjects were Caucasian and right handed; they were off medication for 3 months prior to the experimental day.
bData are given as mean ± SD. For the Sex column, data are the ratio of male to female.
cTwo-sample t test testing for group differences, degrees of freedom (df) = 26; NS.
dTwo-sample t test testing for group differences, df = 26; p < 0.001.
Healthy control subjects were recruited through advertisements. They were selected to match the MDD patients for gender, age, and sociocultural background. None of them reported any severe medical problem or any neurological or psychiatric history. After providing informed consent, they were screened using the Axis I SCID-IV and the Hamilton Depression Rating Scale (HDRS) (Hamilton, 1960). The exclusion criteria for the control subjects were an HDRS score >6, a history of mood disorders, or any other DSM-IV Axis I mental illness. Fourteen controls matching the final selection of patients were included in the analyses.
Procedure
During the main fMRI experiment, the participants performed a detection task on a rapid successive visual presentation (RSVP) of colored letters (one letter every 750 ms; 500 ms duration each, plus 250 ms blank) that was shown on a fixed central location at fixation (Fig. 1A). This RSVP stream consisted of T-shaped stimuli displayed with two possible orientations (upright or upside-down) and eight different colors in a pseudorandom order. Blocks of 20 s with Mondrian-like stimuli formed by a 20 × 20 grid of colored rectangles, presented bilaterally at 6° of visual angle from fixation (subtending 6° × 10°), alternated with blocks without peripheral stimuli (Fig. 1B). To enhance stimulation of visual cortex, Mondrian-like displays changed colors randomly every 500 ms during blocks with peripheral stimulation (Tong et al., 2006). All visual stimuli were projected on a screen and seen through a mirror mounted on the MRI headcoil (total display size 22° × 16°, 60 Hz refresh rate) and generated using a MATLAB Toolbox, allowing visual presentation and response recording with precise timing (Cogent, www.vislab.ucl.ac.uk/Cogent/).
Figure 1.
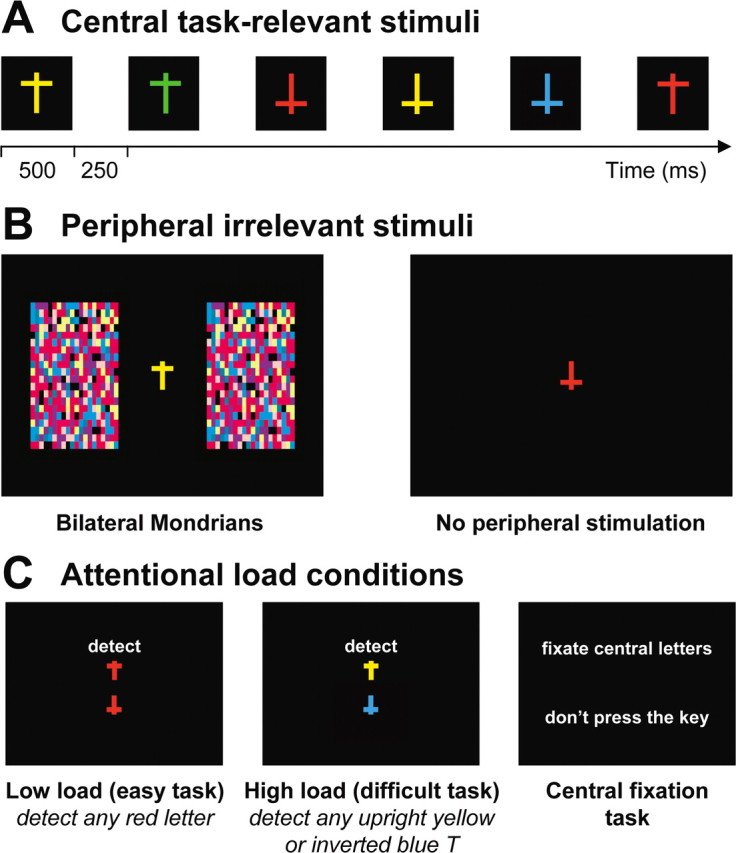
Stimuli and design in the attentional load experiment. A, A rapid continuous stream of colored “T” shapes appeared at central fixation during all blocks (500 ms duration each, 250 ms interval). B, Irrelevant peripheral stimulation included 20 s blocks with bilateral colored, “Mondrian-like” stimuli, alternating with blocks without any peripheral stimulation. C, Two main attentional load conditions required the subjects to either detect any red T regardless of its orientation (low load), or to detect all upright yellow T shapes and upside-down blue T shapes. Additional blocks of central fixation (baseline) were also included. The central visual stream remained identical in each task condition, only the task instructions differed.
During scanning, the participants performed either a low-load or a high-load task, or were required to only fixate the central RSVP (40 s period each, separated by 3 s instruction panel) (Fig. 1C). Low-load, high-load, and baseline fixation periods alternated in a pseudorandom order (randomized across participants) during one single continuous scanning session. The low-load task (easy, pop-out) (Treisman and Gormican, 1988; Wojciulik and Kanwisher, 1999) required a key press for any red T regardless of its orientation. The high-load task (difficult, conjunction) required a key press for any upright yellow T or upside-down blue T (both types of conjunction targets had to be monitored for throughout this task). The baseline fixation task required passive fixation of the letter stream but no key press. Importantly, the exact same stream of 684 central stimuli was presented during all task conditions. In both high- and low-load conditions, items that required a button-press response appeared on average every 15 stimuli (6.7% of the total number of central stimuli), and items that were targets in one condition also appeared with the same frequency as task-irrelevant stimuli in the other condition (i.e., high-load targets appeared as distractors under low-load instructions, and vice versa). Therefore, only the task instructions distinguished the high-load and low-load conditions for the central task. The peripheral Mondrian-like stimuli were always irrelevant to the central task, and the participants were instructed to ignore them.
MRI data acquisition
Data were acquired with a 3T head-only MR scanner (Allegra, Siemens) using a gradient echoplanar imaging (EPI) sequence [32 transverse slices with 30% gap, repetition time (TR): 2130 ms, echo time (TE): 40 ms, flip angle: 90°, field of view (FOV): 220 × 220 mm, matrix size: 64 × 64 × 32, voxel size: 3.4 × 3.4 × 3 mm]. Functional volumes (n = 255) were acquired during one single continuous scanning run. The first three volumes were discarded to account for T1 saturation effects. A structural MR scan was acquired at the end of the experimental session (T1-weighted 3D magnetization-prepared rapid-acquisition gradient echo sequence, TR: 1960 ms, TE: 4.43 ms, inversion time: 1100 ms, FOV: 230 × 173 mm, matrix size: 256 × 192 × 176, voxel size: 0.9 × 0.9 × 0.9 mm). During scanning, eye movements and pupillary size were measured continuously using an infrared eye tracking system (LRO5000, Applied Science Laboratories, sampling rate: 60 Hz). Eye tracking data were used to ensure that all subjects included in the analyses maintained good central fixation during the whole scanning session.
fMRI data analysis
Functional MRI data were analyzed using SPM2 (http://www.fil.ion.ucl.ac.uk) implemented in MATLAB (The MathWorks). Functional scans were realigned, normalized to the MNI EPI template (2D spline, voxel size: 2 × 2 × 2 mm) and spatially smoothed with a Gaussian kernel with full-width at half maximum (FWHM) of 8 mm.
Standard block design analyses.
Data were analyzed using a two-step procedure taking into account the intraindividual and interindividual variance. At the individual level, brain responses were modeled at each voxel, using the general linear model with six trial types convolved with the canonical hemodynamic response function (HRF): baseline fixation with color in periphery, baseline fixation with no peripheral stimuli, low load with color in periphery, low load with no peripheral stimuli, high load with color in periphery, high load with no peripheral stimuli. Because missed targets and false alarms [including responses with reaction times (RTs) > 750 ms] involved incorrect motor responses (absence of key presses during misses; inappropriate key presses during false alarms), we included all actual motor responses in the fMRI design as an additional regressor of no interest to capture any spurious brain activation attributable to group differences in motor behavior (i.e., misses and false alarms). Six movement parameters from spatial realignment were included as additional regressors of no interest to account for residual motion artifacts. High-pass filtering was performed using a cutoff period of 128 s to remove low-frequency drifts from the time series. Linear contrasts between regressors of interest tested for the main effects of attentional load (high load vs low load and low load vs high load). Using within-subject contrasts between the activity for two different levels of attentional load as main variables for the second-level whole-brain group analyses, as in the present study, would also minimize effects related to general differences in effective difficulty (if any). The summary statistical images were spatially smoothed with a Gaussian kernel of 6 mm FWHM and entered into a second-level one-way ANOVA implemented in SPM2 to assess random-effects group comparisons. The resulting SPM maps were thresholded at p < 0.001 (uncorrected). Common group effects were assessed using conjunction analysis to preserve only voxels that were significant in the contributing SPM maps of both control and MDD populations based on the conjunction null hypothesis (Friston et al., 2005). Direct statistical group comparisons were obtained using exclusive masking to reveal the voxels that showed increased response in one population in the absence of such effect in the other population. The SPM constituting the exclusive mask was thresholded at p < 0.05, whereas the contrast to be masked was thresholded at p < 0.001. Note that the more liberal the threshold of an exclusive mask, the more conservative is the masking procedure. Note also that the use of conservative whole-brain random-effects group comparisons (Holmes and Friston, 1998) together with the relatively broad age range of the studied populations (MDD: 19–54; matched controls: 19–56 years) ensures that any statistically significant group difference reflects a robust result that can be generalized to a larger population.
Functional connectivity analyses.
A second set of analyses aimed to assess condition-dependent changes in the functional coupling between brain regions. This was done using psychophysiological interaction (PPI) analyses, which explain the activity in one part of the brain in terms of the interaction between an experimental manipulation (psychological factor) and the activity in another brain region (physiological factor) (Friston et al., 1997). PPI analyses were computed to test the hypothesis that functional connectivity between brain regions would differ between the two populations as a function of the current attentional context. We extracted time series from regions of interest revealed by the main contrasts in each individual, averaging activity within a 10-mm-radius sphere, centered at the peak of the activation. This physiological signal was deconvolved using the HRF to estimate the underlying neuronal signal, multiplied with the psychological variable (low vs high load), and convolved again with the HRF to obtain the expected blood oxygenation level-dependent (BOLD) response for the PPI (Gitelman et al., 2003). The two main effects (physiological and psychological factors) and the critical PPI were entered in new fixed-effects analyses, together with movement parameters. Any significant psychophysiological interaction (p < 0.001) indicated a change in the regression coefficients between any reported brain area and the reference region, related to attentional load manipulation. Individual PPI regression estimations were then included in random-effects group ANOVAs (inferences reported at p < 0.001, uncorrected). Note that the interaction effect is orthogonal to the main effects of task and that the inclusion of both main effects of task in the analysis ensures that any activation associated with the PPI cannot be explained by any of these main effects (e.g., overall effect of low- vs high-load conditions).
Results
Clinical characteristics
Sixteen patients and their matched controls completed the study, but two patients were excluded because they did not maintain reliable central visual fixation. The 14 remaining MDD patients and their 14 healthy matched controls were included in the final analyses. Table 1 reports the main demographic and clinical characteristics of the study population. Differences between the groups were statistically significant for both depression and anxiety measures (HDRS, HARS; two-sample t test, p < 0.001 for both measures). Depression scores correlated with anxiety scores in controls but not in MDD patients (r = 0.87, r2 = 0.76, p < 0.001; r = 0.078, r2 = 0.006, p = 0.79; respectively). In the MDD group, the duration of episodes reported during the SCID-IV interviews ranged from 1 to 5 months (mean, 3.2 months). All 14 patients were experiencing their first MDD episode, and none had been prescribed an antidepressant. Their education level (assessed in years) ranged from 12 to 15 years (mean, 13.78 ± 0.97 years).
Behavioral results
Performance on the central RSVP (Fig. 1) during scanning was assessed by analyzing RTs and hit rates on target trials, as well as false alarms (including responses with an RT > 750 ms) using ANOVAs with attentional load (high, low) as within-subjects factor (repeated measures) and group as between-subjects factor (Table 2). There was a main effect of attentional load for all measures (all p < 0.001), with slower RTs, reduced hit rates, and more false alarms during the high- compared with the low-load condition, indicating that the instructions successfully modulated task difficulty in both groups. Importantly, there was no group difference in reaction times, which suggests that task difficulty was mostly comparable for patients and controls, and that both populations were equally vigilant and attentive during the task. There was a group effect for hit rates due to the patients missing slightly more targets (hits, 91% in low load and 73.64% in high load) than their controls (hits, 97.22% in low load and 85.61% in high load) and a group-by-attentional load interaction for false alarms due to the patients making more such errors during the high-load condition. Indeed, planned t tests on hits and false alarms revealed that patients and controls differed during high attentional load (hits: p = 0.041; false alarms: p = 0.031) but not during low attentional load (hits: p = 0.103; false alarms: p = 0.773). However, activity change in regions showing critical group effect [i.e., V4 and subgenual anterior cingulate cortex (SgAcc)/ventral medial prefrontal cortex (vmPFC), see below] did not correlate with hits or false alarms (Table 3), thus ruling out that differences in performance accounted for the reported fMRI group differences.
Table 2.
Behavioral performance during scanning
| Measure | MDD groupa |
Control groupa |
Statisticsb |
||||
|---|---|---|---|---|---|---|---|
| Low load | High load | Low load | High load | Effect of group | Effect of load | Group-by-load interaction | |
| RT (ms) on correct responses | 492.98 ± 61.56 | 553.20 ± 41.75 | 489.85 ± 38.80 | 566.60 ± 36.32 | F(1,26) = 0.107 | F(1,26) = 89.65 | F(1,26) = 1.306 |
| p = 0.745 | p < 0.001 | p = 0.263 | |||||
| Hits (%) | 91.00 ± 12.84 | 73.64 ± 18.61 | 97.22 ± 5.07 | 85.61 ± 9.39 | F(1,26) = 4.485 | F(1,26) = 54.16 | F(1,26) = 2.13 |
| p < 0.05 | p < 0.001 | p = 0.156 | |||||
| False alarmsc | 7.54 ± 8.8 | 29.05 ± 15.33 | 6.65 ± 1.53 | 18.29 ± 8.96 | F(1,26) = 2.87 | F(1,26) = 66.67 | F(1,26) = 5.92 |
| p = 0.101 | p < 0.001 | p < 0.05 | |||||
aData are given as mean ± SD.
bANOVA with load as within-subject factor and group as between-subject factor.
cFalse alarms correspond to the percentage of key presses recorded outside an interval of 750 ms after the presentation of a target.
Table 3.
Correlations between attention-related activity change regions of interest (V4, SgACC/vmPFC) and hits and false alarm (FA), separately in MDD and control groups
| V4 (x, y, z: 20, −68, −8) |
SgACC/vmPFC (x, y, z: 25, −6, 30) |
|||
|---|---|---|---|---|
| Hits (high) | FA (high) | Hits (high) | FA (high) | |
| MDD group | ||||
| r2 | 0.0016 | 0.0463 | 0.0278 | 0.0327 |
| F(1,13) | 0.0189 | 0.5830 | 0.3432 | 0.4062 |
| p | 0.8928 | 0.4599 | 0.5688 | 0.5359 |
| Control group | ||||
| r2 | 0.0056 | 0.0280 | 0.0577 | 0.2429 |
| F(1,13) | 0.0678 | 0.3456 | 0.7347 | 3.8493 |
| p | 0.7990 | 0.5675 | 0.4082 | 0.0734 |
During scanning, eye movements were measured continuously using an infrared eye tracking system. ANOVAs conducted on eye movement data revealed no significant group difference, neither for the absolute distance from fixation nor for horizontal deviations (F(1,26) = 1.20, p = 0.28; F(1,26) = 4.12, p = 0.43, respectively). These results suggest that both populations fixated the central stream of letters equally well. We also found no group difference in pupil diameter, suggesting similar levels of central arousal and attention in both groups (e.g., Siegle et al., 2003; Sterpenich et al., 2006), which is consistent with previous results in depressed subjects (e.g., Johnstone et al., 2007).
fMRI results
For clarity, rather than separate main effects within each group, we first describe effects found in both patients and controls using conjunction analyses to preserve only voxels that were significant in the contributing SPM maps of both populations (Friston et al., 2005). We then report between-group comparisons whenever they yielded statistically significant results.
Effects of high attentional load
We first tested for effects of increased attentional load by comparing fMRI activity during the high- versus the low-attentional-load conditions using linear contrasts of parameter estimates in the context of ANOVA models, as described in Materials and Methods. A conjunction of the SPM maps from the patients and from the controls for this comparison showed that both populations strongly engaged inferior frontal and superior parietal regions during increased attentional load at fixation (Table 4, Fig. 2), consistent with the recruitment of a distributed attentional network subtending top-down influence under higher-load condition in all participants (Schwartz et al., 2005). Another region in inferior occipital cortex showed increased activation during the high-load condition (x, y, z: −44, −68, −10) (Fig. 2). Because this region lies close to an area known as the visual word form area (VWFA) (Vinckier et al., 2007), increased activation of the VWFA probably reflects letter identification specifically during the high-load condition, which imperatively requires distinguishing between upright and upside-down “T” shapes (whereas processing of the shape of the central targets was not relevant during the low-load task).
Table 4.
Brain regions showing main effects of high minus low attentional load (group conjunction: MDD patients and controls for the high > low load contrast)
| Brain areas | L/R | BA | MNI coordinates |
t valuea | Cluster size (voxels)b | ||
|---|---|---|---|---|---|---|---|
| x | y | z | |||||
| Inf. frontal gyrus/operculum | L | 44/48 | −44 | 4 | 28 | 6.18 | 781 |
| Inf. frontal gyrus/operculum | R | 44/48 | 48 | 10 | 32 | 5.82 | 367 |
| Sup. parietal/IPS | L | 7 | −20 | −64 | 56 | 5.29 | 1294 |
| Sup. parietal/IPS | R | 7 | 34 | −58 | 48 | 4.98 | 737 |
| Insula | R | 47 | 32 | 24 | −2 | 4.78 | 92 |
| Inf. occipital/VWFA | L | 19 | −44 | −68 | −10 | 4.75 | 115 |
| Precentral/Mid. frontal | L | 6 | −32 | −2 | 54 | 4.4 | 302 |
| SMA | L | 6/32 | −8 | 12 | 52 | 4.3 | 225 |
| Sup. frontal | R | 8 | 32 | 10 | 64 | 4.25 | 40 |
| Inf. occipital | R | 19 | 50 | −72 | −10 | 3.73 | 33 |
| Mid. frontal | R | 45/48 | 40 | 34 | 20 | 3.62 | 8 |
| Inf. parietal | R | 40 | 48 | −42 | 50 | 3.52 | 6 |
Inf., Inferior; IPS, Intraparietal sulcus; Mid., middle; SMA, supplementary motor area; Sup., superior; L, left; R, right; BA, Brodmann's area.
aAll p < 0.001 uncorrected (random-effect analysis).
bThreshold cluster size of 5 voxels.
Figure 2.

Main effect of high attentional load. A, Statistical maps from the group conjunction analysis showing increased activation in lateral occipital (x, y, z: −44, −68, −10; visual word form area) (Vinckier et al., 2007), superior parietal and inferior frontal regions in both MDD patients and controls. Maps are overlaid on average T1 structural scan, thresholded at p < 0.001 uncorrected. Color bar on the right indicates t values. B, Parameter estimates extracted from the statistical peaks demonstrate selective activation during the high-load task across all conditions of peripheral stimulation and in both populations. B, Baseline fixation; L, low attentional load; H, high attentional load.
Effects of low attentional load
We then tested for regions more activated during low compared with high attentional demands (low > high load). Based on Lavie's theory of attentional load (Lavie, 1995, 2005) and on our previous fMRI results in normal controls (Schwartz et al., 2005), we predicted increased activity in visual regions due to less filtering of the peripheral colored stimuli during the low-load condition. The group conjunction analysis revealed that only bilateral medial OFC survived the statistical threshold (Table 5). In contrast, when we directly compared controls to MDD patients for this same contrast, we found increased response in visual cortices, including the primary visual cortex (calcarine sulcus) and a region previously found to be maximally modulated by such central load manipulation (Schwartz et al., 2005) and corresponding to the color-responsive area V4 (Talairach coordinates: x, y, z: 20, −66, −4; MNI coordinates: x, y, z: 20, −68, −8) (Table 5, Fig. 3A) (Zeki et al., 1991; Bartels and Zeki, 2000). The latter activation was specifically driven by enhanced response to peripheral colored stimuli during the low-load compared with the high-load condition in the controls (Fig. 3B). For the same contrast (low > high load), MDD patients showed a significant attenuation of BOLD response in bilateral vmPFC region during high attentional load, encompassing the medial OFC and rostral anterior cingulate cortex/SgAcc (Fig. 3C). This modulation of brain response in the patients was driven by the attentional task, independently of the presence or absence of peripheral stimuli (Fig. 3D).
Table 5.
Brain regions showing main effects of low minus high attentional load
| Brain areas | L/R | BA | MNI coordinates |
t valuea | Cluster size (voxels)b | ||
|---|---|---|---|---|---|---|---|
| x | y | z | |||||
| Group conjunction: MDD patients and controls for the low > high load contrast | |||||||
| OFC (medial orbital) | L | 11 | −16 | 38 | −16 | 4.52 | 98 |
| OFC (medial orbital) | R | 11 | 8 | 40 | −22 | 4.03 | 21 |
| Group comparison: controls masked by MDD patients for the low > high load contrast | |||||||
| Early visual (calcarine) | R | 17/18 | 12 | −86 | 0 | 5.88 | 1401 |
| V4 | R | 18 | 22 | −74 | −8 | 5.73 | c |
| Early visual (calcarine) | R | 17/18 | 2 | −82 | 20 | 4.63 | c |
| Precentral gyrus | L | 6 | −34 | 0 | −40 | 4.78 | 52 |
| Ant. lingual gyrus | R | 17 | 22 | −54 | 6 | 3.81 | 35 |
| Ant. lingual gyrus | R | 18 | 12 | −50 | 4 | 3.48 | c |
| OFC lateral | L | 11 | −24 | 38 | −18 | 3.81 | 11 |
| Group comparison: MDD patients masked by controls for the low > high load contrast | |||||||
| OFC (medial orbital) | L | 11 | −16 | 44 | −18 | 3.38 | 14 |
| OFC (medial orbital) | R | 11 | 16 | 40 | −20 | 3.38 | 13 |
| OFC (rectus) | R | 11 | 4 | 38 | −14 | 3.35 | 68 |
| Ant. cingulate (rostral subgenual) | L | 25 | −6 | 30 | −8 | 3.32 | c |
Ant, Anterior; OFC, orbitofrontal cortex; L, left; R, right; BA, Brodmann's area.
aAll p ≤ 0.001 uncorrected (random-effect analysis).
bThreshold cluster size of 5 voxels.
cBelongs to the same cluster as row above.
Figure 3.

Main effects of low attentional load. A, Increased response during the low- minus the high-load condition in V4 for controls relative to MDD patients. B, Parameter estimates extracted from V4 peak show decreased activity during low versus high load in controls. Note that decreases from baseline to low load in response to peripheral colored stimuli was significant in patients (t = 2.36, p = 0.013) but not in controls (t = 0.98, p = 0.16). C, Decreased subgenual cingulate response during the high-load condition in MDD patients compared with controls. D, Parameter estimates showed decreased fMRI signal during high attentional load in patients but not in controls. For visualization purposes, statistical parametric maps are overlaid on average T1 structural scan and thresholded at p < 0.005 uncorrected. Color bars on the left indicate t values. B, Baseline fixation; L, low attentional load; H, high attentional load.
Functional connectivity
To further investigate the load-related top-down modulations of brain activity, we used dedicated functional connectivity analyses. Specifically, using a whole-brain approach we tested for changes in connectivity as a function of task load between regions of interest (i.e., regions driving top-down influences) and any other region of the brain. We performed such connectivity analyses for two different seed regions, the right parietal and frontal peaks revealed by the main conjunction analysis for the high- versus low-load contrast (Fig. 2, Table 4), ipsilateral to the main effect of load in visual cortex (V4). We found that functional connectivity was increased between the right IPS and V4, as well as between the right frontal cortex and V4 (p < 0.001), selectively in the context of low attentional load in controls but not in patients.
Finally we tested whether activity in our main regions of interest (i.e., V4 and vmPFC/SgAcc) correlated with the severity of depression, as assessed by the HDRS, but we did not find any significant correlation, neither in the MDD group nor in the control group. This finding indicates that the observed functional changes, which pertain to the pathophysiology of MDD, are mostly independent of the clinical severity of depression.
Discussion
A reliable observation in neuropsychological studies of major depression is an impairment across several domains of attention implicating sustained attention (Porter et al., 2003; Hill et al., 2004; Weiland-Fiedler et al., 2004), resistance to interference (Lemelin et al., 1997), response selection (Azorin et al., 1995), and biased attention and processing for negative emotional information (Erickson et al., 2005; Goeleven et al., 2006; Waters et al., 2006; Leyman et al., 2007). The neural substrates that link internal affective states, attentional processes, and sensory representations of stimuli remain unclear, despite the central importance of such relationships in the phenomenology of mood disorders and mood regulation. Our fMRI study aimed to clarify these associations by providing a first investigation of “pure” top-down, task-related modulation in brain activity triggered by simple, nonemotional visual stimuli.
By selectively manipulating top-down attentional influences on the neural processing of irrelevant visual stimulation, we found that unmedicated MDD patients show an abnormal filtering of irrelevant information in visual cortex, together with an alteration of the functional connectivity between frontoparietal networks and visual cortices. Our results also suggest that increased attentional involvement in a cognitive task causes a powerful decrease in subgenual cingulate cortex activity in the patients' population. Hereafter we detail the key findings of this study and how they might improve our understanding of the links between affective and cognitive dysfunctions. We also discuss their potential implications for therapeutic approaches to mood disorders.
Neural filtering of irrelevant stimuli
The present fMRI data provide whole-brain measures of signal change during two main tasks performed at the center of screen, differing only in the amount of attention that they require, while irrelevant colored stimulations were presented in the periphery. Increased top-down cognitive demands during the high-attentional-load condition was indicated by slower reaction times and increased activity in frontoparietal regions in both controls and MDD patients, replicating our previous results in controls (Schwartz et al., 2005). The pattern of brain regions more activated when increasing task demands largely overlapped in controls and patients. Hence, depression might not primarily interfere with the recruitment of the classical neural networks subserving voluntary goal-directed attention, consistent with previous findings using working memory tasks (Barch et al., 2003). In contrast, major between-group differences arose when testing for brain regions more activated during the low-load condition (i.e., reflecting less filtering or reduced suppression of processing in those regions). Based on Lavie's theory that the processing of irrelevant distractors depends on the current attentional load (Lavie, 2005), we predicted enhanced fMRI signal in visual regions for the low- versus high-load contrast. Increased activity in the color-responsive area V4 in controls during low load confirmed the hypothesis that higher task demands at fixation reduce the processing of irrelevant peripheral stimulation in healthy subjects. Similar results were found in our previous study using high-contrast checkerboards and in the motion-sensitive region V5 in another fMRI study in which displays with irrelevant moving dots were used (Rees et al., 1997; Schwartz et al., 2005). Critically, we did not observe such activity increase in V4 during low attentional load (compared with high load) in MDD patients, who showed a decrease of V4 activity during both the low- and high-load tasks (when compared with baseline activity) (Fig. 3B). These fMRI results demonstrate that depression may involve a shift in task-dependent modulation of V4 activity, with MDD patients showing a sharp reduction of distractors processing at lower levels of attentional load compared with healthy controls. This finding may be interpreted as a first indication that depressed patients engage important cognitive resources even in a simple pop-out task, which consequently restricts the processing of peripheral distractors and might reduce the spatial spanning of attention (Posner and Petersen, 1990).
Disrupted functional connectivity in depression
An important finding of the present study is that while both depressed patients and controls showed similar frontoparietal activity changes when increasing task load, the neural processing of irrelevant stimuli in V4 was differentially affected by task load in each population. To reconcile these results and better characterize the mechanisms underlying load-specific modulation of V4, we directly assessed the functional connectivity between frontoparietal regions and the V4 area. This analysis revealed an increase in functional connectivity between V4 and both IPS and inferior frontal peaks, selectively in the context of low attentional load in controls but not in patients. These results are consistent with Lavie's hypothesis that reduced attention to the task leaves more resources available for the processing of concurrent information coming from periphery (here the colored Mondrian-like stimuli), which would in turn call for more top-down control to be exerted (here on V4) to avoid automatic orienting of attention toward distracting information (Lavie, 1995, 2005). In contrast, increased attentional engagement in the central task would consume more attentional resources and thus limit the processing of the irrelevant distractors. While our attentional load manipulation powerfully modulated this “push-pull” mechanism of selective attention in the controls (Pinsk et al., 2004), MDD patients did not show any load-related increased coupling of activity between parietal or frontal regions and visual cortices. This result might again reflect that the low-load condition was potentially quite demanding for the patients, which would be consistent with a reduction of V4 activity even during the low-load condition.
Load-related reduction of subgenual cingulate activity
Another major finding of the present study is a suppression of subgenual cingulate cortex (SgAcc, Brodmann's area 25) and medial OFC activity during high-attentional-load condition (compared with low load) in the depressed subjects, which was independent of the peripheral stimulation. These regions of the vmPFC are known to be involved in emotion and motivation regulation (Mayberg et al., 1999; Elliott et al., 2000; Liotti et al., 2000; Lewis et al., 2005; Morgane et al., 2005), as well as in emotional disorders [see recent reviews (Drevets, 2007; Ressler and Mayberg, 2007)]. SgAcc was found to be overactive in acute sadness and in treatment-resistant depressed patients (Mayberg et al., 1999, 2005). Moreover, antidepressant therapeutic effects in MDD have been linked to SgAcc activity, i.e., mainly a decrease of activity after pharmacological antidepressant treatments (Mayberg et al., 2000; Davidson et al., 2003; Walsh et al., 2007), after electroconvulsive therapy (Nobler et al., 2001), or during deep brain stimulation (Mayberg et al., 2005). Moreover, predictive measures of response to cognitive behavior therapy were also found to be linked to activation levels in this brain area (Siegle et al., 2006; Kennedy et al., 2007).
Load-related suppression of activity in vmPFC regions would be consistent with the recent model of emotion regulation proposed by Phillips et al. (2008), according to which dorsal PFC regions, subtending voluntary emotion regulation, are in functional reciprocal relationship with ventral PFC regions (including SgAcc), subtending automatic emotion regulation. The pathophysiology of mood disorders in which emotions are dysregulated may involve disturbances within this network of interacting brain regions (Keedwell et al., 2005; Phillips et al., 2008). Increased activity of vmPFC/SgAcc in MDD patients during the low-attentional-load condition, as found here, could be thus due to abnormalities in automatic emotion regulation, and reduction of this activity by cognitive effort may reflect the impact of the dorsal prefrontal system (strongly activated during high load in the present study) on the ventral prefrontal system.
To our knowledge, the present data provide the first evidence of a transient reduction of SgAcc/vmPFC activity caused by a cognitive manipulation in a population of unmedicated, nonelderly patients with a first episode of major unipolar depression. By shedding new light on the neural dynamic of subgenual activity in MDD, this result may have several possible functional and clinical implications. In particular, the reduction of SgAcc/vmPFC activity has been found to be critically involved in antidepressant effects in MDD (see above). Elevated cognitive load could thus directly impact a critical node in the functional anatomy of mood regulation.
Restoring top-down influences onto emotional–limbic circuits
The reduction of SgAcc/vmPFC activity during the high-attentional-load condition in MDD may involve the disengagement from self-focused attention toward an external task (Gusnard et al., 2001; Nagai et al., 2004). Increased focused attention (due to task instructions) may thus act as a “circuit breaker” by targeting a region that, in MDD, is dysfunctional at resting baseline and more strongly connected to a distributed limbic and paralimbic neural network (Greicius et al., 2007). Reduced SgAcc activity may therefore alleviate depressive symptoms by preventing the generation of intrusive thoughts within cortical–limbic networks, such as self-focused thoughts and ruminations. This hypothesis would also fit the recent suggestion of Drevets (2007) that cognitive–behavioral strategies for managing depressive symptoms may reinstate the system's adaptive modulation of emotional behavior and experience by restoring top-down influences (from vmPFC) onto emotional–limbic circuits (Davidson et al., 2002). The present neuroimaging findings provide important, new support for this hypothesis by showing that cognitive effort may potentially impact cortical–limbic networks involved in mood regulation by suppressing SgAcc activity in MDD patients. To what extend increasing attentional demands could also momentarily normalize responses to emotional stimuli in MDD and alleviate dysphoria is a clinically relevant question raised by the current study.
In conclusion, the present study reveals distinct effects of task-demands on activity in unimodal sensory and limbic regions. Task-related top-down influences from frontoparietal networks were altered in depressed subjects, leading to an abnormal neural filtering of irrelevant, nonemotional information in visual cortices and a modulation of limbic activity. These findings provide new insights into the functional connections between brain networks subserving cognition and affective regulation.
Footnotes
This research was funded by the Fonds National de la Recherche Scientifique (FNRS) (Belgium; Grant 3.4516.05), by the research funds of the University of Liège, by the Queen Elisabeth Medical Foundation, and by the Interuniversity Attraction Pole program. M.D., T.T.D.-V., V.S., and P.M. are supported by the FNRS (Belgium). This research was also funded by the Swiss National Science Foundation (Grants 310000-114008 and 3200B0-104100 to S.S.) and by the National Centre of Competence in Research in Affective Sciences financed by the Swiss National Science Foundation and hosted by the University of Geneva. M.D., S.S., and P.M. conceived and designed the experiments, analyzed the data, and wrote the paper. M.D., V.S., T.T.D.-V., A.D., G.V., G.A., F.P., C.S., M.S., and S.G. performed the experiments. M.D., S.S., P.M., E.B., E.S., C.D., C.P., M.A., and A.L. contributed reagents/materials/analysis tools.
References
- Azorin JM, Benhaïm P, Hasbroucq T, Possamaï CA. Stimulus preprocessing and response selection in depression: a reaction time study. Acta Psychol (Amst) 1995;89:95–100. doi: 10.1016/0001-6918(94)00024-b. [DOI] [PubMed] [Google Scholar]
- Barch DM, Sheline YI, Csernansky JG, Snyder AZ. Working memory and prefrontal cortex dysfunction: specificity to schizophrenia compared with major depression. Biol Psychiatry. 2003;53:376–384. doi: 10.1016/s0006-3223(02)01674-8. [DOI] [PubMed] [Google Scholar]
- Bartels A, Zeki S. The architecture of the colour centre in the human visual brain: new results and a review. Eur J Neurosci. 2000;12:172–193. doi: 10.1046/j.1460-9568.2000.00905.x. [DOI] [PubMed] [Google Scholar]
- Chamberlain SR, Sahakian BJ. The neuropsychology of mood disorders. Curr Psychiatry Rep. 2006;8:458–463. doi: 10.1007/s11920-006-0051-x. [DOI] [PubMed] [Google Scholar]
- Davidson RJ, Pizzagalli D, Nitschke JB, Putnam K. Depression: perspectives from affective neuroscience. Annu Rev Psychol. 2002;53:545–574. doi: 10.1146/annurev.psych.53.100901.135148. [DOI] [PubMed] [Google Scholar]
- Davidson RJ, Irwin W, Anderle MJ, Kalin NH. The neural substrates of affective processing in depressed patients treated with venlafaxine. Am J Psychiatry. 2003;160:64–75. doi: 10.1176/appi.ajp.160.1.64. [DOI] [PubMed] [Google Scholar]
- Drevets WC. Neuroimaging studies of mood disorders. Biol Psychiatry. 2000;48:813–829. doi: 10.1016/s0006-3223(00)01020-9. [DOI] [PubMed] [Google Scholar]
- Drevets WC. Orbitofrontal cortex function and structure in depression. Ann N Y Acad Sci. 2007;1121:499–527. doi: 10.1196/annals.1401.029. [DOI] [PubMed] [Google Scholar]
- Elliott R, Friston KJ, Dolan RJ. Dissociable neural responses in human reward systems. J Neurosci. 2000;20:6159–6165. doi: 10.1523/JNEUROSCI.20-16-06159.2000. [DOI] [PMC free article] [PubMed] [Google Scholar]
- Erickson K, Drevets WC, Clark L, Cannon DM, Bain EE, Zarate CA, Jr, Charney DS, Sahakian BJ. Mood-congruent bias in affective go/no-go performance of unmedicated patients with major depressive disorder. Am J Psychiatry. 2005;162:2171–2173. doi: 10.1176/appi.ajp.162.11.2171. [DOI] [PubMed] [Google Scholar]
- Fales CL, Barch DM, Rundle MM, Mintun MA, Snyder AZ, Cohen JD, Mathews J, Sheline YI. Altered emotional interference processing in affective and cognitive-control brain circuitry in major depression. Biol Psychiatry. 2008;63:377–384. doi: 10.1016/j.biopsych.2007.06.012. [DOI] [PMC free article] [PubMed] [Google Scholar]
- Friston KJ, Buechel C, Fink GR, Morris J, Rolls E, Dolan RJ. Psychophysiological and modulatory interactions in neuroimaging. Neuroimage. 1997;6:218–229. doi: 10.1006/nimg.1997.0291. [DOI] [PubMed] [Google Scholar]
- Friston KJ, Penny WD, Glaser DE. Conjunction revisited. Neuroimage. 2005;25:661–667. doi: 10.1016/j.neuroimage.2005.01.013. [DOI] [PubMed] [Google Scholar]
- Gitelman DR, Penny WD, Ashburner J, Friston KJ. Modeling regional and psychophysiologic interactions in fMRI: the importance of hemodynamic deconvolution. Neuroimage. 2003;19:200–207. doi: 10.1016/s1053-8119(03)00058-2. [DOI] [PubMed] [Google Scholar]
- Goeleven E, De Raedt R, Baert S, Koster EH. Deficient inhibition of emotional information in depression. J Affect Disord. 2006;93:149–157. doi: 10.1016/j.jad.2006.03.007. [DOI] [PubMed] [Google Scholar]
- Greicius MD, Flores BH, Menon V, Glover GH, Solvason HB, Kenna H, Reiss AL, Schatzberg AF. Resting-state functional connectivity in major depression: abnormally increased contributions from subgenual cingulate cortex and thalamus. Biol Psychiatry. 2007;62:429–437. doi: 10.1016/j.biopsych.2006.09.020. [DOI] [PMC free article] [PubMed] [Google Scholar]
- Gusnard DA, Akbudak E, Shulman GL, Raichle ME. Medial prefrontal cortex and self-referential mental activity: relation to a default mode of brain function. Proc Natl Acad Sci U S A. 2001;98:4259–4264. doi: 10.1073/pnas.071043098. [DOI] [PMC free article] [PubMed] [Google Scholar]
- Hamilton M. A rating scale for depression. J Neurol Neurosurg Psychiatry. 1960;23:56–62. doi: 10.1136/jnnp.23.1.56. [DOI] [PMC free article] [PubMed] [Google Scholar]
- Harvey PO, Fossati P, Pochon JB, Levy R, Lebastard G, Lehéricy S, Allilaire JF, Dubois B. Cognitive control and brain resources in major depression: an fMRI study using the n-back task. Neuroimage. 2005;26:860–869. doi: 10.1016/j.neuroimage.2005.02.048. [DOI] [PubMed] [Google Scholar]
- Hill SK, Keshavan MS, Thase ME, Sweeney JA. Neuropsychological dysfunction in antipsychotic-naive first-episode unipolar psychotic depression. Am J Psychiatry. 2004;161:996–1003. doi: 10.1176/appi.ajp.161.6.996. [DOI] [PubMed] [Google Scholar]
- Holmes AP, Friston KJ. Generalisability, random effects and population inference. Neuroimage. 1998;7:S754. [Google Scholar]
- Johnstone T, van Reekum CM, Urry HL, Kalin NH, Davidson RJ. Failure to regulate: counterproductive recruitment of top-down prefrontal-subcortical circuitry in major depression. J Neurosci. 2007;27:8877–8884. doi: 10.1523/JNEUROSCI.2063-07.2007. [DOI] [PMC free article] [PubMed] [Google Scholar]
- Keedwell PA, Andrew C, Williams SC, Brammer MJ, Phillips ML. A double dissociation of ventromedial prefrontal cortical responses to sad and happy stimuli in depressed and healthy individuals. Biol Psychiatry. 2005;58:495–503. doi: 10.1016/j.biopsych.2005.04.035. [DOI] [PubMed] [Google Scholar]
- Kennedy SH, Konarski JZ, Segal ZV, Lau MA, Bieling PJ, McIntyre RS, Mayberg HS. Differences in brain glucose metabolism between responders to CBT and venlafaxine in a 16-week randomized controlled trial. Am J Psychiatry. 2007;164:778–788. doi: 10.1176/ajp.2007.164.5.778. [DOI] [PubMed] [Google Scholar]
- Lavie N. Perceptual load as a necessary condition for selective attention. J Exp Psychol Hum Percept Perform. 1995;21:451–468. doi: 10.1037//0096-1523.21.3.451. [DOI] [PubMed] [Google Scholar]
- Lavie N. Distracted and confused?: selective attention under load. Trends Cogn Sci. 2005;9:75–82. doi: 10.1016/j.tics.2004.12.004. [DOI] [PubMed] [Google Scholar]
- Lemelin S, Baruch P, Vincent A, Everett J, Vincent P. Distractibility and processing resource deficit in major depression. Evidence for two deficient attentional processing models. J Nerv Ment Dis. 1997;185:542–548. doi: 10.1097/00005053-199709000-00002. [DOI] [PubMed] [Google Scholar]
- Lewis PA, Critchley HD, Smith AP, Dolan RJ. Brain mechanisms for mood congruent memory facilitation. Neuroimage. 2005;25:1214–1223. doi: 10.1016/j.neuroimage.2004.11.053. [DOI] [PubMed] [Google Scholar]
- Leyman L, De Raedt R, Schacht R, Koster EH. Attentional biases for angry faces in unipolar depression. Psychol Med. 2007;37:393–402. doi: 10.1017/S003329170600910X. [DOI] [PubMed] [Google Scholar]
- Liotti M, Mayberg HS, Brannan SK, McGinnis S, Jerabek P, Fox PT. Differential limbic–cortical correlates of sadness and anxiety in healthy subjects: implications for affective disorders. Biol Psychiatry. 2000;48:30–42. doi: 10.1016/s0006-3223(00)00874-x. [DOI] [PubMed] [Google Scholar]
- Mayberg HS. Limbic-cortical dysregulation: a proposed model of depression. J Neuropsychiatry Clin Neurosci. 1997;9:471–481. doi: 10.1176/jnp.9.3.471. [DOI] [PubMed] [Google Scholar]
- Mayberg HS, Liotti M, Brannan SK, McGinnis S, Mahurin RK, Jerabek PA, Silva JA, Tekell JL, Martin CC, Lancaster JL, Fox PT. Reciprocal limbic-cortical function and negative mood: converging PET findings in depression and normal sadness. Am J Psychiatry. 1999;156:675–682. doi: 10.1176/ajp.156.5.675. [DOI] [PubMed] [Google Scholar]
- Mayberg HS, Brannan SK, Tekell JL, Silva JA, Mahurin RK, McGinnis S, Jerabek PA. Regional metabolic effects of fluoxetine in major depression: serial changes and relationship to clinical response. Biol Psychiatry. 2000;48:830–843. doi: 10.1016/s0006-3223(00)01036-2. [DOI] [PubMed] [Google Scholar]
- Mayberg HS, Lozano AM, Voon V, McNeely HE, Seminowicz D, Hamani C, Schwalb JM, Kennedy SH. Deep brain stimulation for treatment-resistant depression. Neuron. 2005;45:651–660. doi: 10.1016/j.neuron.2005.02.014. [DOI] [PubMed] [Google Scholar]
- Morgane PJ, Galler JR, Mokler DJ. A review of systems and networks of the limbic forebrain/limbic midbrain. Prog Neurobiol. 2005;75:143–160. doi: 10.1016/j.pneurobio.2005.01.001. [DOI] [PubMed] [Google Scholar]
- Nagai Y, Critchley HD, Featherstone E, Trimble MR, Dolan RJ. Activity in ventromedial prefrontal cortex covaries with sympathetic skin conductance level: a physiological account of a “default mode” of brain function. Neuroimage. 2004;22:243–251. doi: 10.1016/j.neuroimage.2004.01.019. [DOI] [PubMed] [Google Scholar]
- Nestler EJ, Barrot M, DiLeone RJ, Eisch AJ, Gold SJ, Monteggia LM. Neurobiology of depression. Neuron. 2002;34:13–25. doi: 10.1016/s0896-6273(02)00653-0. [DOI] [PubMed] [Google Scholar]
- Nobler MS, Oquendo MA, Kegeles LS, Malone KM, Campbell CC, Sackeim HA, Mann JJ. Decreased regional brain metabolism after ect. Am J Psychiatry. 2001;158:305–308. doi: 10.1176/appi.ajp.158.2.305. [DOI] [PubMed] [Google Scholar]
- Phillips ML, Ladouceur CD, Drevets WC. A neural model of voluntary and automatic emotion regulation: implications for understanding the pathophysiology and neurodevelopment of bipolar disorder. Mol Psychiatry. 2008;13:829, 833–857. doi: 10.1038/mp.2008.65. [DOI] [PMC free article] [PubMed] [Google Scholar]
- Pinsk MA, Doniger GM, Kastner S. Push-pull mechanism of selective attention in human extrastriate cortex. J Neurophysiol. 2004;92:622–629. doi: 10.1152/jn.00974.2003. [DOI] [PubMed] [Google Scholar]
- Porter RJ, Gallagher P, Thompson JM, Young AH. Neurocognitive impairment in drug-free patients with major depressive disorder. Br J Psychiatry. 2003;182:214–220. doi: 10.1192/bjp.182.3.214. [DOI] [PubMed] [Google Scholar]
- Posner MI, Petersen SE. The attention system of the human brain. Annu Rev Neurosci. 1990;13:25–42. doi: 10.1146/annurev.ne.13.030190.000325. [DOI] [PubMed] [Google Scholar]
- Rees G, Frith CD, Lavie N. Modulating irrelevant motion perception by varying attentional load in an unrelated task. Science. 1997;278:1616–1619. doi: 10.1126/science.278.5343.1616. [DOI] [PubMed] [Google Scholar]
- Ressler KJ, Mayberg HS. Targeting abnormal neural circuits in mood and anxiety disorders: from the laboratory to the clinic. Nat Neurosci. 2007;10:1116–1124. doi: 10.1038/nn1944. [DOI] [PMC free article] [PubMed] [Google Scholar]
- Schwartz S, Vuilleumier P, Hutton C, Maravita A, Dolan RJ, Driver J. Attentional load and sensory competition in human vision: modulation of fMRI responses by load at fixation during task-irrelevant stimulation in the peripheral visual field. Cereb Cortex. 2005;15:770–786. doi: 10.1093/cercor/bhh178. [DOI] [PubMed] [Google Scholar]
- Siegle GJ, Steinhauer SR, Stenger VA, Konecky R, Carter CS. Use of concurrent pupil dilation assessment to inform interpretation and analysis of fMRI data. Neuroimage. 2003;20:114–124. doi: 10.1016/s1053-8119(03)00298-2. [DOI] [PubMed] [Google Scholar]
- Siegle GJ, Carter CS, Thase ME. Use of FMRI to predict recovery from unipolar depression with cognitive behavior therapy. Am J Psychiatry. 2006;163:735–738. doi: 10.1176/ajp.2006.163.4.735. [DOI] [PubMed] [Google Scholar]
- Spitzer MB, Gibbon RL, Williams M, Janet BW. Structured clinical interview for axis I DSM-IV disorders: patient edition (SCID-I/P, Version 2.0) New York: Biometrics Research Department, New York State Psychiatric Institute; 1994. [Google Scholar]
- Sterpenich V, D'Argembeau A, Desseilles M, Balteau E, Albouy G, Vandewalle G, Degueldre C, Luxen A, Collette F, Maquet P. The locus ceruleus is involved in the successful retrieval of emotional memories in humans. J Neurosci. 2006;26:7416–7423. doi: 10.1523/JNEUROSCI.1001-06.2006. [DOI] [PMC free article] [PubMed] [Google Scholar]
- Tong F, Meng M, Blake R. Neural bases of binocular rivalry. Trends Cogn Sci. 2006;10:502–511. doi: 10.1016/j.tics.2006.09.003. [DOI] [PubMed] [Google Scholar]
- Treisman A, Gormican S. Feature analysis in early vision: evidence from search asymmetries. Psychol Rev. 1988;95:15–48. doi: 10.1037/0033-295x.95.1.15. [DOI] [PubMed] [Google Scholar]
- Vinckier F, Dehaene S, Jobert A, Dubus JP, Sigman M, Cohen L. Hierarchical coding of letter strings in the ventral stream: dissecting the inner organization of the visual word-form system. Neuron. 2007;55:143–156. doi: 10.1016/j.neuron.2007.05.031. [DOI] [PubMed] [Google Scholar]
- Walsh ND, Williams SC, Brammer MJ, Bullmore ET, Kim J, Suckling J, Mitterschiffthaler MT, Cleare AJ, Pich EM, Mehta MA, Fu CH. A longitudinal functional magnetic resonance imaging study of verbal working memory in depression after antidepressant therapy. Biol Psychiatry. 2007;62:1236–1243. doi: 10.1016/j.biopsych.2006.12.022. [DOI] [PubMed] [Google Scholar]
- Waters FA, Badcock JC, Maybery MT. Selective attention for negative information and depression in schizophrenia. Psychol Med. 2006;36:455–464. doi: 10.1017/S0033291705007026. [DOI] [PubMed] [Google Scholar]
- Weiland-Fiedler P, Erickson K, Waldeck T, Luckenbaugh DA, Pike D, Bonne O, Charney DS, Neumeister A. Evidence for continuing neuropsychological impairments in depression. J Affect Disord. 2004;82:253–258. doi: 10.1016/j.jad.2003.10.009. [DOI] [PubMed] [Google Scholar]
- Wojciulik E, Kanwisher N. The generality of parietal involvement in visual attention. Neuron. 1999;23:747–764. doi: 10.1016/s0896-6273(01)80033-7. [DOI] [PubMed] [Google Scholar]
- Zeki S, Watson JD, Lueck CJ, Friston KJ, Kennard C, Frackowiak RS. A direct demonstration of functional specialization in human visual cortex. J Neurosci. 1991;11:641–649. doi: 10.1523/JNEUROSCI.11-03-00641.1991. [DOI] [PMC free article] [PubMed] [Google Scholar]