

Abstract
Microsaccades are very small, involuntary flicks in eye position that occur on average once or twice per second during attempted visual fixation. Microsaccades give rise to EMG eye muscle spikes that can distort the spectrum of the scalp EEG and mimic increases in gamma band power. Here we demonstrate that microsaccades are also accompanied by genuine and sizeable cortical activity, manifested in the EEG. In three experiments, high-resolution eye movements were corecorded with the EEG: during sustained fixation of checkerboard and face stimuli and in a standard visual oddball task that required the counting of target stimuli. Results show that microsaccades as small as 0.15° generate a field potential over occipital cortex and midcentral scalp sites 100–140 ms after movement onset, which resembles the visual lambda response evoked by larger voluntary saccades. This challenges the standard assumption of human brain imaging studies that saccade-related brain activity is precluded by fixation, even when fully complied with. Instead, additional cortical potentials from microsaccades were present in 86% of the oddball task trials and of similar amplitude as the visual response to stimulus onset. Furthermore, microsaccade probability varied systematically according to the proportion of target stimuli in the oddball task, causing modulations of late stimulus-locked event-related potential (ERP) components. Microsaccades present an unrecognized source of visual brain signal that is of interest for vision research and may have influenced the data of many ERP and neuroimaging studies.
Introduction
When the eyes fixate a stationary object, they are never completely motionless, but perform tiny, seemingly erratic fixational eye movements (FEMs). The most prominent contribution to FEMs is generated by microsaccades, small (a few arcmin to 1.0°), high-velocity flicks in eye position that are embedded into slower drifting movements at an average rate of 1–2 per second (Martinez-Conde et al., 2004).
Despite early reports that FEMs are necessary to counteract neuronal adaptation and perceptual fading (Ditchburn and Ginsborg, 1952), a functional relevance of microsaccades for normal vision has been disputed; and some authors suggested that microsaccades reflect oculomotor noise with no useful purpose (Kowler and Steinman, 1980). However, there is now mounting evidence that microsaccades are intimately related to neuronal processing throughout the visual and attentional system. In humans, the occurrence of microsaccades has been linked to the visibility of parafoveal and peripheral stimuli (Martinez-Conde et al., 2006) and perceptual alternations during multistable vision (van Dam and van Ee, 2006; Laubrock et al., 2008; Troncoso et al., 2008a; 2008b). Microsaccades are not only correlated with visual awareness, but also with visuospatial attention (Hafed and Clark, 2002; Kohama and Usui, 2002; Engbert and Kliegl, 2003; Laubrock et al., 2005), and their rate is influenced by higher-level cognitive processes, such as the task relevance and relative frequency of visual or auditory stimuli (Valsecchi and Turatto, 2007, 2009; Valsecchi et al., 2007, 2009).
In monkey, intracranial recordings have shown that microsaccades modulate neuronal firing in thalamic (Martinez-Conde et al., 2002; Reppas et al., 2002), striate (Leopold and Logothetis, 1998; Martinez-Conde et al., 2000, 2002), and extrastriate (Bair and O'Keefe, 1998; Herrington et al., 2009) areas of the visual system. In monkey V1, microsaccades correlate with bursts of spikes (Martinez-Conde et al., 2000) and account for much of the neuronal response variability during visual stimulation (Gur et al., 1997).
These findings raise the question whether microsaccades also generate measurable cortical activity in humans. The potential relevance of microsaccades to EEG research was recently demonstrated by Yuval-Greenberg et al. (2008): Like saccades, microsaccades are accompanied by extraocular muscle activity, which propagates to the EEG as a saccadic spike potential (SP) (Thickbroom and Mastaglia, 1986). When data are analyzed in the frequency domain, SPs translate to broadband artifacts in the EEG spectrum. Because experimental conditions may differ in the relative number of microsaccades, this can mimic changes in induced gamma band power.
However, muscle spikes may not be the only noninvasively recordable electrophysiological concomitant of microsaccades. Although largely unnoticed by the scientific community on FEMs, three early EEG studies (Gaarder et al., 1964; Armington et al., 1967; Armington and Bloom, 1974) recorded from a single occipital channel and reported a contrast-sensitive potential after fine eye movements, which qualify as microsaccades according to current understanding. Despite these early findings and the ubiquity of microsaccades during any fixation task, FEMs have not been considered as a relevant source of cortical activity in human cognitive neuroscience. The goal of the present study was therefore to investigate human microsaccade-related brain activity and its potential impact on EEG measurements. High-resolution FEMs were corecorded with the EEG during sustained fixation of typical experimental stimuli in experiments (Exps.) 1 and 2 and in a classic event-related EEG paradigm (Exp. 3).
Materials and Methods
Experiment 1: checkerboard fixation
Subjects.
Eight healthy adults (5 women, age 21–37, right handed) participated after providing written informed consent. Subjects had normal uncorrected visual acuity (Bach, 1996) and were naive as to the purpose of the experiment.
Experimental protocol.
Subjects were seated in an electrically shielded, sound-attenuated and dimly lit cabin at a distance of 60 cm from a 22 inch monitor (Iiyama Vision Master Pro 510, resolution 1024 × 760 pixel, vertical refresh 70 Hz). They were presented with a stationary, black-and-white checkerboard (37° × 28°, 1 cycle per degree, 34 cd/m2 mean luminance, 94% contrast) that contained five 0.2° fixation points on its horizontal meridian (see Fig. 1 a).
Figure 1.
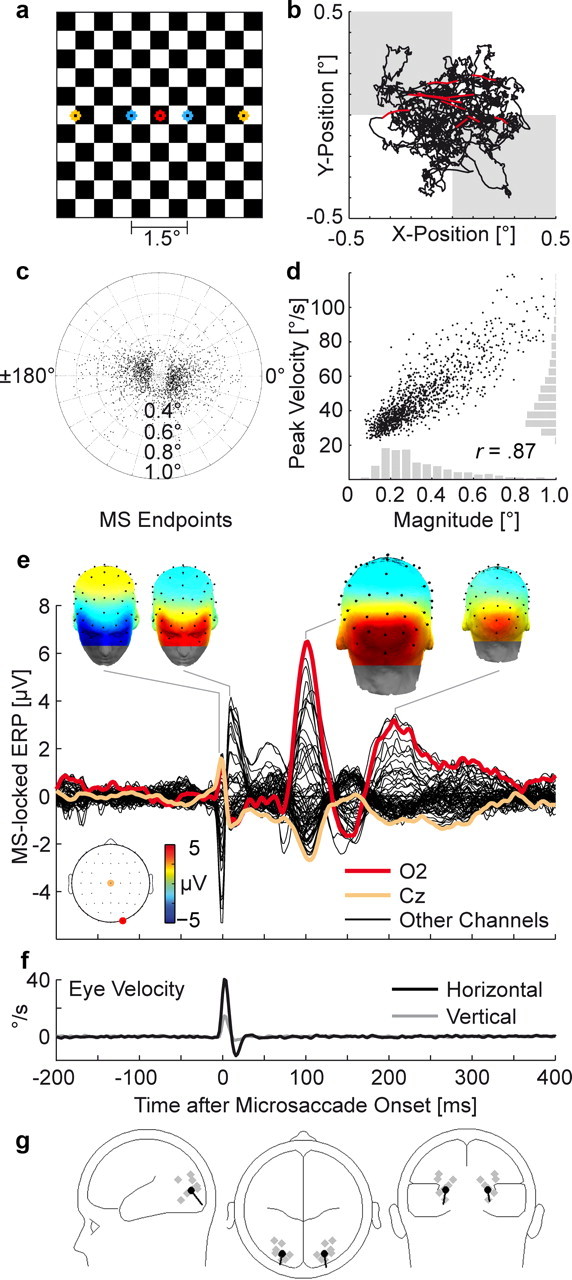
Microsaccade-related potentials during checkerboard fixation. a, Central part of the checkerboard with fixation point (red) and voluntary saccade targets (blue and yellow). b, Typical trajectory of the right eye during 10 s of attempted fixation. Data points belonging to microsaccades are plotted in red. Background shading symbolizes the checkerboard's check size. c, Spatial distribution of 1225 microsaccades. The center represents the microsaccade starting point, and dots indicate endpoints. d, Microsaccades showed the typical correlation between peak velocity and magnitude. Marginal distributions are plotted in gray. e, Grand average ERP, time-locked to microsaccade onsets (time 0). Signals at all EEG and EOG channels are plotted superimposed; electrodes over right occipital cortex (O2) and the vertex (Cz) are highlighted. Inserts show scalp distributions at selected time points. Microsaccade onset was accompanied by a biphasic muscle spike potential (SP) with periocular maxima. After 106 ms, microsaccades evoked a microsaccadic lambda response (MLR) with maxima over visual cortex and, with reversed polarity, vertex. f, Grand mean eye velocity from simultaneous eye tracking. Negative velocities represent movements against the predominant direction of the microsaccade. g, Two-source equivalent dipole model, fitted to the MLR peak. Dipole estimates for single subjects are plotted in gray.
In block 1, the subjects' only task was to maintain perfect fixation on the central red fixation point during 31 trials. Each fixation trial lasted 10 s, but was immediately aborted and repeated if the subject blinked or if a gaze sample deviated >2° from the fixation point. This occurred in 35% of the trials. In blocks 2 and 3, subjects performed self-paced horizontal saccades (here: “macrosaccades”) between pairs of blue (1.5° apart) and yellow (4.5° apart) points that were located symmetrically to the left and right of the central fixation point. Because points were separated by odd numbers of checkers (3 or 9), a precise saccade resulted in a transsaccadic inversion of the retinal image (Riemslag et al., 1987). Subjects were instructed to execute saccades at an approximate pace of 0.6 Hz. Pacing was indicated by five beep tones played before the start of each 90 s saccade trial.
Eye-movement recording.
Fixational eye movements were recorded monocularly from the right eye with an infrared video-based eye tracker (IView-X Hi-Speed 1250, SMI GmbH) at a sampling rate of 500 Hz and an instrument spatial resolution of 0.01°. Viewing was binocular. Head position was stabilized via the inbuilt chin and forehead rests of the eye tracking column. After every fifth trial, the system was recalibrated with a 13-point grid.
EEG recording.
The EEG was recorded from 60 Ag/AgCl scalp electrodes (including low electrode sites, e.g., FT9, PO9, Iz) mounted in a cap at standard 10–10 positions (American Electroencephalographic Society, 1994). Additionally, electrooculogram (EOG) electrodes were affixed at the outer canthus and infraorbital ridge of each eye. Frontal electrodes were foam-cushioned to avoid pressure artifacts from the forehead rest. An electrode on the vertebra prominens served as ground. EEG and EOG channels were referenced against left mastoid (M1) during recording and rereferenced offline against the average of all electrodes. Impedances were kept at <5 kΩ. The EEG was amplified with a Brainamp DC amplifier (Brain Products), digitized at 500 Hz with a bandpass from DC to 100 Hz, and high-pass filtered offline at 1 Hz (12 db). For dipole modeling, three-dimensional electrode locations were acquired with a CMS20 digitizer (Zebris Medical). EEG and FEM recordings were synchronized via a common TTL pulse, sent from the presentation PC (running Presentation Software, Neurobehavioral Systems) to both systems before and after each trial.
Microsaccade detection.
Microsaccades were detected in 8 s intervals beginning 1 s after checkerboard onset and ending 1 s before offset. Microsaccades were defined as outliers in 2D velocity space using the algorithms detailed in Engbert and Mergenthaler (2006) (MATLAB functions downloadable at www.agnld.uni-potsdam.de/∼ralf): First, eye velocity was computed with a modified version (Engbert and Mergenthaler, 2006) of a central difference algorithm (Bahill et al., 1982) to suppress high-frequency noise. Microsaccades were then defined as parts of the eye movement trajectory where velocity (combined for the vertical and horizontal movement component) exceeded a relative velocity threshold for a minimum duration of 3 samples (6 ms). The velocity threshold was set to 5 median-based SDs of the velocity values observed in the entire 8 s interval. Additionally, microsaccades were required to have a magnitude <1° and a temporal distance from the previous microsaccade of >50 ms. Saccade magnitude was defined as the Euclidean distance between the start and end point of the movement. Identical parameters were used to detect macrosaccades, but minimum magnitude was set to 1° to exclude microsaccades and corrective saccades in these blocks.
Microsaccade-locked EEG.
An EEG segment of 1024 ms (−400 to 624 ms) was cut around the onset of each detected microsaccade and baseline-corrected by subtracting from each channel the mean voltage in the 100 ms interval before microsaccade onset. Segments with absolute voltages >150 μV in any channel (2% of segments) were discarded to exclude nonocular artifacts from voltage drifts or amplifier saturation. To obtain microsaccade-locked event-related potentials (ERPs), segments were averaged first within and then across subjects. The same averaging procedure was applied to voluntary saccades in blocks 2 and 3.
For fixation trials, additional averages were computed for microsaccades of different magnitude (using five magnitude bins: <0.2°, 0.2–0.25°, 0.25–0.35°, 0.35–0.45°, >0.45°). To generalize analyses to all types of FEMs (including slower drift intervals), the EEG was also averaged as a function of instantaneous eye velocity at each eye tracker sampling point, regardless of whether a sample belonged to a detected microsaccade or not. For each eye sample, the 150 ms of EEG data following the sample were assigned to one of 25 eye velocity bins (between 0 and 80°/s; upper bin limits were defined by 1.2n °/s, with n = 1 … 24) and subsequently averaged.
Corneoretinal artifact.
Rotation of the bulbus' electrostatic potential (Berg and Scherg, 1991) distorts the signal at electrodes around the eyes. To quantify this corneoretinal artifact (compare Fig. 2 c), microsaccades and macrosaccades were classified as either leftward- or rightward-oriented according to their horizontal movement component. Artifact amplitude was then defined as the mean voltage difference between the horizontal EOG electrode ipsilateral and contralateral to saccade direction in the interval 50–100 ms after saccade onset.
Figure 2.

Lambda response as a function of microsaccade magnitude, eye velocity, and saccade type. a, MLR amplitude after 100 ms as a function of microsaccade magnitude. Shading gives the 95% between-subject CI in one direction. b, Left, EEG voltage at occipital electrode Oz as a function of instantaneous eye velocity during fixation. Right, Voltage 100 ms after the velocity sample. Significant responses are seen after velocities >22°/s. c, Comparison of potentials evoked by microsaccades and larger voluntary saccades. Top, Electrode Oz. Inserts show scalp topographies at movement onset (0 ms) and at the peak latency of the lambda response. Note the similarity between the micro- and macrosaccadic lambda response despite large differences in saccade magnitude. Bottom, Corneoretinal artifacts are evident as a voltage difference between the horizontal EOG electrodes ipsilateral and contralateral to saccade direction. Note the small artifact for microsaccades.
Dipole modeling.
Generators of microsaccade-related brain potentials were modeled with equivalent current dipoles in BESA (Brain Electromagnetic Source Analysis, v5.1, Megis) using a four-shell spherical head model. Both one- and two-dipole models have been used to model the lambda response following macrosaccades (Kazai and Yagi, 2003) and the P1 visual evoked potential (VEP) (Tobimatsu and Celesia, 2006); here we used a pair of dipoles with the constraint of a bihemispheric mirror-symmetric location (Di Russo et al., 2005). First, two regional sources (each consisting of three orthogonal dipoles) were fitted to the maximum in global field power (GFP; the SD across electrodes) between 75 and 125 ms after microsaccade onset. Each regional source was then oriented and its predominant dipole was retained. The model was fitted both to the grand average microsaccade-locked ERP and to each subject average.
Frequency domain.
To test the influence of microsaccade-related muscle and brain potentials on the EEG spectrum, microsaccade-locked segments were subjected to a wavelet-based time–frequency analysis (see supplemental material, available at www.jneurosci.org).
Experiment 2: face fixation
Three subjects (2 women, age 26–31, uncorrected normal acuity), naive and different from those in Exp. 1, were instructed to maintain perfect fixation on a 0.2° point presented in the center of a stationary image of a face (see Fig. 3 a). Images were derived from a stimulus set previously used in ERP studies on face processing (Schacht et al., 2008). Each image showed a 7.5° × 8.5° frontal view of a face with frontal gaze direction and without external features (e.g., hair), presented on a homogeneous 14 cd/m2 gray background. Six different images were repeatedly shown in 48 fixation trials per subject, each lasting 10 s. Recording hardware, fixation procedure, microsaccade detection, and EEG analyses were identical to Exp. 1.
Figure 3.
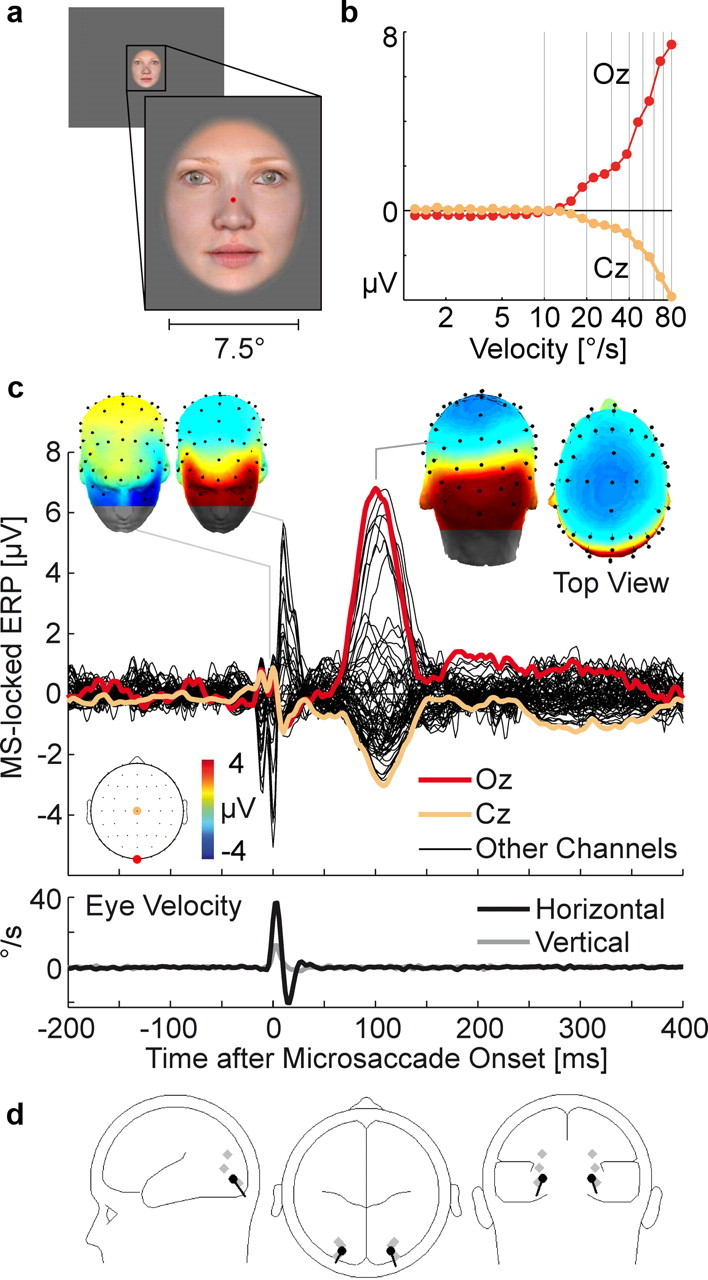
Microsaccade-related potentials during face fixation. a, Example stimulus. b, EEG voltage as a function of instantaneous eye velocity 100 ms earlier. c, Grand average microsaccade-locked ERP. The double spike at microsaccade onset is due to an individual subject for whom the SP preceded movement onset by 10 ms. This caused a doubled SP in the grand average ERP (see supplemental Fig. S3, available at www.jneurosci.org as supplemental material). d, Dipole model at the peak of the MLR.
Experiment 3: visual oddball task
To assess the presence of microsaccade-related brain potentials in typical event-related EEG data, we reanalyzed data from a visual oddball experiment with simultaneous FEM recording (Valsecchi et al., 2009).
Subjects.
Subjects were 12 healthy adults (9 female, age 20–29) with self-reported normal acuity and normal color vision (Ishihara, 2003). The sample included two authors (O.D., M.V.); the other subjects were naive as to the purpose of the experiment.
Experimental protocol.
Subjects were instructed to minimize eye blinks and to maintain fixation on a 0.48° white point that was continuously displayed on an otherwise empty black screen. Once per second, a red or green disc with a diameter of 2.04° appeared for 100 ms around the fixation point (see Fig. 4 a). The subject's task was to count silently the stimuli with the prespecified target color. Every 50 trials, presentations were paused and subjects entered the number of targets with a keyboard. Stimuli were presented on a 19 inch monitor (LG Flatron 915FT, 1024 × 768 pixel, vertical refresh 100 Hz) at a viewing distance of 75 cm. Luminance of red and green discs was matched using 25 Hz flicker fusion (Ives, 1912) and the assignment of target color (red or green) was counterbalanced over subjects.
Figure 4.
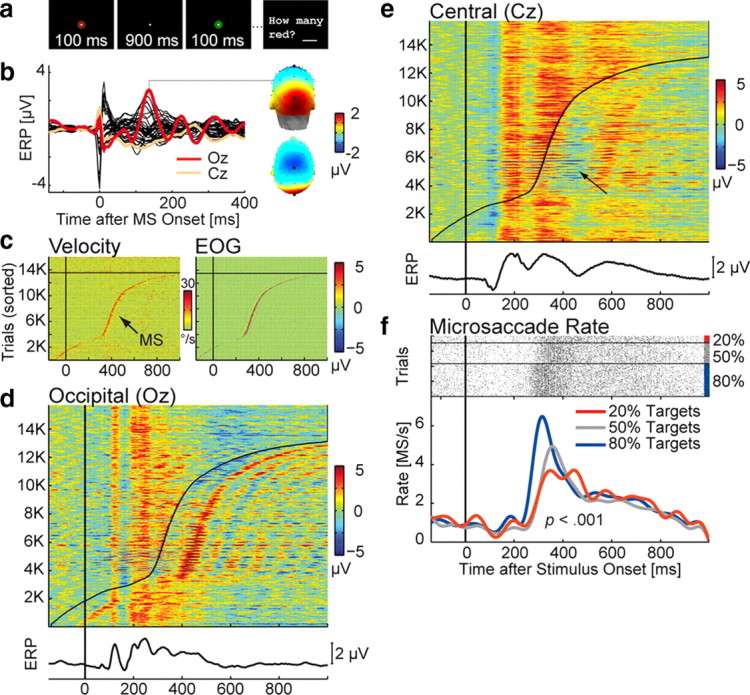
Microsaccade-related potentials in the oddball experiment. a, Trial scheme: Subjects silently counted discs of the target color. b, Grand average ERP, time-locked to the onset of microsaccades detected during experimental trials. The MLR peaked after 136 ms over visual cortex and the vertex. c, Eye velocity and EOG voltage (color-coded) in 15,732 experimental trials. Each horizontal line represents the data of one trial; Time 0 marks stimulus onset. Trials are sorted from bottom to top according to the latency of the first microsaccade detected in the trial. Trials with no microsaccade are plotted above the black line. Left, Rectified velocity of the right eye. Microsaccades are evident as a peak in eye velocity. Right, Signal at the right infraorbital EOG electrode, high-pass filtered at 30 Hz. The SP is visible as a spike at microsaccade onset. d, Sorted trials at electrode Oz. Microsaccade latency is indicated by the black line. The presence of MLRs in the stimulus-locked data becomes apparent after sorting. e, MLRs have a negative polarity at Cz. The positive-going P300 component is therefore attenuated in trials in which a microsaccade occurred 200–300 ms after stimulus onset (arrow). f, Microsaccade rate for target stimuli. Top, Each horizontal line represents one trial; microsaccades are marked with dots. Bottom, Microsaccade rate, smoothed with a 10 Hz low-pass filter for visualization. The microsaccadic rebound was significantly smaller in blocks with rare (20%) compared with blocks with frequent (80%) target stimuli.
In three experimental blocks (500 trials each), the frequency of target stimuli was 20, 50, or 80%. Both target status (target or nontarget) and stimulus frequency are known to modulate the amplitude of the P300 component of the ERP in oddball tasks (Duncan-Johnson and Donchin, 1977).
Eye-movement recording.
FEMs were recorded from the right eye with an IView-X Hi-Speed eye tracker (SMI; 238 Hz model) at a sampling rate of 238 Hz and an instrument spatial resolution <0.025°. Viewing was binocular. The system was calibrated every 50 trials with a 9-point grid. Calibration quality was assessed every 10 trials and additional recalibrations were performed if necessary.
EEG recording.
Data were recorded from 36 Ag/AgCl electrodes located at standard 10–10 positions and four periocular EOG electrodes at a sampling rate of 250 Hz and a bandpass from 0.1 to 70 Hz. All channels were referenced against left mastoid and converted to average reference offline.
Data analysis.
Eighty-six percent (n = 15,732) of all trials were free of eye blinks and used in subsequent analyses. In each trial, lasting from −100 to 1000 ms after stimulus onset, microsaccades were detected with the same algorithm (Engbert and Mergenthaler, 2006), but detection parameters were adjusted to the lower sampling rate of the eye tracker (min. duration: 4 samples; velocity threshold: 6 SD). Two sets of EEG segments were extracted: The first was time-locked to microsaccade onsets and averaged to visualize microsaccade-related potentials (compare Fig. 4 b). The second was cut around stimulus onsets.
Two analyses were performed on the stimulus-locked segments: In analysis 1, segments were sorted according to the latency of the first microsaccade in the trial (see Fig. 4 c–e) using the erpimage function of the EEGLAB toolbox (Delorme and Makeig, 2004) for MATLAB (The MathWorks). For visualization, microsaccade-sorted trials were smoothed with a moving average across 20 (see Fig. 4 c) or 70 (see Fig. 4 d,e) adjacent segments after sorting. In analysis 2, the ERP from all trials (overall ERP) was compared with the ERP from two subsets of trials: trials with (MS-present ERP) and trials without (MS-absent ERP) a microsaccade. Because few trials (14%) were completely free of microsaccades, the absent–present split was not based on the complete trial, but on microsaccade occurrence between 200 and 400 ms. This interval corresponds to the typical latency of the poststimulus rebound in microsaccade probability during which most experimental effects on microsaccade behavior have been observed in previous studies (Engbert and Kliegl, 2003; Valsecchi et al., 2007).
MS-present and MS-absent trials were averaged separately for each subject and condition (targets/nontargets with 20%, 50%, 80% frequency). To test whether microsaccades influence stimulus-locked ERPs, MS-present ERPs and MS-absent ERPs were compared at four electrodes on the posterior sagittal midline: Cz, Pz, Oz, and Iz. Mean ERP voltages between 350 and 550 ms after stimulus onset were submitted to repeated-measures ANOVAs on factors electrode, stimulus frequency, and microsaccade presence (MS-present vs MS-absent). Separate ANOVAs were conducted for target and nontarget trials. To correct for violations of the sphericity assumption, p values were corrected according to Huynh-Feldt. If microsaccadic brain potentials influence ERPs, this influence should be larger in conditions with more and smaller in conditions with fewer microsaccades. Analogous tests were therefore performed on the difference between the overall ERP and the MS-absent ERP. Whereas the absent–present split compares two extreme scenarios (microsaccade in none of the trials vs microsaccade in every trial), regardless of actual microsaccade rate, the comparison between overall and MS-absent ERPs takes into consideration the varying proportion of microsaccade trials in different experimental conditions. As a global measure of ERP distortion, we computed for each condition the GFP of the difference between grand-mean overall ERP and grand-mean MS-absent ERP.
Results
Checkerboard fixation
Figure 1 b shows a typical eye movement trajectory during 10 s of checkerboard fixation. On average, 153 microsaccades were detected per subject in 247 s of analyzed fixation. This relatively low microsaccade rate (0.62 Hz) is consistent with findings that subjects can voluntarily suppress some of their microsaccades if strong fixation instructions are given during prolonged fixation (Steinman et al., 1967). The median of microsaccade magnitude was 0.29° (SD of median across subjects: ±0.06°), median peak velocity was 48.1°/s (±12.4), and median duration was 10.0 ms (±1.5). Eighty-five percent of microsaccades were smaller than 0.5°. In agreement with previous research, most microsaccades were oriented horizontally (Fig. 1 c). Microsaccade peak velocity and magnitude were highly correlated (r = 0.87) and followed the “main sequence” (Zuber et al., 1965) characteristic for saccadic movements (Fig. 1 d; supplemental Fig. S1, available at www.jneurosci.org as supplemental material).
Microsaccadic lambda response
Figure 1 e shows the grand averaged ERP, time-locked to microsaccade onset. A key finding of the present study is that microsaccades evoked a large potential peaking M = 106 ms (SD ± 3.5, at electrode O2) after movement onset. We will refer to this potential as microsaccadic lambda response (MLR) because—as we will argue—it closely resembles the lambda response observed after macrosaccades (Thickbroom et al., 1991; Kazai and Yagi, 2003). Maxima of the MLRs were observed over right visual cortex (electrode O2) and—with opposite polarity—at midcentral electrode Cz with a peak voltage difference between both electrodes of M = 9.6 μV (±5.6, range across subjects: 4.2–18.9 μV). The dominant MLR was followed by a second occipital peak at 208 ms, which has been observed in similar form after voluntary 1° saccades on checkerboard stimuli (Riemslag et al., 1987).
Dipole modeling produced MLR source locations in occipital cortex (Fig. 1 g). Talairach dipole coordinates for the grand average-based, two-dipole model were x = ±24 mm (±6), y = −82 mm (±11), and z = 3 mm (±9, SDs are based on the variance between single subject models), corresponding to locations in the middle occipital or lingual gyri. Residual model variance was <2% at the MLR peak. However, because of the limited spatial resolution of EEG inverse models, the data allowed no distinction whether striate or early extrastriate sources accounted for the MLR.
Figure 2 a shows MLR peak amplitude as a function of microsaccade magnitude. At occipital electrodes, amplitude increased monotonically from smaller to larger microsaccades (Fig. 2 a). Using 95% between-subject confidence intervals (CIs) as a criterion, significant MLRs were observed even for the smallest bin of microsaccades with a median magnitude of 0.15°. Figure 2 b (left) shows occipital EEG voltage as a function of instantaneous eye velocity at every sample during the fixation interval. Faster movements were followed by an occipitocentral potential after 100 ms (the latency shown in Fig. 2 b, right) and this effect was significant for velocities >22°/s. Occipital potentials were therefore restricted to movements in the velocity range of microsaccades, but not measurable at slower eye velocities. In the frequency domain, the transient MLR waveform translated to increased spectral power in the theta and lower alpha band at occipital electrodes ∼100 ms after microsaccade onset (see supplemental Fig. S2, available at www.jneurosci.org as supplemental material).
Comparison to voluntary saccades
Microsaccadic potentials were compared with those evoked by macrosaccades of 1.5° (median magnitude, peak velocity, and duration: 1.61°, 159.7°/s, and 15.1 ms, respectively) and 4.5° (4.71°, 283.3°/s, and 30.1 ms, respectively). Figure 2 c (top) shows that despite large differences in magnitude, microsaccades and macrosaccades evoked lambda responses with very similar scalp distributions and comparable peak amplitudes. All saccade types were accompanied by a corneoretinal artifact (Fig. 2 c, bottom). Artifact size was proportional to saccade magnitude with a mean effect in the bipolar EOG of 2.3, 21.5, and 61.5 μV for microsaccades, 1.5°, and 4.5° saccades, respectively. The microsaccadic corneoretinal artifact was therefore not only considerably smaller than the microsaccadic brain potential, but far too small to exceed the EOG-based rejection thresholds (typically set to 20–100 μV) commonly applied to identify EEG segments with blinks or saccades.
Spike potential
Our data replicate recent reports of a microsaccadic spike potential in the EEG (Reva and Aftanas, 2004; Trujillo et al., 2005; Yuval-Greenberg et al., 2008). While cerebral contributions to the SP have been discussed (Nativ et al., 1990; Parks and Corballis, 2008), it is generally thought to originate in the extraocular muscles and to reflect a summation of EMG spikes during the maximal recruitment of motor units at saccade onset (Moster and Goldberg, 1990; Sparks, 2002). Microsaccades, in particular, are accompanied by an EMG burst in the agonistic rectus muscle that begins 5 ms before movement onset (Yamazaki, 1968). The SP peaked at microsaccade onset (0 ms, ±1.0 ms) and was largest as a negative deflection at the infraorbital EOG electrode ipsilateral to microsaccade direction (Thickbroom and Mastaglia, 1986) and as a positive deflection at the vertex (Fig. 1 e). In the frequency domain, the transient SP translated to a broad band artifact in the high beta and gamma band around microsaccade onset (see supplemental Fig. S2, available at www.jneurosci.org as supplemental material).
Face fixation
Experiment 2 tested whether the large microsaccadic lambda response was specific to the full-screen, high-contrast checkerboard or whether it generalizes to the fixation of smaller face stimuli (Fig. 3 a). This material is typical of the pictorial stimuli often used in cognitive neuroscience.
While fixating the faces, subjects made an average of 337 microsaccades in 382 s of fixation, corresponding to an average rate of 0.88 Hz. Movement kinematics were similar to Exp. 1, with a median magnitude of 0.27° (±0.07), peak velocity of 43.9°/s (±13.1), and duration of 10.0 (±0.0) ms (supplemental Fig. S1, available at www.jneurosci.org as supplemental material). Figure 3, b and c, show the microsaccade-locked EEG and its relationship to eye velocity: Again, microsaccades evoked an MLR that peaked after M = 104 ms (±8.0) with a mean Oz-Cz voltage difference of 10.6 μV (±1.2). Dipoles for the two-dipole model were localized in the middle occipital gyri [x = ±23 mm (±2), y = −85 mm (±8), and z = 6 mm (±7)] (Fig. 3 d) with a residual variance <1%. Thus, the MLR resembled that from Exp. 1 in terms of latency, amplitude, scalp topography, and estimated dipole source.
Visual oddball task
Results of experiments 1 and 2 imply that MLRs may be frequently present during EEG recordings that require steady fixation. Experiment 3 therefore tested the presence and impact of MLRs in a classic paradigm for eliciting cognitive ERP components, the visual oddball task.
MLRs in oddball task
Concurrent eye tracking revealed that on average, subjects made 1925 microsaccades during 1311 analyzed trials of the oddball experiment (or 1.47 per second). Microsaccades had a median magnitude of 0.23° (±0.07) (supplemental Fig. S1, available at www.jneurosci.org as supplemental material) and were again accompanied by both SP and MLR (Fig. 4 b); the latter peaked at Oz after 136 ms, but also had a negative maximum at Cz with a Oz-Cz difference of M = 3.97 μV (±2.1, range 1.7–9.1 μV). The MLR was therefore considerably smaller and more delayed relative to Exps. 1 and 2. This difference is probably explained by differences in retinal stimulation: 95% of the microsaccades occurred during the interstimulus interval when the only stimulus was the 0.48° fixation point. Still, MLR amplitude was as large as that of the P1 visual component elicited by the trial-initial onset of the disc stimulus (supplemental Fig. S4, available at www.jneurosci.org as supplemental material). In several subjects, the initial MLR peak was followed by a damped oscillation at occipital sites (Fig. 4, compare b, d), which resembled the poststimulus alpha ringing sometimes observed in VEPs (Makeig et al., 2002).
Of all experimental trials, 86% contained at least one microsaccade. The presence of microsaccadic muscle and brain potentials became evident when stimulus-locked EEG segments were sorted according to the latency of the first microsaccade in each trial: While the SP is seen best in the high-pass filtered data from infraorbital EOG electrodes (Fig. 4 c, right), the strong overlap with MLRs is evident even in the unfiltered EEG, both at occipital electrodes (Fig. 4 d) and, with reversed polarity, at midcentral electrodes (Fig. 4 e). This means that early visual processing areas were engaged at least twice in a typical trial (Fig. 4 d).
Microsaccade rate effects
Figure 4 f shows the rate of microsaccades after the presentation of target stimuli. Microsaccade rate has been shown to follow a stereotypical time course after sensory events, with an early inhibition followed by a later rebound (Engbert and Kliegl, 2003; Rolfs et al., 2008). This was also observed here: Microsaccade probability decreased temporarily after stimulus onset, but then increased strongly after ∼200 ms and reached a maximum at 320 ms. Importantly, magnitude and latency of the rebound differed as a function of the frequency of target stimuli in the experimental block: Microsaccade rate was significantly lower after the presentation of rare (20%) compared with frequent (80%) target stimuli [ANOVA on the effect of target stimulus frequency on microsaccade rate between 220 and 420 ms, F (2,22) = 21.2; p < 0.001; for details, see Valsecchi et al. (2009)]. Additionally, the peak latency of the rebound was delayed for rare stimuli (F (2,22) = 12.1, p < 0.001). No effects of stimulus frequency were observed for nontargets. These results corroborate previous findings that the microsaccadic rebound is decreased in response to infrequent task-relevant stimuli in visual (Valsecchi and Turatto, 2007; Valsecchi et al., 2007) and auditory (Valsecchi and Turatto, 2009) oddball tasks.
ERP modulation from MLRs
To assess the impact of MLRs on stimulus-locked ERPs, we compared the ERP from trials with (56%) and without (44%) a microsaccade during the rebound interval (Fig. 5 a). Figure 5 b shows that ERP waveforms were systematically modulated as a function of microsaccade occurrence: In trials with microsaccades, occipital electrodes showed more positive and central electrodes more negative voltages, respectively. This polarity reversal of the microsaccade effect yielded an electrode × microsaccade presence interaction on ERP amplitude between 350 and 550 ms, for both target (F (3,33) = 28.4, p < 0.001, ηp 2 = 0.72) and nontarget (F (3,33) = 15.4, p < 0.001, ηp 2 = 0.58) stimuli. Post hoc tests at individual electrodes showed that the difference between MS-absent and MS-present trials was significant (p < 0.01) at all four electrodes for targets and nontargets.
Figure 5.
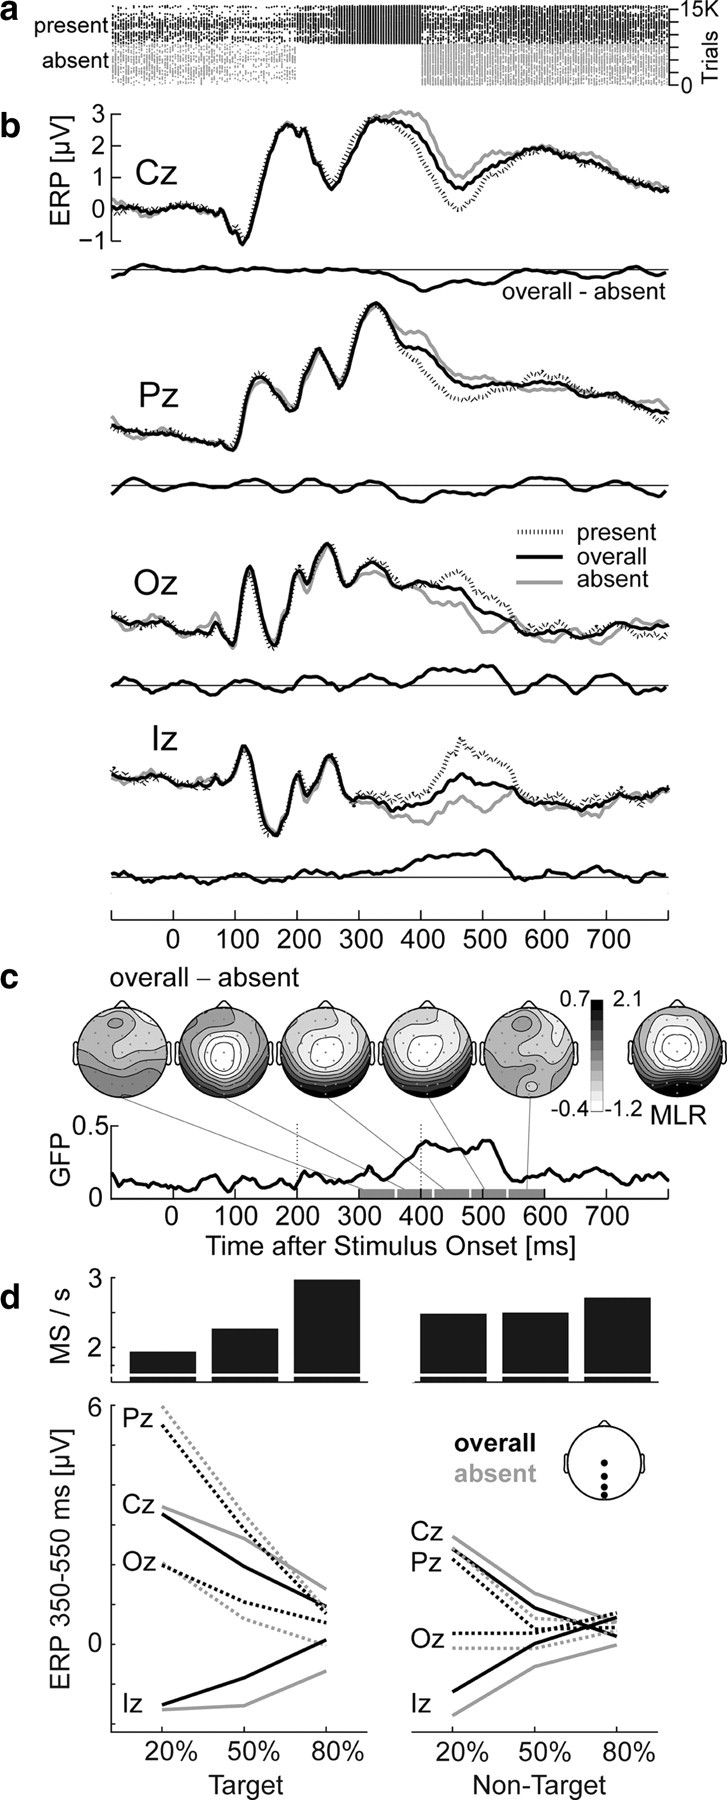
Stimulus-locked ERP in the oddball experiment as a function of microsaccade occurrence between 200 and 400 ms. a, Horizontal lines represent trials; dots mark microsaccades (MS). MS-present and MS-absent trials are plotted separately. b, ERP for MS-absent trials, MS-present trials, and the overall set of trials. Central electrodes show negative and occipital electrodes positive deflections in trials with microsaccades. Difference waves compare the ERP from all trials to that from MS-absent trials only. Note that experimental conditions are equally weighted in this plot, i.e., MS-absent, MS-present, and overall ERPs were first computed in each condition, and only then collapsed across conditions. c, Scalp topography and global field power of the microsaccade effect. Its topography (shown for 60 ms intervals between 300 and 600 ms) resembled the peak topography of the MLR (shown for comparison) and its latency reflected the delay between microsaccade onset and MLR peak. d, Mean microsaccade rate (between 200 and 400 ms) and ERP amplitude (350–550 ms) for the six conditions. In addition to P300 effects of targetness and stimulus frequency, ERP distortions from microsaccades are evident at all electrodes. For nontargets, both microsaccade rate and ERP distortions were similar for rare and frequent stimuli. For targets, distortions increased with increasing microsaccade rate at occipital electrodes.
Scalp topography and timing of ERP changes (Fig. 5 c) suggest that they were caused by the additional presence of MLRs: The topography of the effect closely reflected the MLR topography and effects occurred mainly between 350 and 550 ms, that is, with a delay of ∼150 ms relative to the rebound window (200–400 ms). This delay is expected from the MLR peak latency, which was 136 ms in this experiment.
The difference between overall ERP and MS-absent ERP provides a realistic estimate of the additional signal attributable to MLRs. At the midline electrodes tested, the maximum size of this difference (overall minus absent) was −0.68 μV at Cz (at 408 ms), −0.52 μV at Pz (404 ms), +0.63 μV at Oz (504 ms), and +0.85 μV at Iz (508 ms). For the current oddball paradigm, this meant that the large centroparietal positivity of the P300 was decreased by microsaccades in late time segments: Across conditions, ERP amplitude between 350 and 550 ms was reduced from 2.50 to 2.06 μV at Cz and from 3.37 to 3.05 μV at Pz.
Because microsaccade rate increased with target stimulus frequency, distortions were expected to be smaller in the 20% condition (with 39% MS-present trials) than in the 50% (46% MS-present trials) and 80% condition (59% MS-present trials). GFP of the microsaccade effect (overall minus absent) increased from 0.31 to 0.36 to 0.39 μV for the three frequencies, indicating that distortions increased with microsaccade rate. A condition-specific effect was supported by a three-way interaction electrode × presence (overall vs absent) × stimulus frequency (F (6,66) = 3.0, p < 0.05, ηp 2 = 0.21) for target stimuli. Post hoc tests showed that the presence × stimulus frequency interaction was strongest at Iz (F (2,22) = 6.3, p < 0.01, ηp 2 = 0.36), where the microsaccade effect was 0.12 μV in the 20%, but 0.76 μV in the 80% condition (Fig. 5 d). This interaction was not significant at Pz, an electrode often used to quantify P300 amplitude. Also, no interaction was observed for nontargets, which also did not differ significantly in microsaccade rate.
In summary, absolute waveforms and topographies of late ERP components were altered by the presence of microsaccadic lambda responses, causing changes in the order of half a microvolt at both central and occipital sites. At occipital sites, distortions tended to increase with increasing microsaccade rate, leading to more positive ERPs for more frequent target stimuli.
Discussion
While the functional relevance of microsaccades has been the subject of intense research, little attention has been given to microsaccade-related activity in the human brain. However, single unit recordings (Martinez-Conde et al., 2004), microsaccade-driven perceptual alternations (van Dam and van Ee, 2006; Martinez-Conde et al., 2006), and pioneering work from the 1960s (Gaarder et al., 1964) indicate that microsaccades could be a relevant source of cortical activity. The current study investigated microsaccade-related potentials and their impact on event-related EEG data. Simultaneous recordings in three groups of subjects, fixating three different stimuli, confirmed that microsaccades are accompanied by a myogenic SP that translates to a spectral artifact in the gamma band (Yuval-Greenberg et al., 2008). Additionally, however, microsaccades generated a sizeable cortical response over the occipital and central scalp, here called microsaccadic lambda response (MLR).
A primarily visual origin of the MLR is indicated by its time course, scalp topography, occipital source, and overall resemblance to the lambda response established for macrosaccades. A visual nature of the latter is suggested by its sensitivity to stimulus properties such as contrast and spatial frequency (Gaarder et al., 1964; Kazai and Yagi, 1999), its absence or strong attenuation for featureless or dark visual fields (Scott and Bickford, 1969), its similarity to the VEP to patterns moved at saccade velocities (Riemslag et al., 1987; Thickbroom et al., 1991), and its dipole source, which has been estimated in striate cortex, close to that of the pattern-reversal P1 (Kazai and Yagi, 2003). While there is some evidence for nonvisual, corollary signals in the perisaccadic and postsaccadic EEG (Kazai and Yagi, 2003), neither the early latency nor the lateralized topography reported for these potentials (Skrandies and Laschke, 1997) was observed here. It is therefore unlikely that nonvisual signals had major contributions to the MLR.
Thus, the MLR most likely reflects a sweep of activation through striate and/or extrastriate cortex following the microsaccade-generated retinal image motion. It may therefore constitute a field-potential analog of microsaccade-related spike bursts previously observed in monkey V1. Martinez-Conde et al. (2000; 2002) proposed that these bursting responses sum up to large-scale synchronized responses in visual cortex, which would present an effective mechanism to maintain the visibility of stationary stimuli. The fact that MLR amplitude resembled that of macrosaccadic lambda responses and VEPs indicates that extended regions of visual cortex are activated by small retinal displacements. This is consistent with the hypothesis that microsaccades contribute to neural coding in the early visual system (Martinez-Conde et al., 2004) and fits the observation that microsaccades often precede switches in visual awareness during multistable vision (van Dam and van Ee, 2006; Martinez-Conde et al., 2006; Laubrock et al., 2008; Troncoso et al., 2008a; 2008b). Because coregistration allows direct comparisons between MLRs and perceptual states (e.g., visibility), it may help to integrate single-cell data with human psychophysics and to investigate the recently established links between microsaccades, visual attention, and cognition.
Methodological implications
The present findings have notable methodological implications. The vast majority of human neuroimaging data (e.g., using EEG, MEG, fMRI) is collected under conditions of sustained fixation. Typical procedures require the subject to fixate steadily during all measurements, based on the assumption that saccade-related brain activity is effectively precluded by fixation.
Results suggest that this assumption is wrong: Even when subjects fixated as precisely as they could, MLRs were frequently overlaid on the EEG. This was apparent in the oddball task, where 86% of the trials contained at least one microsaccade. The presence of MLRs in the stimulus-locked data became immediately evident when trials were sorted by microsaccade latency from concurrent eye tracking. Still, the oddball experiment may have underestimated the typical impact of microsaccades because of the stimulus' small size and short duration. We have recently conducted a follow-up experiment (see supplemental Fig. S5, available at www.jneurosci.org as supplemental material) that required a speeded classification of the faces fixated in Exp. 2. Following common ERP practice, stimuli were presented without an embedded fixation point and remained visible throughout the trial. Under these conditions, 97% of the trials contained small saccades and lambda response amplitude was doubled.
It is therefore possible that many—if not most—event-related EEG datasets contain visual evoked potentials from microsaccades. There are several explanations why these contributions were not considered in previous EEG research: First, microsaccades occur with temporal jitter relative to experimental events. Their contribution is therefore not easily seen in averaged signals. Second, EEG research has traditionally focused on corneoretinal artifacts. These artifacts are (approximately) proportional to saccade magnitude because they result from the rotation of the eyeball's electric dipole (Berg and Scherg, 1991). Microsaccadic artifacts were therefore too small (2.3 μV) to exceed the EOG-based rejection thresholds routinely applied to single-trial EEG data (typically 20–100 μV). The MLR itself, on the other hand, is not detected by artifact rejection methods, as it reflects cortical activity with no topographical resemblance to typical EEG artifacts. Finally, existing EEG (Kennett et al., 2007), MEG (Herdman and Ryan, 2007), and fMRI (O'Connor et al., 2002) studies with eye movement monitoring have typically used eye trackers with insufficient spatiotemporal resolution (e.g., 60 Hz sampling rate) for reliable microsaccade detection.
Condition effects on microsaccades
Microsaccades are not randomly distributed over time. After any sudden onset, their rate drops temporarily below baseline, but rebounds above baseline level between 200 and 400 ms (Rolfs et al., 2008). This inhibition–rebound sequence is triggered by any visual or auditory stimulus, and even environmental sounds such as the click emitted by TMS stimulation (Kanai et al., 2008).
Importantly, recent studies have demonstrated pervasive effects of experimental factors on the rate, orientation, and magnitude of microsaccades during the inhibition–rebound sequence. These factors include the orientation or location of endogenous (Engbert and Kliegl, 2003; Laubrock et al., 2005) and exogenous (Hafed and Clark, 2002; Rolfs et al., 2004) attentional cues; the locus of sustained visual attention (Kohama and Usui, 2002); the luminance contrast and color contrast of a visual stimulus (Rolfs et al., 2008); stimulus modality (auditory vs visual, Rolfs et al., 2005; 2008; Valsecchi and Turatto, 2009); the stimulus symbol used in a simple reaction task (Engbert and Kliegl, 2003); a stimulus' task relevance, relative frequency, and sequential order (Valsecchi and Turatto, 2007, 2009; Valsecchi et al., 2007, 2009); the coherence of picture objects (Yuval-Greenberg et al., 2008); and the timing of manual (Betta and Turatto, 2006) and saccadic (Rolfs et al., 2006) responses. In addition, there are large idiosyncratic differences in fixational instability, both between normal subjects (Nachmias, 1959; Schulz, 1984) and in clinical populations (Martinez-Conde, 2006; see also Zhang et al., 2008).
Any systematic effect on microsaccade rate will result in different degrees of MLR overlap between conditions. In the time domain, this would change the ERP waveshape, shift scalp topographies, bias dipole estimates, and increase overall response variability (Gur et al., 1997). In the frequency domain, the MLR translated to increased spectral power in the alpha and theta band and was followed by several cycles of alpha ringing in Exp. 3. This indicates that microsaccades can influence time–frequency analyses also in frequency bands below gamma.
The specific impact of MLRs will depend on MLR amplitude, the size of any condition effect on microsaccade rate, and the electrode and time window under investigation: Because most microsaccades occur during the microsaccadic rebound and the MLR needs another 100 ms to reach its peak, MLRs will mostly influence late ERP components and their effect will be strongest at occipital and midcentral sites.
In the oddball task, microsaccades modulated the absolute ERP waveshapes and there was evidence for a condition-specific distortion at occipital electrodes. However, microsaccades did not substantially change the overall pattern of results in this experiment, except for an occipital shift in P300 topography as a function of condition, which might be erroneously interpreted as a condition-specific shift in P300 generators. The relative robustness of the P300 results relates to the fact that P300 oddball effects are among the largest in the ERP literature and have a maximum at parietal sites, where MLR effects were small in comparison. This is also the reason why in a previous report (Valsecchi et al., 2009), we did not observe microsaccadic modulations on P300, because we exclusively aggregated parietal electrodes over an earlier time window that was less affected by MLRs. Nevertheless, the present analyses suggest that modulations of experimental effects are likely if the stimulus is large and of high contrast, microsaccade probability varies between conditions, the ERP component of interest occurs late, and experimental effects are small.
Our results also complement the findings of Yuval-Greenberg et al. (2008): They suggest that microsaccadic muscle spikes—and the associated gamma-band artifacts—are inevitably present in the raw EEG; even under optimal conditions where (1) subjects fixate as precisely as they can, (2) a fixation point is continuously shown, and (3) microsaccades are only half the size of those observed by Yuval-Greenberg et al. (2008).
Conclusions
Because microsaccades occur frequently during any fixation task, consideration of their visual potentials should improve the signal-to-noise ratio of ERP data and the variance explained by single-trial models of EEG (e.g., brain–computer interfaces). Furthermore, it is important to stress that unlike the myogenic spike potential (Yamazaki, 1968), the MLR reflects genuine cortical activity and not an EEG-specific artifact. We therefore expect that occipital cortical responses from microsaccades are also frequently overlaid on magnetoencephalographic and possibly hemodynamic datasets. In summary, our results document the importance of simultaneous eye movement monitoring and the need to further understand the factors that influence fixational instability. Microsaccade-related brain potentials are both a tool to study visual perception during fixation and a neglected signal source in human neuroimaging.
Footnotes
This work was supported by Deutsche Forschungsgemeinschaft Forschergruppe 868. We thank A. Pajkert, K. Schäfer, and K. Unger for assistance in data acquisition, A. Terzibaschian for assistance in data analysis, A. Schacht for providing face stimuli, and K. Mergenthaler and M. Rolfs for valuable comments.
References
- American Electroencephalographic Society. Guideline thirteen: guidelines for standard electrode position nomenclature. J Clin Neurophysiol. 1994;11:111–113. [PubMed] [Google Scholar]
- Armington JC, Bloom MB. Relations between the amplitudes of spontaneous saccades and visual responses. J Opt Soc Am. 1974;64:1263–1271. doi: 10.1364/josa.64.001263. [DOI] [PubMed] [Google Scholar]
- Armington JC, Gaarder K, Schick AML. Variation of spontaneous ocular and occipital responses with stimulus patterns. J Opt Soc Am. 1967;57:1534–1539. doi: 10.1364/josa.57.001534. [DOI] [PubMed] [Google Scholar]
- Bach M. The Freiburg Visual Acuity Test—automatic measurement of visual acuity. Optom Vis Sci. 1996;73:49–53. doi: 10.1097/00006324-199601000-00008. [DOI] [PubMed] [Google Scholar]
- Bahill AT, Kallman JS, Lieberman JE. Frequency limitations of the two-point central difference differentiation algorithm. Biol Cybern. 1982;45:1–4. doi: 10.1007/BF00387207. [DOI] [PubMed] [Google Scholar]
- Bair W, O'Keefe LP. The influence of fixational eye movements on the response of neurons in area MT of the macaque. Vis Neurosci. 1998;15:779–786. doi: 10.1017/s0952523898154160. [DOI] [PubMed] [Google Scholar]
- Berg P, Scherg M. Dipole models of eye movements and blinks. Electroencephalogr Clin Neurophysiol. 1991;79:36–44. doi: 10.1016/0013-4694(91)90154-v. [DOI] [PubMed] [Google Scholar]
- Betta E, Turatto M. Are you ready? I can tell by looking at your microsaccades. Neuroreport. 2006;17:1001–1004. doi: 10.1097/01.wnr.0000223392.82198.6d. [DOI] [PubMed] [Google Scholar]
- Delorme A, Makeig S. EEGLAB: an open source toolbox for analysis of single-trial EEG dynamics including independent component analysis. J Neurosci Methods. 2004;134:9–21. doi: 10.1016/j.jneumeth.2003.10.009. [DOI] [PubMed] [Google Scholar]
- Di Russo F, Pitzalis S, Spitoni G, Aprile T, Patria F, Spinelli D, Hillyard SA. Identification of the neural sources of the pattern-reversal VEP. Neuroimage. 2005;24:874–886. doi: 10.1016/j.neuroimage.2004.09.029. [DOI] [PubMed] [Google Scholar]
- Ditchburn RW, Ginsborg BL. Vision with a stabilized retinal image. Nature. 1952;170:36–37. doi: 10.1038/170036a0. [DOI] [PubMed] [Google Scholar]
- Duncan-Johnson CC, Donchin E. On quantifying surprise: the variation of event-related potentials with subjective probability. Psychophysiology. 1977;14:456–467. doi: 10.1111/j.1469-8986.1977.tb01312.x. [DOI] [PubMed] [Google Scholar]
- Engbert R, Kliegl R. Microsaccades uncover the orientation of covert attention. Vision Res. 2003;43:1035–1045. doi: 10.1016/s0042-6989(03)00084-1. [DOI] [PubMed] [Google Scholar]
- Engbert R, Mergenthaler K. Microsaccades are triggered by low retinal image slip. Proc Natl Acad Sci U S A. 2006;103:7192–7197. doi: 10.1073/pnas.0509557103. [DOI] [PMC free article] [PubMed] [Google Scholar]
- Gaarder K, Krauskopf J, Graf V, Kropfl W, Armington JC. Averaged brain activity following saccadic eye movement. Science. 1964;146:1481–1483. doi: 10.1126/science.146.3650.1481. [DOI] [PubMed] [Google Scholar]
- Gur M, Beylin A, Snodderly DM. Response variability of neurons in primary visual cortex (V1) of alert monkeys. J Neurosci. 1997;17:2914–2920. doi: 10.1523/JNEUROSCI.17-08-02914.1997. [DOI] [PMC free article] [PubMed] [Google Scholar]
- Hafed ZM, Clark JJ. Microsaccades as an overt measure of covert attention shifts. Vision Res. 2002;42:2533–2545. doi: 10.1016/s0042-6989(02)00263-8. [DOI] [PubMed] [Google Scholar]
- Herdman AT, Ryan JD. Spatio-temporal brain dynamics underlying saccade execution, suppression, and error-related feedback. J Cogn Neurosci. 2007;19:420–432. doi: 10.1162/jocn.2007.19.3.420. [DOI] [PubMed] [Google Scholar]
- Herrington TM, Masse NY, Hachmeh KJ, Smith JET, Assad JA, Cook EP. The effect of microsaccades on the correlation between neural activity and behavior in middle temporal, ventral intraparietal, and lateral intraparietal areas. J Neurosci. 2009;29:5793–5805. doi: 10.1523/JNEUROSCI.4412-08.2009. [DOI] [PMC free article] [PubMed] [Google Scholar]
- Ishihara S. Concise 14-plate edition. Tokyo: Kanehara Trading; 2003. Ishihara's tests for colour deficiency. [Google Scholar]
- Ives HE. On heterochromatic photometry. Philosophical Magazine. 1912;24:845–853. [Google Scholar]
- Kanai R, Muggleton NG, Walsh V. TMS over the intraparietal sulcus induces perceptual fading. J Neurophysiol. 2008;100:3343–3350. doi: 10.1152/jn.90885.2008. [DOI] [PubMed] [Google Scholar]
- Kazai K, Yagi A. Integrated effects of stimulation at fixation points on EFRP (eye-fixation related brain potentials) Int J Psychophysiol. 1999;32:193–203. doi: 10.1016/s0167-8760(99)00010-0. [DOI] [PubMed] [Google Scholar]
- Kazai K, Yagi A. Comparison between the lambda response of eye-fixation–related potentials and the P100 component of pattern-reversal visual evoked potentials. Cogn Affect Behav Neurosci. 2003;3:46–56. doi: 10.3758/cabn.3.1.46. [DOI] [PubMed] [Google Scholar]
- Kennett S, van Velzen J, Eimer M, Driver J. Disentangling gaze shifts from preparatory ERP effects during spatial attention. Psychophysiology. 2007;44:69–78. doi: 10.1111/j.1469-8986.2006.00470.x. [DOI] [PMC free article] [PubMed] [Google Scholar]
- Kohama T, Usui S. Attentional effects on microsaccadic eye movements. Curr Psychol Cogn. 2002;21:337–395. [Google Scholar]
- Kowler E, Steinman RM. Small saccades serve no useful purpose: reply to a letter by R.W. Ditchburn. Vision Res. 1980;20:273–276. doi: 10.1016/0042-6989(80)90113-3. [DOI] [PubMed] [Google Scholar]
- Laubrock J, Engbert R, Kliegl R. Microsaccade dynamics during covert attention. Vision Res. 2005;45:721–730. doi: 10.1016/j.visres.2004.09.029. [DOI] [PubMed] [Google Scholar]
- Laubrock J, Engbert R, Kliegl R. Fixational eye movements predict the perceived direction of ambiguous apparent motion. J Vis. 2008;8:13.1–13.17. doi: 10.1167/8.14.13. [DOI] [PubMed] [Google Scholar]
- Leopold DA, Logothetis NK. Microsaccades differentially modulate neural activity in the striate and extrastriate visual cortex. Exp Brain Res. 1998;123:341–345. doi: 10.1007/s002210050577. [DOI] [PubMed] [Google Scholar]
- Makeig S, Westerfield M, Jung TP, Enghoff S, Townsend J, Courchesne E, Sejnowski TJ. Dynamic brain sources of visual evoked responses. Science. 2002;295:690–694. doi: 10.1126/science.1066168. [DOI] [PubMed] [Google Scholar]
- Martinez-Conde S. Fixational eye movements in normal and pathological vision. Prog Brain Res. 2006;154:151–176. doi: 10.1016/S0079-6123(06)54008-7. [DOI] [PubMed] [Google Scholar]
- Martinez-Conde S, Macknik SL, Hubel DH. Microsaccadic eye movements and firing of single cells in the striate cortex of macaque monkeys. Nat Neurosci. 2000;3:251–258. doi: 10.1038/72961. [DOI] [PubMed] [Google Scholar]
- Martinez-Conde S, Macknik SL, Hubel DH. The function of bursts of spikes during visual fixation in the awake primate lateral geniculate nucleus and primary visual cortex. Proc Natl Acad Sci U S A. 2002;99:13920–13925. doi: 10.1073/pnas.212500599. [DOI] [PMC free article] [PubMed] [Google Scholar]
- Martinez-Conde S, Macknik SL, Hubel DH. The role of fixational eye movements in visual perception. Nat Rev Neurosci. 2004;5:229–240. doi: 10.1038/nrn1348. [DOI] [PubMed] [Google Scholar]
- Martinez-Conde S, Macknik SL, Troncoso XG, Dyar TA. Microsaccades counteract visual fading during fixation. Neuron. 2006;49:297–305. doi: 10.1016/j.neuron.2005.11.033. [DOI] [PubMed] [Google Scholar]
- Moster ML, Goldberg G. Topography of scalp potentials preceding self-initiated saccades. Neurology. 1990;40:644–648. doi: 10.1212/wnl.40.4.644. [DOI] [PubMed] [Google Scholar]
- Nachmias J. Two-dimensional motion of the retinal image during monocular fixation. J Opt Soc Am. 1959;49:901–908. doi: 10.1364/josa.49.000901. [DOI] [PubMed] [Google Scholar]
- Nativ A, Weinstein JM, Rosas-Ramos R. Human presaccadic spike potentials. Of central or peripheral origin? Invest Ophthalmol Vis Sci. 1990;31:1923–1928. [PubMed] [Google Scholar]
- O'Connor DH, Fukui MM, Pinsk MA, Kastner S. Attention modulates responses in the human lateral geniculate nucleus. Nat Neurosci. 2002;5:1203–1209. doi: 10.1038/nn957. [DOI] [PubMed] [Google Scholar]
- Parks NA, Corballis PM. Electrophysiological correlates of presaccadic remapping in humans. Psychophysiology. 2008;45:776–783. doi: 10.1111/j.1469-8986.2008.00669.x. [DOI] [PubMed] [Google Scholar]
- Reppas JB, Usrey WM, Reid RC. Saccadic eye movements modulate visual responses in the lateral geniculate nucleus. Neuron. 2002;35:961–974. doi: 10.1016/s0896-6273(02)00823-1. [DOI] [PubMed] [Google Scholar]
- Reva NV, Aftanas LI. The coincidence between late non-phase-locked gamma synchronization response and saccadic eye movements. Int J Psychophysiol. 2004;51:215–222. doi: 10.1016/j.ijpsycho.2003.09.005. [DOI] [PubMed] [Google Scholar]
- Riemslag FC, van der Heijde GL, van Dongen MM. Are eye movement evoked potentials different from pattern reversal evoked potentials? Doc Ophthalmol. 1987;66:279–289. doi: 10.1007/BF00213656. [DOI] [PubMed] [Google Scholar]
- Rolfs M, Engbert R, Kliegl R. Microsaccade orientation supports attentional enhancement opposite a peripheral cue: commentary on Tse, Sheinberg, and Logothetis (2003) Psychol Sci. 2004;15:705–707. doi: 10.1111/j.0956-7976.2004.00744.x. author reply 708–710. [DOI] [PubMed] [Google Scholar]
- Rolfs M, Engbert R, Kliegl R. Crossmodal coupling of oculomotor control and spatial attention in vision and audition. Exp Brain Res. 2005;166:427–439. doi: 10.1007/s00221-005-2382-y. [DOI] [PubMed] [Google Scholar]
- Rolfs M, Laubrock J, Kliegl R. Shortening and prolongation of saccade latencies following microsaccades. Exp Brain Res. 2006;169:369–376. doi: 10.1007/s00221-005-0148-1. [DOI] [PubMed] [Google Scholar]
- Rolfs M, Kliegl R, Engbert R. Toward a model of microsaccade generation: the case of microsaccadic inhibition. J Vis. 2008;8:5.1–5.23. doi: 10.1167/8.11.5. [DOI] [PubMed] [Google Scholar]
- Schacht A, Werheid K, Sommer W. The appraisal of facial beauty is rapid but not mandatory. Cogn Affect Behav Neurosci. 2008;8:132–142. doi: 10.3758/cabn.8.2.132. [DOI] [PubMed] [Google Scholar]
- Schulz E. Binocular micromovements in normal persons. Graefes Arch Clin Exp Ophthalmol. 1984;222:95–100. doi: 10.1007/BF02150640. [DOI] [PubMed] [Google Scholar]
- Scott DF, Bickford RG. Stimulus indicators of summated human lambda responses. Arch Neurol. 1969;21:277–284. doi: 10.1001/archneur.1969.00480150067009. [DOI] [PubMed] [Google Scholar]
- Skrandies W, Laschke K. Topography of visually evoked brain activity during eye movements: lambda waves, saccadic suppression, and discrimination performance. Int J Psychophysiol. 1997;27:15–27. doi: 10.1016/s0167-8760(97)00749-6. [DOI] [PubMed] [Google Scholar]
- Sparks DL. The brainstem control of saccadic eye movements. Nat Rev Neurosci. 2002;3:952–964. doi: 10.1038/nrn986. [DOI] [PubMed] [Google Scholar]
- Steinman RM, Cunitz RJ, Timberlake GT, Herman M. Voluntary control of microsaccades during maintained monocular fixation. Science. 1967;155:1577–1579. doi: 10.1126/science.155.3769.1577. [DOI] [PubMed] [Google Scholar]
- Thickbroom GW, Mastaglia FL. Presaccadic spike potential. Relation to eye movement direction. Electroencephalogr Clin Neurophysiol. 1986;64:211–214. doi: 10.1016/0013-4694(86)90167-7. [DOI] [PubMed] [Google Scholar]
- Thickbroom GW, Knezevic W, Carroll WM, Mastaglia FL. Saccade onset and offset lambda waves: relation to pattern movement visually evoked potentials. Brain Res. 1991;551:150–156. doi: 10.1016/0006-8993(91)90927-n. [DOI] [PubMed] [Google Scholar]
- Tobimatsu S, Celesia GG. Studies of human visual pathophysiology with visual evoked potentials. Clin Neurophysiol. 2006;117:1414–1433. doi: 10.1016/j.clinph.2006.01.004. [DOI] [PubMed] [Google Scholar]
- Troncoso XG, Macknik SL, Martinez-Conde S. Microsaccades counteract perceptual filling-in. J Vis. 2008a;8:15.1–15.9. doi: 10.1167/8.14.15. [DOI] [PubMed] [Google Scholar]
- Troncoso XG, Macknik SL, Otero-Millan J, Martinez-Conde S. Microsaccades drive illusory motion in the Enigma illusion. Proc Natl Acad Sci U S A. 2008b;105:16033–16038. doi: 10.1073/pnas.0709389105. [DOI] [PMC free article] [PubMed] [Google Scholar]
- Trujillo LT, Peterson MA, Kaszniak AW, Allen JJB. EEG phase synchrony differences across visual perception conditions may depend on recording and analysis methods. Clin Neurophysiol. 2005;116:172–189. doi: 10.1016/j.clinph.2004.07.025. [DOI] [PubMed] [Google Scholar]
- Valsecchi M, Turatto M. Microsaccadic response to visual events that are invisible to the superior colliculus. Behav Neurosci. 2007;121:786–793. doi: 10.1037/0735-7044.121.4.786. [DOI] [PubMed] [Google Scholar]
- Valsecchi M, Turatto M. Microsaccadic responses in a bimodal oddball task. Psychol Res. 2009;73:23–33. doi: 10.1007/s00426-008-0142-x. [DOI] [PubMed] [Google Scholar]
- Valsecchi M, Betta E, Turatto M. Visual oddballs induce prolonged microsaccadic inhibition. Exp Brain Res. 2007;177:196–208. doi: 10.1007/s00221-006-0665-6. [DOI] [PubMed] [Google Scholar]
- Valsecchi M, Dimigen O, Kliegl R, Sommer W, Turatto M. Microsaccadic inhibition and P300 enhancement in a visual oddball task. Psychophysiology. 2009;46:635–644. doi: 10.1111/j.1469-8986.2009.00791.x. [DOI] [PubMed] [Google Scholar]
- van Dam LCJ, van Ee R. Retinal image shifts, but not eye movements per se, cause alternations in awareness during binocular rivalry. J Vis. 2006;6:1172–1179. doi: 10.1167/6.11.3. [DOI] [PubMed] [Google Scholar]
- Yamazaki A. Electrophysiological study on “flick” eye movements during fixation. Nippon Ganka Gakkai Zasshi. 1968;72:2446–2459. [PubMed] [Google Scholar]
- Yuval-Greenberg S, Tomer O, Keren AS, Nelken I, Deouell LY. Transient induced gamma-band response in EEG as a manifestation of miniature saccades. Neuron. 2008;58:429–441. doi: 10.1016/j.neuron.2008.03.027. [DOI] [PubMed] [Google Scholar]
- Zhang B, Stevenson SS, Cheng H, Laron M, Kumar G, Tong J, Chino YM. Effects of fixation instability on multifocal VEP (mfVEP) responses in amblyopes. J Vis. 2008;8:16.1–16.14. doi: 10.1167/8.3.16. [DOI] [PubMed] [Google Scholar]
- Zuber BL, Stark L, Cook G. Microsaccades and the velocity-amplitude relationship for saccadic eye movements. Science. 1965;150:1459–1460. doi: 10.1126/science.150.3702.1459. [DOI] [PubMed] [Google Scholar]