

Abstract
Inhibition of inappropriate responses is an essential executive function needed for adaptation to changing environments. In stop-signal tasks, which are often used to investigate response inhibition, subjects make “go” responses while they prepare to stop at a suddenly given “stop” signal. However, the preparatory processes ongoing before response inhibition have rarely been investigated, and it remains unclear how the preparation contributes to response inhibition. In the present study, a stop-signal task was designed so that the extent of the preparation could be estimated using behavioral and neuroimaging measures. Specifically, in addition to the conventional go trials where preparation to stop was required (“uncertain-go” trials), another type of go trial was introduced where a stop-signal was never given and such preparation was unnecessary (“certain-go” trials). An index reflecting the “preparation cost” was then calculated by subtracting the reaction times in the certain-go trials from those in the uncertain-go trials. It was revealed that the stop signal reaction time, a common index used to evaluate the efficiency of response inhibition, decreased as the preparation cost increased, indicating greater preparation supports more efficient inhibition. In addition, imaging data showed that response inhibition recruited frontoparietal regions (the contrast “stop vs uncertain-go”) and that preparation recruited most of the inhibition-related frontoparietal regions (the contrast “uncertain-go vs certain-go”). It was also revealed that the inhibition-related activity declined as the preparation cost increased. These behavioral and imaging results suggest preparation makes a complementary contribution to response inhibition during performance of a stop-signal task.
Introduction
Inhibition of inappropriate responses is an essential executive function needed for adaptation to changing environments. Response inhibition has most often been investigated using a stop-signal paradigm (Logan and Cowan, 1984). Prior neuropsychology (Aron et al., 2003) and neuroimaging (Rubia et al., 2001; Aron and Poldrack, 2006; Li et al., 2006a; Leung and Cai, 2007) studies have revealed the neural basis of this function in brain regions including the inferior frontal gyrus (IFG), dorsolateral prefrontal cortex (DLPFC), and intraparietal sulcus (IPS). With the stop-signal paradigm, subjects press a button while they prepare to stop at a stop-signal given suddenly after a short delay period [stop-signal delay (SSD)]. Performance is modeled as a race between a “go process” triggered by presentation of a go stimulus, and a “stop process” triggered by presentation of a stop signal (Logan and Cowan, 1984). When the stop process finishes before the go process, the response is inhibited; when the go process finishes before the stop process, the response is made.
The time required for the stop-signal to be processed, which is called the stop-signal reaction time (SSRT) and reflects the effectiveness of the response inhibition, is estimated for individual subjects in the context of the race model. Notably, although the SSRT is posited to be a robust indicator independent of subjects' strategies (Logan and Cowan, 1984), it remains controversial whether or not that is always the case (Leotti and Wager, 2009). This inconsistency may stem from differences in extent of the preparation across subjects (Rieger and Gauggel, 2002). However, most of these earlier studies did not employ a task design in which the extent of the preparation to stop could be estimated. Consequently, it remains unclear whether the preparatory process before stop-signals influences the processes recruited during response inhibition. Moreover, prior neuroimaging studies have revealed that the brain regions activated by task performance overlap with the brain regions activated during preparation to perform the task (Brass and von Cramon, 2002; Sakai and Passingham, 2006). In particular, a frontoparietal network including the DLPFC and IPS is involved in both inhibition and preparation to inhibit (Hester et al., 2004; Fassbender et al., 2006b), which raises the possibility that the efficiency of response inhibition may be influenced by the preparatory processes.
In the present study, therefore, a stop-signal task was designed to evaluate the contribution made by processes invoked in preparation for response inhibition. The study used not only the conventional go trial, in which preparatory processes were required (uncertain-go trials), but also another type of go trial, in which a stop-signal was never given so preparation was not necessary (certain-go trials). In addition, a new index for measuring the extent of preparation (preparation cost) was introduced, and the relationship between preparation cost and SSRT was examined to determine the behavioral impact of preparation on response inhibition. Finally, the effects of the preparation cost on inhibition- and preparation-related brain activity were investigated to clarify whether they also were influenced by the extent of preparation before response inhibition.
Materials and Methods
Subjects and imaging procedures
Written informed consent was obtained from 22 healthy right-handed subjects (10 males, 12 females; age (mean ± SD: 22.3 ± 1.6) who were then scanned using experimental procedures approved by the institutional review board of the University of Tokyo School of Medicine. The experiments were conducted using a 1.5T functional magnetic resonance imaging (fMRI) system (Stratis II, Hitachi Medical). Localizer images were first collected to align the field of view centered on each subject's brain. T2-weighted spin-echo images were obtained for anatomical reference [repetition time (TR) = 6660 ms; echo time (TE) = 30 ms; 90 slices, slice thickness = 2.0 mm; in-plane resolution = 2 × 2 mm]. For functional imaging, a gradient echo echo-planar sequence was used (TR = 4000 ms; TE = 50 ms; flip angle = 90 degree). Each functional run consisted of 64 whole brain acquisitions (28 × 4 mm slices; interleaved acquisition; field of view = 256 mm; matrix size = 64 × 64; in-plane resolution of 4 mm). The first four functional images in each run were excluded from analysis to allow for the equilibration of longitudinal magnetization.
Behavioral procedures
Visual stimuli were projected onto a screen, which the subjects viewed through prism glasses. A magnet-compatible button was pressed using the right thumb in response to the presented stimuli. The stop signal task in the present study was designed to dissociate the preparation before stopping from the response inhibition during stopping; it consisted of three trial types: certain-go, uncertain-go and stop (Fig. 1). During performance of the task, a circle (2.4° × 2.4° in size) was presented, and its color (cyan, magenta, or yellow) indicated the task instruction. In addition, a gray circle indicated fixation during a 1700 ms intertrial interval. The relationship between the three colors (cyan, magenta, or yellow) and the three types of instruction (a go cue for the certain-go trial, a go cue for the uncertain-go trial, or a stop-signal) was counterbalanced across subjects.
Figure 1.

The stop-signal task designed for the present study. Three trial types (stop, uncertain-go and certain-go) were intermixed in a pseudorandom order. In the uncertain-go trials, a go cue (yellow circle) was presented for 800 ms, and subjects were required to press a button. Sometimes, however, the cue color changed to magenta after a short delay (SSD), and subjects were required to withhold the response (stop trials). Because the go cue was the same in the uncertain-go and stop trials, subjects were required to prepare for response inhibition in the uncertain-go trials (cyan circle). The SSD started at 200 ms and varied from one stop trial to the next based on a tracking procedure described in detail in the Materials and Methods. In the certain-go trials, in contrast, the go cue was given but a stop-signal was never given, and subjects just pressed a button as fast as possible.
In the uncertain-go trials, a go cue (yellow circle) was presented for 800 ms, and subjects were required to press a button. However, the color of the circle sometimes changed to magenta after a short delay (SSD), and subjects were required to withhold the response (the stop trials). Because the go cue was the same in the uncertain-go and stop trials, subjects were required to prepare for response inhibition in the uncertain-go trials. In the certain-go trials, in contrast, a go cue (cyan circle) was given and stop-signals were never given, and the subjects just pressed the button as fast as possible. The difference between the uncertain- and certain-go trials was the processing ongoing before stopping; the certain-go trials did not require preparatory processes, whereas the uncertain-go trials did. The contrast “uncertain-go versus certain-go” trials was expected to reveal brain regions associated with the preparatory processes before inhibition, whereas the contrast “stop versus uncertain-go” trials was expected to reveal brain regions associated with response inhibition during stopping. To evaluate the extent of the preparation, a new index, preparation cost, was calculated for each individual uncertain-go trial by subtracting the mean reaction time in the certain-go trials from that in the uncertain-go trial.
The SSD started at 200 ms and varied from one stop trial to the next based on to a tracking procedure (Band et al., 2003): if the subjects succeeded in withholding the response, the SSD increased by 33 ms; if they failed, however, the SSD decreased by 33 ms. With this tracking procedure, the percentage correct in the stop trials was ∼50%. To evaluate the efficiency of the response inhibition, a traditional index, the SSRT was estimated for each subject using the integration method devised by Logan and Cowan (1984) (supplemental Fig. S1, available at www.jneurosci.org as supplemental material). The reaction times in the uncertain-go trials were rank ordered and the nth reaction time was selected from the ranked list of the uncertain-go reaction times, where n was obtained by multiplying the number of the uncertain-go trials by the probability of responding in the stop trials. The SSRT was then estimated by subtracting the mean SSD from this value. Subjects were instructed not to wait for the stop signals. Ten runs were administered to each subject. In total, 400 (44.4%) uncertain-go, 400 (44.4%) certain-go and 100 (11.1%) stop trials were intermixed in a pseudorandom order.
Data analysis
Data were analyzed using SPM2 software (http://www.fil.ion.ucl.ac.uk/spm/). Functional images were realigned, and slice timing was corrected, normalized to the MNI template (ICBM 152) with interpolation to a 2 × 2 × 2 mm space, and spatially smoothed (full width, half maximum = 8 mm), after which event timing was coded into a general linear model (Worsley and Friston, 1995). Transient events at the times of the correct stop, correct uncertain-go and correct certain-go trials, and other events of no interest, including error trials, were modeled as events using the canonical function in SPM2. Group analyses were conducted using a random effects model. Significant activations were detected using a threshold: p < 0.05 corrected by the false discovery rate (FDR) (Genovese et al., 2002). To calculate the percentage signal change, eigenvariates from regions of interest were extracted from each subject and were averaged across the subjects. To display brain regions associated with both response inhibition and the preparation before stop-signals, a conjunction analysis was performed using a threshold of p < 0.001 by applying the threshold of p < 0.0224 (i.e., 0.0224 × 0.0224 = 0.0005) to both of the contrasts “stop versus uncertain-go trials” and “uncertain-go versus certain-go trials”. A disjunction analysis was also preformed to determine the regions activated by the contrast stop versus uncertain-go trials (p < 0.001) but not uncertain-go vs. certain-go trials (p > 0.1).
Across-subject correlation analysis.
An across-subject correlation analysis was performed relating preparation cost and inhibition-related activity to investigate whether the extent of the preparation influenced the inhibition-related brain activity. The preparation cost for each subject was calculated by subtracting the mean reaction time in the certain-go trials from the mean reaction time in the uncertain-go trials. The inhibition-related brain activity for each subject was then obtained from the contrast uncertain-go versus certain-go trials. For this analysis, a region of interest (ROI) was generated from all the above-threshold (p < 0.05, corrected by FDR) voxels in the group analysis of the contrast stop versus uncertain-go trials (see Fig. 4A). To minimize individual differences in total signal changes (Samanez-Larkin and D'Esposito, 2008), the inhibition-related brain activity was normalized by dividing it by the sum of the inhibition- and preparation-related activity. The normalized inhibition-related activity should reflect the extent to which total brain activity during the stop trial is accounted for by response inhibition. A correlation between the preparation cost and the normalized inhibition-related activity was calculated.
Figure 4.

Reduced inhibition-related activity reflecting increased preparation. A, ROI generated from the group analysis of the contrast stop versus uncertain-go data (FDR <0.05). B, Negative correlation between the normalized inhibition-related activity and the preparation cost. C, Different patterns of activation associated with inhibition and preparation in different estimated preparation costs. A significant contrast-by-preparation interaction was revealed by repeated measures two-way ANOVA performed using contrast (inhibition- and preparation-related activity) and extent of preparation (low- and high-preparation) as factors. D, ROI analyses of the insula, pIFG, pre-SMA and IPS. Significant contrast-by-preparation interactions were revealed in the pre-SMA and IPS.
Within-subject variability analysis.
To further clarify whether the extent of preparation influenced preparation- and inhibition-related activity, the uncertain-go trials were sorted into two categories (low and high) based on the preparation cost within each subject. Specifically, the preparation cost in the individual uncertain-go trials was calculated based on the definition: reaction time of the uncertain-go trials − mean reaction time of the certain-go trials averaged in the same run. The resultant number of trials (mean ± SD) was 199.8 ± 0.6 in low-preparation uncertain-go trials and 199.7 ± 0.6 in high-preparation uncertain-go trials. The preparation cost in the stop trials, however, could not be obtained because reaction time does not exist for the correct stop trials. We therefore assumed that the preparation cost persisted for a while, and that the preparation cost of one stop trial was the same as the preparation cost of the uncertain-go trial that was given immediately before the stop trial. In the event that there were no uncertain-go trials between two stop trials, the latter stop trial was excluded from this analysis. The resultant number of trials (mean ± SD) was 27.4 ± 5.0 in low-preparation stop trials and 33.3 ± 4.2 in high-preparation stop trials.
To verify this estimation, the percentage correct performance in the stop trials immediately following the low- and high-preparation uncertain-go trials, respectively, were subject to a paired t test. We then analyzed the way the preparation cost affected the brain activity. The inhibition-related brain activity (stop vs uncertain-go trials) and the preparation-related brain activity (uncertain-go vs certain-go trials) was calculated for each categories (low or high) using only correct trials. For example, the inhibition-related brain activity under low preparation was calculated based on the contrast “low-preparation stop versus low-preparation uncertain-go” trials. The brain activity was also subjected to repeated measures two-way ANOVA using the category (low and high) and the contrast (preparation- and inhibition-related) as factors. All the combined voxels significantly activated during inhibition (stop vs uncertain-go trials) were used as the ROI, which is the same as in the across-subject analysis. In addition, a ROI analysis was performed for each region [the insula, posterior IFG (pIFG), presupplementary motor area (pre-SMA), and IPS]] using a 6-mm-radius sphere centered at the peak of the inhibition-related activation in each region as the ROI.
Results
Behavioral results
Mean correct performances (mean ± SD) were 99.8 ± 0.4%, 99.9 ± 0.3%, and 53.7 ± 4.3% in the certain-go, uncertain-go and stop trials, respectively. Mean reaction times (mean ± SD) were 367.8 ± 43.8 ms and 473.3 ± 75.5 ms in the certain-go and uncertain-go trials, respectively (Table 1). The difference between the uncertain-go and certain-go trials (preparation cost) was significantly greater than zero (105.4 ± 66.6, t(21) = 7.4, p < 0.001). The SSD was 279.6 ± 88.8 ms and SSRT was 181.7 ± 31.9 (Table 1). Interestingly, the preparation cost was negatively correlated with the SSRT (r = −0.46, p < 0.05) (Fig. 2). Additionally, the subjects were split into two groups (low and high) based on the preparation cost, and it was shown that the SSRT was significantly shorter in the high preparation group [t(21) = 2.1, p < 0.05]. Conversely, the subjects were split into two groups based on the SSRT, and it was shown that higher preparation was accompanied by a marginal trend of shorter SSRT ([t(21) = 1.8, p = 0.08]). These results suggest that sufficient preparation before stopping enhanced the efficiency of response inhibition during the stop trials.
Table 1.
Summary of behavioral data
| Behavioral measure | (Mean ± SD) |
|---|---|
| Certain-go RT | 367.8 ± 43.8 |
| Certain-go % correct | 99.8 ± 0.4 |
| Uncertain-go RT | 473.3 ± 75.5 |
| Uncertain-go % correct | 99.9 ± 0.3 |
| SSD | 279.6 ± 88.8 |
| Stop % correct | 53.7 ± 4.3 |
| SSRT | 181.7 ± 31.9 |
| Stop-respond RT | 430.4 ± 99.0 |
%, Percentage.
Figure 2.

Negative correlation between the preparation cost and SSRT. The preparation cost was negatively correlated with the SSRT (r = −0.46, p < 0.05), suggesting preparation before stop-signal contributed to effective response inhibition.
fMRI results
The functional image data set from the 22 subjects was analyzed using a general linear model implemented in SPM2, and was group-analyzed using a random effect model. As shown in Figure 3A and Table 2, the contrast uncertain-go versus certain-go data (inhibition) revealed prominent brain activity in multiple regions, including the pIFG, DLPFC, anterior cingulate cortex (ACC), pre-SMA, insula/IFG, precuneus and IPS, which is consistent with the results of earlier studies in which go/no-go and stop tasks were used to analyze response inhibition (Garavan et al., 1999; Konishi et al., 1999; de Zubicaray et al., 2000; Liddle et al., 2001; Menon et al., 2001; Rubia et al., 2001; Bunge et al., 2002; Durston et al., 2002; Hester et al., 2004; Kelly et al., 2004; Aron and Poldrack, 2006; Li et al., 2006a; Leung and Cai, 2007; Sumner et al., 2007, Zheng et al., 2008). The contrast uncertain-go versus certain-go data (preparation) also revealed prominent brain activity in multiple regions, including the pre-SMA, IFJ and insula (Fig. 3A; Table 3), and conjunction analysis revealed that most of the regions exhibiting inhibition-related activity were also associated with the preparation ongoing before the stop signals (Fig. 3B; supplemental Table S1, available at www.jneurosci.org as supplemental material). The result of the conjunction analysis thus suggests that during performance of the stop-signal task some of the cognitive processes associated with response inhibition were recruited before stopping. We also conducted disjunction analysis to determine the regions engaged in the contrast uncertain-go versus certain-go trials but not in uncertain-go versus certain-go trials (Fig. 3C; supplemental Table S2, available at www.jneurosci.org as supplemental material). Primarily, the right IFG was engaged in inhibition but not preparation to inhibit.
Figure 3.
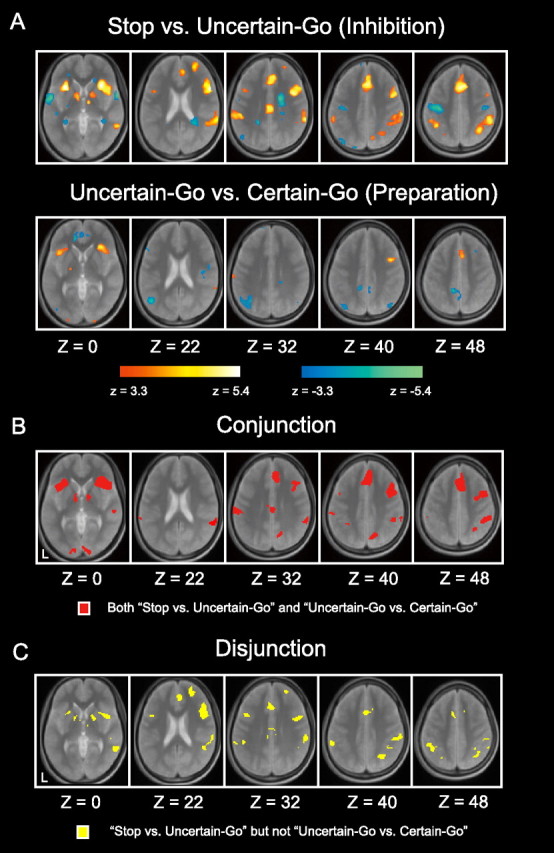
A, Statistical activation maps showing signal increases and decreases in the contrast uncertain-go versus certain-go (top) and uncertain-go versus certain-go (bottom). Activation maps are displayed as transverse sections overlaid on top of an anatomical images averaged across subjects. Statistical significance is indicated using the color scale at the bottom, and the transverse section level is indicated by the Z coordinates in Talairach space (Talairach and Tournoux, 1988). B, Conjunction maps of the contrast uncertain-go versus certain-go and uncertain-go versus certain-go data. C, Disjunction maps showing the regions engaged in the contrast uncertain-go versus certain-go data but not uncertain-go versus certain-go data.
Table 2.
Brain regions showing signal increases in the contrast stop versus uncertain-go trials
| X | Y | Z | t value | Area | |
|---|---|---|---|---|---|
| Lateral frontal cortex | 38 | 16 | −6 | 10.5 | IFG |
| −32 | 18 | 2 | 9.3 | IFG | |
| 54 | 14 | 26 | 8.7 | IFG | |
| 48 | 16 | 18 | 7.6 | IFG | |
| 42 | 6 | 32 | 7.4 | IFG/MFG | |
| 34 | 18 | 14 | 7.0 | IFG | |
| 26 | 52 | 26 | 6.5 | OFC | |
| −44 | 16 | −6 | 6.0 | IFG | |
| 46 | 36 | 16 | 4.7 | IFG/MFG | |
| −44 | 10 | 32 | 4.5 | IFG/MFG | |
| 34 | 8 | 58 | 4.1 | SFG | |
| −40 | 56 | 18 | 4.1 | OFC | |
| −32 | 36 | 18 | 3.9 | IFG/MFG | |
| 32 | −4 | 50 | 3.7 | SFG | |
| 18 | 16 | 58 | 3.4 | SFG | |
| Medial frontal cortex | 4 | 24 | 36 | 8.0 | ACC |
| 2 | 14 | 46 | 7.8 | SFG | |
| 0 | −22 | 32 | 6.6 | PCC | |
| 6 | 42 | 14 | 6.3 | ACC | |
| 6 | 6 | 62 | 4.9 | SFG | |
| −4 | 4 | 60 | 4.0 | SFG | |
| 18 | −6 | 68 | 4.2 | SFG | |
| −8 | 0 | 68 | 3.5 | SFG | |
| Parietal cortex | 64 | −40 | 30 | 7.7 | IPL |
| −42 | −52 | 50 | 6.6 | SPL | |
| 52 | −38 | 48 | 6.6 | SPL | |
| 64 | −30 | 38 | 6.3 | IPL | |
| 36 | −58 | 48 | 6.2 | SPL | |
| −58 | −36 | 36 | 6.2 | IPL | |
| −50 | −42 | 48 | 4.8 | SPL | |
| 12 | −70 | 38 | 4.6 | PCU | |
| 44 | −46 | 40 | 4.5 | IPL | |
| 24 | −62 | 42 | 4.4 | PCU | |
| 64 | −26 | 24 | 4.3 | IPL | |
| −26 | −66 | 50 | 4.3 | PCU | |
| −26 | −60 | 38 | 4.0 | CU | |
| 14 | −36 | 42 | 3.6 | PCU | |
| Occipital cortex | −14 | −96 | 6 | 4.0 | CU |
| Temporal cortex | 64 | −40 | 16 | 7.7 | STG |
| 60 | −48 | 8 | 6.8 | STG/MTG | |
| 52 | −50 | 16 | 6.4 | STG | |
| 52 | −20 | −6 | 4.7 | MTG | |
| −54 | −40 | 20 | 4.5 | STG | |
| 38 | −52 | −14 | 4.1 | MTG | |
| 50 | −30 | −2 | 4.0 | MTG | |
| 36 | −12 | −8 | 3.6 | STG | |
| 54 | −10 | −10 | 3.5 | MTG | |
| Others | 10 | −10 | 2 | 8.3 | Thalamus |
| 16 | 2 | 10 | 7.3 | Caudate | |
| −10 | −2 | 6 | 6.8 | Thalamus | |
| 12 | −18 | 14 | 6.2 | Thalamus | |
| −26 | 16 | −6 | 5.8 | Putamen | |
| 6 | −28 | −22 | 4.4 | Cerebellum | |
| 2 | −50 | −40 | 4.2 | Cerebellum | |
| −30 | −58 | −32 | 3.6 | Cerebellum | |
| −12 | −22 | 18 | 3.6 | Thalamus | |
| 10 | −56 | −36 | 3.4 | Cerebellum |
MFG, Middle frontal gyrus; SFG, superior frontal gyrus; OFC, orbitofrontal cortex; PCC, posterior cingulate cortex; IPL, inferior parietal lobule; SPL, superior parietal lobule; PCU, precuneus; CU, cuneus; MTG, middle temporal gyrus; STG, superior temporal gyrus.
Table 3.
Brain regions showing signal increases in the contrast uncertain-go versus certain-go trials
| X | Y | Z | t value | Area | |
|---|---|---|---|---|---|
| Lateral frontal cortex | 30 | 28 | 2 | 6.5 | IFG |
| 42 | 18 | 4 | 6.0 | IFG | |
| 42 | 6 | 40 | 5.8 | IFG/MFG | |
| −40 | 16 | 0 | 5.4 | IFG | |
| −26 | 26 | −6 | 5.3 | IFG | |
| Medial frontal cortex | 4 | 12 | 52 | 6.1 | SFG |
| 20 | −10 | 56 | 5.5 | SFG | |
| Others | −14 | −20 | 8 | 5.2 | Thalamus |
MFG, Middle frontal gyrus; SFG, superior frontal gyrus.
The behavioral results demonstrate a negative correlation between the SSRT and preparation cost (Fig. 2), which raises the possibility that the extent of preparation (preparation cost) could influence inhibition-related activity. To test that idea, we performed an across-subject analysis (see Materials and Methods) using all the inhibition-related regions as the ROI (Fig. 4A). This analysis revealed that the normalized inhibition-related activity was negatively correlated with the preparation cost [r = −0.60, p < 0.01] (Fig. 4B), which means that subjects whose preparation before stop-signals was sufficient showed relatively less inhibition-related activity. Thus, preparation appears to reduce recruitment of inhibition-related brain regions during stopping.
To assess the extent to which inhibition-related activity is influenced by trial-to-trial variation in the preparation within each subject, we next performed a within-subject analysis (see Materials and Methods). For each subject, the uncertain-go trials were sorted into two categories (low and high) based on the preparation cost. In addition, the preparation costs during the stop trials were estimated based on the preceding uncertain-go trials. A paired t test showed that the percentage correct performance in the high-preparation stop trials (52.3 ± 8.8) was greater than that in low-preparation stop trials (35.4 ± 8.7) [t(21) = 5.4, p < 0.001], which verified that we could estimate the extent of preparation during the stop trials based on the preparation cost of the immediately preceding uncertain-go trials (for full behavioral data, see supplemental Table S3, available at www.jneurosci.org as supplemental material).
By then using all the inhibition-related regions as the ROI determined by the contrast stop versus uncertain-go trials, we were able to determine that inhibition-related activity decreased and preparation-related activity increased as the preparation cost increased (Fig. 4C). The statistical significance of this dissociation was detected as the contrast-by-preparation cost interaction in a repeated measures two-way ANOVA using the contrast (inhibition- and preparation-related activity) and the extent of the preparation (low- and high-preparation) as factors [F(1,84) = 6.6, p < 0.05]. Significant interaction was still observed when the contrasts were stop versus certain-go trials and uncertain-go versus certain-go trials [F(1,84) = 4.3, p < 0.05] (see also supplemental Fig. S2, available at www.jneurosci.org as supplemental material). Moreover, post hoc paired t tests revealed a significant difference between the inhibition-related activity in the high preparation cost category and that in the low preparation cost category [t(21) = 2.0, p = 0.053], as well as between the preparation-related activity in the high and low preparation cost categories [t(21) = 2.1, p < 0.05]. In a separate analysis using three, instead of two, preparation cost categories (low, middle and high) (supplemental Fig. S3, Table S4, available at www.jneurosci.org as supplemental material), paired t tests revealed a significant difference between the inhibition-related activity in the high preparation cost category and that in the low preparation cost category [t(21) = 2.3, p < 0.05], as well as between the preparation-related activity in the high and low preparation cost categories [t(21) = 4.0, p < 0.001]. In addition, in the ROI analyses for the insula, pIFG, pre-SMA and IPS, the IPS revealed significant contrast-by-preparation interactions [F(1,84) = 7.8, p < 0.01] in a repeated measures two-way ANOVA (Fig. 4D). Post hoc paired t tests revealed a significant difference only in the inhibition-related activity between the high and low preparation cost categories only in the IPS [t(21) = 3.4, p < 0.01]. Together with the results from the across-subject analysis, these findings indicate that preparation before stop signals contributes to response inhibition in a complementary manner—i.e., preparation-related activity increases and inhibition-related activity decreases as the extent of preparation increases.
Discussion
For the present study we designed a stop-signal task to estimate the extent of the preparation before stop signals. The behavioral results revealed that the preparation cost and the SSRT are negatively correlated, which suggests that efficiency of response inhibition improves in concert with increases in the extent of the preparation ongoing before the stop signals. The imaging results were consistent with those findings, as the across- and within-subject analyses revealed that the inhibition-related activity decreased as the extent of the preparation increased. Together, the behavioral and imaging results indicate that preparation reduced the demand of inhibition before a stop signal by improving the efficiency of response inhibition.
The behavioral results show that sufficient preparation shortened the reaction time of the stop process (i.e., SSRT), while the imaging results show that preparation reduces inhibition-related activity. The relationship between the efficiency of executive function and related brain activity was often discussed in earlier studies (Bunge et al., 2002; Wager et al., 2005; Li et al., 2006a; Aron et al., 2007; Leung and Cai, 2007; Zheng et al., 2008). Among these studies, several reported that increased brain activity corresponded to highly efficient executive function (Li et al., 2006a; Aron et al., 2007; Leung and Cai, 2007), while others reported that increased brain activity corresponded to high task demand (Zheng et al., 2008). That the efficiency of response inhibition improved as preparation increased suggests this improvement may have reduced the demand of response inhibition during stopping, and the preparation may to some degree recruit stop processing before a stop signal. Thus, the reductions in the SSRT and inhibition-related activity corresponding to increased preparation suggest there was a complementary relationship between the preparation and the response inhibition during performance of the stop-signal task.
The imaging results revealed that inhibition-related activity was elicited in multiple brain regions, including the pre-SMA, IFG, IFJ, TPJ, IPS, and insula, which is consistent with previous studies (Konishi et al., 1998, 1999; Garavan et al., 1999; de Zubicaray et al., 2000; Liddle et al., 2001; Menon et al., 2001; Rubia et al., 2001; Bunge et al., 2002; Durston et al., 2002; Hester et al., 2004; Curtis et al., 2005; Rubia et al., 2005; Vaidya et al., 2005; Vink et al., 2005; Wager et al., 2005; Aron and Poldrack, 2006; Chikazoe et al., 2007, 2009; Leung and Cai, 2007; Sumner et al., 2007; Eagle et al., 2008; Nakata et al., 2008; Coxon et al., 2009; Cai and Leung, 2009). Moreover, the critical role played by the IFG and pre-SMA has been demonstrated in both neuropsychological (Aron et al., 2003; Husain et al., 2003; Hodgson et al., 2007) and transcranial magnetic stimulation studies (Chambers et al., 2006). The task performed in the present study also elicited preparation-related activity in multiple brain regions, including the pre-SMA, IFJ, and insula, and conjunction analysis revealed most of the inhibition-related brain regions were also associated with the preparation for response inhibition. These results point to the involvement of inhibition-related brain regions during go trials without stop signals (i.e., the uncertain-go trials), and suggest that a common neural network is recruited during both the stop and uncertain-go trials. This overlap of preparation- and inhibition-related activity is similar to that seen previously in studies investigating brain regions associated with task preparation (Brass and von Cramon, 2002; Hester et al., 2004; Fassbender et al., 2006a), and suggests that the overlapping activation reflected priming of cortical regions in preparation for the upcoming inhibition. On the other hand, the disjunction analysis revealed that the pIFG was activated during inhibition but not preparation to inhibit. The unique pattern of the pIFG suggests that the preparation processes recruited on the uncertain-go trials consisted of only a part of the inhibitory processes. It is also to be noted that the activation pattern in the pIFG contrasts with those of other areas including the IPS, suggesting the differential roles of these regions.
The extent of the preparation in stop trials was not directly estimated since subjects did not respond in successful trials. However, the within-subject analysis showed that the preparation cost of the preceding uncertain-go trials predicted the performance in the following stop trials, which suggests the extent of the preparation in the stop trials could be estimated from the preparation cost in the immediately preceding uncertain-go trials. However, one recent study (Verbruggen and Logan, 2009) reported that the extent of the preparation before stop signals was adjusted on a trial-by-trial basis, not a block-by-block basis. Consequently, it remains unclear whether the adjusted preparation was influenced by the preceding trials, though it appears that in the present study the degree of the preparation was stable across several trials.
Another caveat regarding the preparation cost is that it may reflect a “waiting strategy,” whereby subjects wait for a stop signal until they are sure of its absence (Rieger and Gauggel, 2002; Sylwan, 2004). In the present study, using a waiting strategy would prolong reaction times in the uncertain-go trials, but not in the certain-go trials, so the preparation cost would therefore increase. However, when using the tracking procedure, the SSD should be prolonged to an extent that corresponds to the increase in the go reaction time attributable to the waiting strategy, thus keeping SSRT constant (Scheres et al., 2001). The negative correlation between the preparation cost and SSRT revealed in the present study contradicts the constant SSRT, and therefore the major part of the preparation cost could not be explained by the waiting strategy. Alternatively, the preparation cost may reflect various components including attention, uncertainty and anticipation (Brass and von Cramon, 2004; Hester et al., 2004; Sakai and Passingham, 2006; Fassbender et al., 2006b). Although the present study is not designed to dissociate these components in the preparation cost, further studies may reveal the differential contribution of these components.
There are some methodological issues to be discussed. First, the present study used 4 s TR, which is longer than typical values used in event-related fMRI studies. The SOA in the present task was 2.5 s, which did not correlate with the 4 s signal sampling. Although a shorter TR should have increased the signal-to-noise ratio, the present study succeeded in detecting significant effects under the condition. Second, the low orthogonality between the two types of go trials may have increased the standard deviation in the group analysis using one-sampled t test. Although the colinearity may have limited the findings, significant effects were successfully detected in the present study. Third, the SSRT estimation method using the mean or median assumes that the percentage correct performance is 50% (Band et al., 2003). On the other hand, the SSRT estimation method used in the present study is a mathematically more general form, and is also frequently used in behavioral literatures (Logan and Cowan, 1984; Logan, 1994; Band et al., 2003; Boucher et al., 2007; Eagle et al., 2008).
Prior behavioral studies that dealt with preparation (Schachar et al., 2004; van Boxtel et al., 2005; Li et al., 2006b; Emeric et al., 2007) have not reported the negative correlation between preparation and the SSRT found in the present study. This finding suggests that the preparatory process plays a complementary role in response inhibition. Although it has been thought that the SSRT is stable, regardless of the strategies used by the subjects, our findings suggest that the SSRT may indeed depend on the subjects' strategies. More extensive exploration will be required to precisely characterize the subcomponents of preparation, but the present study provides evidence that the go and stop processes depend on the extent of preparation and that inhibition-related brain regions, including the pre-SMA, IFJ, and insula, underlie the complementary role of preparation for response inhibition.
Footnotes
This work was supported by a Grant-in-Aid for Specially Promoted Research (19002010) to Y.M. and a Grant-in-Aid for Scientific Research C (17500203) to S.K., by Global COE Program “Integrative Life Science Based on the study of Biosignaling Mechanisms” (12601-A03) to Y.M. and J.C. from the Ministry of Education, Culture, Sports, Science and Technology, Japan, and by the Takeda Science Foundation.
References
- Aron AR, Poldrack RA. Cortical and subcortical contributions to stop signal response inhibition: role of the subthalamic nucleus. J Neurosci. 2006;26:2424–2433. doi: 10.1523/JNEUROSCI.4682-05.2006. [DOI] [PMC free article] [PubMed] [Google Scholar]
- Aron AR, Fletcher PC, Bullmore ET, Sahakian BJ, Robbins TW. Stop-signal inhibition disrupted by damage to right inferior frontal gyrus in humans. Nat Neurosci. 2003;6:115–116. doi: 10.1038/nn1003. [DOI] [PubMed] [Google Scholar]
- Aron AR, Behrens TE, Smith S, Frank MJ, Poldrack RA. Triangulating a cognitive control network using diffusion-weighted magnetic resonance imaging (MRI) and functional MRI. J Neurosci. 2007;27:3743–3752. doi: 10.1523/JNEUROSCI.0519-07.2007. [DOI] [PMC free article] [PubMed] [Google Scholar]
- Band GP, van der Molen MW, Logan GD. Horse-race model simulations of the stop-signal procedure. Acta Psychol (Amst) 2003;112:105–142. doi: 10.1016/s0001-6918(02)00079-3. [DOI] [PubMed] [Google Scholar]
- Boucher L, Palmeri TJ, Logan GD, Schall JD. Inhibitory control in mind and brain: an interactive race model of countermanding saccades. Psychol Rev. 2007;114:376–397. doi: 10.1037/0033-295X.114.2.376. [DOI] [PubMed] [Google Scholar]
- Brass M, von Cramon DY. The role of the frontal cortex in task preparation. Cereb Cortex. 2002;12:908–914. doi: 10.1093/cercor/12.9.908. [DOI] [PubMed] [Google Scholar]
- Brass M, von Cramon DY. Decomposing components of task preparation with functional magnetic resonance imaging. J Cogn Neurosci. 2004;16:609–620. doi: 10.1162/089892904323057335. [DOI] [PubMed] [Google Scholar]
- Bunge SA, Dudukovic NM, Thomason ME, Vaidya CJ, Gabrieli JD. Immature frontal lobe contributions to cognitive control in children: evidence from fMRI. Neuron. 2002;33:301–311. doi: 10.1016/s0896-6273(01)00583-9. [DOI] [PMC free article] [PubMed] [Google Scholar]
- Cai W, Leung HC. Cortical activity during manual response inhibition guided by color and orientation cues. Brain Res. 2009;1261:20–28. doi: 10.1016/j.brainres.2008.12.073. [DOI] [PMC free article] [PubMed] [Google Scholar]
- Chambers CD, Bellgrove MA, Stokes MG, Henderson TR, Garavan H, Robertson IH, Morris AP, Mattingley JB. Executive “brake failure” following deactivation of human frontal lobe. J Cogn Neurosci. 2006;18:444–455. doi: 10.1162/089892906775990606. [DOI] [PubMed] [Google Scholar]
- Chikazoe J, Konishi S, Asari T, Jimura K, Miyashita Y. Activation of right inferior frontal gyrus during response inhibition across response modalities. J Cogn Neurosci. 2007;19:69–80. doi: 10.1162/jocn.2007.19.1.69. [DOI] [PubMed] [Google Scholar]
- Chikazoe J, Jimura K, Asari T, Yamashita K, Morimoto H, Hirose S, Miyashita Y, Konishi S. Functional dissociation in right inferior frontal cortex during performance of go/no-go task. Cereb Cortex. 2009;19:146–152. doi: 10.1093/cercor/bhn065. [DOI] [PubMed] [Google Scholar]
- Coxon JP, Stinear CM, Byblow WD. Stop and go: the neural basis of selective movement prevention. J Cogn Neurosci. 2009;21:1193–1203. doi: 10.1162/jocn.2009.21081. [DOI] [PubMed] [Google Scholar]
- Curtis CE, Cole MW, Rao VY, D'Esposito M. Canceling planned action: an FMRI study of countermanding saccades. Cereb Cortex. 2005;15:1281–1289. doi: 10.1093/cercor/bhi011. [DOI] [PubMed] [Google Scholar]
- de Zubicaray GI, Andrew C, Zelaya FO, Williams SC, Dumanoir C. Motor response suppression and the prepotent tendency to respond: a parametric study. Neuropsychologia. 2000;38:1280–1291. doi: 10.1016/s0028-3932(00)00033-6. [DOI] [PubMed] [Google Scholar]
- Durston S, Thomas KM, Worden MS, Yang Y, Casey BJ. The effect of preceding context on inhibition: an event-related fMRI study. Neuroimage. 2002;16:449–453. doi: 10.1006/nimg.2002.1074. [DOI] [PubMed] [Google Scholar]
- Eagle DM, Baunez C, Hutcheson DM, Lehmann O, Shah AP, Robbins TW. Stop-signal reaction-time task performance: role of prefrontal cortex and subthalamic nucleus. Cereb Cortex. 2008;18:178–188. doi: 10.1093/cercor/bhm044. [DOI] [PubMed] [Google Scholar]
- Emeric EE, Brown JW, Boucher L, Carpenter RH, Hanes DP, Harris R, Logan GD, Mashru RN, Paré M, Pouget P, Stuphorn V, Taylor TL, Schall JD. Influence of history on saccade countermanding performance in humans and macaque monkeys. Vision Res. 2007;47:35–49. doi: 10.1016/j.visres.2006.08.03. [DOI] [PMC free article] [PubMed] [Google Scholar]
- Fassbender C, Foxe JJ, Garavan H. Mapping the functional anatomy of task preparation: priming task-appropriate brain networks. Hum Brain Mapp. 2006a;27:819–827. doi: 10.1002/hbm.20223. [DOI] [PMC free article] [PubMed] [Google Scholar]
- Fassbender C, Simoes-Franklin C, Murphy K, Hester R, Meaney J, Robertson IH, Garavan H. The role of a right fronto-parietal network in cognitive control—common activations for “cues-to-attend” and response inhibition. J Psychophysiol. 2006b;20:286–296. [Google Scholar]
- Garavan H, Ross TJ, Stein EA. Right hemispheric dominance of inhibitory control: an event-related functional MRI study. Proc Natl Acad Sci U S A. 1999;96:8301–8306. doi: 10.1073/pnas.96.14.8301. [DOI] [PMC free article] [PubMed] [Google Scholar]
- Genovese CR, Lazar NA, Nichols T. Thresholding of statistical maps in functional neuroimaging using the false discovery rate. Neuroimage. 2002;15:870–878. doi: 10.1006/nimg.2001.1037. [DOI] [PubMed] [Google Scholar]
- Hester RL, Murphy K, Foxe JJ, Foxe DM, Javitt DC, Garavan H. Predicting success: patterns of cortical activation and deactivation prior to response inhibition. J Cogn Neurosci. 2004;16:776–785. doi: 10.1162/089892904970726. [DOI] [PubMed] [Google Scholar]
- Hodgson T, Chamberlain M, Parris B, James M, Gutowski N, Husain M, Kennard C. The role of the ventrolateral frontal cortex in inhibitory oculomotor control. Brain. 2007;130:1525–1537. doi: 10.1093/brain/awm064. [DOI] [PubMed] [Google Scholar]
- Husain M, Parton A, Hodgson TL, Mort D, Rees G. Self-control during response conflict by human supplementary eye field. Nat Neurosci. 2003;6:117–118. doi: 10.1038/nn1005. [DOI] [PubMed] [Google Scholar]
- Kelly AM, Hester R, Murphy K, Javitt DC, Foxe JJ, Garavan H. Prefrontal-subcortical dissociations underlying inhibitory control revealed by event-related fMRI. Eur J Neurosci. 2004;19:3105–3112. doi: 10.1111/j.0953-816X.2004.03429.x. [DOI] [PubMed] [Google Scholar]
- Konishi S, Nakajima K, Uchida I, Sekihara K, Miyashita Y. No-go dominant brain activity in human inferior prefrontal cortex revealed by functional magnetic resonance imaging. Eur J Neurosci. 1998;10:1209–1213. doi: 10.1046/j.1460-9568.1998.00167.x. [DOI] [PubMed] [Google Scholar]
- Konishi S, Nakajima K, Uchida I, Kikyo H, Kameyama M, Miyashita Y. Common inhibitory mechanism in human inferior prefrontal cortex revealed by event-related functional MRI. Brain. 1999;122:981–991. doi: 10.1093/brain/122.5.981. [DOI] [PubMed] [Google Scholar]
- Leotti LA, Wager TD. Motivational influences on response inhibition measures. J Exp Psychol Hum Percept Perform. 2009 doi: 10.1037/a0016802. in press. [DOI] [PMC free article] [PubMed] [Google Scholar]
- Leung HC, Cai W. Common and differential ventrolateral prefrontal activity during inhibition of hand and eye movements. J Neurosci. 2007;27:9893–9900. doi: 10.1523/JNEUROSCI.2837-07.2007. [DOI] [PMC free article] [PubMed] [Google Scholar]
- Li CS, Huang C, Constable RT, Sinha R. Imaging response inhibition in a stop-signal task: neural correlates independent of signal monitoring and post-response processing. J Neurosci. 2006a;26:186–192. doi: 10.1523/JNEUROSCI.3741-05.2006. [DOI] [PMC free article] [PubMed] [Google Scholar]
- Li CS, Milivojevic V, Kemp K, Hong K, Sinha R. Performance monitoring and stop signal inhibition in abstinent patients with cocaine dependence. Drug Alcohol Depend. 2006b;85:205–212. doi: 10.1016/j.drugalcdep.2006.04.008. [DOI] [PubMed] [Google Scholar]
- Liddle PF, Kiehl KA, Smith AM. Event-related fMRI study of response inhibition. Hum Brain Mapp. 2001;12:100–109. doi: 10.1002/1097-0193(200102)12:2<100::AID-HBM1007>3.0.CO;2-6. [DOI] [PMC free article] [PubMed] [Google Scholar]
- Logan GD. On the ability to inhibit thought and action: a user's guide to the stop signal paradigm. In: Dagenbach D, Carr TH, editors. Inhibitory processes in attention, memory and language. San Diego: Academic; 1994. [Google Scholar]
- Logan GD, Cowan WB. On the ability to inhibit thought and action: a theory of an act of control. Psychol Rev. 1984;91:295–327. doi: 10.1037/a0035230. [DOI] [PubMed] [Google Scholar]
- Menon V, Adleman NE, White CD, Glover GH, Reiss AL. Error-related brain activation during a Go/NoGo response inhibition task. Hum Brain Mapp. 2001;12:131–143. doi: 10.1002/1097-0193(200103)12:3<131::AID-HBM1010>3.0.CO;2-C. [DOI] [PMC free article] [PubMed] [Google Scholar]
- Nakata H, Sakamoto K, Ferretti A, Gianni Perrucci M, Del Gratta C, Kakigi R, Luca Romani G. Somato-motor inhibitory processing in humans: an event-related functional MRI study. Neuroimage. 2008;39:1858–1866. doi: 10.1016/j.neuroimage.2007.10.041. [DOI] [PubMed] [Google Scholar]
- Rieger M, Gauggel S. Inhibition of ongoing responses in patients with traumatic brain injury. Neuropsychologia. 2002;40:76–85. doi: 10.1016/s0028-3932(01)00068-9. [DOI] [PubMed] [Google Scholar]
- Rubia K, Russell T, Overmeyer S, Brammer MJ, Bullmore ET, Sharma T, Simmons A, Williams SC, Giampietro V, Andrew CM, Taylor E. Mapping motor inhibition: conjunctive brain activations across different versions of go/ no-go and stop tasks. Neuroimage. 2001;13:250–261. doi: 10.1006/nimg.2000.0685. [DOI] [PubMed] [Google Scholar]
- Rubia K, Lee F, Cleare AJ, Tunstall N, Fu CH, Brammer M, McGuire P. Tryptophan depletion reduces right inferior prefrontal activation during response inhibition in fast, event-related fMRI. Psychopharmacology. 2005;179:791–803. doi: 10.1007/s00213-004-2116-z. [DOI] [PubMed] [Google Scholar]
- Sakai K, Passingham RE. Prefrontal set activity predicts rule-specific neural processing during subsequent cognitive performance. J Neurosci. 2006;26:1211–1218. doi: 10.1523/JNEUROSCI.3887-05.2006. [DOI] [PMC free article] [PubMed] [Google Scholar]
- Samanez-Larkin GR, D'Esposito M. Group comparisons: imaging the aging brain. Soc Cogn Affect Neurosci. 2008;3:290–297. doi: 10.1093/scan/nsn029. [DOI] [PMC free article] [PubMed] [Google Scholar]
- Schachar RJ, Chen S, Logan GD, Ornstein TJ, Crosbie J, Ickowicz A, Pakulak A. Evidence for an error monitoring deficit in attention deficit hyperactivity disorder. J Abnorm Child Psychol. 2004;32:285–293. doi: 10.1023/b:jacp.0000026142.11217.f2. [DOI] [PubMed] [Google Scholar]
- Scheres A, Oosterlaan J, Sergeant JA. Response execution and inhibition in children with AD/HD and other disruptive disorders: the role of behavioural activation. J Child Psychol Psychiatry. 2001;42:347–357. [PubMed] [Google Scholar]
- Sumner P, Nachev P, Morris P, Peters AM, Jackson SR, Kennard C, Husain M. Human medial frontal cortex mediates unconscious inhibition of voluntary action. Neuron. 2007;54:697–711. doi: 10.1016/j.neuron.2007.05.016. [DOI] [PMC free article] [PubMed] [Google Scholar]
- Sylwan RP. The control of deliberate waiting strategies in a stop-signal task. Braz J Med Biol Res. 2004;37:853–862. doi: 10.1590/s0100-879x2004000600011. [DOI] [PubMed] [Google Scholar]
- Talairach J, Tournoux P. Co-planar stereotaxic atlas of the human brain. New York: Thieme Medical; 1988. [Google Scholar]
- Vaidya CJ, Bunge SA, Dudukovic NM, Zalecki CA, Elliott GR, Gabrieli JD. Altered neural substrates of cognitive control in childhood ADHD: evidence from functional magnetic resonance imaging. Am J Psychiatry. 2005;162:1605–1613. doi: 10.1176/appi.ajp.162.9.1605. [DOI] [PMC free article] [PubMed] [Google Scholar]
- van Boxtel GJM, van der Molen MW, Jennings JR. Differential involvement of the anterior cingulate cortex in performance monitoring during a stop-signal task. J Psychophysiol. 2005;19:1–10. [Google Scholar]
- Verbruggen F, Logan GD. Proactive adjustments of response strategies in the stop-signal paradigm. J Exp Psychol Hum Percept Perform. 2009;35:835–854. doi: 10.1037/a0012726. [DOI] [PMC free article] [PubMed] [Google Scholar]
- Vink M, Kahn RS, Raemaekers M, van den Heuvel M, Boersma M, Ramsey NF. Function of striatum beyond inhibition and execution of motor responses. Hum Brain Mapp. 2005;25:336–344. doi: 10.1002/hbm.20111. [DOI] [PMC free article] [PubMed] [Google Scholar]
- Wager TD, Sylvester CY, Lacey SC, Nee DE, Franklin M, Jonides J. Common and unique components of response inhibition revealed by fMRI. Neuroimage. 2005;27:323–340. doi: 10.1016/j.neuroimage.2005.01.054. [DOI] [PubMed] [Google Scholar]
- Worsley DB, Friston KJ. Analysis of fMRI time-series revisited again. Neuroimage. 1995;2:173–181. doi: 10.1006/nimg.1995.1023. [DOI] [PubMed] [Google Scholar]
- Zheng D, Oka T, Bokura H, Yamaguchi S. The key locus of common response inhibition network for no-go and stop signals. J Cogn Neurosci. 2008;20:1434–1442. doi: 10.1162/jocn.2008.20100. [DOI] [PubMed] [Google Scholar]