

Abstract
The physical properties of the postsynaptic membrane (PSM), including its viscosity, determine its capacity to regulate the net flux of synaptic membrane proteins such as neurotransmitter receptors. To address these properties, we studied the lateral diffusion of glycophosphatidylinositol-anchored green fluorescent protein and cholera toxin bound to the external leaflet of the plasma membrane. Relative to extrasynaptic regions, their mobility was reduced at synapses and even more at inhibitory than at excitatory ones. This indicates a higher density of obstacles and/or higher membrane viscosity at inhibitory contacts. Actin depolymerization reduced the confinement and accelerated a population of fast, mobile molecules. The compaction of obstacles thus depends on actin cytoskeleton integrity. Cholesterol depletion increased the mobility of the slow diffusing molecules, allowing them to diffuse more rapidly through the crowded PSM. Thus, the PSM has lipid-raft properties, and the density of obstacles to diffusion depends on filamentous actin. Therefore, lipid composition and actin-dependent protein compaction regulate viscosity of the PSM and, consequently, the molecular flow in and out of synapses.
Introduction
Once inserted in the plasma membrane, molecules diffuse laterally with random movements that result from the collective thermal agitation of proteins and lipids. This Brownian diffusion is slowed down by mechanisms that increase the apparent viscosity of the membrane such as fences formed by submembranous filamentous actin (F-actin), hydrodynamic friction caused by immobile transmembrane molecules or by tethering interactions with extrinsic or intrinsic membrane molecules (Saxton and Jacobson, 1997). Lipid domains of different viscosity (lipid rafts) can also reduce the lateral mobility of proteins associated with them (for review, see Marguet et al., 2006). Receptors for neurotransmitters are concentrated and stabilized at postsynaptic sites by interactions with the underlying protein scaffold (for review, see Sheng and Hoogenraad, 2007). Lipid composition may also be involved in this stabilization (for review, see Allen et al., 2007). Nevertheless, the stabilization of receptors is transient and they continuously diffuse laterally in and out of synapses (for review, see Triller and Choquet, 2005, 2008; Renner et al., 2008a).
F-actin is concentrated at postsynaptic membranes (PSMs) beneath excitatory and inhibitory postsynaptic membranes. Excitatory synapses on dendritic spines are enriched in F-actin, which is modulated by synaptic activity (for review, see Dillon and Goda, 2005). Actin polymerization may control the number of neurotransmitter receptors at synapses. Such is the case for the excitatory glutamate AMPA receptors (Allison et al., 1998) and for glycine receptors (GlyRs) (Kirsch and Betz, 1995). This control results in part from the regulation of the physical characteristics (confinement and trapping) of lateral receptor diffusion, as demonstrated for GlyRs in spinal cord neurons (Charrier et al., 2006). However, several receptors and transmembrane proteins of the postsynaptic density (PSD) purify with detergent-resistant membrane (DRM) fractions, indicating a possible association with lipid rafts. Examples of this are acetylcholine receptors (Stetzkowski-Marden et al., 2006; references in Allen et al., 2007), K+ channels (Wong and Schlichter, 2004), and glutamatergic receptors (Hering et al., 2003). Extrinsic membrane scaffolding proteins associated with excitatory synapses (GRIP, PSD-95) (Hering et al., 2003) are also purified in DRM fractions. The palmitoylation of these proteins is required for their accumulation at synapses, emphasizing their putative interactions with rafts (el-Husseini and Bredt, 2002). Receptors themselves can also be palmitoylated, leading to their postsynaptic accumulation, as shown for GABA receptors (GABARs) (Rathenberg et al., 2004).
Receptors diffuse much slower at synaptic than at extrasynaptic membranes (references in Triller and Choquet, 2005, 2008; Renner et al., 2008a). This reflects their stabilization by scaffolding proteins, but the reduction in mobility can also be attributable to the presence of obstacles and barriers to diffusion. This in turn can influence the flux of receptors in and out of synapses and have strong effects on synaptic activity (Heine et al., 2008). Although receptor dynamics has been the focus of many current studies, the potential dynamic regulation of lipids and lipid-bound proteins at synaptic and extrasynaptic sites remains undiscovered. In addition, molecules that are not stabilized at synapses (thus not enriched) and “float” in the outer leaflet of the plasma membrane, such as lipids or lipid-bound proteins, can serve as probes to analyze the apparent viscosity of the synaptic membrane. In this study, we have followed the lateral dynamics of two lipid-bound proteins that are lipid raft markers, cholera toxin (ChTx) and a glycophosphatidylinositol-anchored green fluorescent protein (GPI–GFP) using fluorescence recovery after photobleaching (FRAP) and single-particle tracking (SPT) techniques. We found that the diffusion of these lipid-bound proteins is slower at inhibitory postsynaptic membranes than at excitatory ones. F-actin depolymerization affects mostly the more mobile molecules, and cholesterol depletion increases the mobility only of the less mobile ones.
Materials and Methods
Cell culture and transfection.
Hippocampal neurons from 18-d-old Sprague Dawley rat embryos were cultured at a density of 6 × 10⁴ cells/cm2 on coverslips precoated with 80 μg/ml poly-d,l-ornithine (Sigma-Aldrich) and 5% fetal calf serum (Invitrogen). Cultures were maintained in serum-free Neurobasal medium supplemented with B27 (1×) and glutamine (2 mm) (Invitrogen). Neurons were transfected at 2 or 9 d in vitro (DIV) using Lipofectamine2000 (Invitrogen) following the instructions of the manufacturer. GFP–GPI plasmid was kindly provided by Dr. S. Mayor (National Centre for Biological Sciences, Bangalore, India) (Sharma et al., 2004). Other constructions were described previously (Hanus et al., 2006; Bats et al., 2007). Cells were imaged 24 h after transfection when transfected at 2 DIV or cultured until synaptic maturation.
FRAP and fluorescence loss in photobleaching.
Experiments were conducted using a FRAP system (FRAP L5D; Roper Scientific) run by MetaMorph software (Meta Imaging Software; Roper Scientific) using routines developed by the Curie Institute Imaging Center (Paris, France). It consist of an inverted microscope (Eclipse TE2000-E; Nikon) equipped with an autofocus system (Nikon), a DG-4 illumination system (Sutter Instruments), and appropriate filter sets (Semrock; Optoprim). Coverslips were mounted on a custom-made chamber and observed with a 100× objective (Nikon via Roper Scientific). Chamber and objective were heated at 36°C. For FRAP, two to five circular regions (radius, 0.6 μm) on top of synaptic spots or on extrasynaptic membranes on different neurites of each cell were bleached by high-intensity 488 nm laser (ERROL) for 5 ms at 65 mW, reducing fluorescence by ∼80%. Recovery was monitored by time-lapse acquisitions with a CCD camera (QuantEM 512SC; Roper Scientific) at 1 Hz for 20 s and at 0.2 Hz for the next 60 s. For fluorescence loss in photobleaching (FLIP), two circular regions 1.2 μm in diameter at each side of a synaptic spot (1.2 μm from it) (see Fig. 1 C) were bleached at 1 Hz during 40 s at low laser power (30%). Fluorescence was monitored, taking one image between each laser shot. Data were normalized and analyzed as by Tsuriel et al. (2006). Briefly, data was corrected for ongoing photobleaching with the following: Fcorrt = (Ft/F 0)/(Fnbt/Fnb0), where Ft is the fluorescence at time t, F 0 is the fluorescence before bleaching, Fnbt is the average fluorescence intensity of three nonbleached spots at time t, and Fnb0 is the average fluorescence intensity of the same nonbleached spots before bleaching.
Figure 1.

Bulk fluorescence dynamics of GFP–GPI on cultured hippocampal neurons (24 DIV) analyzed by FRAP and FLIP. A, In vivo fluorescence of GFP–GPI and a postsynaptic protein to label inhibitory (A1) or excitatory (A2) synapses. A1, A2, Neurites with GFP–GPI (green) and gephyrin–mRFP (red, A1) or Homer1c–DsRed (blue, A2). Scale bar, 2 μm. B, FRAP of GFP–GPI (mean ± SEM) at extrasynaptic (black; n = 55 spots) and inhibitory (red; n = 54) or excitatory (blue; n = 58) synapses. Inset, Blowup of the curves between 0 and 25 s. C, FLIP at inhibitory (red; n = 9) or excitatory (blue; n = 9) synapses or at extrasynaptic locations (black; n = 9). Inset, Green, Loci for bleach; red and blue, loci for recording at inhibitory and excitatory postsynaptic membranes, respectively; open circle, locus for extrasynaptic recording (arrow). D, E, Time constant (mean ± SEM) for the fast (D) and slow (E) pool, obtained from the double-exponential fit (see Materials and Methods) applied to the data in B for extrasynaptic (extrasyn, black) and inhibitory (I, red) or excitatory (E, blue) synapses. Two-tailed t test, significance toward extrasynaptic locus: **p < 0.01; ***p < 0.001. n = 4 independent experiments using cells from four different cultures.
Best fits of FRAP recovery curves were made according to the following equation: Ft = Pf [1 − (1 − Fbl) exp (−t/τf)] + (1 − Pf) [1 − (1 − Fbl) exp (−t/τs)], where Pf is the relative size of the fast pool (expressed as a fraction of 1), Fbl is the normalized fluorescence immediately after the photobleaching procedure, and τf and τs are the recovery time constants for the fast and slow pools, respectively.
Single-particle imaging of GFP–GPI, ChTx, and receptors.
For SPT of GFP–GPI, quantum dots (QDs) emitting at 605 nm conjugated with goat F(ab′)2 anti-rabbit IgG (Invitrogen) were previously coupled with an anti-GFP antibody (rabbit polyclonal; Synaptic Systems) (supplemental information, available at www.jneurosci.org as supplemental material). QDs (30 nm) were incubated first with the antibody (5 nm, 30 min) and then for an additional 15 min with casein to block unspecific binding. Cells were incubated for 10 min at 37°C with the precoupled QDs (0.06 nm) and rinsed. ChTx (Sigma-Aldrich) was biotinylated with the EZ-Link Sulfo-NHS-Biotin kit (Pierce via Perbio Science France), using a low ratio of ChTx/biotin (1:2). Neurons were incubated for 10 min with biotinylated ChTx (2 μm), washed, and incubated for 1 min with streptavidin-coated QDs emitting at 605 nm (0.2–0.3 nm; Invitrogen) as in the study by Bannai et al. (2006). In case of receptors, neurons were first incubated for 5 min with the corresponding primary antibody: anti-GluR2 for AMPA receptors (AMPARs) (1:200; BD PharMingen) and anti-γ2 for GABARs (1:150; Alomone Labs). After rinsing, cells were incubated 5 min with the corresponding biotinylated secondary antibody [1:250, F(ab′)2 fragments; Jackson ImmunoResearch], rinsed, and incubated with streptavidin-coated QDs as above. All incubation steps and washes were performed at 37°C in MEM recording medium (MEMr) (containing phenol red-free MEM, 33 mm glucose, 20 mm HEPES, 2 mm glutamine, 1 mm Na-pyruvate, and 1× B27). Cells were imaged within 30 min after QD staining. Neurons were imaged in the MEMr at 37°C in an open chamber mounted on a IX70 inverted microscope (Olympus) equipped with a 60× objective [numerical aperture (NA) 1.45; Olympus]. Fluorescence was detected using an Hg+ lamp, appropriate filters [QD: D455/70x, HQ605/20m; Discosoma red (DsRed) and FM4-64 (N-(3-triethylammoniumpropyl)-4-(6-(4-diethylamino)phenyl)hexatrienyl)pyridinium dibromide): D535/50x, E590lpv2; GFP and Venus: HQ500/20 and HQ535/30m; Chroma Technology via Roper Scientific], and a CCD camera (Cascade 512BFT; Roper Scientific). QDs were recorded during 1000 consecutive frames at 33 Hz.
Single-fluorophore imaging of cyanine 5-ChTx.
Cyanine 5 (Cy5) fluorophore was coupled to ChTx (Sigma-Aldrich) at 1:7 ratio following the instructions of the manufacturer (GE Healthcare). Coverslips were first incubated at 37°C for 5 min with 2 mm rhodamine 123 (Rh123) (Invitrogen) and then for 10 min at room temperature with Cy5–ChTx (0.1 μm). For image acquisition, an inverted microscope (Olympus IX70) with a 100× oil-immersion objective (NA 1.4) was used. Samples were illuminated for 15 ms at 633 nm by a helium–neon laser for Cy5 detection (JDS Uniphase). An appropriate filter set (DCLP650, HQ575/50; Chroma Technology via Roper Scientific) was used for detection with a CCD camera (Micromax; Princeton Instruments). Rh123 was imaged using a 532 nm YAG laser (Coherent) using another filter set [DCLP498 (Chroma Technology) and A515 (Omega Optical)].
Drug treatment.
Actin filaments were depolymerized with latrunculin A (3 μm; Sigma-Aldrich) solubilized in DMSO (Sigma-Aldrich). Cells were preincubated for 30 min with latrunculin or the control solution (0.002% DMSO) and were then incubated with ChTx diluted in latrunculin- or DMSO-containing MEMr. SPT recordings were performed in the presence of the drugs. For cholesterol depletion, cells were treated for 30 min with cholesterol oxidase (COase) (10 U/ml final concentration; Sigma-Aldrich) and then labeled for SPT. After the experiment, cells were fixed in 4% (w/v) paraformaldehyde (Serva Feinbiochemica) and incubated for 5 min with filipin (100 μg/ml; Sigma-Aldrich) to check cholesterol reduction.
Tracking and quantitative analysis.
Single QDs were identified by their blinking (Dahan et al., 2003). Single Cy5–ChTx molecules were identified by their one-step photobleaching (Tardin et al., 2003). Synaptic stain images were filtered using a multidimensional image analysis interface run by MetaMorph software (Racine et al., 2007). Trajectories were defined as synaptic if they colocalized with a synaptic cluster (Dahan et al., 2003). Tracking was performed with homemade software in Matlab (MathWorks). The center of the spot fluorescence was determined by a two-dimensional Gaussian fit. Spatial resolution was ∼10–20 nm. The spots in a given frame were associated with the maximum likely trajectories estimated on previous frames of the image sequence. For QDs, only trajectories with at least 15 consecutive frames were used. The mean square displacement (MSD) was calculated using MSD(ndt) = (N − n)−1Σi = 1 N − n((xi + n − xi)2 + ((yi + n − yi)2), where xi and yi are the coordinates of an object on frame i, N is the total number of steps in the trajectory, dt is the time interval between two successive frames, and ndt is the time interval over which displacement is averaged. The diffusion coefficient D was calculated by fitting the first two to five points of the MSD plot versus time with the equation MSD(t) = 4D 2–5 t + 4σx 2, where σx is the spot localization accuracy in one direction (Ehrensperger et al., 2007 and references therein). Given the resolution, trajectories with D < 104 μm2/s for QDs and with D < 103 μm2/s for Cy5–ChTx were classified as immobile. Because of the large dispersal of values of D, we compared the median values. The size of the average confinement area was calculated fitting the average MSD plot with the equation proposed by Kusumi et al. (1993). Dwell time was calculated as in the study by Charrier et al. (2006).
Statistical analyses were done using built-in functions in Matlab using two-tailed Student's t test, the Mann–Whitney (MW) test, or Kolmogorov–Smirnov (KS) test. Images were prepared using Photoshop (Adobe Systems).
Results
We analyzed the diffusion of two lipid raft markers, GFP–GPI and the β subunit of ChTx, which binds specifically to the ganglioside GM1 (Lencer and Tsai, 2003). We chose these lipid-bound proteins for technical reasons (final size of the probe and specificity of binding). We used cultured hippocampal neurons with mature synapses (21 to 24 DIV).
Lateral diffusion of GFP–GPI is reduced at synapses
We first used FRAP in neurons cotransfected with GFP–GPI and the postsynaptic proteins gephyrin–monomeric red fluorescent protein (mRFP) or Homer1c–DsRed to label inhibitory or excitatory PSDs, respectively (Fig. 1 A) (supplemental information, available at www.jneurosci.org as supplemental material). GFP–GPI fluorescence was evenly distributed within neurons without any enrichment detectable at synapses [intensity per pixel in arbitrary units: 3314 ± 83 (n = 75), 3155 ± 121 (n = 54), and 3148 ± 78 (n = 75) at extrasynaptic, inhibitory, and excitatory synaptic membranes respectively; differences not significant, two-tailed t test] (Fig. 1 A1,A2). Gephyrin is the scaffolding protein that anchors GlyRs in spinal cord neurons and GABAA receptors in the hippocampus (Kirsch et al., 1993; Kneussel et al., 1999). Gephyrin–mRFP formed clusters on dendritic shafts apposed to synapsin1 (94.32 ± 0.71% of the clusters) (supplemental Fig. S1A,B, available at www.jneurosci.org as supplemental material). Homer1c is a scaffolding protein that interacts with metabotropic glutamate receptors and members of the Shank family (Usui et al., 2003). Homer1c–DsRed exhibited brighter spots at the tips of the spines perfectly colocalized with PSD-95 and apposed to synapsin1 puncta (94.34 ± 0.60% of the clusters) (supplemental Fig. S1C,D, available at www.jneurosci.org as supplemental material).
Circular regions (0.6 μm radius) were bleached in synaptic or extrasynaptic regions on different neurites (see Materials and Methods). The recovery of GFP–GPI fluorescence was fast and continuous, indicating a recovery by lateral diffusion instead of insertion of exocytotic vesicles (that would induce a quantal increase of fluorescence). More importantly, the recovery was significantly slower at synaptic regions compared with extrasynaptic ones (Fig. 1 B). Because of the small size of the PSD (∼0.3 μm in diameter, close to the point spread function limitation) and their movements around their mean position (Fischer et al., 2000; Hanus et al., 2006), we bleached an area larger than that of the PSD (1.2 μm in diameter). As a consequence, the recovery curves contained information from the recovery at the PSD and at the perisynaptic area. Therefore, to ascertain FRAP results, we analyzed the FLIP, a measurement that is not influenced by the size of the bleaching region. To this aim, we continuously bleached two extrasynaptic regions on each side of the area analyzed (see scheme in Fig. 1 C). In agreement with FRAP curves, the loss of fluorescence was slower at synaptic than at nearby extrasynaptic areas (Fig. 1 C).
Because of the lack of appropriate models, FLIP curves could not be used to derive kinetic constants. FRAP curves were fitted with a double-exponential function with two different kinetic constants (fast and slow) (Tsuriel et al., 2006) (supplemental information, Fig. S2A,B, available at www.jneurosci.org as supplemental material). At extrasynaptic locations, the fast pool had a time constant of 3.95 ± 0.17 s, significantly faster than that observed at synapses (one-way ANOVA, p < 0.0001), both inhibitory (4.76 ± 0.21 s; two-tailed t test, p < 0.01) and excitatory (5.67 ± 0.34 s; two-tailed t test, p < 0.0001) ones (Fig. 1 D). In contrast, for the slow pool, the slowest recovery was found at inhibitory sites (extrasynaptic, 158 ± 10 s; inhibitory, 342 ± 45 s, p < 0.0001; excitatory, 267 ± 34 s, p < 0.01; one-way ANOVA, p = 0.0006) (Fig. 1 E).
Single-particle analysis of GFP–GPI
The above-mentioned results suggest a different viscosity of the PSM in excitatory and inhibitory synapses, which are different from the extrasynaptic membrane. However, FRAP experiments do not give access to the mechanisms underlying these differences. Furthermore, measurements are complicated by spatial and anisotropic constraints that make difficult the calculation of diffusion coefficients in complex morphologies such as those of neuronal cells (Holcman and Triller, 2006; Triller and Choquet, 2008). Moreover, their resolution is limited by the point-spread function, and, thus, it is impossible to resolve movements in areas smaller than the optical resolution (∼300 nm, the size of the PSD). Therefore, we used SPT and single-molecule fluorescence microscopy (SMT), which provide good spatial and temporal resolution. GFP–GPI molecules were labeled with QDs coupled to an anti-GFP antibody (QD–GFPGPI). The labeling was performed at low concentration to allow the detection and tracking of individual molecules (supplemental information, Fig. S2C, available at www.jneurosci.org as supplemental material). QD–GFPGPI were detected with a pointing accuracy of 10–20 nm (Dahan et al., 2003) and tracked at 33 Hz. Single QDs were identified by their blinking property (Dahan et al., 2003). Portions of trajectories were defined as synaptic when they colocalized with the synaptic marker (see Materials and Methods). Most QD trajectories exchanged between a synaptic and a nonsynaptic location during the recording session (Fig. 2 A1,A2) (supplemental movie, available at www.jneurosci.org as supplemental material). In this case, each part of the trajectory was analyzed separately. The diffusion coefficient D was derived from the initial slope of the MSD versus the time interval τ plot (MSD = 4Dτ). The mean diffusive behavior, free or confined, was deduced from the shape of the average MSD versus τ curve: in free “Brownian” diffusion, the MSD depends linearly on τ, whereas in the case of confined motion, it reaches a plateau (Saxton and Jacobson, 1997). In our study, particles with D < 10−4 μm2/s−1 were defined as immobile and not analyzed further (typically, <1%). We did not observe QDs displaying directed movement, which is a landmark of vesicular transport (Saxton and Jacobson, 1997) and, therefore, of endocytosis. During the 30 s recording session, most QD–GFPGPI explored large surface areas of neurites (Fig. 2 A1,A2). They exchanged between extrasynaptic and synaptic areas reducing their mobility when entering the synaptic region (Fig. 2 B), displaying free and confined behavior, respectively (Fig. 2 C). The diffusion of QD–GFPGPI was significantly reduced at synapses (p < 0.0001 for both synapse types, KS test) and slower at inhibitory than at excitatory PSMs (p < 0.0001, KS test) (Fig. 2 D). Median values were 17.2 × 10⁻² μm2/s−1 (extrasynaptic), 2.3 × 10⁻² μm2/s−1 (inhibitory), and 4.6 × 10⁻² μm2/s−1 (excitatory) (supplemental table, available at www.jneurosci.org as supplemental material). Excitatory and inhibitory PSMs also exhibit lateral movements themselves (Fischer et al., 2000; Hanus et al., 2006). However, the movement of gephyrin–mRFP or Homer1c–DsRed clusters was ∼50 times slower than that of QD–GFPGPI [median D values, 5.5 × 10⁻⁴ μm2/s−1 (n = 518) and 8 × 10⁻⁴ μm2/s−1 (n = 467), respectively]. QD–GFPGPI diffusion was more confined at inhibitory synapses than at excitatory ones (Fig. 2 E). For comparison, we pooled the MSD values between 0.3 and 0.4 s time intervals, which were significantly larger in excitatory synapses (Fig. 2 E, inset) (p < 0.0001, MW test). The estimates of the areas explored (assuming circular confinement areas and using the MSD plot) (Kusumi et al., 1993) had diameters of 380 and 475 nm at inhibitory and excitatory sites, respectively (see Materials and Methods), with mean dwell times of 0.88 ± 0.14 and 0.75 ± 0.07 s, respectively. At extrasynaptic locations, QD–GFPGPI displayed mostly free diffusion, but the MSD plot is not perfectly linear. This deviation probably arises from, on one side, a geometrical effect (neurites have a limited diameter) and, on the other side, from the presence of local inhomogeneities of the extrasynaptic membrane not studied in this work.
Figure 2.

SPT of QD–GFPGPI on hippocampal neurons cotransfected with Homer1c–DsRed or gephyrin–mRFP. A, Examples of trajectories of QD–GFPGPI with extrasynaptic (black) and synaptic portions in inhibitory (red, A1) or excitatory (blue, A2) synapses. Inhibitory and excitatory PSMs are identified by the presence of cotransfected gephyrin–mRFP (orange) and Homer1c–DsRed (light blue), respectively. Scale bar: (in A1) A1, 0.3 μm; A2, 0.5 μm. B, Diffusion coefficient D over time for the trajectory illustrated in A2. Top lines indicate extrasynaptic (black) and synaptic (blue) recording periods. C, Examples of MSD for the trajectories over inhibitory (red, from A1) or excitatory (blue, from A2) synaptic portions and at extrasynaptic (black, from A2) loci. D, Cumulative frequency distribution of D for QD–GFPGPI trajectories on extrasynaptic (black; n = 11,475 trajectories) and inhibitory (red; n = 211) or excitatory (blue; n = 449) synaptic membranes. n = 4 independent experiments using cells from two different cultures. E, Average MSD (mean ± SEM) plot of the same trajectories analyzed in D. Same color coding as in D. Inset, Surface of the areas explored (mean ± SEM) of inhibitory (red) or excitatory (blue) synaptic trajectories between intervals of time 0.3–0.4 s (***p > 0.0001, MW test).
Diffusion of GM1-bound ChTx at inhibitory and excitatory synapses
The overexpression of GFP–GPI could alter the diffusive properties of the plasma membrane through modification of its composition. We therefore used ChTx to track the endogenous lipid GM1. ChTx forms pentamers and thus binds one to five GM1 molecules. To identify excitatory and inhibitory PSMs in the same cell, neurons were cotransfected with Homer1c-enhanced GFP (EGFP) and gephyrin–mRFP (Fig. 3 A,B). We checked the distribution of ChTx on the membrane of living cells labeling transfected neurons with Alexa488-coupled ChTx, which did not show any enrichment at synapses (supplemental information, available at www.jneurosci.org as supplemental material). For SPT, neurons were first incubated with biotinylated ChTx and then labeled with streptavidin-coupled QDs (Bannai et al., 2006). Endocytosis of QD-bound ChTx (QD–ChTx) was not observed during the experiments (supplemental information, available at www.jneurosci.org as supplemental material). Detection and tracking of individual QDs (33 Hz during 30 s) were monitored on transfected neurites only. In some traces (as exemplified in Fig. 3 B), the same QD–ChTx passed over Homer1c–EGFP and gephyrin–mRFP. As for QD–GFPGPI, QD–ChTx had significantly lower mobility at the synaptic versus extrasynaptic areas. The reduction was again more pronounced at inhibitory synapses (Fig. 3 C). The median D decreased sixfold (p < 0.0001, KS test) and 12-fold (p < 0.0001, KS test) in excitatory and inhibitory synapses, respectively (extrasynaptic, 18.3 × 10⁻² μm2/s−1; synaptic excitatory, 2.9 × 10⁻² μm2/s−1; synaptic inhibitory, 1.5 × 10⁻² μm2/s−1) (supplemental table, available at www.jneurosci.org as supplemental material). QD–ChTx was also confined at PSMs (Fig. 3 D) with a higher confinement at inhibitory ones (Fig. 3 D, inset) (p < 0.0001, MW test). The size of the confinement areas were 328 and 456 nm over gephyrin and Homer clusters, respectively, with mean dwell times of 0.66 ± 0.11 and 0.45 ± 0.05 s.
Figure 3.

SPT of QD–ChTx on hippocampal neurons cotransfected with Homer1c–EGFP and gephyrin–mRFP. A, Simultaneous labeling of inhibitory and excitatory synapses. The raw fluorescence images (A1) were filtered after segmentation and wavelet transformation (see Materials and Methods) to delineate the synaptic spots (A2). A1, Fluorescence of gephyrin–mRFP (red) and Homer1c–EGFP (green) on nonfixed cells. A2, Transmitted differential interference contrast (DIC) image from the same neurites in A1 overlaid with the filtered synaptic spots. B, Example of trajectory from a QD–ChTx diffusing between a Homer1c–EGFP (blue) and a gephyrin–mRFP (red) cluster. The extrasynaptic trajectory is white; synaptic portions are red and blue over inhibitory and excitatory postsynaptic differentiations, respectively. Scale bar: (in B) A1, A2, 3 μm; B, 0.3 μm. C, Cumulative frequency distribution of D for QD–ChTx trajectories on extrasynaptic (black; n = 7494 trajectories) and inhibitory (red; n = 115) or excitatory (blue; n = 137) synaptic membranes. n = 6 independent experiments using cells from three different cultures. D, Averaged MSD plot (mean ± SEM) of the same trajectories analyzed in C. Same color coding as in C. Inset, Surface of the areas explored (mean ± SEM) of inhibitory (red) or excitatory (blue) synaptic trajectories between intervals of time 0.3–0.4 s (***p > 0.0001, MW test).
Influence of the presence of the presynaptic terminal and QDs on ChTx diffusion
An important concern about QD labeling is the size of the probe. The cleft between the presynaptic and postsynaptic membranes is narrow and thus may contribute to the reduced mobility. Therefore, we made use of two complementary strategies: we followed the diffusion of ChTx directly labeled with a single Cy5 fluorochrome, and we analyzed the movements of QD–ChTx in artificial inhibitory PSDs not apposed to presynaptic terminals.
In experiments with Cy5–ChTx done on nontransfected neurons, synapses were labeled with the mitochondrial marker rhodamine 123 (Groc et al., 2007; Renner et al., 2008b) (Fig. 4 A–C). At the end of the experiments, only ∼15–20% of the ChTx molecules were internalized (see supplemental information, available at www.jneurosci.org as supplemental material). Single Cy5–ChTx molecules were recognized by their one-step photobleaching (Tardin et al., 2003) and tracked at 18 Hz. Given the pointing accuracy of ∼50 nm, molecules with D < 10−3 μm2/s−1 were considered as immobile and were excluded from the analysis. Diffusion of Cy5–ChTx was significantly reduced in synapses (extrasynaptic, median D = 10.7 × 10⁻² μm2/s−1; synaptic, 3.3 × 10⁻² μm2/s−1; p < 0.05, KS test) (Fig. 4 B) (supplemental table, available at www.jneurosci.org as supplemental material), displaying confined movements (Fig. 4 C). Unfortunately trajectories were short (typically 0.4–0.5 s) because of the rapid photobleaching of organic dyes, such as Cy5. Therefore, the average MSD plot of Cy5–ChTx was less precise than with QDs. However, the median D was comparable with that measured with QDs.
Figure 4.
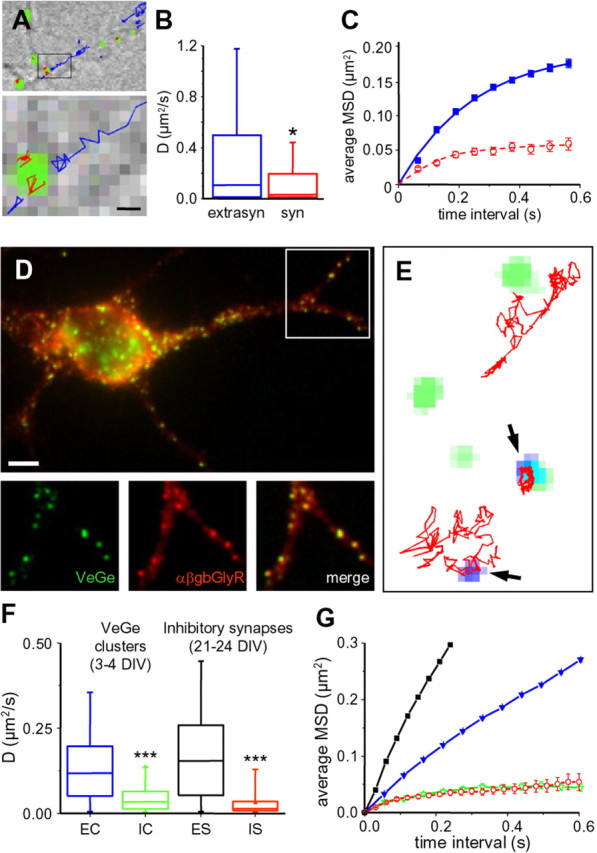
Influence of QD size and presynaptic terminals on ChTx diffusion. A, Single-molecule fluorescence microscopy of Cy5–ChTx. Top, DIC image of neurites showing in green the labeling of rhodamine 123 used to stain synapses. The trajectories of all the single molecules detected in this field over a 100 s recording period are overlaid in blue [extrasynaptic (extrasyn)] or in red [synaptic (syn)]. Bottom, A higher magnification of the region indicated by the rectangle in the top image. Scale bar, 0.5 μm. B, Distribution of D [median and 25–75% interquartile range (IQR); whiskers, 5 and 95% confidence intervals] for Cy5–ChTx in extrasynaptic (blue; n = 1317 trajectories) and synaptic (red; n = 51) membranes (*p < 0.05, KS test). C, Averaged MSD plot (mean ± SEM) of the same trajectories analyzed in B. Same color coding as in B. n = 5 independent experiments using cells from three different cultures. D, Hippocampal neurons at 3 DIV cotransfected with Venus-tagged gephyrin (Ve::Ge; green) and a modified α subunit of glycine receptor (α1βgb–myc; red). Top, Overlay of Ve::Ge fluorescence (green) and α1βgb–myc immunoreactivity (red). Below, Higher magnification of the indicated region in the top image, emphasizing Ve::Ge and α1βgb–myc colocalization. From left to right, Ve::Ge (green), α1βgb–myc (red), and colocalization (yellow). E, Examples of trajectories (red) of QD–ChTx (blue, arrowheads) colocalizing or not with Ve::Ge clusters (green). Scale bar: (in D, top) D, top, 3.8 μm; D, bottom, 5 μm; E, 800 nm. F, Distribution of D (median and 25–75% IQR; whiskers, 5 and 95% confidence intervals) for QD–ChTx over 3–4 DIV neurons compared with 21–24 DIV neurons transfected as in Figure 3 A. EC, Trajectories outside Ve::Ge clusters (blue; n = 6388); IC, trajectories over Ve::Ge clusters (green; n = 68); ES, IS, trajectories over extrasynaptic (black; n = 2025) or inhibitory (red; n = 31) postsynaptic membranes, respectively. n = 4 independent experiments using cells from two different cultures. G, Averaged MSD plot (mean ± SEM) of the same trajectories analyzed in F. Same color coding as in F.
In a second approach, we created artificial inhibitory PSDs as described previously (Meier et al., 2001; Ehrensperger et al., 2007). More precisely, cotransfection of Venus-tagged gephyrin (Ve::Ge) with a modified α1 subunit of GlyR (α1βgb, containing the binding sequence to gephyrin) leads to the formation of receptor–gephyrin clusters at the plasma membrane. GlyRs have over these clusters a diffusing behavior comparable with what is seen at mature synapses (Ehrensperger et al., 2007). In similar clusters in hippocampal neurons (Fig. 4 D), we found that QD–ChTx diffusion was greatly reduced (Fig. 4 E). The median D decreased from 11.8 to 3.3 × 10⁻² μm2/s−1 outside and within clusters, respectively (p < 0.0001, KS test) (Fig. 4 F). The diffusion and confined behavior in these artificial clusters were not significantly different from that seen in mature inhibitory synapses (Fig. 4 G).
Confinement of synaptic ChTx depends on F-actin
Lateral diffusion of transmembrane proteins can be constrained by the cytoskeletal network below the membrane. Cytoskeletal filaments are fences themselves and anchor transmembrane proteins, which behave as pickets restricting the diffusion of other molecules on both leaflets of the plasma membrane [the anchored protein–picket model (Kusumi et al., 2005)]. At synapses, the cytoskeleton is important for the stabilization of the PSD (Kirsch and Betz, 1995; Allison et al., 2000; Kuriu et al., 2006). The actin cytoskeleton also affects the lateral diffusion of GlyRs in spinal cord neurons (Charrier et al., 2006). We thus analyzed the effect of actin depolymerization using latrunculin A (3 μm) on lipid confinement at synapses. Both gephyrin and Homer1c interact with actin-regulating proteins, such as collybistin and profilin in the case of gephyrin (Charrier et al., 2006 and references therein) and cortactin and debrin in the case of Homer (Naisbitt et al., 1999; Kuriu et al., 2006 and references therein). F-actin disruption decreases the size of their clusters (Kirsch and Betz, 1995; Usui et al., 2003; Charrier et al., 2006). In our experiments, we used low concentration and a short incubation time, and, consequently, latrunculin reduced only slightly (10%) the surface area of gephyrin–mRFP and Homer1c–EGFP puncta (supplemental information, Fig. S3A–C, available at www.jneurosci.org as supplemental material). Spine shape and number as well as the ratio of inhibitory versus excitatory synapses were not modified (supplemental information, Fig. S3C, available at www.jneurosci.orgas supplemental material).
Latrunculin treatment increased the mobility of QD–ChTx in both the synaptic (p < 0.05, KS test) (Fig. 5 A1) and extrasynaptic (p < 0.0001, KS test; data not shown) membranes with respect to DMSO-treated controls (supplemental table, available at www.jneurosci.org as supplemental material). The median D increased 1.46-fold (control, 1.3 × 10⁻² μm2/s−1; latrunculin, 1.9 × 10⁻² μm2/s−1), and 2.75-fold (control, 2 × 10⁻² μm2/s−1; latrunculin, 5.5 × 10⁻² μm2/s−1) at inhibitory and excitatory PSMs, respectively. Subtractive curves (control minus latrunculin) emphasize that the faster molecules were further accelerated after latrunculin treatment (Fig. 5 A2). After this treatment, the confinement at PSMs was markedly reduced (Fig. 5 B), with the effect being more important at excitatory PSMs: the MSD values between 0.3 and 0.4 s time intervals were significantly larger after F-actin depolymerization (Fig. 5 C). Similar experiments on nontransfected cells, in which the presynaptic terminal boutons were labeled with FM4-64, confirmed these results and excluded a bias that could result from the overexpression of scaffolding molecules (supplemental information, Fig. S3D, available at www.jneurosci.org as supplemental material). Notably, although QD–ChTx was much less confined at excitatory synapses, it still diffused less than at extrasynaptic sites.
Figure 5.

Effect of F-actin depolymerization by latrunculin on QD–ChTx diffusion. A1, Cumulative frequency distribution of D for QD–ChTx trajectories in synapses without (solid lines) or with (broken lines) latrunculin treatment. Left, Inhibitory synaptic trajectories (control, n = 109; latrunculin, n = 70). Right, Excitatory synaptic trajectories (control, n = 90; latrunculin, n = 102). n = 4 independent experiments using cells from three different cultures. A2, Subtraction histograms calculated from the cumulative distributions in A1 (control − latrunculin) emphasizing the set of trajectories affected by actin depolymerization (for explanation, see Results). Horizontal broken line, No difference; vertical broken line, median D in control conditions. Positive and negative values indicate increased and reduced diffusion rates. B, Average MSD plot of the same trajectories analyzed in A (synaptic inhibitory in red; synaptic excitatory in blue). Solid and broken lines, Control and latrunculin treated, respectively. C, Surface of the area explored (mean ± SEM) by the trajectories in A between 0.3 and 0.4 s time intervals in control (C) and latrunculin (L) conditions, for inhibitory (inhib; control, n = 436; latrunculin, n = 280) and excitatory (excit; control, n = 320; latrunculin, n = 408) synapses. Two-tailed t test, ***p < 0.001. D, Cumulative frequency distribution of D for QD–ChTx trajectories in synapses pooled together (inhibitory + excitatory) without (solid lines) or with (broken lines) latrunculin treatment (control, n = 199; latrunculin, n = 172). Inset, Subtraction histogram calculated as in A2 (control − latrunculin). E, Average MSD plot of the trajectories analyzed in D, separated into slow (D ≤ D median) and fast (D > D median) groups. Solid and broken lines, Control and latrunculin treated, respectively. F, Examples of trajectories (red) of Cy5–ChTx (white, arrowheads) over the synaptic staining (green); obtained in control conditions or after 30 min of latrunculin. Top, Time is in milliseconds. Scale bar, 0.5 μm. G, Square displacements (〈r 2〉) versus time interval plots of Cy5–ChTx trajectories. The slow and rapid groups were obtained by a statistical analysis of the distributions of 〈r 2〉 as in the study by Schütz et al. (1997) (control, n = 72; latrunculin, n = 133).
After pooling all the synaptic trajectories (Fig. 5 D), it was then possible to separate the trajectories into fast and a slow ones (with D larger or smaller than the median value, respectively). After latrunculin treatment, the areas explored of both groups were significantly increased (slow group, p < 0.05, MW test; fast group, p < 0.0001, MW test). However, the slow group maintained its confined diffusion behavior, whereas the fast group was no longer confined (Fig. 5 E). This result was further confirmed with the small size probe Cy5–ChTx (Fig. 5 F). Because of the limited trajectory lengths in these experiments, we had to use a statistical approach to separate the trajectories into subpopulations (Schütz et al., 1997; Tardin et al., 2003). Three categories of movements were distinguished: immobile and slowly or rapidly mobile groups. After F-actin depolymerization, Cy5–ChTx of the slowly mobile group still exhibited confinement (but with a larger confinement area), and the rapidly mobile group displayed free diffusion (Fig. 5 G).
Cholesterol depletion differentially affects the mobility of QD–ChTx
The lipid composition of the plasma membrane could also alter the diffusion of QD–ChTx. Cholesterol is thought to aid the formation of lipid rafts packing glycosphingolipids and phospholipids with saturated fatty acid chains (Edidin, 2003). Outside rafts, cholesterol can also affect the fluidity of the membrane (London, 2005). These changes in lipid mobility have been studied with SPT and FRAP in other cell types (for review, see Marguet et al., 2006). In our study, we used COase (10 U/ml) (Lenne et al., 2006) to deplete cholesterol from the plasma membrane. COase was preferred because methyl-β cyclodextrin has side effects that alter the amount of F-actin and phosphatidylinositol-4, 5-biphosphate (Kwik et al., 2003). Actually, COase had effects that are different from F-actin stabilizing or destabilizing drugs (Lenne et al., 2006), this was also seen by us (see below). After 30 min of COase, filipin labeling decreased to 37.25 ± 5.96% of the control value, indicating partial cholesterol depletion (Hering et al., 2003) (supplemental information, Fig. S3E, available at www.jneurosci.org as supplemental material). This short-term COase treatment did not modify the neuronal shape and spines (Fig. 6 A1,A2), the size and number of inhibitory and excitatory PSMs, or GABA and AMPA receptor immunoreactivities (supplemental information, available at www.jneurosci.org as supplemental material).
Figure 6.

Diffusion QD–ChTx after cholesterol depletion by COase. A, Fluorescence of GFP–GPI (to delineate neurites and spines) and a fluorescent postsynaptic protein to label inhibitory (A1) or excitatory (A2) synapses in nonfixed cells, after COase treatment (10 U/ml, 30 min). A1, A2, Neurites with GFP–GPI (green) and gephyrin–mRFP (red, A1) or Homer1c–DsRed (blue, A2). Scale bar, 4 μm. B1, Cumulative frequency distribution of D for QD–ChTx trajectories without (solid lines) or with (broken lines) COase treatment. Left, Inhibitory synaptic trajectories (control, n = 109; COase, n = 68). Right, Excitatory synaptic trajectories (control, n = 67; COase, n = 230). B2, Subtraction histograms calculated from the cumulative distributions in B1 (control − COase) emphasizing the set of trajectories affected by cholesterol depletion (for explanation, see Results). Horizontal broken line, No difference; vertical broken line, median D in control conditions. Positive and negative values indicate increased and reduced diffusion rates. n = 4 independent experiments using cells from three different cultures. C, Average MSD plot of the trajectories in B (synaptic inhibitory in red; synaptic excitatory in blue). Solid and broken lines, Control and COase treated, respectively. D, Surface of the area explored (mean ± SEM) by the trajectories in B between 0.3 and 0.4 s time interval in control (C) and COase (CO) conditions, for inhibitory (inhib; control, n = 439; COase, n = 271) and excitatory (excit; control, n = 268; COase, n = 914) synapses. Two-tailed t test; ns, not significant; ***p < 0.001. E, Cumulative frequency distribution of D for QD–ChTx trajectories in synapses pooled together; without (solid lines) or with (broken lines) COase treatment (control, n = 174; latrunculin, n = 298). Inset, Subtraction histogram calculated as in B2 (control − COase). F, Average MSD plot of the trajectories analyzed in E, separated into slow (D ≤ D median) and fast (D > D median) groups. Solid and broken lines, Control and COase treated, respectively.
After partial cholesterol depletion, QD–ChTx diffused more rapidly at inhibitory (median D: control, 1.4 × 10⁻² μm2/s−1; COase, 2.3 × 10⁻² μm2/s−1; p < 0.01, KS test) and at excitatory PSMs (median D: control, 3 × 10⁻² μm2/s−1; COase, 3.5 × 10⁻² μm2/s−1; p < 0.05, KS test) (Fig. 6 B1) (supplemental table, available at www.jneurosci.org as supplemental material). However, QD–ChTx moved slower at the extrasynaptic membrane (median D: control, 20.2 × 10⁻² μm2/s−1; COase, 17.4 × 10⁻² μm2/s−1; p < 0.0001, KS test) (data not shown). The acceleration at synapses predominated on the slower lipids, in contrast to what was observed after actin depolymerization (Fig. 6 B2). As previously, the effect of COase on confinement prevailed at excitatory PSMs (Fig. 6 C). However, the area explored at synapses was only slightly and not significantly increased (Fig. 6 D). When we pooled all the synaptic trajectories (Fig. 6 E), COase treatment did not modify the confined diffusion behavior of the fast or slow groups (Fig. 6 F). The area explored was not significantly increased (p = 0.1 for both groups, MW test).
These results indicate that, after cholesterol deprivation, the amount of obstacles or barriers to diffusion that are responsible for the confinement did not decrease significantly. We then wondered whether cholesterol depletion could affect the lateral diffusion of receptors.
Effects of cholesterol depletion on the lateral diffusion of GABA and AMPA receptors
QD-bound GABA or AMPA receptor movements were analyzed on neurons transfected with Homer–EGFP and gephyrin–mRFP. After partial cholesterol depletion by COase, the mobility of QD-bound GABA receptors was increased at the extrasynaptic membrane (median D: control, 8.29 × 10⁻² μm2/s−1; COase, 10.27 × 10⁻² μm2/s−1; p = 0.0001, KS test) (Fig. 7 A). At synapses, median D values of QD–GABARs were 2.34 × 10⁻² μm2/s−1 (control) and 3.03 × 10⁻² μm2/s−1 (COase). The slowest GABARs (below the median value of the distribution, <2.34 × 10⁻² μm2/s−1) were accelerated (p = 0.0046, KS test), and the more rapid ones (≥2.34 × 10⁻² μm2/s−1) were not (Fig. 7 B). This behavior is comparable with that of cholera toxin-bound QD after COase treatment (Fig. 6 B1,B2). The behavior of AMPAR after COase was different (Fig. 7 C,D): extrasynaptic AMPA receptors were slowed down (median D: control, 7.98 × 10⁻² μm2/s−1; COase, 5.80 × 10⁻² μm2/s−1; p < 0.001, KS test) (Fig. 7 C), but synaptic AMPA receptors were not affected (median D: control, 1.53 × 10⁻² μm2/s−1; COase, 1.63 × 10⁻² μm2/s−1; p = 0.89, KS test) (Fig. 7 D).
Figure 7.

Effect of COase treatment on the lateral diffusion of GABA and AMPA receptors. A, B, Cumulative frequency distribution of D for QD–GABAR trajectories on control (full lines, black) or COase-treated (broken lines, red) neurons. n = 3 independent experiments using cells from two different cultures. A, Extrasynaptic trajectories (control, n = 1054; COase, n = 1780). B, Inhibitory synaptic trajectories (control, n = 63; COase, n = 59). C, D, Cumulative frequency distribution of D for QD–AMPAR trajectories on control (full lines, black) or COase-treated (broken lines, red) neurons. n = 3 independent experiments using cells from two different cultures. C, Extrasynaptic trajectories (control, n = 625; COase, n = 800). D, Excitatory synaptic trajectories (control, n = 75; COase, n = 91).
Discussion
Inhibitory and excitatory receptors have specific diffusive behaviors at their respective synapses that differ from those at extrasynaptic membranes (Triller and Choquet, 2008 and references therein). Lipids are also slowed down at the synapse (Renner et al., 2008b). This indicates that the PSM presents obstacles to diffusion even for molecules at the outer leaflet of the plasma membrane, reflecting an increased “apparent viscosity” favoring receptor trapping at synapses. The question of the factors responsible for the constrained diffusion at the origin of the increased viscosity was left open. We have now compared the behavior of lipid markers at inhibitory and excitatory synapses and its dependence on cytoskeleton integrity and cholesterol content.
Diffusion of GFP–GPI and ChTx is reduced at synapses
In FRAP experiments, GFP–GPI exhibited global slower recovery dynamics at synaptic versus extrasynaptic membranes. SPT experiments revealed that the diffusion of individual QD–GFPGPI and QD–ChTx is markedly reduced at the PSM. Nevertheless, their dwell time at synapses (0.5–0.8 s) is much shorter than that of synaptic receptors (e.g., 16 ± 6 s for GlyR) (Charrier et al., 2006). This is likely attributable to the absence of binding to stable proteins, such as the interaction between receptors and scaffolding proteins. Neither GFP–GPI nor ChTx was enriched at synaptic sites, indicating that, as expected in a steady state (Mayor and Rao, 2004), the reduction of diffusion does not lead to their accumulation. In other words, at steady state, the net flux of molecules equals zero. The reduction in mobility is not attributable to the size of the QD complex or the labeling with QDs, because it was also observed with FRAP and SMT experiments as well as by SPT over artificial PSMs.
Diffusion of QD–ChTx depends on cytoskeleton integrity
Lipids on the outer leaflet of the plasma membrane sense the cytoskeleton meshwork through the transmembrane proteins bound to it (Kusumi et al., 2005). Immobilized molecules reduce the diffusion of mobile ones by obstruction and hydrodynamic friction, and this is increased by their crowding (Saxton and Jacobson, 1997; Frick et al., 2007). The PSM, which contains a number of immobile or low-mobility molecules such as receptors and adhesion proteins (Sheng and Hoogenraad, 2007; Chen et al., 2008), is probably a crowded patch of membrane (Fig. 8 A). Therefore, free and raft-associated lipids diffuse in the gaps between the clusters of proteins. Molecular crowding can be modified by actin depolymerization, which changes the compaction of receptors and associated scaffolding molecules at the PSM (Kirsch and Betz, 1995; Allison et al., 1998; Charrier et al., 2006; Kuriu et al., 2006). Actually, the mobility of QD–ChTx was increased after F-actin depolymerization (Fig. 8 B), denoting an enlargement of the space available to move. As seen for the GlyRs (Charrier et al., 2006), this increases the diffusion of weakly or nonstabilized molecules favoring their exchange between extrasynaptic and synaptic areas.
Figure 8.

Top view of a model of the postsynaptic membrane, emphasizing the partition between transmembrane proteins, cytoskeleton, lipid rafts, and free lipids. Transmembrane proteins (orange) are associated with lipids around them (green). They constitute obstacles for other molecules. Some lipids are clustered in rafts (slow diffusers, red); others are free (rapid diffusers, blue). Dotted circles represent the resulting confinement domain at the PSM. The MSD of each type of diffusion particle is exemplified on the right. A, In basal conditions, the density of transmembrane proteins is maintained by the cytoskeleton and associated scaffold (gray). The global compaction of the structure contributes to the confined diffusion of lipids belonging or not to raft nanodomains. B, After F-actin depolymerization, some transmembrane proteins exit the PSM and the compaction is reduced; therefore, the free space for diffusion increases. The rapid diffusers display free diffusion, whereas the slower diffusers are still confined. C, Cholesterol depletion reduces the proportion of raft-associated lipids; therefore, the slower diffusers are accelerated. The compaction of obstacles does not change.
Cholesterol depletion increases the diffusion of slowly mobile QD–ChTx at synapses
Lipid phase segregation may affect the lateral diffusion of molecules belonging to rafts such as GM1 or GPI-anchored proteins, because they are transiently trapped and slowed down in these domains whose existence depends on cholesterol (Edidin, 2003; Marguet et al., 2006). However, this phase segregation has not been demonstrated directly in biological membranes, mainly because they have a complex lipid composition and are far from equilibrium (Mayor and Rao, 2004). One of the current models proposes that rafts are small and transient nanoclusters containing few molecules (Mayor and Rao, 2004) not directly observable by classical fluorescence microscopy, which is limited by the optical resolution. Any mobility reduction by these transient nanodomains is likely to be undetected (Kenworthy et al., 2004) because of other effects of cholesterol depletion, such as a reduction in general membrane fluidity (Nishimura et al., 2006) or modifications of cytoskeleton stability (Kwik et al., 2003).
In our experiments, GFP–GPI and ChTx had an even distribution in living cells, as reported for many other raft proteins or lipids in immunofluorescence studies (Mayor and Rao, 2004). Moreover, cholesterol depletion by cholesterol oxidase slightly decreased QD–ChTx diffusion in the extrasynaptic membrane. In a previous study, we found that l-α-dioleoylphosphatidylethanolamine (DOPE), a lipid that does not belong to lipid rafts, is also confined at rhodamine 123-labeled synapses (Renner et al., 2008b). This indicates that the confinement of molecules at the PSM also concern non-raft lipids. Here, we show that lipid confinement depends mainly on actin filament integrity.
Nevertheless, COase treatment exerted an effect on a subpopulation of synaptic QD–ChTx. The increased diffusion of the slow pool of QD–ChTx probably results from a reduced amount of raft nanoclusters (Fig. 8 C). The selective effect on the less mobile molecules hints that the synaptic membrane has “raft-like” properties that could arise from the crowding of stabilized transmembrane proteins. The rigidity of lipids that surround integral proteins is strongly affected by the protein (Anderson and Jacobson, 2002; Lee, 2003). In a protein-crowded environment, the proportion of protein-associated lipids increases, thus increasing membrane stiffness (Kusumi et al., 2004). As a consequence, rigid PSMs could facilitate the recruitment and stabilization of “raft-friendly” molecules and vice versa. Actually, long-term depletion of cholesterol (several days) leads to a gradual loss of inhibitory and excitatory synapses (Hering et al., 2003). At neuronal synapses, the protein–lipid cooperation could generate a permanent signaling platform, reflecting the collective behavior of lipids and proteins and their particularities at defined membrane subdomains.
Comparison between excitatory and inhibitory synapses
SPT experiments indicate that diffusion is more constrained at inhibitory than at excitatory contacts. However, in FRAP experiments, the faster pool of GFP–GPI recovered faster on gephyrin than on Homer clusters. This may result from geometrical constraints because excitatory synapses are located at spine heads, and the spine neck imposes a barrier to the diffusion of AMPA receptors (Ashby et al., 2006). Latrunculin treatment had a stronger effect on the diffusion behavior of QD–ChTx at excitatory than at inhibitory PSMs, reflecting differences in actin–PSM interactions. F-actin depolymerization reduces the amount of AMPAR and NMDAR at excitatory synapses, but GABAR number is not modified (Allison et al., 1998, 2000). However, COase treatment accelerated the diffusion of the slowest lipids labeled with ChTx as well as GABARs. Interestingly, the diffusion of synaptic AMPARs was not modified by cholesterol depletion, and, at the extrasynaptic membrane, GABARs and AMPARs were affected in an opposite way. This suggests that these receptors have a different dependence on the composition of the membrane. Indeed, GABARs are palmitoylated (Rathenberg et al., 2004). Altogether, these results indicate that inhibitory PSMs are stiffer than excitatory ones. The lower viscosity at excitatory synapse may favor a higher reactivity of the latter during plastic modification in long-term potentiation and long-term depression.
Regulation of lateral diffusion at synapses
In summary, F-actin depolymerization increased the mobility of molecules not enriched at synapses (thus not stabilized) and not directly linked to the cytoskeleton. Therefore, the actin cytoskeleton organizes the obstacles to diffusion at the postsynaptic membrane. The dependence of the obstacles on F-actin is less important at inhibitory synapses. Cholesterol depletion increased the mobility of the slow subpopulation of ChTx without changing their confinement; thus, it is likely that the amount of obstacles was unchanged.
The notion that synaptic molecular components exchange continuously and rapidly between extrasynaptic and synaptic localizations is now well established (Charrier et al., 2006; Heine et al., 2008; Renner et al., 2008a; Triller and Choquet, 2008). The differences in lipid diffusion raise the issue of specific protein–lipid interplay at inhibitory and excitatory PSM that could help to maintain its organization. Several questions remain to be solved: does PSM stiffness depend on protein number or protein identity or both? Are there specific biophysical properties of the proteins that regulate their effects on lipid diffusion? Is lipid composition regulated during synaptic plasticity? Which are the consequences for the dynamics of exchange and trapping of synaptic molecules? One should now consider the composition and organization of the synaptic membrane as important players in the stability and plasticity of neuronal synapses.
Footnotes
This work and M.R. were supported by Association Française contre les Myopathies and Agence Nationale de la Recherche Grant Neur-043-02. We thank Erin Schuman and Fabien Pinaud for their suggestions and comments on this manuscript.
References
- Allen JA, Halverson-Tamboli RA, Rasenick MM. Lipid raft microdomains and neurotransmitter signalling. Nat Rev Neurosci. 2007;8:128–140. doi: 10.1038/nrn2059. [DOI] [PubMed] [Google Scholar]
- Allison DW, Gelfand VI, Spector I, Craig AM. Role of actin in anchoring postsynaptic receptors in cultured hippocampal neurons: differential attachment of NMDA versus AMPA receptors. J Neurosci. 1998;18:2423–2436. doi: 10.1523/JNEUROSCI.18-07-02423.1998. [DOI] [PMC free article] [PubMed] [Google Scholar]
- Allison DW, Chervin AS, Gelfand VI, Craig AM. Postsynaptic scaffolds of excitatory and inhibitory synapses in hippocampal neurons: maintenance of core components independent of actin filaments and microtubules. J Neurosci. 2000;20:4545–4554. doi: 10.1523/JNEUROSCI.20-12-04545.2000. [DOI] [PMC free article] [PubMed] [Google Scholar]
- Anderson RG, Jacobson K. A role for lipid shells in targeting proteins to caveolae, rafts, and other lipid domains. Science. 2002;296:1821–1825. doi: 10.1126/science.1068886. [DOI] [PubMed] [Google Scholar]
- Ashby MC, Maier SR, Nishimune A, Henley JM. Lateral diffusion drives constitutive exchange of AMPA receptors at dendritic spines and is regulated by spine morphology. J Neurosci. 2006;26:7046–7055. doi: 10.1523/JNEUROSCI.1235-06.2006. [DOI] [PMC free article] [PubMed] [Google Scholar]
- Bannai H, Lévi S, Schweizer C, Dahan M, Triller A. Imaging the lateral diffusion of membrane molecules with quantum dots. Nat Protoc. 2006;1:2628–2634. doi: 10.1038/nprot.2006.429. [DOI] [PubMed] [Google Scholar]
- Bats C, Groc L, Choquet D. The interaction between Stargazin and PSD-95 regulates AMPA receptor surface trafficking. Neuron. 2007;53:719–734. doi: 10.1016/j.neuron.2007.01.030. [DOI] [PubMed] [Google Scholar]
- Charrier C, Ehrensperger MV, Dahan M, Lévi S, Triller A. Cytoskeleton regulation of glycine receptor number at synapses and diffusion in the plasma membrane. J Neurosci. 2006;26:8502–8511. doi: 10.1523/JNEUROSCI.1758-06.2006. [DOI] [PMC free article] [PubMed] [Google Scholar]
- Chen X, Winters C, Azzam R, Li X, Galbraith JA, Leapman RD, Reese TS. Organization of the core structure of the postsynaptic density. Proc Natl Acad Sci U S A. 2008;105:4453–4458. doi: 10.1073/pnas.0800897105. [DOI] [PMC free article] [PubMed] [Google Scholar]
- Dahan M, Lévi S, Luccardini C, Rostaing P, Riveau B, Triller A. Diffusion dynamics of glycine receptors revealed by single-quantum dot tracking. Science. 2003;302:442–445. doi: 10.1126/science.1088525. [DOI] [PubMed] [Google Scholar]
- Dillon C, Goda Y. The actin cytoskeleton: integrating form and function at the synapse. Annu Rev Neurosci. 2005;28:25–55. doi: 10.1146/annurev.neuro.28.061604.135757. [DOI] [PubMed] [Google Scholar]
- Edidin M. The state of lipid rafts: from model membranes to cells. Annu Rev Biophys Biomol Struct. 2003;32:257–283. doi: 10.1146/annurev.biophys.32.110601.142439. [DOI] [PubMed] [Google Scholar]
- Ehrensperger MV, Hanus C, Vannier C, Triller A, Dahan M. Multiple association states between glycine receptors and gephyrin identified by SPT analysis. Biophys J. 2007;92:3706–3718. doi: 10.1529/biophysj.106.095596. [DOI] [PMC free article] [PubMed] [Google Scholar]
- el-Husseini Ael-D, Bredt DS. Protein palmitoylation: a regulator of neuronal development and function. Nat Rev Neurosci. 2002;3:791–802. doi: 10.1038/nrn940. [DOI] [PubMed] [Google Scholar]
- Fischer M, Kaech S, Wagner U, Brinkhaus H, Matus A. Glutamate receptors regulate actin-based plasticity in dendritic spines. Nat Neurosci. 2000;3:887–894. doi: 10.1038/78791. [DOI] [PubMed] [Google Scholar]
- Frick M, Schmidt K, Nichols BJ. Modulation of lateral diffusion in the plasma membrane by protein density. Curr Biol. 2007;17:462–467. doi: 10.1016/j.cub.2007.01.069. [DOI] [PubMed] [Google Scholar]
- Groc L, Lafourcade M, Heine M, Renner M, Racine V, Sibarita JB, Lounis B, Choquet D, Cognet L. Surface trafficking of neurotransmitter receptor: comparison between single-molecule/quantum dot strategies. J Neurosci. 2007;27:12433–12437. doi: 10.1523/JNEUROSCI.3349-07.2007. [DOI] [PMC free article] [PubMed] [Google Scholar]
- Hanus C, Ehrensperger MV, Triller A. Activity-dependent movements of postsynaptic scaffolds at inhibitory synapses. J Neurosci. 2006;26:4586–4595. doi: 10.1523/JNEUROSCI.5123-05.2006. [DOI] [PMC free article] [PubMed] [Google Scholar]
- Heine M, Groc L, Frischknecht R, Béïque JC, Lounis B, Rumbaugh G, Huganir RL, Cognet L, Choquet D. Surface mobility of postsynaptic AMPARs tunes synaptic transmission. Science. 2008;320:201–205. doi: 10.1126/science.1152089. [DOI] [PMC free article] [PubMed] [Google Scholar]
- Hering H, Lin CC, Sheng M. Lipid rafts in the maintenance of synapses, dendritic spines, and surface AMPA receptor stability. J Neurosci. 2003;23:3262–3271. doi: 10.1523/JNEUROSCI.23-08-03262.2003. [DOI] [PMC free article] [PubMed] [Google Scholar]
- Holcman D, Triller A. Modeling synaptic dynamics driven by receptor lateral diffusion. Biophys J. 2006;91:2405–2415. doi: 10.1529/biophysj.106.081935. [DOI] [PMC free article] [PubMed] [Google Scholar]
- Kenworthy AK, Nichols BJ, Remmert CL, Hendrix GM, Kumar M, Zimmerberg J, Lippincott-Schwartz J. Dynamics of putative raft-associated proteins at the cell surface. J Cell Biol. 2004;165:735–746. doi: 10.1083/jcb.200312170. [DOI] [PMC free article] [PubMed] [Google Scholar]
- Kirsch J, Betz H. The postsynaptic localization of the glycine receptor-associated protein gephyrin is regulated by the cytoskeleton. J Neurosci. 1995;15:4148–4156. doi: 10.1523/JNEUROSCI.15-06-04148.1995. [DOI] [PMC free article] [PubMed] [Google Scholar]
- Kirsch J, Wolters I, Triller A, Betz H. Gephyrin antisense oligonucleotides prevent glycine receptor clustering in spinal neurons. Nature. 1993;366:745–748. doi: 10.1038/366745a0. [DOI] [PubMed] [Google Scholar]
- Kneussel M, Brandstätter JH, Laube B, Stahl S, Müller U, Betz H. Loss of postsynaptic GABAA receptor clustering in gephyrin-deficient mice. J Neurosci. 1999;19:9289–9297. doi: 10.1523/JNEUROSCI.19-21-09289.1999. [DOI] [PMC free article] [PubMed] [Google Scholar]
- Kuriu T, Inoue A, Bito H, Sobue K, Okabe S. Differential control of postsynaptic density scaffolds via actin-dependent and -independent mechanisms. J Neurosci. 2006;26:7693–7706. doi: 10.1523/JNEUROSCI.0522-06.2006. [DOI] [PMC free article] [PubMed] [Google Scholar]
- Kusumi A, Sako Y, Yamamoto M. Confined lateral diffusion of membrane receptors as studied by single particle tracking (nanovid microscopy). Effects of calcium-induced differentiation in cultured epithelial cells. Biophys J. 1993;65:2021–2040. doi: 10.1016/S0006-3495(93)81253-0. [DOI] [PMC free article] [PubMed] [Google Scholar]
- Kusumi A, Koyama-Honda I, Suzuki K. Molecular dynamics and interactions for creation of stimulation-induced stabilized rafts from small unstable steady-state rafts. Traffic. 2004;5:213–230. doi: 10.1111/j.1600-0854.2004.0178.x. [DOI] [PubMed] [Google Scholar]
- Kusumi A, Nakada C, Ritchie K, Murase K, Suzuki K, Murakoshi H, Kasai RS, Kondo J, Fujiwara T. Paradigm shift of the plasma membrane concept from the two-dimensional continuum fluid to the partitioned fluid: high-speed single-molecule tracking of membrane molecules. Annu Rev Biophys Biomol Struct. 2005;34:351–378. doi: 10.1146/annurev.biophys.34.040204.144637. [DOI] [PubMed] [Google Scholar]
- Kwik J, Boyle S, Fooksman D, Margolis L, Sheetz MP, Edidin M. Membrane cholesterol, lateral mobility, and the phosphatidylinositol 4,5-bisphosphate-dependent organization of cell actin. Proc Natl Acad Sci U S A. 2003;100:13964–13969. doi: 10.1073/pnas.2336102100. [DOI] [PMC free article] [PubMed] [Google Scholar]
- Lee AG. Lipid-protein interactions in biological membranes: a structural perspective. Biochim Biophys Acta. 2003;1612:1–40. doi: 10.1016/s0005-2736(03)00056-7. [DOI] [PubMed] [Google Scholar]
- Lencer WI, Tsai B. The intracellular voyage of cholera toxin: going retro. Trends Biochem Sci. 2003;28:639–645. doi: 10.1016/j.tibs.2003.10.002. [DOI] [PubMed] [Google Scholar]
- Lenne PF, Wawrezinieck L, Conchonaud F, Wurtz O, Boned A, Guo XJ, Rigneault H, He HT, Marguet D. Dynamic molecular confinement in the plasma membrane by microdomains and the cytoskeleton meshwork. EMBO J. 2006;25:3245–3256. doi: 10.1038/sj.emboj.7601214. [DOI] [PMC free article] [PubMed] [Google Scholar]
- London E. How principles of domain formation in model membranes may explain ambiguities concerning lipid raft formation in cells. Biochim Biophys Acta. 2005;1746:203–220. doi: 10.1016/j.bbamcr.2005.09.002. [DOI] [PubMed] [Google Scholar]
- Marguet D, Lenne PF, Rigneault H, He HT. Dynamics in the plasma membrane: how to combine fluidity and order. EMBO J. 2006;25:3446–3457. doi: 10.1038/sj.emboj.7601204. [DOI] [PMC free article] [PubMed] [Google Scholar]
- Mayor S, Rao M. Rafts: scale-dependent, active lipid organization at the cell surface. Traffic. 2004;5:231–240. doi: 10.1111/j.1600-0854.2004.00172.x. [DOI] [PubMed] [Google Scholar]
- Meier J, Vannier C, Sergé A, Triller A, Choquet D. Fast and reversible trapping of surface glycine receptors by gephyrin. Nat Neurosci. 2001;4:253–260. doi: 10.1038/85099. [DOI] [PubMed] [Google Scholar]
- Naisbitt S, Kim E, Tu JC, Xiao B, Sala C, Valtschanoff J, Weinberg RJ, Worley PF, Sheng M. Shank, a novel family of postsynaptic density proteins that binds to the NMDA receptor/PSD-95/GKAP complex and cortactin. Neuron. 1999;23:569–582. doi: 10.1016/s0896-6273(00)80809-0. [DOI] [PubMed] [Google Scholar]
- Nishimura SY, Vrljic M, Klein LO, McConnell HM, Moerner WE. Cholesterol depletion induces solid-like regions in the plasma membrane. Biophys J. 2006;90:927–938. doi: 10.1529/biophysj.105.070524. [DOI] [PMC free article] [PubMed] [Google Scholar]
- Racine V, Sachse M, Salamero J, Fraisier V, Trubuil A, Sibarita JB. Visualization and quantification of vesicle trafficking on a three-dimensional cytoskeleton network in living cells. J Microsc. 2007;225:214–228. doi: 10.1111/j.1365-2818.2007.01723.x. [DOI] [PubMed] [Google Scholar]
- Rathenberg J, Kittler JT, Moss SJ. Palmitoylation regulates the clustering and cell surface stability of GABAA receptors. Mol Cell Neurosci. 2004;26:251–257. doi: 10.1016/j.mcn.2004.01.012. [DOI] [PubMed] [Google Scholar]
- Renner M, Specht CG, Triller A. Molecular dynamics of postsynaptic receptors and scaffold proteins. Curr Opin Neurobiol. 2008a;18:532–540. doi: 10.1016/j.conb.2008.09.009. [DOI] [PubMed] [Google Scholar]
- Renner ML, Cognet L, Lounis B, Triller A, Choquet D. The excitatory postsynaptic density is a size exclusion diffusion environment. Neuropharmacology. 2008b. Retrieved July 23, 2008. [DOI] [PubMed]
- Saxton MJ, Jacobson K. Single-particle tracking: applications to membrane dynamics. Annu Rev Biophys Biomol Struct. 1997;26:373–399. doi: 10.1146/annurev.biophys.26.1.373. [DOI] [PubMed] [Google Scholar]
- Schütz GJ, Schindler H, Schmidt T. Single-molecule microscopy on model membranes reveals anomalous diffusion. Biophys J. 1997;73:1073–1080. doi: 10.1016/S0006-3495(97)78139-6. [DOI] [PMC free article] [PubMed] [Google Scholar]
- Sharma P, Varma R, Sarasij RC, Ira , Gousset K, Krishnamoorthy G, Rao M, Mayor S. Nanoscale organization of multiple GPI-anchored proteins in living cell membranes. Cell. 2004;116:577–589. doi: 10.1016/s0092-8674(04)00167-9. [DOI] [PubMed] [Google Scholar]
- Sheng M, Hoogenraad CC. The postsynaptic architecture of excitatory synapses: a more quantitative view. Annu Rev Biochem. 2007;76:823–847. doi: 10.1146/annurev.biochem.76.060805.160029. [DOI] [PubMed] [Google Scholar]
- Stetzkowski-Marden F, Gaus K, Recouvreur M, Cartaud A, Cartaud J. Agrin elicits membrane lipid condensation at sites of acetylcholine receptor clusters in C2C12 myotubes. J Lipid Res. 2006;47:2121–2133. doi: 10.1194/jlr.M600182-JLR200. [DOI] [PubMed] [Google Scholar]
- Tardin C, Cognet L, Bats C, Lounis B, Choquet D. Direct imaging of lateral movements of AMPA receptors inside synapses. EMBO J. 2003;22:4656–4665. doi: 10.1093/emboj/cdg463. [DOI] [PMC free article] [PubMed] [Google Scholar]
- Triller A, Choquet D. Surface trafficking of receptors between synaptic and extrasynaptic membranes: and yet they do move! Trends Neurosci. 2005;28:133–139. doi: 10.1016/j.tins.2005.01.001. [DOI] [PubMed] [Google Scholar]
- Triller A, Choquet D. New concepts in synaptic biology derived from single-molecule imaging. Neuron. 2008;59:359–374. doi: 10.1016/j.neuron.2008.06.022. [DOI] [PubMed] [Google Scholar]
- Tsuriel S, Geva R, Zamorano P, Dresbach T, Boeckers T, Gundelfinger ED, Garner CC, Ziv NE. Local sharing as a predominant determinant of synaptic matrix molecular dynamics. PLoS Biol. 2006;4:e271. doi: 10.1371/journal.pbio.0040271. [DOI] [PMC free article] [PubMed] [Google Scholar]
- Usui S, Konno D, Hori K, Maruoka H, Okabe S, Fujikado T, Tano Y, Sobue K. Synaptic targeting of PSD-Zip45 (Homer 1c) and its involvement in the synaptic accumulation of F-actin. J Biol Chem. 2003;278:10619–10628. doi: 10.1074/jbc.M210802200. [DOI] [PubMed] [Google Scholar]
- Wong W, Schlichter LC. Differential recruitment of Kv1.4 and Kv4.2 to lipid rafts by PSD-95. J Biol Chem. 2004;279:444–452. doi: 10.1074/jbc.M304675200. [DOI] [PubMed] [Google Scholar]