Abstract
Functional magnetic resonance imaging (fMRI) of the human brain is widely used in neuroscience, but the exact relationship between measured fMRI response and the underlying changes in neuronal activity is still elusive. To obtain further information about the specific roles of synaptic (input) and spiking activity (output) for the generation of fMRI-related signals, we used an approach that combines electrophysiological and MRI measurements in the anatomically and physiologically well defined rat hippocampus. Direct electrical stimulation of the perforant pathway enabled us to control synchronized input activity to the dentate gyrus, whereas recorded population spikes from the granular cell layer indicated the dentate output activity. The perforant pathway was first stimulated with 15 identical pulse trains (10 Hz for 8 s), and evoked blood oxygenation level-dependent (BOLD) responses and population spikes were measured for each individual stimulus train. Spatial and magnitude aspects of the elicited BOLD responses differentially changed in the dentate gyrus and hippocampus from early to late stimulus trains together with population spike latencies in the dentate indicating delayed inhibitory network processing. Furthermore, the same number of stimuli presented in different patterns within trains (i.e., bursts of 10 stimuli at 50, 100, or 200 Hz) clearly altered the BOLD responses. Similarly, variations in the BOLD response also occurred when different stimulus patterns were chosen that caused the same number of population spikes. The results indicate that neuronal network activity including inhibitory interneurons rather than exclusively the input or spiking activity of the principal neurons determine a BOLD response to repetitive stimuli.
Keywords: fMRI, hippocampus, BOLD response, electrical stimulation, electrophysiology, dentate gyrus
Introduction
Understanding the relationship between altered neuronal activities and resulting blood oxygen level-dependent (BOLD) response is of particular interest for any interpretation of functional magnetic resonance imaging (fMRI) results. The BOLD response reflects vascular-hemodynamic changes caused by altered neuronal activity and is, consequently, only indirectly related to neuronal activity. A general assumption is that the magnitude of an fMRI signal is approximately proportional to changes in neuronal activity (Heeger and Ress, 2002). However, such a general model does not specify what elements of neuronal activity actually define the fMRI response. Although there is ample evidence that synaptic activity, i.e., input activity to a neuronal network, rather than spiking activity, i.e., output from that network, is more closely related to the generated fMRI response (Mathiesen et al., 1998; Logothetis et al., 2001; Kayser et al., 2004; Viswanathan and Freeman, 2007), there are also indications that spiking activity itself controls the generation of fMRI responses (Mukamel et al., 2005; Nir et al., 2007). However, in complex networks, there is a third possibility, namely, that local processing, e.g., activities of interneurons or recurrent loops strongly influence the fMRI signal.
To investigate in detail how synaptic, spiking activity, or local processing affect the fMRI response an experimental system is required that allows to control the synaptic and spiking activity by application of specific stimulation protocols and to monitor simultaneously input and output activity during fMRI measurements.
In a previous report, we introduced such a design that combines fMRI measurements and electrophysiological recordings in the rat hippocampus during electrical stimulation of the perforant pathway (Angenstein et al., 2007). This approach, more precisely than any sensory stimulation, enables us to directly control the synchronized input activity to the dentate gyrus by variations of the stimulation parameters (i.e., number, frequency, intensity). Concurrently, the spiking (output) activity of the granular cells within the dentate gyrus is monitored and can be quantified by the measured population spike amplitude and latency. Clarifying this relationship between neuronal activity and BOLD response in the hippocampus appears to be of paramount importance with regard to the prominent role of this structure in understanding learning related plasticity. Using this approach, we could already demonstrate that the magnitude of the BOLD response in the hippocampus is correlated with the stimulation frequency, indicating that the summation of input activity over time is one factor that influences the fMRI signal.
Assuming that with repetitive stimulation mainly synaptic input summation determines the fMRI response in the hippocampus, identical numbers of stimuli provided in various patterns in a defined time-period should generate comparable fMRI responses. To test this hypothesis, we performed various experiments with patterned high frequency stimulation in repetitive bursts in which also the output from the dentate gyrus in terms of the number of population spikes was kept constant, thus excluding a varying influence from output spikes. The results show that the temporal dynamics of the BOLD response is not compatible with a simple summation of the number of inputs over time suggesting a strong influence of time-dependent local processing in the dentate gyrus and beyond.
Materials and Methods
Animals and surgical procedure.
For electrode implantation, 7- to 8-week-old male Wistar rats were anesthetized with Nembutal (40 mg/kg, i.p.) and placed into a stereotactic frame. A bipolar stimulation electrode (114 μm in diameter, made from Teflon-coated tungsten wire, A-M Systems) was placed into the perforant path of the right hemisphere at the coordinates anteroposterior (AP), −7.5; mediolateral (ML), 4.1 mm from Bregma; dorsoventral (DV), 2.5–3.0 mm from the dural surface. A monopolar recording electrode was lowered into the granular cell layer of the dentate gyrus AP: −4.0 mm, ML: 2.3 mm from Bregma, DV: 2.8–3.2 mm from the dural surface. Monitoring the monosynaptically evoked field potentials during implantation controlled the correct placement, especially regarding depth. Grounding and indifferent electrodes (silver-wires) were set on dura through the left side of the skull. Electrodes were fixed on the bone with dental cement and plastic screws. After the surgery, animals were housed individually for a week of recovery with ad libitum food and water.
For the fMRI experiment, animals were anesthetized with 1.0–1.5% isoflurane (in 50:50 N2O:O2; v/v) and connected to the stimulation and recording electrode after fixation into the head-holder. Heating was provided from the ventral side and breathing rate was monitored during the whole experiment. For the construction of an input/output curve, elicited population spikes and EPSPs to increasing stimulation intensities were measured, and for the experiments, stimulation intensities were chosen such that the evoked population spike amplitudes were 50% of the maximum.
MRI measurements and stimulation.
Anesthetized rats were fixed using a head-holder with a bite bar to reduce motion artifacts. MRI experiments were performed on a Bruker Biospec 47/20 scanner at 4.7T (free bore of 20 cm) equipped with a BGA 12 (200 mT/m) gradient system. A 50 mm Litzcage small animal imaging system (DotyScientific) was used for RF excitation and signal reception. For anatomical images, eight horizontal T2-weighted spin-echo images were obtained using a rapid acquisition relaxation enhanced (RARE) sequence (Hennig et al., 1986) with the following parameters: repetition time (TR), 4000 ms; echo time (TE), 15 ms; slice thickness, 1 mm; field of view (FOV), 40 × 40 mm; matrix 256 × 256; RARE factor, 8; number of excitations, 4. The total scanning time was 8 min 32 s. fMRI was performed using an echoplanar imaging (EPI) sequence with the following parameters: TR, 2000 ms; TE, 24 ms; slice thickness, 1 mm; FOV, 40 × 40 mm; matrix, 64 × 64; total scanning time per frame, 2 s. To detect a putative BOLD signal response within the hippocampus after electrical stimulation of the perforant pathway, the following general block design was applied: after 60 s (corresponds to 30 frames in fMRI) a stimulus train was applied for 8 s (four frames in fMRI) followed by 52 s rest. In each individual experiment, 15 identical trains of electrical stimulus pulses were given leading to a total scanning time of 16 min (480 frames in fMRI).
In the first set of experiments, a train consisted of 80 identical stimuli given in eight bursts during 8 s (or one burst per second). Each burst contained 10 stimuli and was applied with 10, 50, or 100 Hz. Thus, the perforant pathway was stimulated continuously during the 10 Hz protocol, in eight bursts of 200 ms with 800 ms pauses during the 50 Hz protocol and in eight bursts of 100 ms with 900 ms pauses during the 100 Hz protocol.
In the second set of experiments, each train contained the double amount of stimuli, i.e., 160. These stimuli were again applied in bursts starting at every second of the stimulus train. The frequencies were 20, 100, and 200 Hz, which resulted again in burst durations of 1 s, 200, and 100 ms, respectively (a schematic view of the applied stimulation protocol is depicted in each figure).
Data processing and analysis.
The functional data were converted into BrainVoyager data format. A standard sequence of preprocessing steps implemented in the BrainVoyager QX software, such as three-dimensional (3D) motion correction and temporal filtering (Gaussian filter; FWHM 3 data points) were applied to each data set. Functional activation was analyzed by correlation of the observed signal intensity changes in each voxel with the given stimulus protocol (see above) and based on this an appropriate activation map was generated. To account for the hemodynamic delay the stimulus representing block design was modified by a double-gamma hemodynamic response function (onset 0 s, time to response peak 5 s, time to undershoot peak 15 s). To exclude false positive voxels we considered only voxels with a significance level <10−9 for the analysis of the size of the activated area. BOLD time series represent if not otherwise indicated signal intensity changes within significantly activated voxels in the appropriate area. Event-related BOLD responses were calculated by measuring the signal intensities starting six frames (−12 s until 0 s) before stimulus onset (stimulus presentation was between 0 and 8 s, which corresponds to 4 frames) until 20 frames (8–48 s) after the stimulus end. The averaged signal intensities within the appropriate area in the first 5 frames (−12 s until −2 s) were set to 100%. Therefore, event-related BOLD responses do not consider the effect of variations in the baseline signal intensity so that a decline in the baseline signal intensity cause an apparent increase in the calculated BOLD response. To visualize variations in the activation pattern during the entire experiment each fMRI dataset was aligned to a 3D standard rat brain using anatomical landmarks. These datasets were then further analyzed with a linear regression analysis (general linear model, multi subject analysis, implemented in BrainVoyager QX software).
Results
Area- and time-specific development of BOLD responses during application of repetitive 10 Hz stimulation trains
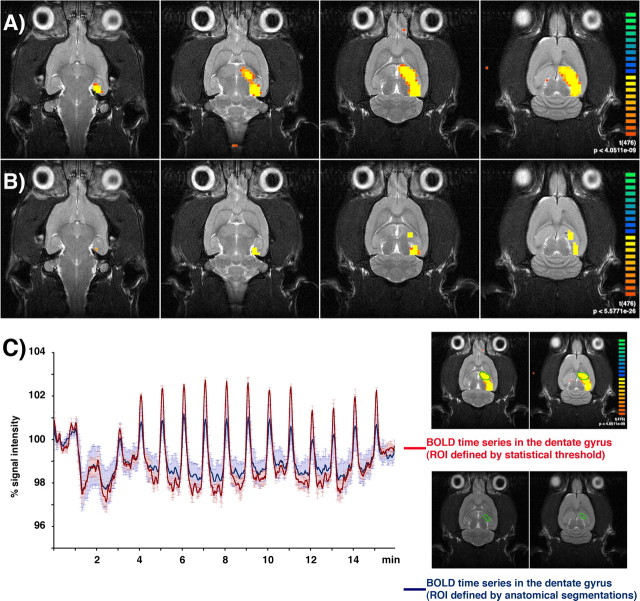
Comparable with previous experiments (Angenstein et al., 2007), the chronically implanted electrodes caused only small artifacts during functional EPI-measurements. Electrical stimulation of the right perforant pathway with 15 successive trains of 80 stimulus pulses at 10 Hz generated a significant average BOLD response in the entire ipsilateral hippocampus (Fig. 1A). At higher significance level of activated voxels, two activation clusters within the ipsilateral hippocampal structure were revealed, namely in the dentate gyrus and in an area containing the subiculum and the entorhinal cortex (Fig. 1B).
Figure 1.
Example of an fMRI experiment using chronically implanted electrodes that allowed to stimulate the right perforant pathway and to record the neuronal activity within the dentate gyrus during acquisition of an fMRI data set. A, Electrical activation of the perforant pathway with repetitive stimulus trains (15 trains, 10 Hz for 8 s each, 52 s intertrain interval, 16 min total measuring time) caused a significant BOLD response in the entire ipsilateral hippocampus (t >6.38; p < 4.26 × 10⁻¹⁰). B, By increasing the significance level (t >11.58; p < 1.40 × 10⁻²⁸), two distinct activation areas became detectable, i.e., the dentate gyrus and an area containing the subiculum and the entorhinal cortex region. C, Comparable BOLD time series in the dentate gyrus, defined by the statistical threshold (red) or by anatomical segmentation (blue). Small distortions in the EPI-based fMR images compared with the RARE-based anatomical MR images caused slightly reduced BOLD amplitudes (graphs represent averaged BOLD time series measured in 5 animals).
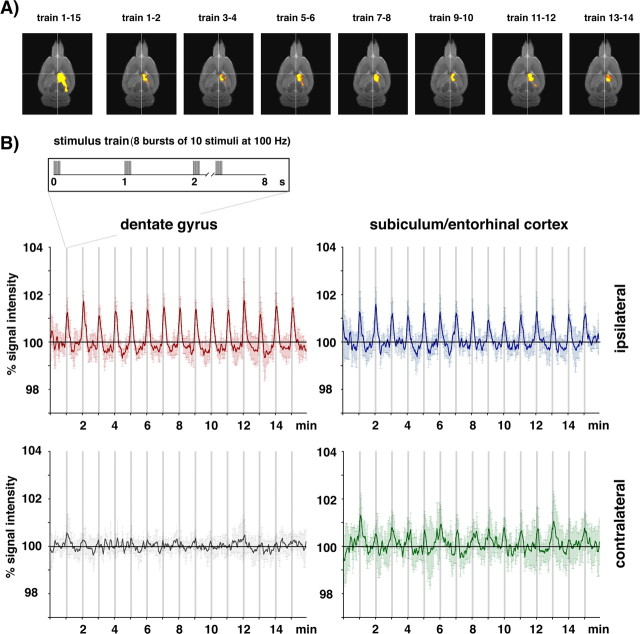
A quantitative regional comparison of the average BOLD responses showed only slight magnitude differences between the ipsilateral dentate gyrus and ipsilateral subiculum/entorhinal cortex region and, in contrast, a clearly smaller BOLD response in the contralateral subiculum/entorhinal cortex and no significant response in the contralateral dentate gyrus (Fig. 2B).
Figure 2.
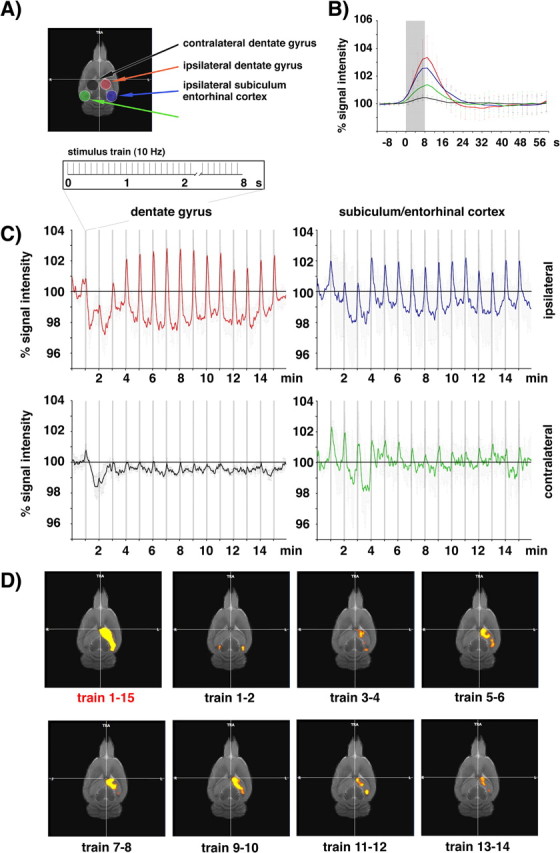
Consecutive identical stimulation trains cause region- and time-specific variations in the BOLD response. A, The hippocampal regions selected for BOLD measurements are depicted in an anatomical MRI (top left). B, Calculation of the average BOLD responses in the ipsilateral dentate gyrus (red line), ipsilateral subiculum/entorhinal cortex (blue line), contralateral subiculum/entorhinal cortex (green line), and contralateral dentate gyrus (black line). Each line represents the average BOLD response to all 15 identical stimulus trains. The gray box indicates the time window of the stimulation train. C, Time-dependent variations in the BOLD responses during electrical stimulation of the right perforant pathway (the stimulation pattern of one train is depicted in the scheme above). Whereas in the ipsilateral subiculum/entorhinal cortex region, clear BOLD responses were detectable during all stimulus trains, obvious BOLD responses in the ipsilateral dentate gyrus became detectable only after the second stimulation train. In contrast, within the contralateral subiculum/entorhinal cortex, significant BOLD responses to the stimulation were only detectable during the initial stimulation trains. No clear positive BOLD responses were observed in the contralateral dentate gyrus region. Each inset represents the averaged BOLD response of five individual animals. D, Calculation of a general linear model of regions with significant stimulus-dependent signal intensity changes revealed a time-dependent variation in the activation pattern. Early stimulation trains (train 1–2) triggered significant BOLD responses only in the ipsilateral and contralateral entorhinal cortex regions. Subsequent stimulation trains caused a spreading of the BOLD response to the entire ipsilateral hippocampus, which was followed by a more focused BOLD response to the dentate gyrus region at the end of the experiment.
The analysis of the magnitude of the BOLD response to individual stimulus trains traced different developments of the hemodynamic response in these regions (Fig. 2C). Within the ipsilateral dentate gyrus a positive BOLD response was hardly detectable during the first two stimulus trains and appeared first with the third stimulus train. In contrast, a clear BOLD response was already detectable during the first two stimulus trains in the ipsilateral subiculum/entorhinal cortex, which then increased slightly during the following stimulus trains. In these two regions the baseline signal intensity (the signal intensity immediately before the onset of the 15 stimulus trains) declined during the stimulation (Fig. 1C). Within the contralateral subiculum/entorhinal cortex region only initial stimulus trains caused a clear BOLD response, which declined during subsequent, although identical, stimulus trains (Fig. 2C). Consequently, the contralateral subiculum/entorhinal cortex area did not always appear as a region whose signal intensity changes significantly correlated with all presentations of the 15 stimulus trains (see also Fig. 1A). Briefly, the course of the observed BOLD responses differed considerably between early and late stimulus trains dependent on the observed area.
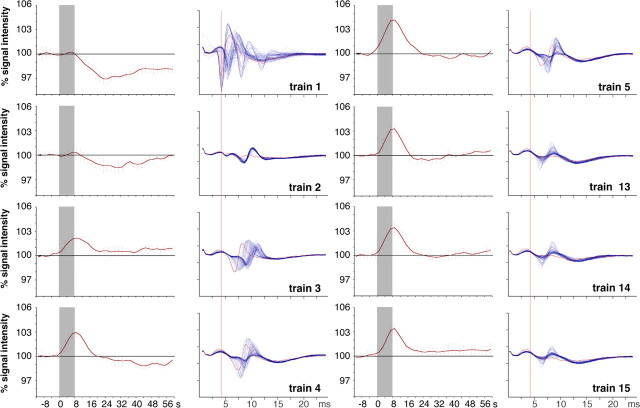
The difference in the BOLD response between early and late stimulus trains in the ipsilateral dentate gyrus became even more obvious when event-related responses for each individual stimulus train were calculated (Fig. 3, left columns). Beside the already mentioned variation in the magnitude of the BOLD response, the event-related BOLD response following the first stimulation train was characterized by a late negative component that persisted even beyond the intertrain interval. This decline in the overall BOLD-signal intensity after the first stimulus train did not recover during the entire train presentation leading to an apparent negative shift of the BOLD baseline signal intensity of ∼2% (Fig. 2C).
Figure 3.
Comparison of the BOLD response (left columns) and corresponding population spikes (right columns) in the dentate gyrus triggered by individual 10 Hz stimulation trains. During the first stimulation train a delayed reduction in the BOLD signal intensity was observed that coincided with a large variation in the population spike characteristics (amplitude and latency). Starting with the third stimulation train clear positive BOLD responses without a delayed negative component became detectable that corresponded to stable patterns of elicited population spikes. The BOLD responses to individual stimulation trains are depicted as event-related average of all five animals. The gray box indicates the time window of the stimulus train. All 80 measured population spikes within an entire stimulation train are superimposed, and the first population spike is indicated in red. For comparison, the latency of the first population spike within the first stimulation train is indicated by the red vertical line (the measurements are from 1 experiment).
The area-specific development of BOLD responses to repetitive 10 Hz stimulation trains implies a changing activation pattern of the hippocampal formation during the experiment. Therefore, we visualized the spatial variation of the BOLD response during the entire experiment (Fig. 2D). Stimulation of the right perforant pathway caused first activation within the ipsilateral as well as contralateral subiculum/entorhinal cortex area. Subsequent stimulation trains elicited activations in the ipsilateral hippocampus, where the BOLD response appeared first in the dentate gyrus and seemed to dispersed from there over the entire ipsilateral hippocampus until a maximum extend of activation was reached (around train 7–8), and finally decreased slightly, assuming a stable pattern.
Temporal development of population spike responses in the dentate gyrus to 10 Hz stimulation
We have illustrated above that in the ipsilateral dentate gyrus the initial two trains of 10 Hz stimulation failed to produce a positive BOLD response followed by an increasing and then stable BOLD response with subsequent trains. This already suggests that with repetitive trains some reorganization of processing of always the same input takes place in the dentate gyrus before any BOLD response is generated. This becomes clear by analysis of the output in terms of population spikes in all trains that are generated under these conditions. Figure 3 depicts the average BOLD response of five animals separately for each train in parallel with a superposition of all 80 population spikes in each train as obtained in one of the animals. Population spike amplitudes and latencies during the first train exhibit large variations, which however are not randomly distributed but show groupings of the amplitude and latency combinations. During the second train, the population spike amplitudes break down to small but reliable signals with a relative long latency at ∼7 ms. With the appearance of a positive BOLD response during the third train the population spikes around this latency increase in amplitude again. With the maximum BOLD response during the fourth and fifth train, a further stabilization of the population spikes at the described latency takes place although the amplitude remains quite variable. With subsequent trains the BOLD response diminished somewhat together with some decline of the amplitudes of stable population spikes. This comparison of BOLD responses and output population spikes suggest that under conditions of stable repetitive inputs the output of the dentate gyrus in terms of population spikes may be very strong initially (in fact on average much stronger than in later trains) without producing any positive BOLD response. Only when the variable output latencies to individual pulses become homogenized and fixed to a relative late time window a BOLD response appears although the population spike amplitudes may not be high. This suggests that a rapid and in terms of population spike amplitudes highly effective input–output transfer through the dentate gyrus is not a chief correlate of a local BOLD response but an internal process that delays the output and renders it temporally reliable from pulse to pulse even at the expense of reduced output amplitude. All this points to internal network processing being responsible for the BOLD signal with a strong role of inhibitory neurons.
The influence of temporal stimulus pattering on the dentate gyrus response
To test the hypothesis that the BOLD response to periodic pulses is related to specific time-dependent processing of the incoming stimuli rather than simply to the total number of inputs per time period, we modified the stimulation protocol in such a way that the total number of stimuli per train was kept constant (i.e., 80 stimuli) but the temporal pattern was changed. Instead of applying the stimuli continuously at 10 Hz for 8 s, we condensed the same number of stimuli to eight bursts with 10 stimuli at 100 Hz each presented every second. Such an activation paradigm with 100 ms burst duration also caused significant BOLD responses within the entire ipsilateral hippocampus but no significant activation in the contralateral subiculum/entorhinal cortex region (Fig. 4). However, under this stimulation regime the time course of the BOLD response within the ipsilateral dentate gyrus differed considerably to the one observed during repetitive 10 Hz stimulation trains. A significant positive BOLD response was already triggered during the first stimulation train and the magnitude of the BOLD response did not change during the sequential presentation of trains. Furthermore, a decline of the baseline signal intensity as seen during repetitive 10 Hz stimulation trains was not anymore detectable.
Figure 4.
Development of the BOLD response during stimulation of the perforant pathway with 15 patterned stimulus trains (8 bursts of 10 stimuli each at 100 Hz). A, Visualization of significant BOLD responses to individual stimulation trains revealed an almost identical pattern during the entire experiment. B, The individual BOLD responses triggered by each individual stimulation train were similar during the entire experiment (graphs represent the average BOLD response measured in 8 animals).
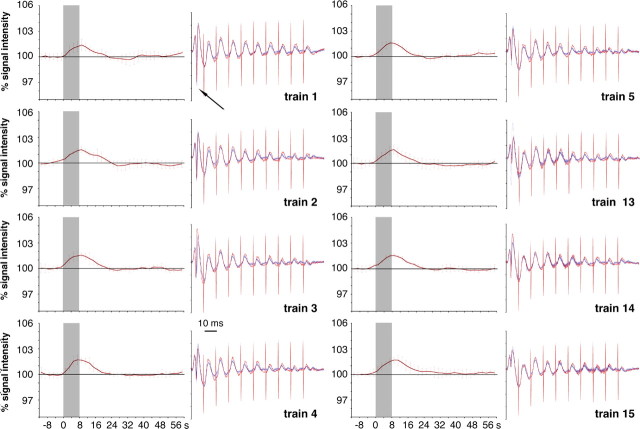
Analysis of the electrophysiological recordings suggested that this stimulation regime must have activated massively inhibitory interneurons already during the first stimulation train (Fig. 5, right columns). Remarkably, only one population spike per second (namely after the first stimulus of each burst) was elicited, corresponding to only eight population spikes within an entire stimulation train. This general activation pattern remained unchanged, except that the averaged population spike amplitude slightly decreased from train 1 to 15. This stereotyped activation pattern within the dentate gyrus during the experiment corresponded well with the stable BOLD response (Fig. 5, left columns).
Figure 5.
Comparison of BOLD responses (left columns) and corresponding population spikes (right columns) in the dentate gyrus caused by repetitive patterned stimulus trains (as in Fig. 4). The high-frequency stimulation of the perforant pathway triggered one initial population spike per burst (black arrow), whereas subsequent stimuli in a burst triggered only detectable field EPSPs with decreasing amplitude (gray arrow). The general activation pattern induced by the bursts did not vary considerably within one train and was also very similar between all consecutive trains. The electrophysiological recordings of the responses to the first burst are shown in red and the subsequent stimulus bursts (2–8 s) in blue. The BOLD response to each individual stimulation train is depicted as event-related average of all eight experiments. The gray box indicates the time window of the stimulus train.
The comparison of the BOLD responses both elicited by 80 stimuli but given continuously at 10 Hz or as bursts at 100 Hz revealed a frequency- or temporal pattern-dependent time course of the hemodynamic response in the dentate gyrus, i.e., a varying magnitude at 10 Hz and a stable magnitude at 100 Hz, as well as different effects on the baseline BOLD signal intensity.
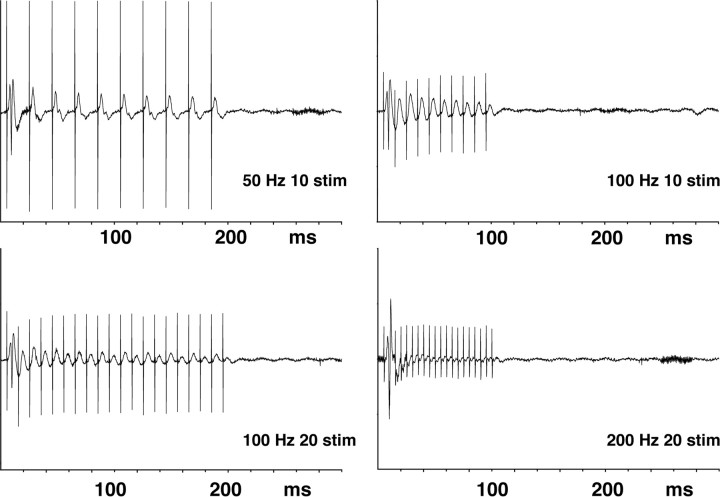
These differences occurred despite the same number of stimuli over time. Increasing the stimulation frequency also reduced the output from the dentate gyrus from 80 to 8 population spikes. This phenomenon, that with high frequency burst stimulation only one population spike was elicited at the beginning of each burst, offered a chance to keep the input in terms of the number of stimuli as well as the output constant. Subsequent experiments, therefore, aimed at varying the temporal structure of input stimulation while maintaining the output at eight population spikes across the 8 s stimulation period (Fig. 6).
Figure 6.
Examples of the measured electrophysiological responses after various high-frequency stimulation protocols. During all four stimulation conditions, only a single initial population spike was by the first stimulus pulse per burst, whereas all subsequent stimuli triggered field EPSPs. Consequently, the output activity was comparable in all four experiments leading to eight population spikes per stimulation train.
With this idea in mind, we first tested 50 Hz burst stimulation, i.e., 200 ms bursts including 10 stimuli every second. In this way, the total number of 80 stimuli per train was the same as in the 10 and 100 Hz burst stimulation paradigms. This also elicited eight population spikes per train at the beginning of each train. A positive BOLD response was also observed over the dentate gyrus already during the first stimulus train, and the response magnitude did not change during subsequent trains (see Fig. 8). In contrast, a small but significant reduction of the BOLD baseline signal intensity was observed which rather resembled the effect seen after continuous 10 Hz stimulation trains. Generally, the average magnitude of the BOLD response at 50 Hz was smaller compared with continuous 10 Hz stimulation but higher than the one obtained with bursts at 100 Hz (see Fig. 8).
Figure 8.
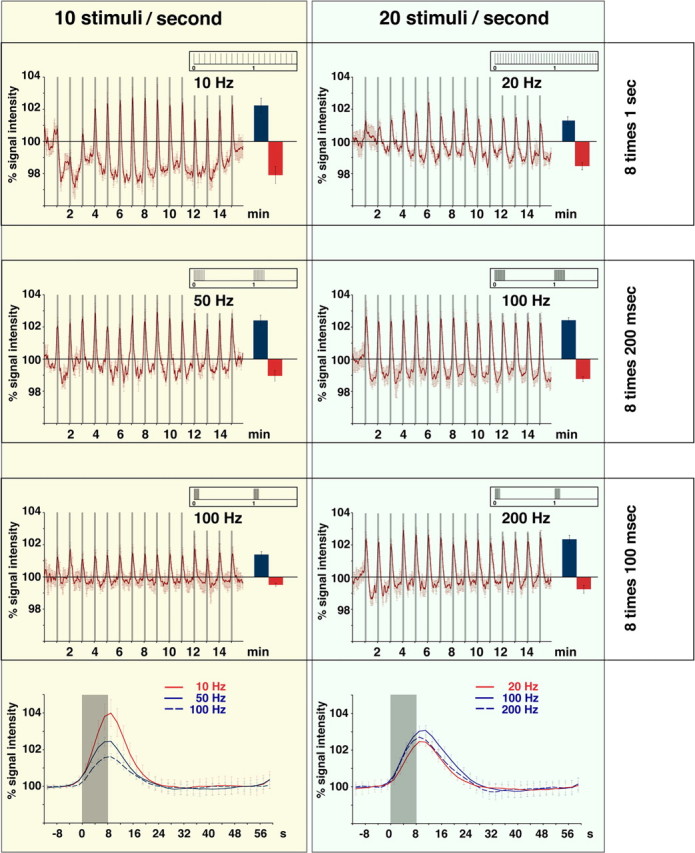
Summary of the generated BOLD responses in the dentate gyrus observed after different protocols of perforant pathway stimulation. In all experiments, the number of stimulus trains (15), the duration of one stimulus train (8 s), the intertrain interval (52 s), and the individual stimulus characteristics [square pulse (0.2 ms) with an intensity that evoked a population spike amplitude of 50% the maximal amplitude] were identical. Left, The stimulation covered always 80 stimuli per train corresponding to a number of 10 stimuli per second but with different frequencies and consequently different temporal pattern. The stimuli were delivered with increasing frequencies. The 10 Hz stimulation protocol (scheme of the stimulus pattern is shown in the insert) caused a clear BOLD response as well as an immediate decline of the baseline signal intensity in the dentate gyrus (blue column indicate the average positive BOLD response, the red column indicates the average decline of the baseline signal intensity between the stimulus trains). Burst stimulation of the perforant pathway with 50 Hz caused a stable BOLD response and a smaller decline in the basal signal intensity during the experiment. In contrast to 10 Hz stimulation, the magnitude of the BOLD response was stable during the experiment. Short bursts of 100 Hz also caused a stable BOLD response, however, with a smaller magnitude and without a decline of the baseline signal intensity. Comparing the averaged BOLD responses (calculated as event-related average) triggered by various frequencies revealed a frequency-dependent reduction in the magnitude. Note that strong decline in basal signal intensities during the 10 Hz stimulation condition caused the strongest BOLD response. Right, Stimulation of the perforant pathway with 160 stimuli per train corresponding to 20 stimuli per second as continuous or as burst stimulation (i.e., 100 or 200 Hz) caused comparable BOLD responses in the dentate gyrus. In contrast to the 10 Hz stimulation protocol, the 20 Hz stimulation protocol induced positive BOLD responses already during the first stimulus trains and a decline in the basal signal intensities developed gradually.
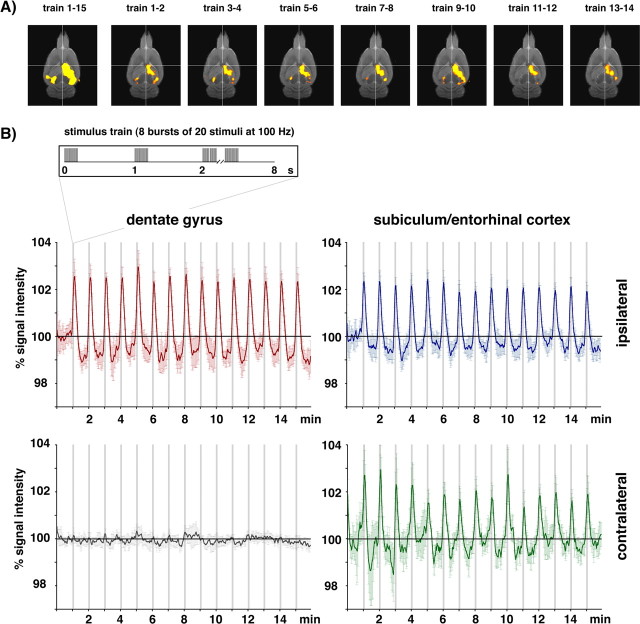
Subsequently, we lengthened the burst duration of the 100 Hz experiment to 200 ms. We kept the number of bursts constant to eight per train with one population spike at the beginning of each burst but increased the number of stimuli per 100 Hz bursts to 20, leading to a total number of 160 stimuli per train. Within the dentate gyrus a significant positive BOLD response appeared again during the first stimulation train (Fig. 7). Unlike the 100 Hz, 100 ms duration burst experiment a decline of the BOLD baseline signal intensity was observed after the first stimulus train together with an increased magnitude of the BOLD response (compared with Fig. 4). Under these conditions, a significant BOLD response was also seen in the contralateral subiculum/entorhinal cortex region that was not seen during the 100 Hz, 100 ms burst experiment (see Figs. 4, 7, 9). Thus, doubling the number of stimuli in 100 Hz bursts, by lengthening the bursts, increased the BOLD response and also led to a decline of the BOLD baseline signals.
Figure 7.
Development of the BOLD response during stimulation of the perforant pathway with repetitive trains with bursts of 20 stimuli at 100 Hz. A, Visualization of significant BOLD responses to individual stimulation trains revealed an almost identical pattern during the entire experiment. In contrast to the stimulus condition 10 stimuli at 100 Hz (Fig. 4), a significant BOLD response was also observed in the contralateral entorhinal cortex region. B, All individual BOLD responses triggered by each stimulation train were similar during the entire experiment (graphs represent the average BOLD response measured in 8 animals).
Figure 9.
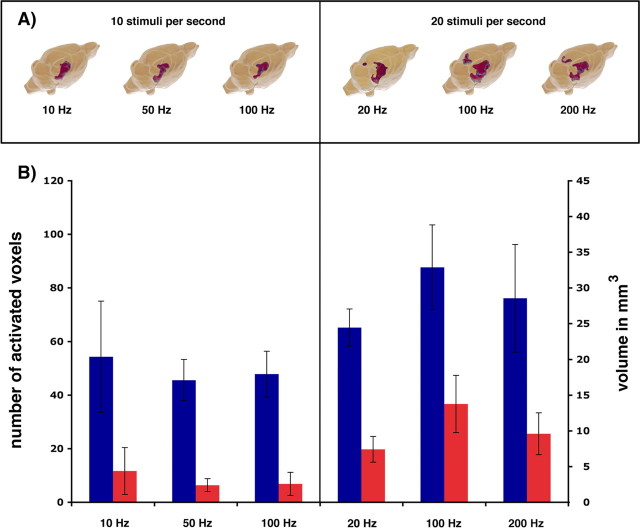
Visualization of brain regions that display significant BOLD responses during repetitive electrical stimulations of the perforant pathway. A, 3D reconstruction of all regions showing a significant BOLD response according to a general linear model [left side: 10 stimuli per second, at 10 Hz (n = 5), 50 Hz (n = 6), and 100 Hz (n = 8); right side: 20 stimuli per second at 20 Hz (n = 5), 100 Hz (n = 8), and 200 Hz (n = 7)]. B, The total volume of the activated regions during various stimulation conditions was calculated by counting all voxels showing a significant BOLD response (p < 10−9) (1 voxel equivalent to 0.39 mm3). The results represent averaged volumes (blue columns, right hippocampus and entorhinal cortex regions; red columns, left hippocampus and entorhinal cortex regions) measured in all individual experiments.
To address the question whether the differences between the two 100 Hz experiments were caused by the increased number of stimuli per burst (10 or 20) or the longer duration of the bursts (100 or 200 ms), we kept the burst duration at 100 ms but increased the number of stimuli per burst to 20 at a frequency of 200 Hz. This stimulation protocol generated a BOLD response magnitude similar to that seen after stimulation with 200 ms bursts at 100 Hz. Again, the positive BOLD response was considerably higher compared with the stimulation with bursts of 10 stimuli at 100 Hz. However, an effect on the baseline was only observed after the first stimulus train causing no clear shift of the baseline signal intensity (Fig. 8). Consequently, with the same electrophysiological output of the dentate gyrus of one population spike per burst, the magnitude of the BOLD response appeared to depend on the number of stimuli per burst, whereas the decline of the baseline BOLD signal appeared to depend on the duration of the individual stimulus burst rather than on the number of stimuli.
In summary, identical numbers of stimuli (i.e., 10 stimuli per second) presented in different pattern (i.e., continuous 10 Hz, or bursts of 50 or 100 Hz) triggered variable BOLD responses within the dentate gyrus (Fig. 8, left side) indicating already that a simple summation of the number of synchronized input volleys from the perforant pathway within a time window of one second cannot account for the magnitude of the BOLD response. Comparing the BOLD time series caused by these different stimulation pattern suggest a role of the burst duration for the development of the baseline signal intensity, i.e., the longer the burst duration the stronger the negative shift (Fig. 8, left and right columns). In contrast, the magnitude of the BOLD response was affected by the burst duration in a more complex way. Whereas at bursts of 10 stimuli, the magnitude of the BOLD response decreased with shorter burst durations (Fig. 8, left column), a similar effect was not seen when bursts of 20 stimuli were applied (Fig. 8, right column). Only during high-frequency burst stimulations, i.e., frequencies that elicited only one population spike per burst, an increased number of stimuli per burst caused a stronger BOLD response (i.e., bursts of 10 stimuli at 100 Hz vs bursts of 20 stimuli at 100 Hz or bursts of 20 stimuli at 200 Hz). In contrast, at low-frequency stimulation, doubling the number of stimuli per train (continuous 10 or 20 Hz for 8 s) did not increase the BOLD response. However, under these conditions, the number of elicited population spikes per second also differed; consequently, a straightforward conclusion on the role of input activity for the magnitude of the BOLD response cannot be drawn.
Variation of the stimulus parameters (number, burst duration) affected not only the magnitude of the BOLD response but also the overall volume of activated hippocampal regions (Fig. 9). The activated regions were similar when the same number of stimuli were presented even with different frequencies but increased when the number of stimuli was doubled.
Discussion
In this study, we used an approach that enabled us to adjust the input activity to the dentate gyrus and measure simultaneously the triggered BOLD response and output activity. By varying the input activity we found (1) identical numbers of stimuli presented in different temporal and frequency patterns caused different hemodynamic responses, (2) the BOLD response varied although the spiking activities of the granular cells were similar, (3) increasing the stimulus burst duration caused a decline in the baseline BOLD-signal intensity, (4) during high-frequency burst stimulation doubling the number of stimuli within an identical time increased the magnitude of the BOLD response, and (5) repetitive presentation of identical stimulation trains under specific conditions within one experiment could induce different BOLD responses. All these results indicate that the amplitude of the BOLD response in the dentate gyrus is not a direct function of the input activity to the principal neurons nor defined by the spiking or output activity of these cells but depends critically on the processing of the incoming signals, which is controlled by the entire activity of local circuits, i.e., granular cells and interneurons.
Repetitive identical stimulation of the perforant pathway can trigger time and region-specific variations in the BOLD response in the hippocampus
Afferent fibers within the perforant pathway project to a number of principal neurons in the entire hippocampus, i.e., the lateral and medial components of the perforant pathway terminate in the molecular layer of the dentate gyrus, in the stratum lacunosum-moleculare of CA3, and along the transverse axis of CA1 and in the subiculum (Amaral and Lavenex, 2007). Consequently, electrical activation of the perforant pathway can activate all hippocampal subregions directly. In addition, afferent activity not only affects local principal neurons but also invariably coactivates local inhibitory interneurons, such as MOPP (molecular layer perforant pathway-associated), HIPP (hilar perforant pathway-associated) and basket cells. These cells mediate an efficient feedforward inhibition of the granular cells. In addition, recurrent inputs from granule cell collaterals also activate HIPP and basket cells and by that trigger a feedback inhibition for the granular cells (Buhl and Whittington, 2007). This elaborate local interplay of principal and interneurons form a functional architecture, which impede any simple prediction, first whether at all and second, how signals are propagated through the hippocampus, especially during repetitive stimulus presentation. This nonstraightforward summation and propagation of signals during repetitive stimulation supported by local circuits may eventually be the prerequisite for the prominent learning-related plasticity of the hippocampus.
To measure under in vivo condition the elicited activities simultaneously in different hippocampal regions during defined stimulation of an afferent fiber system has remained a challenging task using conventional electrophysiological approaches or optical imaging methods. In contrast, fMRI allows a noninvasive visualization of neuronal activity in the entire hippocampus and even in conjunction with other brain structures and could become a valuable tool to study signal propagation through the hippocampus and the distributed correlates of learning.
In the first experiment, activation of the perforant pathway by repetitive 10 Hz stimulation trains caused clear time-dependent variations in the generated BOLD response within the dentate gyrus. Because the input parameters (intensity, duration, number of stimuli) were kept constant, the variation in the observed BOLD response is independent from the input activity. Because the BOLD response is only a surrogate marker of neuronal activity, the varying BOLD responses to repetitive stimuli could also be mediated by modifications of the underlying vascular-hemodynamic processes. We observed in three hippocampal regions completely different developments of BOLD responses over time; thus, any general effects, such as habituation and fatigue of the first activated neuron or variations in the neuro-vascular coupling as sole cause for the measured variations in BOLD responses, are unlikely. More likely, the measured BOLD response seems to reflect the entire activity of local neuronal circuits triggered by the stimulus trains. This would imply that late stimulation trains are processed differently than the first train. It is conceivable that early stimulus trains affect the local neuronal circuits in such a manner that subsequent stimulation train will be processed differently as seen, e.g., by population spike latency variance. This would require that changed activities and/or properties of the local neuronal circuits persist for at least 1 min, the interstimulus interval. Alternatively, altered efficacy of synaptic transmission triggered by the stimulation protocol might affect the amplitude of the BOLD response. How the efficacy of synaptic transmission affects the generation of a BOLD response is still an open question and has to be addressed in future studies. A striking difference in the event related BOLD responses to the first and late 10 Hz stimulation trains was (beside the magnitude of the immediate positive BOLD response) a delayed negative shift of the BOLD signal intensity after the first stimulation train (Fig. 3). So far, the exact cause for this shift is not clear, it could be the result of hemodynamic auto-regulatory mechanisms (Harel et al., 2002; Bressler et al., 2007; Pasley et al., 2007; Schridde et al., 2008) or the result of neuronal inhibition (Shmuel et al., 2006). In our experiment, the baseline shift was observed ∼20 s after stimulus presentation; consequently, it represents a component of the hemodynamic response that differs from the immediate positive component. The time course of this late negative component exceeded the interstimulus interval, thus lowering the baseline before the next stimulus (Fig. 2). One consequence of a varying response-pattern to identical stimulation trains is that in conventional fMRI experiments using repetitive stimuli/tasks the calculated areas showing BOLD response depend on the number of the given stimulus blocks and it may become mandatory to distinguish between activation pattern triggered by early and late stimulus blocks.
The role of input and output activity for the generation of BOLD responses in the dentate gyrus
Based on recent findings using combined electrophysiological and fMRI measurements, it is widely accepted that the BOLD response is more closely related to synaptic activity than to spiking activity (Logothetis et al., 2001; Viswanathan and Freeman, 2007). According to this, in our approach, the amount of input activity, which defines the synaptic activity of the granular cells, should be more closely related to the observed BOLD signal than the spiking activity of these cells.
Some of our results support this assumption. Thus, using 100 Hz stimulation bursts the increase of synaptic activity by doubling the number of stimuli within a burst increased clearly the BOLD response in the dentate gyrus (Fig. 8). Under these two stimulation conditions, the number and shape of the elicited population spikes were similar (Fig. 6). Consequently, the amount of synaptic activity appears to control the hemodynamic response in this region. However, comparable variations in the magnitude of the BOLD response can also occur when exactly the same amount of stimuli was presented in different pattern. Our results indicate that 10 stimuli per second presented at different frequencies caused already variations in the magnitude of the BOLD response (10 Hz >50 Hz >100 Hz) (Fig. 8). The observed variation of the BOLD response seems to depend on the duration of the individual bursts. A generalization of such an assumption is, however, not possible. Increasing the burst duration again from 100 to 200 ms and 1 s induced no clear alterations in the measured BOLD response when 20 stimuli per s were applied. It appears again those quantitative parameters of input activity (e.g., number, duration) do not control the magnitude of a BOLD response but rather qualitative features of stimulus presentation, i.e., the pattern.
Because neither quantitative input nor the output parameters alone define the magnitude of the BOLD response, we conclude that for the generation of a BOLD response the overall activity of local circuits is crucial, which in turn depends certainly more on the input activity.
The actual activity of the local network defines eventually how signals are propagated through a certain region. As mentioned above, variations in the BOLD response during repetitive 10 Hz stimulus trains were paralleled by different pattern of triggered population spikes. After the generated population spike pattern was stabilized the BOLD responses remained the same.
Based on our results, we assume that for generation of a BOLD response in a particular region the pattern of input activity is indeed crucial because it defines the quality/quantity of the local network activity, i.e., principal neurons and inhibitory interneurons. The overall change in local neuronal network activity, consequently, the sum of all participating inhibitory and excitatory neurons, defines thereupon the magnitude of the BOLD response. Because high-frequency spiking interneurons and low-frequency spiking principal neurons are part of these local circuits, a simple reduction to sole synaptic versus spiking activity as a cause for the BOLD response is hard to conceive. Within the dentate gyrus, it is impossible to predict the size of a BOLD response based on the amount of input activity or spiking activity of the principal neurons, i.e., the granular cells alone. Consequently, we assume that rather the input-dependent interplay of principal and inhibitory interneurons determine the BOLD response.
Footnotes
F.A. was supported by the Center of Advanced Imaging (Bundesministerium für Bildung und Forschung Grant 01G00202).
References
- Amaral D, Lavenex P. Hippocampal neuroanatomy. In: Andersen P, Morris R, Amaral D, Bliss T, O'Keefe J, editors. The Hippocampus book. Oxford: Oxford UP; 2007. pp. 37–114. [Google Scholar]
- Angenstein F, Kammerer E, Niessen HG, Frey JU, Scheich H, Frey S. Frequency-dependent activation pattern in the rat hippocampus, a simultaneous electrophysiological and fMRI study. Neuroimage. 2007;38:150–163. doi: 10.1016/j.neuroimage.2007.07.022. [DOI] [PubMed] [Google Scholar]
- Bressler D, Spotswood N, Whitney D. Negative BOLD fMRI response in the visual cortex carries precise stimulus-specific information. PLoS ONE. 2007;2:e410. doi: 10.1371/journal.pone.0000410. [DOI] [PMC free article] [PubMed] [Google Scholar]
- Buhl E, Whittington M. Local circuits. In: Andersen P, Morris R, Amaral D, Bliss T, O'Keefe J, editors. The hippocampus book. Oxford: Oxford UP; 2007. pp. 297–319. [Google Scholar]
- Harel N, Lee SP, Nagaoka T, Kim DS, Kim SG. Origin of negative blood oxygenation level-dependent fMRI signals. J Cereb Blood Flow Metab. 2002;22:908–917. doi: 10.1097/00004647-200208000-00002. [DOI] [PubMed] [Google Scholar]
- Heeger DJ, Ress D. What does fMRI tell us about neuronal activity? Nat Rev Neurosci. 2002;3:142–151. doi: 10.1038/nrn730. [DOI] [PubMed] [Google Scholar]
- Hennig J, Nauerth A, Friedburg H. RARE imaging: a fast imaging method for clinical MR. Magn Reson Med. 1986;3:823–833. doi: 10.1002/mrm.1910030602. [DOI] [PubMed] [Google Scholar]
- Kayser C, Kim M, Ugurbil K, Kim DS, König P. A comparison of hemodynamic and neural responses in cat visual cortex using complex stimuli. Cereb Cortex. 2004;14:881–891. doi: 10.1093/cercor/bhh047. [DOI] [PubMed] [Google Scholar]
- Logothetis NK, Pauls J, Augath M, Trinath T, Oeltermann A. Neurophysiological investigation of the basis of the fMRI signal. Nature. 2001;412:150–157. doi: 10.1038/35084005. [DOI] [PubMed] [Google Scholar]
- Mathiesen C, Caesar K, Akgören N, Lauritzen M. Modification of activity-dependent increases of cerebral blood flow by excitatory synaptic activity and spikes in rat cerebellar cortex. J Physiol. 1998;512:555–566. doi: 10.1111/j.1469-7793.1998.555be.x. [DOI] [PMC free article] [PubMed] [Google Scholar]
- Mukamel R, Gelbard H, Arieli A, Hasson U, Fried I, Malach R. Coupling between neuronal firing, field potentials, and FMRI in human auditory cortex. Science. 2005;309:951–954. doi: 10.1126/science.1110913. [DOI] [PubMed] [Google Scholar]
- Nir Y, Fisch L, Mukamel R, Gelbard-Sagiv H, Arieli A, Fried I, Malach R. Coupling between neuronal firing rate, gamma LFP, and BOLD fMRI is related to interneuronal correlations. Curr Biol. 2007;17:1275–1285. doi: 10.1016/j.cub.2007.06.066. [DOI] [PubMed] [Google Scholar]
- Pasley BN, Inglis BA, Freeman RD. Analysis of oxygen metabolism implies a neural origin for the negative BOLD response in human visual cortex. Neuroimage. 2007;36:269–276. doi: 10.1016/j.neuroimage.2006.09.015. [DOI] [PMC free article] [PubMed] [Google Scholar]
- Schridde U, Khubchandani M, Motelow JE, Sanganahalli BG, Hyder F, Blumenfeld H. Negative BOLD with large increases in neuronal activity. Cereb Cortex. 2008;18:1814–1827. doi: 10.1093/cercor/bhm208. [DOI] [PMC free article] [PubMed] [Google Scholar]
- Shmuel A, Augath M, Oeltermann A, Logothetis NK. Negative functional MRI response correlates with decreases in neuronal activity in monkey visual area V1. Nat Neurosci. 2006;9:569–577. doi: 10.1038/nn1675. [DOI] [PubMed] [Google Scholar]
- Viswanathan A, Freeman RD. Neurometabolic coupling in cerebral cortex reflects synaptic more than spiking activity. Nat Neurosci. 2007;10:1308–1312. doi: 10.1038/nn1977. [DOI] [PubMed] [Google Scholar]


