

Abstract
We investigated the key neurodevelopmental factors that determine cortical thickness, namely synaptogenesis and regression, by analyzing the thickness of the visual cortex in humans with early- and late-onset blindness. The bilateral visual cortices of the early blind were significantly thicker than those of the late blind and the sighted controls, but the latter two groups did not differ significantly. This suggests reduced “pruning” of synapses in the visual cortex, which may be due to a lack of visual experience during a critical developmental period. These findings support the hypothesis that sensory experience is necessary for an appropriate regression and remodeling of neuronal processes and that synaptic regression might be a major determinant of macroscopic anatomical features like cortical thickness.
Keywords: cortical thickness, blind, plasticity, visual deprivation, magnetic resonance imaging, development
Introduction
In the blind, the thickness of the visual cortex may be influenced by developmental factors, including synaptogenesis and regression, as well as by plasticity and possible transneuronal degeneration following optic nerve damage; however the relative roles of these factors have not been determined. Synaptic density in the visual cortex increases to a maximum during the first postnatal year and then gradually decreases to the adult level at ∼11 years of age (Huttenlocher and de Courten, 1987). Although the initial increase in synaptic density by synaptogenesis does not depend on visual experience (Winfield, 1981; Bourgeois and Rakic, 1996), the subsequent pruning of synapses has been shown to depend on visual input (Bourgeois et al., 1989). Thus the interruption of synaptic elimination by early visual deprivation may prevent the visual cortex from thinning. Plastic changes have been reported in the visual cortex in resting state (Liu et al., 2007) and imaginary, tactile, and auditory tasks (Noppeney, 2007; Cattaneo et al., 2008), and in the early sensory areas of spared modalities following visual deprivation in early life (Bavelier and Neville, 2002). Thus, plasticity may lead to changes in cortical thickness in the early blind. In addition, transneuronal degeneration occurs in some blind subjects with optic nerve atrophy and optic nerve hypoplasia and might result in visual cortex atrophy in these subjects (Kitajima et al., 1997). This could lead to a reduction in cortical thickness in the early blind.
Previous MRI studies of blindness reported decreased gray matter density (Noppeney et al., 2005; Pan et al., 2007; Ptito et al., 2008) and reduced anisotropy in the occipital lobe (Shimony et al., 2006; Shu et al., 2009); increased white matter density (Noppeney et al., 2005) in the sensory–motor system; and increased anisotropy in the corticospinal tract (Yu et al., 2007). These changes could be explained as resulting from neurodevelopment, plasticity, and/or degeneration. Methodologically, these studies focused on brain tissue volume and white matter integrity, but no study has been done on cortical thickness in the blind. We believe that cortical thickness, which measures distances between the gray/white matter surface and the pial surface (the surface between gray matter and CSF), is a good candidate measure for detecting cortical abnormalities. In previous neuroimaging investigations, cortical thickness has proven to be a sensitive measure of neurodevelopmental (Sowell et al., 2004; Shaw et al., 2006, 2007) and pathological (Sowell et al., 2008) changes and a reflection of the architecture of the cerebral column (Shaw et al., 2007). Cortical thickness is also a common measure in neuroanatomy (Von Economo, 1929; Krimer et al., 1997), which makes it convenient to compare neuroimaging with neuroanatomical findings. In this study, our aim was to determine the major factor(s) influencing cortical thickness in the blind by studying changes in the cortical thickness of the early- and late-blind subjects throughout the brain. Our study suggests that synaptic pruning might be a major factor in determining cortical thickness in the early blind.
Materials and Methods
Subjects.
Seventeen early blind (22.6 ± 4.0 years old; 9 males and 8 females; onset age <1 year old), 19 late blind (24.2 ± 5.0 years old; 12 males and 7 females; onset age >1 year old, range from 2 to 24 years old), and 29 sighted controls (22.6 ± 3.1 years old; 15 males and 14 females) were included in the study. A one-way ANOVA detected no significant differences in age among the three groups (F = 1.05, p = 0.36). In addition, a two-way χ2 test did not show significant gender differences among groups (χ2 = 0.66, p = 0.72). All subjects were right handed. The blind subjects were recruited from the Special Education College of Beijing Union University. The sighted controls were recruited by advertisements. All participants provided written consent before the MRI examinations following guidelines approved by the Medical Research Ethics Committee of Xuanwu Hospital of Capital Medical University. Characteristics of the early- and late-blind subjects are listed in Tables 1 and 2, respectively.
Table 1.
Demographics of early-blind subjects
| ID | Sex | Age(years) | Onset age(years) | Causes of blindness |
|---|---|---|---|---|
| 01 | Female | 22.8 | 0 | Retinitis pigmentosa |
| 02 | Male | 20.9 | 0 | Retinitis pigmentosa |
| 03 | Male | 24.6 | 0 | Optic nerve atrophy |
| 04 | Male | 19.1 | 0 | Retinitis pigmentosa |
| 05 | Male | 24.6 | 0 | Retinitis pigmentosa and optic nerve atrophy |
| 06 | Female | 23.6 | 0 | Optic nerve hypoplasia |
| 07 | Male | 22.4 | <1 | Congenital glaucoma |
| 08 | Male | 29.3 | <1 | Optic nerve hypoplasia |
| 09 | Male | 23.4 | 0 | Congenital glaucoma |
| 10 | Female | 26.6 | 0 | Optic nerve atrophy |
| 11 | Female | 15.6 | 0 | Optic nerve atrophy |
| 12 | Female | 21.7 | 0 | Congenital cataract |
| 13 | Female | 21.7 | 0 | Congenital glaucoma and cataract |
| 14 | Male | 18.7 | 0 | Optic nerve hypoplasia |
| 15 | Male | 20.8 | 0 | Optic nerve hypoplasia |
| 16 | Female | 18.0 | 0 | Optic nerve atrophy |
| 17 | Male | 31.7 | 0 | Congenital glaucoma |
Table 2.
Demographics of the late-blind subjects
| ID | Sex | Age (year) | Onset age (year) | Causes of blindness |
|---|---|---|---|---|
| 01 | Male | 21.7 | 7 | Glaucoma |
| 02 | Male | 18.4 | 7 | Optic nerve atrophy |
| 03 | Male | 24.6 | 8 | Optic nerve atrophy |
| 04 | Male | 20.9 | 8 | Glaucoma |
| 05 | Female | 20.3 | 7 | Optic nerve atrophy and fundus dysplasia |
| 06 | Male | 21.6 | 10 | Glaucoma |
| 07 | Male | 18.1 | 10 | Glaucoma |
| 08 | Female | 21.7 | 2 | Lens dysplasia |
| 09 | Male | 29.4 | 10 | Retinal detachment |
| 10 | Male | 22.3 | 16 | Retinitis pigmentosa and cataract |
| 11 | Female | 23.0 | 18 | Cataract |
| 12 | Female | 19.6 | 14 | Optic nerve atrophy and fundus hemorrhage |
| 13 | Female | 28.7 | 24 | Optic nerve atrophy |
| 14 | Male | 30.8 | 14 | Glaucoma and retinal detachment |
| 15 | Female | 27.4 | 12 | Glaucoma |
| 16 | Female | 26.4 | 15 | Keratitis |
| 17 | Male | 35.4 | 18 | Retinal detachment |
| 18 | Male | 31.0 | 14 | Glaucoma and optic nerve atrophy |
| 19 | Male | 18.7 | 14 | Optic nerve atrophy |
Data processing.
Each scan was processed using FreeSurfer (Dale et al., 1999) (http://surfer.nmr.mgh.harvard.edu/) with its volume and surface pipeline. Starting from the segmentation of white matter and the tessellation of the gray/white matter boundary, an initial surface was obtained after automated topological correction. This surface was used as the initial shape for the deformable model that was used to reconstruct the pial surface. Both surfaces were represented by points and triangles composed of the points. Please note that the points at the gray/white matter surface had a one-to-one correspondence with the points at the pial surface.
Cortical thickness measurement.
When all the surfaces had been reconstructed, the cortical thickness was computed. The thickness was measured in the native space of each subject (Fischl and Dale, 2000). Thickness was defined at each point on the pial surface (as well as its counterpart on the gray/white matter surface because of the one-to-one correspondence) as the mean of the two shortest distances; one was from the point on the pial surface to the gray/white surface, and the other was from the point on the gray/white matter surface to the pial surface. To compare cortical thickness point by point and visualize the statistical results, the establishment of point correspondence across subjects in a standard surface-based coordinate system was required. Surface-based registration (Fischl et al., 1999) was used to build an average template and all the individual reconstructed cortical surfaces were aligned to it. The cortical thickness measurements at the interconnection between the two hemispheres were masked because there is very little gray matter there. Finally, we smoothed the thickness using a heat kernel (Chung et al., 2005) of a suggested 30 mm width (Lerch and Evans, 2005) to increase the signal-to-noise ratio and improve the ability to detect morphometric variations.
Locating the regions of differences and cortical area measurement.
Since there is a one-to-one correspondence between points on the pial surface and points on the gray/white matter surface, we labeled the regions of differences (RODs) at the visual cortex on the gray/white matter surface and pial surface by marking points that have statistically significant cortical thickness differences. Then we mapped the RODs on the gray/white matter surface to the native space of each subject, and estimated the area of the RODs in the native spaces. The area of a ROD of a subject was approximated by
 |
where AROD is the area of the ROD, T is the number of triangles on the surface, ni is the number of points belonging to an ROD in the ith triangle, and Ai is the area of the ith triangle.
Statistical analysis.
Since there were three groups, we enumerated all three combinations of groups (specifically, the early blind minus sighted controls, late blind minus sighted controls, and the early blind minus late blind) and tested the differences in cortical thickness for each combination. To investigate the effect of transneuronal degeneration in the early blind, we compared cortical thickness between the early-blind subjects with optic nerve damage (optic nerve atrophy or optic nerve hypoplasia, 9 subjects) and those without optic nerve damage (8 subjects). Statistical analysis of cortical thickness was performed at every vertex across all subjects on the average template. Unpaired two sided two-sample t tests were used to test for statistically significant differences in cortical thickness at the homologous points. For the first two combinations, we adjusted the ensuing p values for multiple comparisons on the cortical surface to control false positive rates using random field theory (Worsley et al., 1992); for the last combination, we set the p value threshold to 0.001 uncorrected. We also screened clusters that contained <150 points to remove possible influences of noise. An ANOVA was used to test the differences among cortical areas and the average cortical thickness of the RODs. One-sided two-sample t tests were used to test for cortical area and average cortical thickness variances between groups.
Results
Validation of cortical thickness measurements
To ensure the validity of our estimates of cortical thickness, we compared the mean cortical thickness of the sighted controls with postmortem studies and checked the SDs of the cortical thickness measurement. The means and SDs of the cortical thickness of the sighted controls are displayed in Figure 1. The following points support the accuracy of our method: (1) our measurements corresponded very well with a classical postmortem study of cortical thickness (Von Economo, 1929); for example, the range of the measured cortical thickness was between 1.5 and 4 mm, the occipital cortex was the thinnest part of the brain (∼2 mm), and the temporal pole was the thickest part (∼4 mm); (2) the thickness of the entorhinal cortex showed a decreasing trend from the anterior to the posterior, as was also found in a postmortem study (Krimer et al., 1997); (3) in most of the brain areas, the SDs in cortical thickness were <0.2 mm, which suggests that the statistical differences were unlikely to have been caused by outliers; and (4) this method for estimating cortical thickness was carefully validated by the original developers (Fischl and Dale, 2000). Similarly, we provided a visualization of the means and SDs of the early and late blind in supplemental Figures 1 and 2 (available at www.jneurosci.org as supplemental material), respectively.
Figure 1.
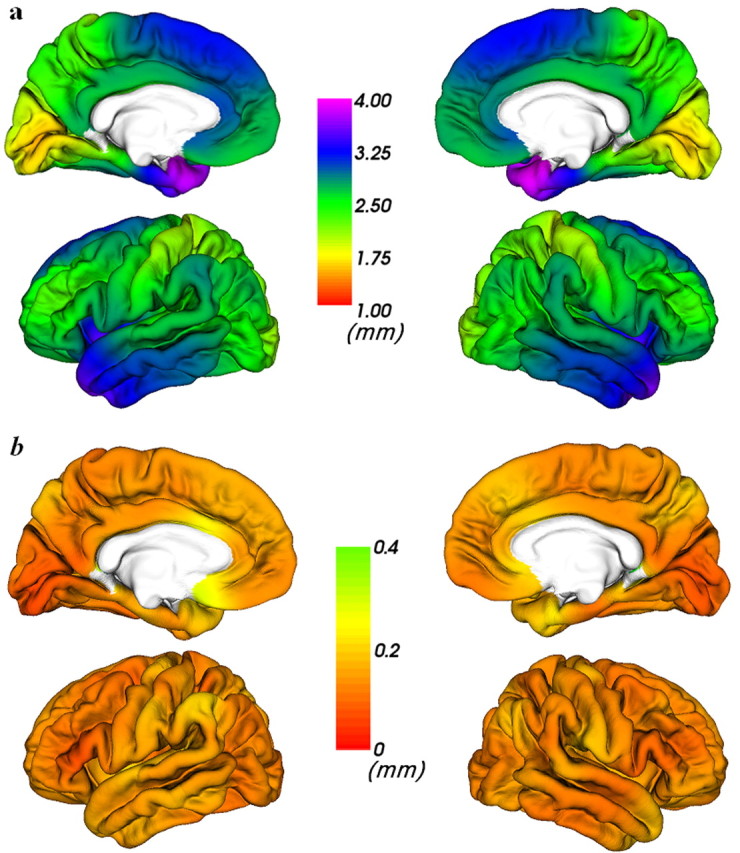
Visualization of mean (a) and SD (b) of cortical thickness measurements of sighted controls.
Differences in cortical thickness
We tested the differences in cortical thickness among the early blind, the late blind, and the sighted controls (Fig. 2). The t-statistics maps and difference maps of mean thickness are available in supplemental Figures 3 and 4 (available at www.jneurosci.org as supplemental material), respectively. The most remarkable finding was that the early blind had a thicker cortex at the bilateral primary visual cortex and left visual association cortex than the sighted controls (p < 0.05 corrected). The brain areas with thickness differences matched well with previous voxel-based morphometry studies of the early blind (Noppeney et al., 2005; Pan et al., 2007; Ptito et al., 2008). Moreover, the early blind had a thicker visual cortex than the late blind at an uncorrected p value threshold of 0.001. However, there was no significant difference in the cortical thickness within the occipital lobe between the late blind and the sighted controls even when the threshold of the p value was set at 0.05 uncorrected (supplemental Fig. 5, available at www.jneurosci.org as supplemental material). In addition, compared with the sighted controls, we found a thinner area in the left temporal lobe in both the early and the late blind (p < 0.05 corrected) (Fig. 2). To investigate the possible effect of transneuronal degeneration, we tested cortical thickness differences of early-blind subjects with optic nerve damage separately from other early-blind subjects. The result did not show any significant differences in cortical thickness between the two populations (p < 0.05 uncorrected) (supplemental Fig. 6, available at www.jneurosci.org as supplemental material). The differences in average cortical thickness of all the 5 RODs were also tested and observed (Fig. 3). A one-sided two-sample t test revealed that the mean cortical thickness of the early blind was higher than those of the late blind and sighted controls in the left primary visual cortex (t = 3.56, p = 0.00056 and t = 5.42, p = 0.0000012), left association visual cortex (t = 3.80, p = 0.00029 and t = 4.91, p = 0.0000061), and right primary visual cortex (t = 3.68, p = 0.00041 and t = 5.33, p = 0.0000016), respectively. Also, the late blind displayed a thinner left fusiform gyrus (t = −2.58, p = 0.0057 and t = −5.35, p = 0.0000014) than the early blind and sighted controls, respectively. Finally, the early blind and the late blind exhibited atrophy in left entorhinal cortex (t = −5.11, p = 0.0000033 and t = −3.80, p = 0.00021, respectively), compared with the sighted controls. No other significant differences were found.
Figure 2.

Cortical difference maps. Statistically significant differences are displayed in the medial view of the left hemisphere and right hemisphere (upper and lower rows, respectively). The three columns (left to right) are cortical thickness differences of the early blind minus sighted controls (p < 0.05, corrected), the late blind minus sighted controls (p < 0.05, corrected), and the early blind minus the late blind (p < 0.001, uncorrected), respectively. The color bar represents thickness (in millimeters) increases (in red) or decreases (in blue).
Figure 3.

Distribution of average cortical thickness (in mm) of the RODs. The distributions are represented using notched plot boxes, and the outliers are marked using asterisks. EB, Early blind; LB, late blind; SC, sighted controls.
Differences in the surface area of RODs
Cortical volume can be approximated as the product of cortical thickness and cortical surface area. To compare our findings with previous studies, we also tested differences in the cortical surface area of the three RODs located in the occipital lobe among the three groups using ANOVA. Specifically, we tested the sum of the cortical surface area of the two RODs in the left hemisphere and the area of the ROD in the right hemisphere separately. We found significant differences in the surface areas of the studied RODs among the three groups (F = 13.84, p = 0.000011 for left hemisphere; F = 16.76, p = 0.0000015 for right hemisphere) (Fig. 4). We further used a one-sided two-sample t test to investigate between-group differences in the cortical surface area. Compared with the sighted controls, the early blind showed significantly decreased surface areas in the RODs (left hemisphere: t = −3.69, p = 0.0003; right hemisphere: t = −4.75, p = 0.000011); the late blind also showed area reductions in both hemispheres (left hemisphere: t = −4.21, p = 0.000059; right hemisphere: t = −4.07, p = 0.000093). No significant area changes were observed between the early and the late blind in either hemisphere.
Figure 4.

One-way ANOVA of the areas of RODs located at the occipital cortex of the gray/white matter surface in the left hemisphere (a) and right hemisphere (b). The distributions are represented using notched plot boxes, and the outliers are marked using plus signs.
Discussion
Studying blindness at different onset ages has allowed researchers to investigate how unimodal sensory deprivation affects the associated sensory system of the human brain. We suggest neurodevelopment, plasticity, and transneuronal degeneration as potential explanations for differences in cortical thickness of the early blind compared with normal or late-blind people. If neurodevelopmental changes dominate, the visual cortex of the early blind would be expected to be either thinner (if synaptogenesis is interrupted) or thicker (if synaptic pruning is interrupted) than those of the late blind and of sighted subjects. The finding of a thicker visual cortex in the early blind supports the hypothesis that synaptic pruning is a major factor influencing cortical thickness. By 7 months gestation almost all of the neurons that are destined to comprise the mature cortex have been formed (Goswami, 2004). Brain development following birth consists of the growth of axons, synapses, and dendrites, triggered by synaptogenesis. The synaptic density of the visual cortex reaches a maximum of ∼150% of adult levels between 4 and 12 months through synaptogenesis, and then gradually decreases to adult levels by ∼5 years of age through “synaptic revision,” “regression,” or “pruning” (Johnson, 1997). Although the absence of retinal input does not affect the schedule and magnitude of synaptogenesis (Winfield, 1981; Bourgeois and Rakic, 1996), the synaptic revision in the visual cortex has been shown to depend on visual experience (Stryker and Harris, 1986; Bourgeois et al., 1989). This process of synaptic regression appears to be interrupted by early visual deprivation. Thus the synaptic density of visual cortex in early-blind subjects remains higher, which results in a thicker visual cortex. This speculation is consistent with two PET studies (Wanet-Defalque et al., 1988; Veraart et al., 1990) in which the researchers showed greater cerebral blood flow and a higher rate of glucose metabolism in the visual cortex of the early blind and attributed the findings to a lack of synaptic revision during visual development.
Early blindness results in abnormally increased corticocortical and thalamocortical connections (Berman, 1991; Kingsbury et al., 2002; Karlen et al., 2006), which is believed as the result of exuberant projections that fail to get pruned due to early visual deprivation (Karlen et al., 2006). These increased connections might result in a thicker visual cortex in early blindness. Specifically, layer I is nearly aneuronal, composed predominantly of dendritic and axonal connections. The increased thickness of layer I has been reported in early retina removed cats (Berman, 1991). The thickness of layers II–III might significantly increased since bilateral or unilateral enucleation at birth induced an increase of neuronal density in layers II–III (Heumann and Rabinowicz, 1982), and visual thalamus ablated hamsters displayed a significant increase in the number of corticocortical connections, most of which originated from pyramidal cells of layers II–III (Kingsbury et al., 2002). The increased corticocortical connections also originated from layers V (Kingsbury et al., 2002), and the callosal cell numbers in the infragranular layers (V and VI) of the early enucleated cats were approximately twice as that in sighted adult cats (Berman, 1991). Moreover, bilateral enucleation induced an increase of neuronal density in all cortical layers of areas 17 (Heumann and Rabinowicz, 1982). Given these results, we speculate that the thickness of layers V and VI of the visual cortex might also increased in the early blind. However, the layer IV of the primary visual cortex, the main target layer of the geniculostriate projections in sighted subjects, might become thinner in the early blind, due to transneuronal degeneration. This speculation is supported by the findings of apparent absence of small, nonpyramidal cells of layer IV (Windrem and Finlay, 1991), significant diminution of the number of spines in the apical dendrites of layer V pyramidal cells located in layer IV (Valverde, 1968), and significantly decreased surface density of astrocytic processes in lamina IV (Hawrylak and Greenough, 1995) in early visual deprivation. Moreover, lack of increased corticocortical connections (Kingsbury et al., 2002) and less increased neuronal density (Heumann and Rabinowicz, 1982) in layer IV also partly support that the layer IV of visual cortex is more likely to become thinner in early blindness. However, our findings of thicker visual cortex and lack of significant differences between optic nerve damaged and undamaged groups do not support transneuronal degeneration as a major factor to determine the total thickness of visual cortex.
If plasticity is the key factor influencing cortical thickness, it might lead to changes in cortical thickness in brain regions that have plastic changes. In the early blind, plasticity occurs not only in the auditory, somatosensory, and association cortices, but also in the visual cortex (Bavelier and Neville, 2002). In addition, volume increases in the white matter associated with the sensory and motor cortices in the early blind might be explained by plasticity (Noppeney et al., 2005). Thus if plasticity were to alter cortical thickness in the early blind, the changes in cortical thickness caused by plasticity would be detected in the primary sensory cortex of both the visual and spared modalities. In our results, we also find an increase in volume in the white matter associated with the sensory and motor cortices (supplemental Fig. 7, available at www.jneurosci.org as supplemental material), but we did not detect any cortical thickness change in the primary sensory cortices of the spared modalities in the early blind. This absence of change was supported by a lack of significant change in the gray matter volume in these brain regions. Therefore gray matter changes caused by plasticity may not be detected by measuring cortical thickness or volume. Additionally, previous functional neuroimaging studies of the early blind revealed that the occipital lobe participated in processing information from spared modalities (Büchel et al., 1998a,b; Weeks et al., 2000; Sadato et al., 2002; Burton, 2003; Noppeney et al., 2003; Noppeney, 2007). These studies reported less activation in the primary visual cortex than in the visual association cortex. So if plasticity leads to alteration in visual cortical thickness in the early blind, the visual association cortex would be more affected than the primary visual cortex in the early blind. However, our results showed that cortical changes were mainly limited to the primary visual cortex in the early blind. Hence our findings do not support plasticity as the major factor influencing cortical thickness in the visual cortex of the early blind. Nevertheless, we should note that in this study, it is difficult to isolate the effect of plasticity from those of neurodevelopment and transneuronal degeneration. Thus our results do not support plasticity as a major factor, but we cannot completely rule out the role of plasticity on cortical thickness. Further studies are needed to reach a definite conclusion.
Accompanying the increased cortical thickness, we also found decreased cortical surface area in the 3 RODs located in the occipital cortex in the early and late blind compared with the sighted controls. A decrease in cortical surface area of the Brodmann area (BA) 17 was also found in congenitally blind monkeys (Rakic, 1988; Dehay et al., 1989). Because cortical volume can be approximated by multiplying cortical thickness by cortical surface area, the results may explain why increases in the thickness of the visual cortex of the early blind can coexist with decreases in GM volume (Noppeney et al., 2005; Ptito et al., 2008) (also found in our dataset) (see supplemental Fig. 7, available at www.jneurosci.org as supplemental material) or with preserved gray matter volume (Büchel et al., 1998b; Shimony et al., 2006). Noppeney et al. (2005) attributed gray matter loss in the primary visual cortex of the early blind to disuse atrophy. This is supported by our results showing volume atrophy of the primary visual cortex in the early, the late, and the very late blind. If disuse atrophy is a key factor for determining cortical thickness, the primary visual cortex should become thinner. Thus our finding of a thicker visual cortex in the early blind cannot be explained by disuse atrophy. This indirectly supports our speculation that reduced synaptic pruning could be a key factor causing a thicker visual cortex in the early blind. Finally, we note that factors like neurodevelopment, plasticity, degeneration, and disuse atrophy may cause various changes to neurons, axons, synapses, and dendrites. These factors may behave differently in determining measures such as volume, cortical thickness, and area. Thus these measures may change in even opposite directions under the interactions of these factors.
To our knowledge, this is the first study to address the major factors, namely neurodevelopment, plasticity, and degeneration, that influence cortical thickness in blind subjects. A thicker visual cortex in the early blind may be the result of reduced synaptic revision, secondary to early visual deprivation. Our results support synaptic pruning as a major factor influencing cortical thickness in the visual cortex. In short, when visual deprivation happens during a critical period in the neurodevelopment of the visual cortex, it interrupts the process of synaptic pruning, thus allowing for a thicker visual cortex.
Footnotes
This work was supported by Natural Science Foundation of China Grants 30425004, 30870694, and 30730035, National Key Basic Research and Development Program (973) Grant 2004CB318107, and Program for New Century Excellent Talents in University Grant NCET-07-0568. We appreciate the English language assistance of Drs. Rhoda and Edmund Perozzi. We thank Prof. Karl Friston (Wellcome Trust Centre for Neuroimaging, UCL, London, UK), Prof. Brigitte Röder (Department of Psychology, University of Hamburg, Hamburg, Germany), Dr. Yong He (State Key Laboratory of Cognitive Neuroscience and Learning, Beijing Normal University, Beijing, China), and Prof. Synnöve Carlson (Low Temperature Laboratory, Helsinki University of Technology, Helsinki, Finland) for their valuable comments and careful revision of this manuscript.
References
- Bavelier D, Neville HJ. Cross-modal plasticity: where and how? Nat Rev Neurosci. 2002;3:443–452. doi: 10.1038/nrn848. [DOI] [PubMed] [Google Scholar]
- Berman NE. Alterations of visual cortical connections in cats following early removal of retinal input. Brain Res Dev Brain Res. 1991;63:163–180. doi: 10.1016/0165-3806(91)90076-u. [DOI] [PubMed] [Google Scholar]
- Bourgeois JP, Rakic P. Synaptogenesis in the occipital cortex of macaque monkey devoid of retinal input from early embryonic stages. Eur J Neurosci. 1996;8:942–950. doi: 10.1111/j.1460-9568.1996.tb01581.x. [DOI] [PubMed] [Google Scholar]
- Bourgeois JP, Jastreboff PJ, Rakic P. Synaptogenesis in visual cortex of normal and preterm monkeys: evidence for intrinsic regulation of synaptic overproduction. Proc Natl Acad Sci U S A. 1989;86:4297–4301. doi: 10.1073/pnas.86.11.4297. [DOI] [PMC free article] [PubMed] [Google Scholar]
- Büchel C, Price C, Friston K. A multimodal language region in the ventral visual pathway. Nature. 1998a;394:274–277. doi: 10.1038/28389. [DOI] [PubMed] [Google Scholar]
- Büchel C, Price C, Frackowiak RS, Friston K. Different activation patterns in the visual cortex of late and congenitally blind subjects. Brain. 1998b;121:409–419. doi: 10.1093/brain/121.3.409. [DOI] [PubMed] [Google Scholar]
- Burton H. Visual cortex activity in early and late blind people. J Neurosci. 2003;23:4005–4011. doi: 10.1523/JNEUROSCI.23-10-04005.2003. [DOI] [PMC free article] [PubMed] [Google Scholar]
- Cattaneo Z, Vecchi T, Cornoldi C, Mammarella I, Bonino D, Ricciardi E, Pietrini P. Imagery and spatial processes in blindness and visual impairment. Neurosci Biobehav Rev. 2008;32:1346–1360. doi: 10.1016/j.neubiorev.2008.05.002. [DOI] [PubMed] [Google Scholar]
- Chung MK, Robbins SM, Dalton KM, Davidson RJ, Alexander AL, Evans AC. Cortical thickness analysis in autism with heat kernel smoothing. Neuroimage. 2005;25:1256–1265. doi: 10.1016/j.neuroimage.2004.12.052. [DOI] [PubMed] [Google Scholar]
- Dale AM, Fischl B, Sereno MI. Cortical surface-based analysis. I. Segmentation and surface reconstruction. Neuroimage. 1999;9:179–194. doi: 10.1006/nimg.1998.0395. [DOI] [PubMed] [Google Scholar]
- Dehay C, Horsburgh G, Berland M, Killackey H, Kennedy H. Maturation and connectivity of the visual cortex in monkey is altered by prenatal removal of retinal input. Nature. 1989;337:265–267. doi: 10.1038/337265a0. [DOI] [PubMed] [Google Scholar]
- Fischl B, Dale AM. Measuring the thickness of the human cerebral cortex from magnetic resonance images. Proc Natl Acad Sci U S A. 2000;97:11050–11055. doi: 10.1073/pnas.200033797. [DOI] [PMC free article] [PubMed] [Google Scholar]
- Fischl B, Sereno MI, Tootell RB, Dale AM. High-resolution intersubject averaging and a coordinate system for the cortical surface. Hum Brain Mapp. 1999;8:272–284. doi: 10.1002/(SICI)1097-0193(1999)8:4<272::AID-HBM10>3.0.CO;2-4. [DOI] [PMC free article] [PubMed] [Google Scholar]
- Goswami U. Neuroscience and education. Br J Educ Psychol. 2004;74:1–14. doi: 10.1348/000709904322848798. [DOI] [PubMed] [Google Scholar]
- Hawrylak N, Greenough WT. Monocular deprivation alters the morphology of glial fibrillary acidic protein-immunoreactive astrocytes in the rat visual cortex. Brain Res. 1995;683:187–199. doi: 10.1016/0006-8993(95)00374-y. [DOI] [PubMed] [Google Scholar]
- Heumann D, Rabinowicz T. Postnatal development of the visual cortex of the mouse after enucleation at birth. Exp Brain Res. 1982;46:99–106. doi: 10.1007/BF00238103. [DOI] [PubMed] [Google Scholar]
- Huttenlocher PR, de Courten C. The development of synapses in striate cortex of man. Hum Neurobiol. 1987;6:1–9. [PubMed] [Google Scholar]
- Johnson M. Developmental cognitive neuroscience. Cambridge, MA: Blackwell; 1997. [Google Scholar]
- Karlen SJ, Kahn DM, Krubitzer L. Early blindness results in abnormal corticocortical and thalamocortical connections. Neuroscience. 2006;142:843–858. doi: 10.1016/j.neuroscience.2006.06.055. [DOI] [PubMed] [Google Scholar]
- Kingsbury MA, Lettman NA, Finlay BL. Reduction of early thalamic input alters adult corticocortical connectivity. Brain Res Dev Brain Res. 2002;138:35–43. doi: 10.1016/s0165-3806(02)00456-x. [DOI] [PubMed] [Google Scholar]
- Kitajima M, Korogi Y, Hirai T, Hamatake S, Ikushima I, Sugahara T, Shigematsu Y, Takahashi M, Mukuno K. MR changes in the calcarine area resulting from retinal degeneration. AJNR Am J Neuroradiol. 1997;18:1291–1295. [PMC free article] [PubMed] [Google Scholar]
- Krimer LS, Hyde TM, Herman MM, Saunders RC. The entorhinal cortex: an examination of cyto- and myeloarchitectonic organization in humans. Cereb Cortex. 1997;7:722–731. doi: 10.1093/cercor/7.8.722. [DOI] [PubMed] [Google Scholar]
- Lerch JP, Evans AC. Cortical thickness analysis examined through power analysis and a population simulation. Neuroimage. 2005;24:163–173. doi: 10.1016/j.neuroimage.2004.07.045. [DOI] [PubMed] [Google Scholar]
- Liu Y, Yu C, Liang M, Li J, Tian L, Zhou Y, Qin W, Li K, Jiang T. Whole brain functional connectivity in the early blind. Brain. 2007;130:2085–2096. doi: 10.1093/brain/awm121. [DOI] [PubMed] [Google Scholar]
- Noppeney U. The effects of visual deprivation on functional and structural organization of the human brain. Neurosci Biobehav Rev. 2007;31:1169–1180. doi: 10.1016/j.neubiorev.2007.04.012. [DOI] [PubMed] [Google Scholar]
- Noppeney U, Friston KJ, Price CJ. Effects of visual deprivation on the organization of the semantic system. Brain. 2003;126:1620–1627. doi: 10.1093/brain/awg152. [DOI] [PubMed] [Google Scholar]
- Noppeney U, Friston KJ, Ashburner J, Frackowiak R, Price CJ. Early visual deprivation induces structural plasticity in gray and white matter. Curr Biol. 2005;15:R488–R490. doi: 10.1016/j.cub.2005.06.053. [DOI] [PubMed] [Google Scholar]
- Pan WJ, Wu G, Li CX, Lin F, Sun J, Lei H. Progressive atrophy in the optic pathway and visual cortex of early blind Chinese adults: a voxel-based morphometry magnetic resonance imaging study. Neuroimage. 2007;37:212–220. doi: 10.1016/j.neuroimage.2007.05.014. [DOI] [PubMed] [Google Scholar]
- Ptito M, Schneider FC, Paulson OB, Kupers R. Alterations of the visual pathways in congenital blindness. Exp Brain Res. 2008;187:41–49. doi: 10.1007/s00221-008-1273-4. [DOI] [PubMed] [Google Scholar]
- Rakic P. Specification of cerebral cortical areas. Science. 1988;241:170–176. doi: 10.1126/science.3291116. [DOI] [PubMed] [Google Scholar]
- Sadato N, Okada T, Honda M, Yonekura Y. Critical period for cross-modal plasticity in blind humans: a functional MRI study. Neuroimage. 2002;16:389–400. doi: 10.1006/nimg.2002.1111. [DOI] [PubMed] [Google Scholar]
- Shaw P, Greenstein D, Lerch J, Clasen L, Lenroot R, Gogtay N, Evans A, Rapoport J, Giedd J. Intellectual ability and cortical development in children and adolescents. Nature. 2006;440:676–679. doi: 10.1038/nature04513. [DOI] [PubMed] [Google Scholar]
- Shaw P, Eckstrand K, Sharp W, Blumenthal J, Lerch JP, Greenstein D, Clasen L, Evans A, Giedd J, Rapoport JL. Attention-deficit/hyperactivity disorder is characterized by a delay in cortical maturation. Proc Natl Acad Sci U S A. 2007;104:19649–19654. doi: 10.1073/pnas.0707741104. [DOI] [PMC free article] [PubMed] [Google Scholar]
- Shimony JS, Burton H, Epstein AA, McLaren DG, Sun SW, Snyder AZ. Diffusion tensor imaging reveals white matter reorganization in early blind humans. Cereb Cortex. 2006;16:1653–1661. doi: 10.1093/cercor/bhj102. [DOI] [PMC free article] [PubMed] [Google Scholar]
- Shu N, Li J, Li K, Yu C, Jiang T. Abnormal diffusion of cerebral white matter in early blindness. Hum Brain Mapp. 2009;30:220–227. doi: 10.1002/hbm.20507. [DOI] [PMC free article] [PubMed] [Google Scholar]
- Sowell ER, Thompson PM, Leonard CM, Welcome SE, Kan E, Toga AW. Longitudinal mapping of cortical thickness and brain growth in normal children. J Neurosci. 2004;24:8223–8231. doi: 10.1523/JNEUROSCI.1798-04.2004. [DOI] [PMC free article] [PubMed] [Google Scholar]
- Sowell ER, Kan E, Yoshii J, Thompson PM, Bansal R, Xu D, Toga AW, Peterson BS. Thinning of sensorimotor cortices in children with Tourette syndrome. Nat Neurosci. 2008;11:637–639. doi: 10.1038/nn.2121. [DOI] [PMC free article] [PubMed] [Google Scholar]
- Stryker MP, Harris WA. Binocular impulse blockade prevents the formation of ocular dominance columns in cat visual cortex. J Neurosci. 1986;6:2117–2133. doi: 10.1523/JNEUROSCI.06-08-02117.1986. [DOI] [PMC free article] [PubMed] [Google Scholar]
- Valverde F. Structural changes in the area striata of the mouse after enucleation. Exp Brain Res. 1968;5:274–292. doi: 10.1007/BF00235903. [DOI] [PubMed] [Google Scholar]
- Veraart C, De Volder AG, Wanet-Defalque MC, Bol A, Michel C, Goffinet AM. Glucose utilization in human visual cortex is abnormally elevated in blindness of early onset but decreased in blindness of late onset. Brain Res. 1990;510:115–121. doi: 10.1016/0006-8993(90)90735-t. [DOI] [PubMed] [Google Scholar]
- Von Economo C. The cytoarchitectonics of the human cerebral cortex. London: Oxford Medical Publications; 1929. [Google Scholar]
- Wanet-Defalque MC, Veraart C, De Volder A, Metz R, Michel C, Dooms G, Goffinet A. High metabolic activity in the visual cortex of early blind human subjects. Brain Res. 1988;446:369–373. doi: 10.1016/0006-8993(88)90896-7. [DOI] [PubMed] [Google Scholar]
- Weeks R, Horwitz B, Aziz-Sultan A, Tian B, Wessinger CM, Cohen LG, Hallett M, Rauschecker JP. A positron emission tomographic study of auditory localization in the congenitally blind. J Neurosci. 2000;20:2664–2672. doi: 10.1523/JNEUROSCI.20-07-02664.2000. [DOI] [PMC free article] [PubMed] [Google Scholar]
- Windrem MS, Finlay BL. Thalamic ablations and neocortical development: alterations of cortical cytoarchitecture and cell number. Cereb Cortex. 1991;1:230–240. doi: 10.1093/cercor/1.3.230. [DOI] [PubMed] [Google Scholar]
- Winfield DA. The postnatal development of synapses in the visual cortex of the cat and the effects of eyelid closure. Brain Res. 1981;206:166–171. doi: 10.1016/0006-8993(81)90110-4. [DOI] [PubMed] [Google Scholar]
- Worsley KJ, Evans AC, Marrett S, Neelin P. A three-dimensional statistical analysis for CBF activation studies in human brain. J Cereb Blood Flow Metab. 1992;12:900–918. doi: 10.1038/jcbfm.1992.127. [DOI] [PubMed] [Google Scholar]
- Yu C, Shu N, Li J, Qin W, Jiang T, Li K. Plasticity of the corticospinal tract in early blindness revealed by quantitative analysis of fractional anisotropy based on diffusion tensor tractography. Neuroimage. 2007;36:411–417. doi: 10.1016/j.neuroimage.2007.03.003. [DOI] [PubMed] [Google Scholar]