

Abstract
Game theory outlines optimal response strategies during mixed-strategy competitions. The neural processes involved in choosing individual strategic actions, however, remain poorly understood. Here, we tested whether the superior colliculus (SC), a brain region critical for generating sensory-guided saccades, is also involved in choosing saccades under strategic conditions. Monkeys were free to choose either of two saccade targets as they competed against a computer opponent during the mixed-strategy game “matching pennies.” The accuracy with which presaccadic SC activity predicted upcoming choice gradually increased in the time leading up to the saccade. Probing the SC with suprathreshold stimulation demonstrated that these evolving signals were functionally involved in preparing strategic saccades. Finally, subthreshold stimulation of the SC increased the likelihood that contralateral saccades were selected. Together, our results suggest that motor regions of the brain play an active role in choosing strategic actions rather than passively executing those prespecified by upstream executive regions.
Keywords: decision, macaque, motor intention, saccade, reinforcement, reward, neuroeconomics, game theory, Nash equilibrium
Introduction
Using a mixed strategy, in which available actions are selected probabilistically, prevents opponents from exploiting predictability during many interpersonal, geopolitical, pursuit-evasion, evolutionary, and sporting competitions (Maynard Smith, 1982; Driver and Humphries, 1988; Shinar et al., 1994; Palacios-Heurta, 2003). Game theory provides insight into these mixed-strategy competitions by outlining normative strategies, that is, specifying the proportion of responses that players should devote to each option once a behavioral equilibrium is established (Nash, 1950; Fundenberg and Tirole, 1991). However, the predictive power of game theory has limitations (Camerer, 2003). For instance, humans adopt mixed strategies that often approach, but deviate significantly from, game-theoretic predictions. Moreover, game theory provides solutions for proportioning responses on aggregate but does not address how choices are selected on each trial.
Recent insight into these unresolved issues has come from measuring neural signals during game play. Whereas previous analyses have been limited to choice patterns, recording neural signals provides access to hidden cognitive processes. For example, we are beginning to understand how the value of potential actions are represented neurally and how these value representations are updated based on previous actions and their outcomes (Barraclough et al., 2004; Dorris and Glimcher, 2004; Sugrue et al., 2004; Cohen and Ranganath, 2007; Seo and Lee, 2007).
Here, we examine whether the intermediate layers of the midbrain superior colliculus (SCi) plays a role in selecting mixed-strategy saccades. The SCi appears ideally suited for this role because it is organized as a topographic map on which potential saccade goals can compete (Krauzlis et al., 2004). The SCi receives inputs from upstream regions involved in both visuosaccadic and higher level cognitive functions (Wurtz et al., 2000) and its output to the brainstem saccade generating circuitry determines when and where a saccade will be directed (Munoz et al., 2000).
We will test between two possible roles that the SCi could play in generating strategic saccades. The “passive relay hypothesis” posits that strategic responses are selected by upstream executive centers and prespecified commands are simply relayed through the SCi for saccade execution. Activity would be present in the SCi only for the saccade that is ultimately selected but not the alternatives. This hypothesis is consistent with studies demonstrating that upstream structures carry cognitive signals that could be used to select strategic responses (Coe et al., 2002; Barraclough et al., 2004; Dorris and Glimcher, 2004; Sugrue et al., 2004; Seo and Lee, 2007), whereas the SCi is traditionally thought of as an evolutionarily old structure involved in generating reflexive, sensory-driven saccades.
The “active selection hypothesis” posits that the SCi integrates signals from upstream regions and resolves them to select a single strategic saccade. SCi activity would initially be present for all alternatives, but, over time, one would gradually be selected. This hypothesis is consistent with studies showing that cognitive signals that could be important for selecting strategic saccades are represented within the SCi (Basso and Wurtz, 1997; Dorris and Munoz, 1998; Ikeda and Hikosaka, 2003) and that the SCi is involved in saccade selection under nonstrategic conditions (Horwitz and Newsome, 2001; McPeek and Keller, 2002; Carello and Krauzlis, 2004; Dorris et al., 2007).
Materials and Methods
To distinguish between these two hypotheses, we performed a series of electrophysiological experiments on the SCi while monkeys competed against an adaptive computer opponent in a saccadic version of the classic mixed-strategy game “matching pennies” (von Neumann and Morgenstern, 1944; Lee et al., 2004). This computer opponent exploited any statistical biases in the monkey's pattern of choices. Therefore, although monkeys were always free to choose, their intake of reward was maximized by choosing the two targets in equal proportions and stochastically from trial to trial. The results from this mixed-strategy task were compared with two control tasks. The predictable task, in which a single target was always presented for a block of trials in either the preferred or nonpreferred direction of the neuron, allowed us to examine how presaccadic activity evolved when the upcoming saccade could be planned with near certainty. The unpredictable task, in which a single target was randomized between the preferred and nonpreferred directions from trial to trial, allowed us to examine how presaccadic activity evolved when the identity of the upcoming saccade was maximally uncertain.
General methodology
We recorded the extracellular activity of single neurons and applied electrical microstimulation in the SCi of two male rhesus monkeys (Macaca mulatta) weighing between 9 and 13.5 kg each. All procedures were approved by the Queen's University Animal Care Committee and complied with the guidelines of the Canadian Council on Animal Care. Animals were under the close supervision of the university veterinarian. Physiological recordings techniques as well as the surgical procedures have been described previously (Munoz and Istvan, 1998).
Behavioral paradigms, visual displays, delivery of liquid reward, and storage of both neuronal discharge and eye movement data were under the control of a PC computer running a real-time data acquisition system (Gramalkn–Ryklin Software). Red visual stimuli (11 cd/m2) were produced with a digital projector (Duocom InFocus SP4805; refresh rate, 100 Hz) and backprojected onto a translucent screen that spanned 50° horizontal and 40° vertical degrees of visual space. Right eye position was recorded at 500 Hz with a resolution of 0.1° using an infrared eye tracker system (Eyelink II; SR Research). The activity of single neurons was recorded with tungsten microelectrodes (Frederick Haer; 1–2 MΩ at 1 kHz) and sampled at 1 kHz. The same electrodes were also used for microstimulation experiments. Data analysis was performed off-line using MATLAB, version 7.04 (Mathworks) on a Pentium 4 personal computer.
Neuronal classification
We recorded from saccade-related neurons located between 1.0 and 3.0 mm below the surface of the SC. The center of the response field of the neuron was defined as the location relative to central fixation that was associated with the most vigorous activity during target-directed saccades. One target was always placed in the middle of the response field of the neuron (i.e., preferred direction of the neuron) and the other at the mirror image location in the opposite hemifield (i.e., nonpreferred direction of the neuron) for all behavioral tasks. To be included in our analysis, neurons had to have a transient burst of activity that was time-locked to preferred saccade onset that surpassed 100 spikes/s. Two categories of presaccadic activities were analyzed.
Preparatory activity.
Neurons were included in this category if the activity in the 50 ms after presentation of the mixed-strategy targets exceeded 30 spikes/s and was significantly greater than the 100 ms of activity preceding fixation point offset (paired t test; p < 0.01).
Visual activity.
Neurons were included in this category if they produced a transient burst of activity after presentation of the mixed-strategy targets. This transient burst had to be at least 50 spikes/s above the activity during preparatory period outlined above and be initiated within 100 ms after presentation of the target (Dorris et al., 2002). This visual activity was not contaminated by saccade-related bursts because the initiation of saccades was delayed during the mixed-strategy task presumably because of the competitive interactions between the two simultaneously presented targets (Dorris et al., 2007). Last, all microstimulation experiments were conducted within SCi regions with identified saccade-related activity.
Behavioral tasks: neuronal recordings
Mixed-strategy task (see Fig. 1A).
Figure 1.
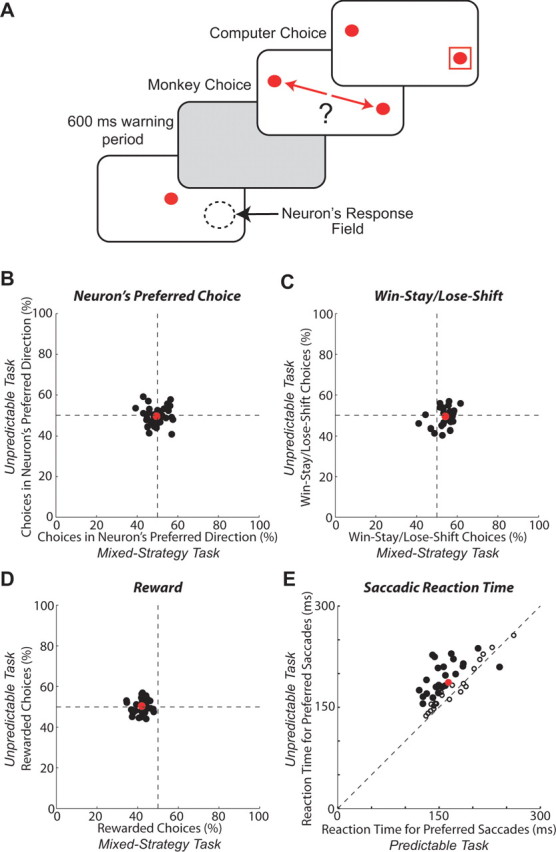
Behavioral summary. A, Mixed-strategy task. Each panel represents successive visual displays presented to the monkey. The red arrows indicate the monkey's possible saccadic choices. One of the saccade targets was always placed in the center of the response field of the neuron (i.e., preferred direction) as indicated with the dashed circle. The red box indicates the choice of the computer opponent. The predictable and unpredictable tasks (not shown) are identical except that only one target is presented per trial. B–D, The first three panels compare the percentages of the preferred choices of the neuron (B), win-stay/lose-shift choices (C), and rewarded choices (D) during experimental sessions in which the mixed-strategy and unpredictable tasks were performed. The dashed lines represent expected results attributable to randomization in the unpredictable task and the game-theoretic solution in the mixed-strategy task. E, A comparison of saccadic reaction times during blocks in which the unpredictable and predictable tasks were performed. The dashed line represents the line of unity. B–E, The red dots represent mean data. The filled circles in E represent statistically significant differences (t test, p < 0.01).
Subjects competed in an oculomotor version of the mixed-strategy game matching pennies against a dynamic computer opponent (see Fig. 1A). Subjects were required to maintain central gaze fixation throughout the 800 ms presentation of the fixation point and after its removal during a fixed 600 ms warning period. Subjects were free to saccade toward either of two simultaneously presented targets. The fixed warning period and known target locations facilitated advanced selection and preparation of saccades (Dorris and Munoz, 1998). After fixating the target stimulus for 300 ms, a red box, which indicated the computer opponent's choice, appeared around one of the targets for 500 ms.
The monkey received a 0.3 ml liquid reward if both players chose the same target and nothing otherwise. The computer opponent performed statistical analyses on the subject's history of previous choices and payoffs and exploited systematic biases in their choice strategy [for specific details, see algorithm 2 from Lee et al. (2004)]. Therefore, monkeys would maximize reward intake over time by choosing each target in equal proportions and unpredictably from trial to trial.
Unpredictable task.
The unpredictable task was identical to the mixed-strategy task with two exceptions. First, only a single saccade target was presented on each trial. This target was equally likely to be presented at the preferred or nonpreferred direction of the neuron. Second, reward was equally likely to be presented or withheld for successful completion of each trial. Therefore, the overall patterns of both choices and rewards were similar for both the mixed-strategy and unpredictable tasks but saccadic choice was under voluntary control in the former case and under sensory instruction in the latter.
Predictable task.
The predictable task was also identical to the mixed-strategy task except that a single saccadic target was presented on each trial always at the same location. During one block, the target was always presented in the preferred direction of the neuron, and during a second block, the target was always presented in the nonpreferred direction of the neuron. To produce an overall reward rate that was comparable with the other tasks, we opted to give reward on all trials but its magnitude was halved. Therefore, both saccade direction and reward delivery were maximally certain in this condition. Another option, which more closely resembled the reward schedule of the other tasks, would have been to give the regular magnitude reward but on only one-half the trials. The reader should keep in mind that it remains unclear whether behavior and SCi activity would have responded differently under these two reward schedules.
Behavioral tasks: electrical microstimulation
Suprathreshold stimulation experiments.
The same three behavioral tasks were conducted while suprathreshold stimulation was applied to the SCi during the warning period. Stimulation parameters were fixed at 70 ms duration, 300 Hz, and 0.3 ms biphasic pulses. Stimulation threshold was defined as the minimum current required to consistently produce the characteristic saccade vector for a given SCi site. In all cases, the stimulation vector was in close agreement with the preferred vector of neurons recorded just before stimulation. The current strength was then fixed at 1.5 times this threshold level during each experimental session (mean current, 42 ± 1.3 μA; range, 30–45 μA).
Saccadic targets were of the same amplitude but situated orthogonal to the stimulated vector (see Fig. 8A). Each block consisted of randomly interleaved stimulation (25%) and no stimulation (75%) trials. Stimulation was equally likely to be applied 120, 240, 360, 480, or 600 ms into the 600 ms warning period. When the warning period was extended to 1200 ms, stimulation was equally likely to be presented 120, 360, 600, 900, 1200 ms into the warning period. When stimulation was applied at the end of the warning period (i.e., 600 and 1200 ms; ∼5% of all trials), target presentation was delayed by 100 ms to ensure that visual transients associated with target presentation did not interfere with production of the evoked saccades.
Figure 8.

Using suprathreshold stimulation to test the role of the SCi in preparing mixed-strategy saccades. A, Behavioral task. Stimulation applied during the warning period triggered a saccade that was orthogonal to the targets. Afterward, monkeys were free to choose either target. The dashed circle and associated lightning bolt indicate stimulation vector. B–D, Evoked saccades on stimulation trials were segregated based on the final target selection. Data are shown for those trials in which stimulation was applied 500 ms into the 600 ms warning period for a representative stimulation site. B, On the majority of trials, stimulation was not applied and saccades were made directly to the targets (black crosses). Stimulation-evoked saccades were segregated into two categories: those in which the left (red) or right (blue) target was ultimately selected. C, Stimulation saccades tended to deviate toward the target that was ultimately chosen. D, Angular deviation (θ) was calculated as the angle between the averages of the endpoints between the two categories of stimulation-evoked saccades.
Subthreshold stimulation experiments.
Subthreshold stimulation was applied during the warning period in an attempt to bias the mixed-strategy selection process (see Fig. 10A). Stimulation was applied during the first 500 ms of the 600 ms warning period at a SCi site that coincided with one of the mixed-strategy targets. Each block consisted of randomly interleaved stimulation (25%) and no stimulation (75%) trials. Current intensity and frequency were adjusted so that the threshold required for eliciting saccades was approached but not crossed. Current intensity averaged 10 ± 1.1 μA (range, 8–12 μA) and frequency averaged 89 ± 9.8 Hz (range, 50–150 Hz).
Figure 10.

Manipulating mixed-strategy selections with subthreshold stimulation. A, Behavioral paradigm. Subthreshold stimulation was applied during the first 500 ms of the 600 ms warning period at a SCi location that corresponded to one of the mixed-strategy targets. The dashed circle and associated lightning bolt indicate stimulation vector. B, Percentage of choices allocated toward the stimulation-vector target during stimulation and nonstimulation trials. The diagonal lines represent the line of unity (N = 13 stimulation sites). C, D, Endpoints of saccades during stimulated (C) and nonstimulated (D) trials for a representative stimulation site (∼75 stimulation trials for each stimulation site).
Data analysis
Trials were aborted on-line if eye position was not maintained within ±3° of the appropriate spatial location or if saccades were initiated outside a 70–300 ms temporal window after target presentation. The first 20 trials from each block were discarded from analysis off-line to allow subjects time to adjust to the new task conditions. Computer software determined the beginning and end of each saccade using velocity and acceleration criteria and accuracy was verified by the experimenter. To quantify neuronal activity, each spike train was convolved with a postsynaptic activation function with a rise time of 1 ms and a decay time of 20 ms.
The endpoints of saccades triggered with suprathreshold stimulation were sampled when eye velocity first fell below 20°/s and remained there for at least 50 ms after the initiation of the evoked saccade. To account for deviations in endpoints that could result from small differences in starting position, the eye position at the time when stimulation was initially applied was subtracted from the final endpoint position.
We used signal detection theory (Green and Swets, 1966) to determine how well an ideal observer of SCi activity could predict which choice the monkey would make. The separation between the distributions of activity for the preferred and nonpreferred trials of the neuron was estimated from the area under receiver-operating characteristic (ROC) curves.
Results
Behavioral characterization
First, we examined how closely animals approached the mixed-strategy prediction of choosing each target in equal proportions and independently of previous actions and choices. Subsequent experiments do not depend on subjects perfectly achieving this normative strategy; in fact, we do not expect such a result because previous work has shown that both humans (Erev and Roth, 1998) and monkeys (Barraclough et al., 2004; Lee et al., 2004) fall short in this regard. Rather, in comparing mixed-strategy behavior with the stochastic behavior during the unpredictable task, we can characterize where subtle strategic biases exist. The percentage of choices toward the preferred direction of the neurons did not differ between the unpredictable (Ppreferred = 49.6 ± 0.8%) and mixed-strategy (Ppreferred = 49.5 ± 0.7%) tasks (Fig. 1B) (paired t test, p > 0.05). As has been observed previously (Lee et al., 2004), monkeys have a tendency toward repeating rewarded responses and switching away from unrewarded responses (Fig. 1C) (also known as “win-stay/lose-shift” strategy) during the mixed-strategy task (PWSLS = 54.2 ± 0.7%; binomial test, p < 10−6), a pattern that was not observed during the unpredictable task (PWSLS = 49.4 ± 0.7%; p = 0.42). The computer opponent exploited predictability in choice patterns (Fig. 1D) as evidenced by the lower percentage of rewarded choices during the mixed-strategy task (Preward = 42.0 ± 0.6%; p < 10−13) compared with the unpredictable task (Preward = 50.4 ± 0.6%; p = 0.5). Together, these analyses (Fig. 1B–D) demonstrate that monkeys chose the two targets in appropriate proportions during the mixed-strategy task but they had a subtle win-stay/lose-shift bias that was detected and exploited by the computer opponent. Last, faster saccadic reaction times during the predictable (163.6 ± 5 ms) compared with the unpredictable (187.6 ± 5 ms) task (paired t test, p < 0.001) suggested that monkeys detected and exploited target probability in preparing their saccadic responses (Dorris and Munoz, 1998) (Fig. 1E). There were no differences in preferred (208.2 ± 3 ms) or nonpreferred (202.0 ± 3 ms) saccadic reaction times when the monkey was able to choose of his own volition during the mixed-strategy task (paired t test, p = 0.1).
Neuronal selectivity
A total of 105 SCi saccade-related neurons satisfied our criteria for inclusion (see Materials and Methods). The majority or 65% (68 of 105) of these saccade-related neurons had both preparatory and visual activities, 10% (10 of 105) had only preparatory activity and 26% (27 of 105) had only visual activity.
Figure 2 compares SCi activity for preferred (black) and nonpreferred (gray) responses during the three behavioral tasks for a representative neuron (Fig. 2A–C) and the neuronal sample (Fig. 2D–F). Preparatory activity increased gradually during the warning period for all tasks (Fig. 2A–C). During the mixed-strategy task, preparatory activity became increasingly selective for upcoming choices (Fig. 2A), and by the end of the warning period (Fig. 2D) mean preparatory activity was significantly greater if preferred (101.1 ± 4.8 spikes/s) rather than nonpreferred (57.1 ± 4.3 spikes/s) saccades were chosen (paired t test, p < 0.001). In support of the active selection hypothesis, significant activity was present even when the nonpreferred saccade of the neuron was chosen during the mixed-strategy task. Preparatory activity was even more selective during the predictable task (Fig. 2B), and by the end of the warning period (Fig. 2E), mean preparatory activity was significantly greater for preferred (70.0 ± 5.1 spikes/s) than nonpreferred (30.5 ± 3.9 spikes/s) saccades (p < 10−10). During the unpredictable task, preparatory activity was unselective (Fig. 2C), and by the end of the warning period (Fig. 2F) mean activity did not differ between preferred (61.1 ± 4.9 spikes/s) and nonpreferred (57.1 ± 4.3 spikes/s) saccades (p = 0.72). Last, the initial visual burst associated with presentation of the targets during the mixed-strategy task was also selective of upcoming saccades (Fig. 2A, second shaded region). On average, the visual response was larger if preferred (311.6 ± 17 spikes/s) rather than nonpreferred (259.3 ± 16 spikes/s) saccades were selected (Fig. 3A) (p < 10−7). This visual selectivity could, in part, be attributed to preexisting differences in preparatory activity; however, visual activity was selective even when baseline preparatory activity was subtracted out (Fig. 3B) (p < 10−6).
Figure 2.

SCi activity during the three behavioral tasks. A–C, Activity of a representative SCi neuron during the mixed-strategy (A), predictable (B), and unpredictable (C) tasks. Rasters (top panels) and postsynaptic activation functions (bottom panel) are sorted based on preferred (black) and nonpreferred (gray) saccades. The shaded gray areas highlight the preparatory and visual activities analyzed in D–F and Figure 3, respectively. D–F, Preparatory activity from neuronal sample during the mixed-strategy (D) (N = 78 neurons, 284 ± 12 trials per neuron), predictable (E) (N = 54 neurons, 84 ± 4 trials per neuron), and unpredictable (F) (N = 58 neurons, 119 ± 8 trials per neuron) tasks. The diagonal line represents the line of unity. The filled data points represent statistically significant differences (paired t test, p < 0.01). The black data points represent mean ± SEM responses for all neurons.
Figure 3.

Increased visual activity in advance of preferred choices. Peak visual activity was calculated from the postsynaptic activation functions as shown in Figure 2A. Neurons are classified based on whether they reached our criteria (see Materials and Methods, Neuronal classification) for preparatory activity (circles; N = 68) or not (squares; N = 27). A, Absolute peak visual activity. B, Peak visual activity after preparatory activity 0–50 ms after target presentation was subtracted out.
We performed a ROC analysis to quantify the degree to which the SCi activity predicted upcoming responses (Fig. 4A). When sampled over the entire warning period, preparatory activity predicted mixed-strategy choices with 57% accuracy (green square; p < 0.001). When the upcoming target location was certain, the neuronal prediction improved (71%; blue square; p < 0.001), and when the upcoming saccade was uncertain, preparatory activity was nonpredictive (50%; red square; p > 0.05). Visual activity associated with presentation of the targets was 65% predictive of upcoming mixed-strategy choices (green triangle; p < 0.001). Performing this ROC analysis on successive 50 ms epochs revealed that neuronal prediction gradually increased throughout the warning period for the mixed-strategy (green circles; maximum, 62% prediction; p < 0.001) and predictable (maximum, 70% prediction; blue circles; p < 0.001) tasks but remained near chance levels during the unpredictable task (red circles; p > 0.05). Overall, neuronal prediction differed between each of the trial types (p < 0.001).
Figure 4.

Evolution of neuronal prediction over time. A, ROC analyses for mixed-strategy (N = 78 neurons; green), predictable (N = 54 neurons; blue), and unpredictable (N = 58 neurons; red) tasks. The squares represent neuronal predictions based on all warning period activity. The circles represent neuronal predictions based on successive 50 ms time bins throughout the warning period. The triangle represents neuronal prediction during the mixed-strategy task based on the initial visual response associated with target presentation (N = 68 neurons). B, Comparison of neuronal predictions when the fixed warning period was extended from 600 ms (green) to 1200 ms (dark green) during two blocks of the mixed-strategy game. Only those neurons in which recordings were conducted in both conditions are shown (N = 28 neurons). The asterisks indicate time points in which the neuronal prediction significantly differed from each other during these two conditions (paired t test, p < 0.01). Error bars represent the SEM. The filled data points represent predictions that are significantly greater than chance prediction denoted with dashed lines (t test, p < 0.01).
Influence of task timing on neuronal selectivity
The growth in neuronal selectivity observed during the mixed-strategy task could occur at a relatively fixed rate or it could be tailored to the expected timing of the response. To distinguish between these two possibilities, during some experiments an additional mixed-strategy block was performed in which the warning period was doubled from 600 to 1200 ms. Figure 5 shows that, for a single neuron, the time at which preparatory activity begins accumulating and the time at which this activity becomes selective are both delayed when the expected timing of the response is extended. ROC analysis quantified the delay in the neuronal selection across the sample of neurons (Fig. 4B) (N = 28 neurons).
Figure 5.
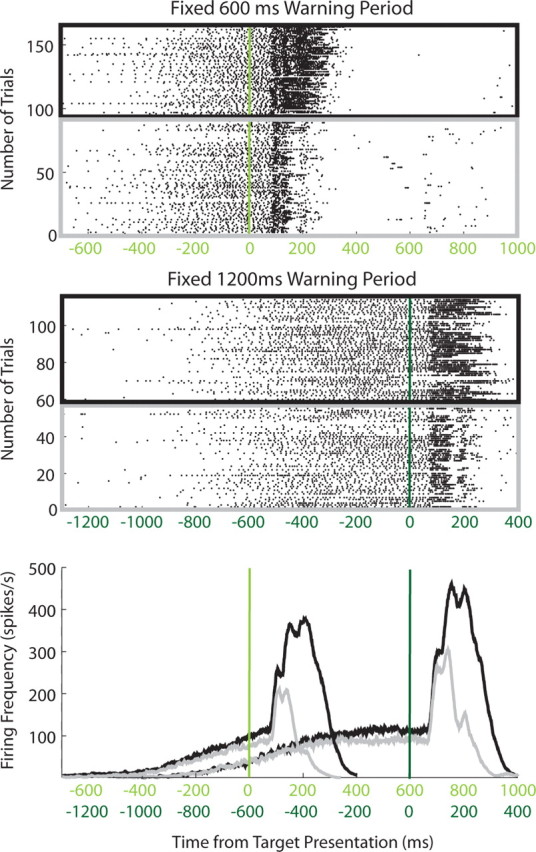
Activity of a representative SCi neuron when the fixed warning period was extended from 600 ms (green) to 1200 ms (dark green) across two blocks of the mixed-strategy task. The format is the same as that of Figure 2A.
Gradual selection between preferred and nonpreferred activities
The previous ROC analyses suggest that, on average, neuronal selection evolved gradually; however, this analysis cannot address how neuronal selection evolved on each trial. If the selection process is completed by upstream structures after which it is simply relayed to the SCi, we would expect a relatively abrupt transition in firing rate, an abrupt increase if the preferred saccade was selected and an abrupt decrease if the nonpreferred saccade was selected. Selection would appear gradual on aggregate if these abrupt transitions occurred more frequently as the time of target presentation approached (Fig. 6A, Abrupt selection). Alternatively, selection would also appear gradual on aggregate if, on each trial, there was indeed gradual differentiation of SCi activity associated with the two saccades (Fig. 6B, Gradual selection).
Figure 6.

Two hypothetical patterns in which SCi preparatory activity could increase. A, C, Abrupt selection. B, D, Gradual selection. Top panels, Each tick represents an action potential. The thin gray lines represent the time course of saccade preparatory activity during single trials, and the thick black lines represent the average of those across all trials. Note that average accumulation of activity is the same in both conditions. Each vertical dashed line in A highlights the time at which the abrupt transition in activity occurred on each trial. Bottom panels, Results from ISI analysis that would provide support for each of the two hypotheses. ISIN denotes the time between the current pair of spikes, and ISIN + 1 denotes the time between the subsequent pair of spikes. C, For abrupt selection, ISIN and ISIN + 1 would be of the same duration and therefore be clustered around the diagonal line of unity. Moreover, these data would be bimodally distributed with modes associated with low- and high-frequency activities, respectively. D, For gradual selection, ISIN + 1 data would generally be shorter than ISIN data and therefore concentrated below the line of unity. These data would also be unimodally distributed and skewed rightward reflecting the gradual transition from low to high firing rates.
To distinguish between these two possibilities, the following interspike interval (ISI) analysis was performed on the preparatory activity during the warning period. The ISI for each pair of spikes (ISIN) was plotted against the ISI for the subsequent spike pair (ISIN + 1). Abrupt selection would be characterized by bimodal ISI distributions and ISIN values that were equal to ISIN + 1 values (Fig. 6C). Gradual selection would be characterized by positively skewed unimodal ISI distributions and ISIN + 1 values that were generally shorter than ISIN values (Fig. 6D).
Analysis for a representative neuron revealed significant variability in ISI timing for successive spike pairs (Fig. 7A,B, gray dots). On average, however, each successive ISI decreased by 3.6 ms when the preferred direction of the neuron was selected (Fig. 7A, black dot) (paired t test, p < 10−12). Successive ISIs also decreased by 4.2 ms when the nonpreferred direction of this neuron was selected (Fig. 7B, black dot) (p < 10−12). Mean ISIs for the population of 78 neurons decreased by 4.1 ms for the preferred direction (Fig. 7C) (p < 10−12) and 4.5 ms for the nonpreferred direction (Fig. 7D) (p < 10−13). Moreover, 87% (68 of 78) of neurons had significant decreases (paired t test, p < 0.01) in successive ISI pairs and none had a significant increase. Mean ISIs were longer for nonpreferred compared with preferred (34.7 vs 30.3 ms; p < 10−6) saccades, which is consistent with the higher overall preparatory activity proceeding preferred saccades. Last, the shape of the ISI distributions were generally unimodal and positively skewed (Fig. 7A,B, histograms) as would be expected from a gradual transition from lower to higher firing rates. For the neuronal sample, the null hypothesis of unimodality could be rejected in only one instance (1 of 78 distributions; dip test, p < 0.01) and the mean skewness of 3.7 ± 0.2 was significantly greater than zero (t test, p < 0.001). Together, this ISI analysis supports the active selection hypothesis, in that there was gradual selection between SCi activities associated with the potential mixed-strategy saccades.
Figure 7.

Gradual accumulation in preparatory activity for both preferred and nonpreferred mixed-strategy saccades. A, B, ISI analysis conducted on preparatory activity for a representative neuron. A, The preferred direction of the neuron. B, The nonpreferred direction of the neuron. Each gray data point represents the ISI from a pair of spikes (ISIN) plotted against the ISI from the successive pair of spikes (ISIN + 1). The black dots represent the mean data for this neuron. The diagonal lines represent lines of unity. The histogram scale bars in the top right corners equal 100 observations. C, D, ISI analysis for the sample of 78 neurons with preparatory activity. C, The preferred direction of the neuron. D, The nonpreferred direction of the neuron. Each data point represents mean data from a single neuron. The filled circles represent significant differences between ISIN and ISIN + 1 (paired t test, p < 0.01). The red dots represent the mean of the entire neuronal sample.
Probing the role of presaccadic activity in preparing mixed-strategy saccades
Neuronal recordings demonstrated that presaccadic activity became increasingly predictive of the upcoming mixed-strategy saccade. To extend these correlational results and test whether this presaccadic activity was functionally involved in preparing mixed-strategy saccades, we adapted a suprathreshold stimulation protocol that had been used previously to examine whether evolving perceptual decisions are represented within developing saccadic plans (Gold and Shadlen, 2000, 2003). Here, on a minority of trials, stimulation was applied to the SCi to evoke a saccade during the warning period (Fig. 8A). The saccadic targets were situated so that they were orthogonal to the evoked saccade vector. Stimulation-evoked saccades were categorized based on the subsequent choice of mixed-strategy targets (Fig. 8B,C). For each of the five stimulation times, the angular deviation (Fig. 8D, θ) was calculated from the mean endpoints of these two categories of evoked saccades. Thus, deviations in the endpoints of the evoked saccade toward these targets measured the otherwise covert process of saccade preparation as it evolved throughout the warning period.
The patterns of angular deviations for evoked saccades (Fig. 9A) (N = 11 stimulation sites) closely resembled the patterns of ROC analyses obtained with neuronal recordings (Fig. 4A). When the upcoming target location was uncertain during the unpredictable task, evoked saccades displayed no angular deviation (Fig. 9A, red) (p > 0.05). During the predictable task, evoked saccades increasingly deviated toward the expected target as stimulation was applied later in the warning period (Fig. 9A, blue) (p < 0.001). Angular deviations during the mixed-strategy task more closely resembled those of the predictable task, in that evoked saccades increasingly deviated toward the chosen target as stimulation was applied later in the warning period (Fig. 9A, green) (p < 0.001). Overall, the amount of angular deviation differed between each of the trial types (p < 0.001).
Figure 9.

Evolution of angular deviations over time. A, Angular deviations for mixed-strategy (green), predictable (blue), and unpredictable (red) tasks (N = 11 stimulation sites). B, Comparison of angular deviations when the fixed warning period was extended from 600 ms (green) to 1200 ms (dark green) during two blocks of the mixed-strategy game (N = 10 stimulation sites). The format is the same as that of Figure 4.
Last, we examined the role of response timing on mixed-strategy saccade preparation. Like the ROC neuronal analysis (Fig. 4B), the magnitude of angular deviation was delayed in time when the warning period was extended from 600 to 1200 ms (Fig. 9B). Together, these suprathreshold stimulation experiments demonstrated that the selectivity observed in SCi activity represents the spatiotemporal preparation of mixed-strategy saccades.
Artificially manipulating the selection of mixed-strategy saccades
Finally, we used subthreshold stimulation to examine whether presaccadic activity is involved in selecting mixed-strategy saccades. The experimental results up to this point could be explained whether presaccadic SCi activity passively reflected the sum of inputs as they evolved in real time; the SCi would not play a role in selecting strategic saccades but only in preparing saccades that were likely to be selected by upstream structures. Here, we used stimulation to artificially increase SCi activity. Importantly, stimulation was applied at a level subthreshold for triggering saccades and in advance of saccadic choice. If the likelihood of choosing the saccade associated with the stimulated site increased, this would indicate that the SCi is located within the circuit involved in selecting mixed-strategy saccades.
Three lines of evidence indicated that stimulation was subthreshold for affecting saccade generation directly. First, stimulation only biased the proportion of saccades (Fig. 10C,D), whereas suprathreshold stimulation would force saccade generation (Stanford et al., 1996). Second, saccades were not triggered while stimulation was being applied. In fact, stimulation was terminated 100 ms before the target presentation and an average of 280.7 ± 3 ms before saccades were initiated. Third, saccade amplitude, velocity, and latency did not differ between stimulation and no stimulation trials (t test, p > 0.05).
Overall, subthreshold stimulation biased the selection of mixed-strategy saccades toward the stimulation vector (60%) compared with interleaved no stimulation trials (52%) (Fig. 10D) (paired t test, p < 0.01; n = 13 stimulation sites). This provides causal evidence that the SCi is located with the brain circuitry involved in selecting mixed-strategy saccades.
Discussion
These experiments demonstrate that the SCi is actively involved in selecting mixed-strategy saccades rather than merely relaying commands that are prespecified by upstream executive structures. We are not claiming that the SCi is the only structure involved in this process or that upstream structures do not perform important roles in selecting strategic saccades (Coe et al., 2002; Barraclough et al., 2004; Dorris and Glimcher, 2004; Seo and Lee, 2007). However, our results suggest that the SCi map provides a platform where diverse signals can be integrated and resolved into a single, strategic command that is sent to the brainstem saccade generator.
SCi activity represents evolving saccade plans
Our results show that the spatiotemporal evolution of strategic saccade plans is represented in SCi activity. The relative activity between competing SCi loci predicted the spatial direction of the upcoming saccade in a manner that was tailored to expected saccade timing (Figs. 2, 4, 5). Whether this evolving activity represented saccade preparation was tested by analyzing the endpoints of saccades triggered prematurely with suprathreshold stimulation (Gold and Shadlen, 2000, 2003). Saccades deviated (Fig. 9) in a manner that closely matched the pattern of neuronal selectivity (Fig. 4), which indicates that this SCi activity was not only correlated to, but was functionally involved in, preparing strategic saccades.
Two control conditions allowed us to compare the neural processes preceding strategic saccades with those preceding saccades whose identity were fully predictable or unpredictable. This comparison is important from a game-theoretic perspective because it provides insight into the long-standing issue of how individual mixed-strategy responses are selected when, on aggregate, players are indifferent toward the available choices (Harsanyi, 1973). On one hand, the neural processes preceding both strategic and predictable saccades should be similar if saccades are selected and prepared in advance in both cases. However, strategic and unpredictable saccades shared important features, such as two targets that, on aggregate, were equally valuable and patterns of responses and rewards that were relatively stochastic (Fig. 2B–D). Therefore, it was plausible that strategic saccades were not selected in advance of target presentation and preparation remained unbiased. The pattern of neuronal selectivity (Fig. 4A) and saccade deviations (Fig. 9A) indicated that strategic plans became increasingly biased over time, albeit, not to the same degree as predictable saccades. Therefore, preparation processes appear biased in favor of, but not fully committed to, a particular strategic saccade. This conclusion was also reached from a behavioral study in which humans played a saccadic version of matching pennies (Mikulić and Dorris, 2008).
A surprising finding, for a structure so close to the motor output, was the degree and duration with which the nonselected saccade was represented in advanced SCi activity (Fig. 2A). Substantial neuronal activity was present just before the selection of nonpreferred saccades (Fig. 2D). Analyses of ISIs further suggested that the selection of strategic saccades occurred gradually, through the differential accumulation of activity at the two SCi loci (Fig. 7). Therefore, these findings are consistent with a gradual, active selection process that is ongoing within the SCi rather than one that is preselected beforehand.
This gradual transition observed with the ISI analysis is consistent with the passive relay hypothesis if SCi activity reflected selection processes that were transmitted from upstream structures in a continuous manner. The fact that subthreshold stimulation biases saccade selection although stimulation is terminated well before target presentation (Fig. 10) argues against this interpretation. Once stimulation biases activity, this bias is actively maintained by the SCi rather than reverting back to a state that passively reflects upstream inputs. Our ISI results are also consistent with a SCi selection process that first occurs gradually and is followed by an abrupt transition whose timing varies across trials (i.e., combined gradual and abrupt transition processes). If this were the case, the distributions of saccade endpoints triggered by suprathreshold stimulation should have been bimodal rather than unimodel (Fig. 8C,D). Therefore, although the ISI analysis on its own does not conclusively demonstrate an active and gradual selection process within the SCi, when coupled with corroborative evidence from the two stimulation experiments, we feel this remains the most parsimonious explanation.
Our results also suggest that similar neural processes may underlie selecting actions based on both strategic and perceptual considerations; namely, the gradual, differential accumulation of activity across sensory-motor maps. Computational models posit that the relative rate at which neuronal activations accumulate in favor of potential percepts depends mostly on the quality of, and length of exposure to, incoming sensory evidence for each (Carpenter and Williams, 1995; Usher and McClelland, 2001; Mazurek et al., 2003). Sensory inputs cannot “drive” accumulation in the current experiments because accumulation occurred during the warning period when animals were situated in complete darkness. One possibility is that activity associated with the two potential saccades begins accumulating stochastically from a common baseline level. The inherent noisiness of neuronal firing rates (Shadlen and Newsome, 1994, 1998) would then effectively randomize which representation surpassed saccadic threshold level on each trial. Our data support such a mechanism, but with the caveat that the accumulation process begins with a small initial bias. In this case, the noisiness of the accumulating neuronal signals would ensure that the biased option was only more likely, but not guaranteed, to be selected. This bias is evidenced by a win-stay/lose-shift tendency both here (Fig. 1C) and in similar behavioral contexts (Dorris et al., 2000; Lee et al., 2004; Corrado et al., 2005; Lau and Glimcher, 2005). This initial bias was observed in neuronal activity at the onset of the warning period (Fig. 4A, initial green data points).
Neuronal selectivity evolved in a manner that reflected expected saccade timing (Figs. 4B, 5B). A riskier option would be to only represent selected saccades in the SCi well in advance of target presentation. Given the proximity of the SCi to the motor output, activity fluctuations could surpass the threshold and trigger saccades prematurely. Alternatively, the selection process could begin in the SCi only after target presentation. This option could result in unnecessarily delayed saccades because additional time would be required to resolve the selection process. A gradual selection process, therefore, takes advantage of timing information while minimizing the risk of premature responses. Temporal signals in cortical structures known to project to the SCi likely play a role in selection timing (Leon and Shadlen, 2003; Janssen and Shadlen, 2005; Maimon and Assad, 2006).
Artificially manipulating saccade selection
Subthreshold stimulation biased choice probability (Fig. 10), which indicates that the SCi is causally involved in selecting strategic saccades. Previous work has shown that artificially manipulating SCi activity can bias the selection of perceptually guided saccades; that is, alter the probability of choosing a target stimulus that differs from distracting stimuli based on some sensory feature (Carello and Krauzlis, 2004; McPeek and Keller, 2004; Dorris et al., 2007). This study extends these previous findings in two important respects. First, it demonstrates that the SCi is causally involved in selecting saccades that are guided not only by instructive sensory cues but also by strategic considerations. Second, this selection bias was accomplished with stimulation that was terminated both before the choice stimuli were presented and saccades were initiated. In contrast, previous studies manipulated SCi activity throughout both of these periods (Carello and Krauzlis, 2004; McPeek and Keller, 2004; Dorris et al., 2007). Therefore, our results demonstrate that the SCi is involved in selecting strategic saccades in a manner that is separate from processing sensory stimuli or movement generation.
These results could be explained by two, not necessarily mutually exclusive, roles for the SCi in selecting strategic saccades. First, subthreshold stimulation could exert its effects locally within the SCi. Biased activity could be actively maintained and, perhaps, enhanced after the stimulation was terminated through a combination of local recurrent excitation and lateral inhibition within the SCi (Munoz and Istvan, 1998; Dorris et al., 2007). Second, subthreshold SCi stimulation could exert its effects indirectly by influencing structures extrinsic to the SCi such as through feedback connections from SCi to the frontal eye field (Sommer and Wurtz, 2004) or basal ganglia (McHaffie et al., 2005). Although our experiments cannot determine which particular mechanism is at work, we can conclude that the SCi is located within the neural circuit that is causally involved in selecting strategic saccades.
Unresolved issues
These findings are important because they indicate that motor regions in the brain are more actively involved in choosing strategic actions than has widely been recognized. A broader role for the SCi in strategic decision making is, however, likely limited. For example, during strategic games that require different motor effectors (e.g., a manual version of matching pennies), do other motor regions play analogous roles to that of the SCi? Are there brain regions upstream of motor areas that are involved in choosing strategic actions regardless of the motor effector (Cui and Andersen, 2007)? If so, how are decision signals routed only to those motor regions required for generating effector-specific actions? Last, at what point in time and where anatomically within this hierarchy does differential activity switch from deliberation to commitment to action?
Footnotes
This work was supported by a Career Development Award from the Human Frontier Science Program and a group grant from the Canadian Institutes of Health Research awarded to M.C.D. We thank J. Green, S. Hickman, M. Lewis, F. Paquin, and R. Pengelly for technical assistance. J. Turner provided programming expertise and E. Ryklin customized the data acquisition program. We thank M. Paré for suggesting the interspike interval analysis. J. Chan, J. Kan, D. M. Milstein, K. Shen, D. Standage, and R. Webb provided constructive feedback regarding this manuscript.
References
- Barraclough DJ, Conroy ML, Lee D. Prefrontal cortex and decision making in a mixed-strategy game. Nat Neurosci. 2004;7:404–410. doi: 10.1038/nn1209. [DOI] [PubMed] [Google Scholar]
- Basso MA, Wurtz RH. Modulation of neuronal activity by target uncertainty. Nature. 1997;389:66–69. doi: 10.1038/37975. [DOI] [PubMed] [Google Scholar]
- Camerer CF. Princeton, NJ: Princeton UP; 2003. Behavioral game theory. [Google Scholar]
- Carello CD, Krauzlis RJ. Manipulating intent: evidence for a causal role of the superior colliculus in target selection. Neuron. 2004;43:575–583. doi: 10.1016/j.neuron.2004.07.026. [DOI] [PubMed] [Google Scholar]
- Carpenter RH, Williams ML. Neural computation of log likelihood in control of saccadic eye movements. Nature. 1995;377:59–62. doi: 10.1038/377059a0. [DOI] [PubMed] [Google Scholar]
- Coe B, Tomihara K, Matsuzawa M, Hikosaka O. Visual and anticipatory bias in three cortical eye fields of the monkey during an adaptive decision-making task. J Neurosci. 2002;22:5081–5090. doi: 10.1523/JNEUROSCI.22-12-05081.2002. [DOI] [PMC free article] [PubMed] [Google Scholar]
- Cohen MX, Ranganath C. Reinforcement learning signals predict future decisions. J Neurosci. 2007;27:371–378. doi: 10.1523/JNEUROSCI.4421-06.2007. [DOI] [PMC free article] [PubMed] [Google Scholar]
- Corrado GS, Sugrue LP, Seung HS, Newsome WT. Linear-nonlinear-Poisson models of primate choice dynamics. J Exp Anal Behav. 2005;84:581–617. doi: 10.1901/jeab.2005.23-05. [DOI] [PMC free article] [PubMed] [Google Scholar]
- Cui H, Andersen RA. Posterior parietal cortex encodes autonomously selected motor plans. Neuron. 2007;56:552–559. doi: 10.1016/j.neuron.2007.09.031. [DOI] [PMC free article] [PubMed] [Google Scholar]
- Dorris MC, Glimcher PW. Activity in posterior parietal cortex is correlated with the relative subjective desirability of action. Neuron. 2004;44:365–378. doi: 10.1016/j.neuron.2004.09.009. [DOI] [PubMed] [Google Scholar]
- Dorris MC, Munoz DP. Saccadic probability influences motor preparation signals and time to saccadic initiation. J Neurosci. 1998;18:7015–7026. doi: 10.1523/JNEUROSCI.18-17-07015.1998. [DOI] [PMC free article] [PubMed] [Google Scholar]
- Dorris MC, Paré M, Munoz DP. Immediate neural plasticity shapes motor performance. J Neurosci. 2000;20(RC52):1–5. doi: 10.1523/JNEUROSCI.20-01-j0005.2000. [DOI] [PMC free article] [PubMed] [Google Scholar]
- Dorris MC, Klein RM, Everling S, Munoz DP. Contribution of the primate superior colliculus to inhibition of return. J Cogn Neurosci. 2002;14:1256–1263. doi: 10.1162/089892902760807249. [DOI] [PubMed] [Google Scholar]
- Dorris MC, Olivier E, Munoz DP. Competetive integration of visual and preparatory signals in the superior colliculus during saccadic programming. J Neurosci. 2007;27:5053–5062. doi: 10.1523/JNEUROSCI.4212-06.2007. [DOI] [PMC free article] [PubMed] [Google Scholar]
- Driver PM, Humphries DA. Oxford: Oxford UP; 1988. Protean behaviour: the biology of unpredictability. [Google Scholar]
- Erev I, Roth AE. Predicting how people play games: reinforcement learning in experimental games with unique, mixed strategy equilibria. Am Econ Rev. 1998;88:848–881. [Google Scholar]
- Fundenberg D, Tirole J. Cambridge, MA: MIT; 1991. Game theory. [Google Scholar]
- Gold JI, Shadlen MN. Representation of a perceptual decision in developing oculomotor commands. Nature. 2000;404:390–394. doi: 10.1038/35006062. [DOI] [PubMed] [Google Scholar]
- Gold JI, Shadlen MN. The influence of behavioral context on the representation of a perceptual decision in developing oculomotor commands. J Neurosci. 2003;23:632–651. doi: 10.1523/JNEUROSCI.23-02-00632.2003. [DOI] [PMC free article] [PubMed] [Google Scholar]
- Green DM, Swets JA. New York: Wiley; 1966. Signal detection theory and psychophysics. [Google Scholar]
- Harsanyi JC. Games with randomly distributed payoffs: a new rationale for mixed-strategy equilibrium points. Int J Game Theory. 1973;2:1–23. [Google Scholar]
- Horwitz GD, Newsome WT. Target selection for saccadic eye movements: prelude activity in the superior colliculus during a direction-discrimination task. J Neurophysiol. 2001;86:2543–2558. doi: 10.1152/jn.2001.86.5.2543. [DOI] [PubMed] [Google Scholar]
- Ikeda T, Hikosaka O. Reward-dependent gain and bias of visual responses in primate superior colliculus. Neuron. 2003;39:693–700. doi: 10.1016/s0896-6273(03)00464-1. [DOI] [PubMed] [Google Scholar]
- Janssen P, Shadlen MN. A representation of the hazard rate of elapsed time in macaque area LIP. Nat Neurosci. 2005;8:234–241. doi: 10.1038/nn1386. [DOI] [PubMed] [Google Scholar]
- Krauzlis RJ, Liston D, Carello CD. Target selection and the superior colliculus: goals, choices and hypotheses. Vision Res. 2004;44:1445–1451. doi: 10.1016/j.visres.2004.01.005. [DOI] [PubMed] [Google Scholar]
- Lau B, Glimcher PW. Dynamic response-by-response models of matching behavior in rhesus monkeys. J Exp Anal Behav. 2005;84:555–579. doi: 10.1901/jeab.2005.110-04. [DOI] [PMC free article] [PubMed] [Google Scholar]
- Lee D, Conroy ML, McGreevy BP, Barraclough DJ. Reinforcement learning and decision making in monkeys during a competitive game. Brain Res Cogn Brain Res. 2004;22:45–58. doi: 10.1016/j.cogbrainres.2004.07.007. [DOI] [PubMed] [Google Scholar]
- Leon MI, Shadlen MN. Representation of time by neurons in the posterior parietal cortex of the macaque. Neuron. 2003;38:317–327. doi: 10.1016/s0896-6273(03)00185-5. [DOI] [PubMed] [Google Scholar]
- Maimon G, Assad JA. A cognitive signal for the proactive timing of action in macaque LIP. Nat Neurosci. 2006;9:948–955. doi: 10.1038/nn1716. [DOI] [PubMed] [Google Scholar]
- Maynard Smith J. Cambridge, UK: Cambridge UP; 1982. Evolution and the theory of games. [Google Scholar]
- Mazurek ME, Roitman JD, Ditterich J, Shadlen MN. A role for neural integrators in perceptual decision making. Cereb Cortex. 2003;13:1257–1269. doi: 10.1093/cercor/bhg097. [DOI] [PubMed] [Google Scholar]
- McHaffie JG, Stanford TR, Stein BE, Coizet V, Redgrave P. Subcortical loops through the basal ganglia. Trends Neurosci. 2005;28:401–407. doi: 10.1016/j.tins.2005.06.006. [DOI] [PubMed] [Google Scholar]
- McPeek RM, Keller EL. Saccade target selection in the superior colliculus during a visual search task. J Neurophysiol. 2002;88:2019–2034. doi: 10.1152/jn.2002.88.4.2019. [DOI] [PubMed] [Google Scholar]
- McPeek RM, Keller EL. Deficits in saccade target selection after inactivation of superior colliculus. Nat Neurosci. 2004;7:757–763. doi: 10.1038/nn1269. [DOI] [PubMed] [Google Scholar]
- Mikulić A, Dorris MC. Temporal and spatial allocation of motor preparation during a mixed-strategy game. J Neurophysiol. 2008;100:2101–2108. doi: 10.1152/jn.90703.2008. [DOI] [PubMed] [Google Scholar]
- Munoz DP, Istvan PJ. Lateral inhibitory interactions in the intermediate layers of the monkey superior colliculus. J Neurophysiol. 1998;79:1193–1209. doi: 10.1152/jn.1998.79.3.1193. [DOI] [PubMed] [Google Scholar]
- Munoz DP, Dorris MC, Paré M, Everling S. On your mark, get set: brainstem circuitry underlying saccadic initiation. Can J Physiol Pharmacol. 2000;78:934–944. [PubMed] [Google Scholar]
- Nash JF. Equilibrium points in N-person games. Proc Natl Acad Sci U S A. 1950;36:48–49. doi: 10.1073/pnas.36.1.48. [DOI] [PMC free article] [PubMed] [Google Scholar]
- Palacios-Heurta I. Professionals play minimax. Rev Econ Studies. 2003;70:395–415. [Google Scholar]
- Seo H, Lee D. Temporal filtering of reward signals in the dorsal anterior cingulate cortex during a mixed-strategy game. J Neurosci. 2007;27:8366–8377. doi: 10.1523/JNEUROSCI.2369-07.2007. [DOI] [PMC free article] [PubMed] [Google Scholar]
- Shadlen MN, Newsome WT. Noise, neural codes and cortical organization. Curr Opin Neurobiol. 1994;4:569–579. doi: 10.1016/0959-4388(94)90059-0. [DOI] [PubMed] [Google Scholar]
- Shadlen MN, Newsome WT. The variable discharge of cortical neurons: implications for connectivity, computation, and information coding. J Neurosci. 1998;18:3870–3896. doi: 10.1523/JNEUROSCI.18-10-03870.1998. [DOI] [PMC free article] [PubMed] [Google Scholar]
- Shinar J, Forte I, Kantor B. Mixed strategy guidance: a new high-performance missle guidance law. J Guid Control Dyn. 1994;17:129–135. [Google Scholar]
- Sommer MA, Wurtz RH. What the brain stem tells the frontal cortex. I. Oculomotor signals sent from superior colliculus to frontal eye field via mediodorsal thalamus. J Neurophysiol. 2004;91:1381–1402. doi: 10.1152/jn.00738.2003. [DOI] [PubMed] [Google Scholar]
- Stanford TR, Freedman EG, Sparks DL. Site and parameters of microstimulation: evidence for independent effects on the properties of saccades evoked from the primate superior colliculus. J Neurophysiol. 1996;76:3360–3381. doi: 10.1152/jn.1996.76.5.3360. [DOI] [PubMed] [Google Scholar]
- Sugrue LP, Corrado GS, Newsome WT. Matching behavior and the representation of value in the parietal cortex. Science. 2004;304:1782–1787. doi: 10.1126/science.1094765. [DOI] [PubMed] [Google Scholar]
- Usher M, McClelland JL. The time course of perceptual choice: the leaky, competing accumulator model. Psychol Rev. 2001;108:550–592. doi: 10.1037/0033-295x.108.3.550. [DOI] [PubMed] [Google Scholar]
- von Neumann J, Morgenstern O. Princeton, NJ: Princeton UP; 1944. Theory of games and economic behavior. [Google Scholar]
- Wurtz RH, Basso MA, Pare M, Sommer MA. The superior colliculus and the cognitive control of movement. In: Gazzaniga MS, editor. The new cognitive neurosciences. Ed 2. Cambridge, MA: MIT; 2000. pp. 573–588. [Google Scholar]