Abstract
Purpose:
African American (AA) patients with triple-negative breast cancer (TNBC) are less likely to achieve pathologic complete response from neoadjuvant chemotherapy and have poorer prognosis than Caucasian patients with TNBC, suggesting potential biological differences by race. Immune infiltration is the most consistent predictive marker for chemotherapy response and improved prognosis in TNBC. In this study, we test the hypothesis that the immune microenvironment differs between AA and Caucasian patients.
Methods:
RNA-seq expression data were obtained from The Cancer Genome Atlas (TCGA) database for 162 AA and 697 Caucasian breast cancers. Estrogen receptor (ER)-positive, human epidermal growth factor receptor-2 (HER2)-positive, and TNBC subtypes were included in the analyses. Tumor infiltrating lymphocyte (TIL) counts, immunomodulatory scores, and molecular subtypes were obtained from prior publications for a subset of the TNBC cases. Differences in immune cell distributions and immune functions, measured through gene expression and TIL counts, as well as neoantigen, somatic mutation, amplification and deletion loads, were compared by race and tumor subtype.
Results:
Immune metagene analysis demonstrated marginal immune attenuation in AA TNBC relative to Caucasian TNBC that did not reach statistical significance. The distributions of immune cell populations, lymphocyte infiltration, molecular subtypes, and genomic aberrations between AA and Caucasian subtypes were also not significantly different. The MHC1 metagene demonstrated increased expression in AA ER-positive cancers relative to Caucasian ER-positive cancers.
Conclusions:
This study suggests that the immunological differences between AA and Caucasian breast cancers represented by TCGA data are subtle, if they exist at all. We observed no consistent racial differences in immune gene expression or TIL counts in TNBC by race. However, this study cannot rule out small differences in immune cell subtype distribution and activity status that may not be apparent in bulk RNA analysis.
Introduction
Breast cancer survival rates are lower in African American (AA) women compared to Caucasian women [1]. AA women are about 40% more likely to die from breast cancer than their Caucasian counterparts, despite improvements in mortality in both groups [2]. In addition to socioeconomic factors that affect access to health care and generally higher comorbidity rates among AA patients, biological factors may also contribute to the survival gap. For example, estrogen-receptor (ER), progesterone-receptor (PR), and human epidermal growth factor receptor-2 (HER2) negative breast cancer (i.e. triple-negative breast cancer, TNBC) that carries a less favorable prognosis is more common among premenopausal AA women [3, 4]. The increased incidence of TNBC among AA women is attributed to a combination of modifiable risk factors including differential rates of breastfeeding, earlier and higher parity, obesity, as well as non-modifiable factors such as predisposing single nucleotide polymorphisms in the African ancestry [5-7]. We recently showed that response to neoadjuvant chemotherapy, as measured by pathological complete response (pCR) rate, in early stage TNBC is also lower in AA patients [8]. This difference in chemotherapy responsiveness remained significant after adjusting for age, clinical tumor characteristics, length of therapy, as well as social and geographical variables including patients’ insurance status and census-derived median income, suggesting that race-associated biological differences may influence treatment response.
The degree of immune infiltration in the tumor microenvironment is the most consistently reported prognostic and chemotherapy treatment response marker in TNBC [9]. Both a high tumor infiltrating lymphocyte (TIL) count and high immune-related gene expression predict higher pCR rates and better prognosis [10-12]. What drives differences in immune infiltration between breast cancers is unknown. A pooled analysis of solid tumors from The Cancer Genome Atlas (TCGA) found that both the total number of somatic mutations and the number of new antigen epitopes from tumor cells (i.e., neoantigen load) correlated positively with immune infiltration across all cancers [13]. However, subsequent analyses focused on breast cancer found that high immune cell gene expression signatures were in fact inversely associated with clonal heterogeneity in TNBC [14, 15], suggesting that an effective immune surveillance continuously eliminates clonal and genomic heterogeneity. Furthermore, a combined analysis of mutational load and clonality indicated that TNBC cancers with high mutational load and low clonality have increased cytolytic activity and better response to chemotherapy [16], suggesting that an adequately high “clonal fraction” of neoantigens maybe critical for tumor elimination [17, 18].
Potential differences between the tumor immune microenvironment in AA and Caucasian breast cancer patients have not been clearly characterized. We hypothesized that the poorer chemotherapy sensitivity and worse prognosis of AA TNBC could be due to lower anti-tumor immunity in the tumor microenvironment. Less effective anti-tumor immune surveillance may arise from differences in inherited DNA mutations, the cancer somatic mutational spectra, or environmental factors such as higher levels of stress, which has been shown to dampen immune activities. The goal of this study was to compare TIL counts and immune gene expression in breast cancer between races and between breast cancer subtypes by race in the TCGA cohort. If race-associated immunobiological differences exist in breast cancers, this could potentially suggest novel immuno-oncology therapeutic strategies to reduce the survival difference between AA and Caucasian patients.
Materials and Methods
Gene expression data sources
Gene-level RNA-seq expression data and corresponding clinical data were obtained for 1,105 patients with primary breast cancer from the public portal of the TCGA (https://portal.gdc.cancer.gov). RNA-Seq by Expectation Maximization (RSEM) data were log2-transformed and quantile normalized for metagene analysis. After filtering for availability of race information, n=697 Caucasian and n=162 AA patients were selected for final analysis. Breast cancers were categorized as ER-positive/HER2-negative, referred to as ER-positive (n=540), HER2-positive with any ER status (n=147), or ER-negative/HER2-negative, referred to as TNBC (n=172) groups, as described previously [14].
Characterizing the tumor immune microenvironment
Gene Expression Analysis
The expression of 13 previously reported immune metagenes (CTL, Macrophages, MHC1, MHC2, T-reg, IF1, NK, STAT1, Giam, Tfh, Tinh, Tstim, LCK) that represent various immune cell types and immune functions were calculated as the median log2-transformed, normalized expression of the member genes as described previously [14, 19-28]. The metagenes and their gene memberships are listed in Supplementary Table 1. The prognostic and chemotherapy response predictive value of each of these metagenes were previously assessed in TCGA and other data sets [19, 28].
We also assessed two recently reported immune-checkpoint blockade (ICB) response predictive markers: the “T-cell inflamed” gene signature by Ayers et al [26] and the Tumor Immune Dysfunction and Exclusion (TIDE) analysis proposed by Jiang et al [29, 30]. A higher TIDE score indicates greater dysfunction and exclusion of T-cells from the immune microenvironment, corresponding to lower likelihood of benefit from ICB.
The relative fractions of 22 immune cell sub-populations were estimated using the CIBERSORT tool [31, 32]. Immune cell populations were aggregated into 9 broader categories to yield estimates of more comprehensive cell populations as described previously [29]. Metagene heatmaps were created in R using the “pheatmap” package version 1.0.10.
Differential Gene Expression Analysis
To identify differentially expressed immune genes between AA and Caucasian cancers, we used the “limma” package in R [33]. Significant differential expression was defined as absolute log2-fold change > 1.5 with Bonferroni-adjusted p-value < 0.05. In this analysis, we included 749 of 770 annotated genes from the NanoString IO360 panel [34] that had available RNA-seq data (Supplementary Table 1).
TIL Counts, Immunomodulatory Scores, and TNBC Subtypes
Stromal (percent-area of stroma) and total (percent-area of whole-section) TIL counts for TCGA TNBC cases with race annotation (Supplementary Table 2) were obtained from previously published datasets [35-37]. Previously published TNBC immunomodulatory scores and refined-Vanderbilt TNBC subtypes (basal-like 1, basal-like 2, luminal androgen receptor, and mesenchymal) for TCGA TNBC cases were also compared between races [35].
Measuring genomic aberrations and clonality
Gene-level somatic mutation data were obtained from Ciriello et al [27]. Mutation load was calculated as the number of somatic mutations in a sample, normalized by the total length of sequences with adequate read coverage (>30X). Predicted neoantigen load data was taken from a previous publication [14]. We assessed mutational heterogeneity using the Mutant-Allele Tumor Heterogeneity (MATH) score, which uses the standardized variance of the variant allele frequency distribution of somatic mutations to approximate clonal heterogeneity [38]. Overall deletion load was defined as the number of genes with GISTIC value of “−2”, and amplification load was defined as the number of genes with GISTIC value of “+2”, indicating definite deletion or amplification of a given segment, respectively. All genomic features were log2-transformed for visualization and statistical analysis. The availability of gene expression data for each metric is summarized in Supplementary Table 2.
Statistical Analysis
All statistical analyses were performed in R version 3.5.0. The Wilcoxon Rank Sum test was used to compare patient characteristics, immune measures and genomic aberrations between the AA and Caucasian cohorts. P-values are listed in Supplementary Table 3. Student’s t-test was used to compare normally distributed TIDE scores and CIBERSORT immune cell populations. Chi-Square was employed for the comparison categorical variables. Statistical tests were two-sided, and p < 0.05 was considered significant. P-values were adjusted for multiple comparisons using the Bonferroni method.
Results
Comparison of immune cell functions and sub-populations by race in all breast cancer subtypes combined
Patient characteristics are summarized in Table 1. The proportion of TNBC was higher in the AA cohort compared to the Caucasian cohort (35.8% vs 16.4%; p=1.78e-07), while the proportion of ER-positive cancers was higher in the Caucasian group (65.7% vs 50.6%; p=4.21e-04). The distribution of clinical stage by race or within subtypes by race did not vary significantly.
Table 1.
Patient Characteristics
| ALL PATIENTS (n=859) | Caucasian (n=697) | AA (n=162) | p-value |
|---|---|---|---|
| Age (years), median | 59 | 54 | 0.037 |
| Interquartile Range (years) | 49-67 | 47-67 | |
| Clinical subtype, n (%) | 1.81e-07 | ||
| ER+ | 458 (65.7%) | 82 (50.6%) | 4.21e-04 |
| HER2+ | 125 (17.9%) | 22 (13.6%) | 0.204 |
| ER-/HER2- (TNBC) | 114 (16.4%) | 58 (35.8%) | 1.78e-07 |
| Stage, n (%) | 0.379 | ||
| I | 131 (18.8%) | 30 (18.5%) | |
| II | 382 (54.8%) | 93 (57.4%) | |
| III | 163 (23.4%) | 30 (18.5%) | |
| IV | 11(1.6%) | 4 (2.5%) | |
| Not available | 10 (1.4%) | 5 (3.1%) | |
| TNBC ONLY (n=172) | Caucasian (n=114) | AA (n=58) | p-value |
| Age (years), median | 54.5 | 51.5 | 0.839 |
| Interquartile Range (years) | 48-62 | 47-66 | |
| Stage | 0.788 | ||
| I | 22 (19.3%) | 10 (17.2%) | |
| II | 70 (61.4%) | 34 (58.6%) | |
| III | 17 (14.9%) | 12 (20.7%) | |
| IV | 2 (1.8%) | 0 (0%) | |
| Not available | 3 (2.6%) | 2 (3.5%) |
Abbreviations: ER = Estrogen Receptor, HER2 = Human Epidermal Growth Factor Receptor-2, TNBC = Triple-Negative Breast Cancer
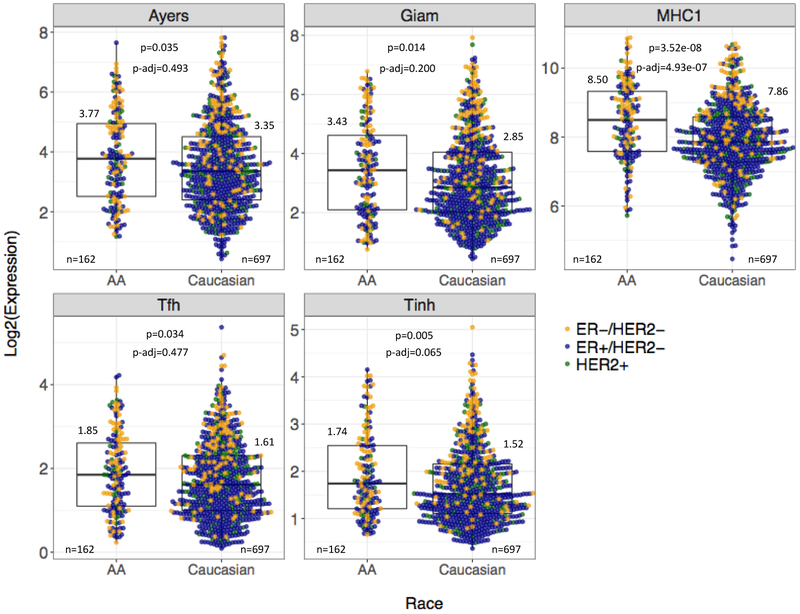
We compared the expression of 14 immune metagenes between AA (n=162) and Caucasian (n=697) patients (Supplementary Table 3). Overall, we observed higher median expression for all immune metagenes in AA cancers. However, only the MHC1, Ayers/T-cell inflamed, Giam, Stat1, Tfh, and Tinh metagenes were nominally statistically significant (Figure 1), and after Bonferroni adjustment, only the MHC1 metagene remained significant (p-adjusted=4.93E-07).
Figure 1. Expression of representative immune metagenes in breast cancer by patient race across all tumor subtypes.
Boxplots summarize the median and IQR expression of five representative immune metagenes by race in the TCGA cohort. All tumor subtypes are included. Log2-transformed median values, available cases (n), Wilcoxon Rank Sum p-values, and Bonferroni adjusted p-values are displayed for each metagene. Colored points represent the log2-transformed, normalized expression of ER-positive, HER2-positive, and TNBC cases for each metagene.
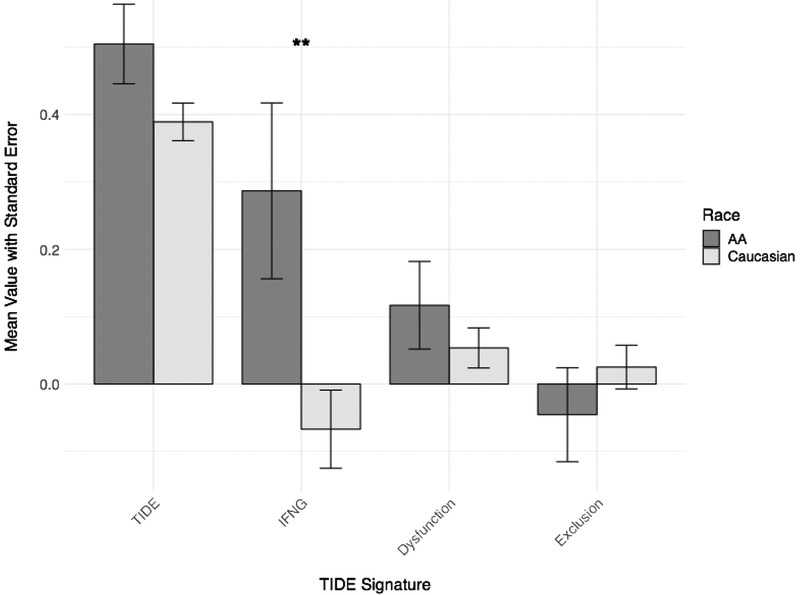
Tumor Immune Dysfunction and Exclusion (TIDE) analysis also showed a numerically higher median TIDE score in AA tumors, suggesting decreased responsiveness to ICB, but the difference did not reach statistical significance (Figure 2). However, one component of the TIDE score, IFN-gamma activation, was significantly higher in AA tumors compared to Caucasian tumors (unadjusted Student t-test p=0.014).
Figure 2. Tumor Immune Dysfunction and Exclusion (TIDE) scores by patient race across all tumor subtypes.
The mean TIDE, IFN-gamma (“IFNG”), T-cell dysfunction (“Dysfunction”), and T-cell exclusion (“Exclusion”) scores are displayed for each race cohort, with error bars representing standard error of the mean. All tumor subtypes are included. The means of AA scores are in dark grey; the means of Caucasian scores are in light grey. **Student’s t-test p=0.014.
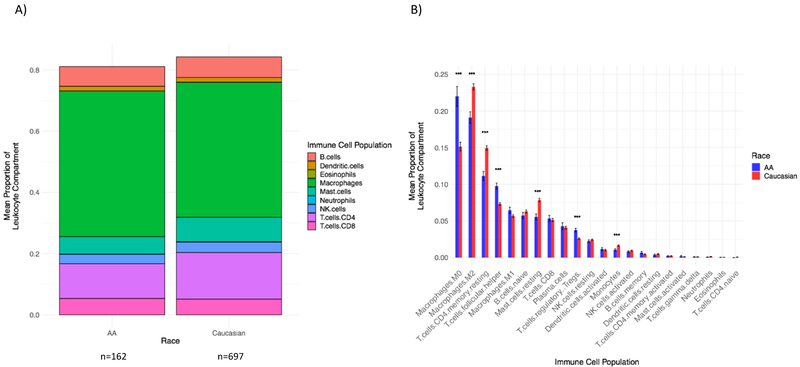
CIBERSORT was used to estimate the proportions of immune cell populations in the tumor microenvironment. In both race groups, the aggregated macrophage population (comprised of Monocytes, M0, M1, and M2 populations) represented the largest proportion of the leukocyte compartment (Figure 3A). After adjusting for multiple comparisons, the mean proportions of M0 macrophages, T-follicular helper, and T-regulatory cells were significantly higher in AA cancers relative to Caucasian breast cancers (p-adjusted=5.87e-06, 1.41e-07, 1.28e-05, respectively), while the mean proportions of M2 macrophages, resting CD4+ memory cells, resting Mast cells, and Monocytes were higher in Caucasian cancers (p-adjusted =3.97e-06, 5.17e-08, 1.16e-06, 5.44e-04, respectively) (Figure 3B). Since AA breast cancers included more TNBC and fewer ER-positive cancers, these differences may be caused by subtype-associated differences in the tumor immune microenvironment. Therefore, next we examined immune variables within molecular subtypes.
Figure 3. Relative proportions of immune cell populations by patient race across all tumor subtypes.
A) Bars display the mean proportions of 9 aggregated immune cell populations. Race is on the x-axis, and the mean proportion of the leukocyte compartment is on the y-axis. All tumor subtypes are included (n=162 AA, n=697 Caucasian). The height of the bars is < 1.0 due to the fact that the mean proportion of each immune cell population was independently calculated, then aggregated. Colors represent individual immune cell populations.
B) Bars display the mean proportions of 22 immune cell populations. Immune cell population is on the x-axis, and the mean proportion of the leukocyte component, with standard error of the mean, is on the y-axis. All tumor subtypes are included. The mean of AA patients is in blue; the mean of Caucasian patients is in red. All p-values are Bonferroni adjusted. *** = statistical significance by Student’s t-test p<0.005: Macrophages M0 p-adjusted=5.87e-06, Macrophages M2 p-adjusted=3.97e-06, T cells CD4+ memory resting p-adjusted=5.17e-08, T cells follicular helper p-adjusted=1.41e-07, Mast cells resting p-adjusted=1.16e-06, T cells regulatory p-adjusted=1.28e-05, Monocytes p-adjusted=5.44e-04.
Comparison of immune cell functions and sub-populations by race and breast cancer subtype
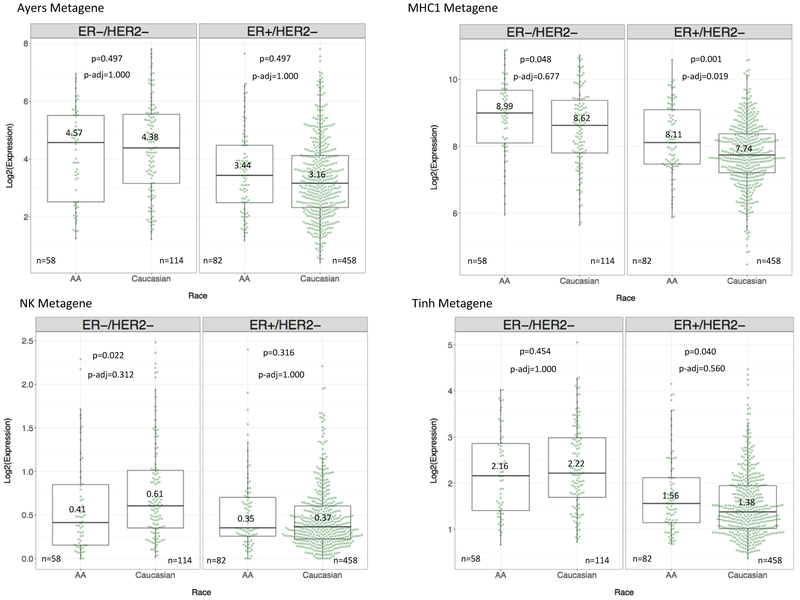
We next compared immune metagene expression between AA and Caucasian within the TNBC and ER-positive subtypes. HER2-positive cases were excluded from these analyses due to the heterogeneity of HER2-positive cancers that include both ER-positive and -negative subsets that continue to express the typical molecular features of their respective ER status. When TNBC cases were analyzed by race, 10 of 14 metagenes had lower median expression in AA (n=58) compared to Caucasian (n=114) cancers, whereas the MHC1 metagene showed higher median expression in AA cases. However, after Bonferroni adjustment, these differences were no longer significant (Figure 4). This suggests that no major immune differences exist in TNBC by race as measured by immune metagene expression.
Figure 4. Differential expression of representative immune metagenes by patient race and individual tumor subtype.
Boxplots demonstrate the median and IQR expression of four representative immune metagenes, grouped by tumor subtype and patient race. TNBC cases are in the left panel and ER-positive cases in the right panel. Race is on the x-axis, and log2-transformed, normalized expression of the metagene is on the y-axis. Log2-transformed median values, available cases (n), Wilcoxon Rank Sum p-values, and Bonferroni adjusted p-values are displayed for each metagene.
ER-positive cancers from AA patients (n=82) had significantly higher median expression of the MHC1 metagene relative to Caucasian cancers (n=458) (p-adjusted=0.019). This explains the overall higher MHC1 metagene expression in AA patients when all breast cancer subtypes were combined (see results above).
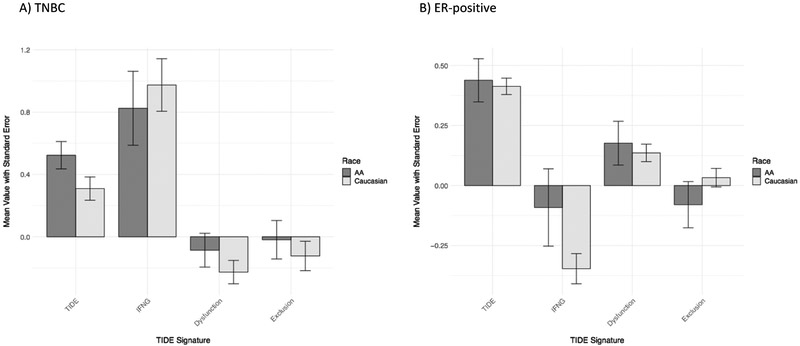
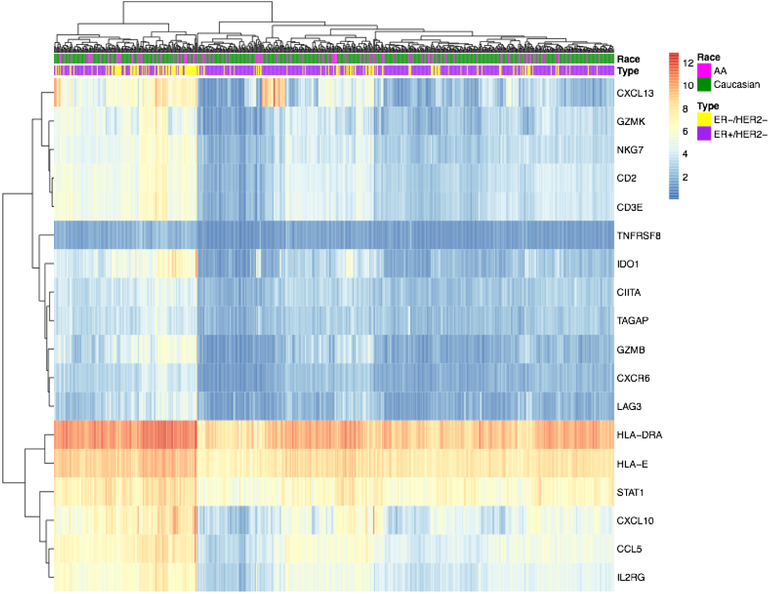
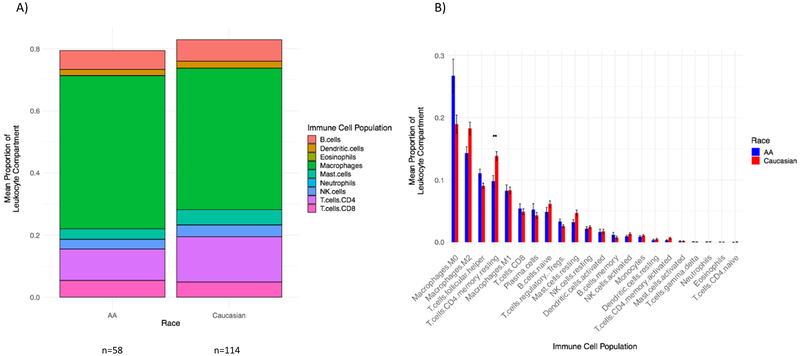
The mean TIDE scores and the Ayers/T-cell inflamed metagene scores were similar between AA and Caucasian TNBC and between AA and Caucasian ER-positive cancers, suggesting no difference in ICB sensitivity by race (Figure 5). Both AA and Caucasian IFN-gamma signatures, measured by TIDE, were numerically higher in TNBC vs. ER-positive cancers. Likewise, in a heatmap of Ayers gene member expression, TNBC cases, irrespective of race, tended to cluster with highly expressed genes in the signature (Figure 6). CIBERSORT analysis showed that the aggregated macrophage population represented the largest proportion of the leukocyte compartment in TNBC in both race cohorts (Figure 7A). The proportion of resting CD4+ memory cells was significantly higher in Caucasian TNBC compared to AA TNBC (p-adjusted=0.014), (Figure 7B).
Figure 5. Tumor Immune Dysfunction and Exclusion (TIDE) scores by patient race and tumor subtype.
The mean TIDE, IFN-gamma (“IFNG”), T-cell dysfunction (“Dysfunction”), and T-cell exclusion (“Exclusion”) scores are displayed for each race cohort with error bars representing standard error of the mean. The means of AA scores are in dark grey; the means of Caucasian scores are in light grey. A) Signatures for TNBC cases only, B) Signatures for ER-positive cases only.
Figure 6. Expression of Ayers metagene member genes, clustered by rows and columns and annotated by patient race and tumor subtype.
Heatmap displaying the clustered expression of the genes in the Ayers metagene (n=18), annotated by patient race and tumor subtype. Columns represent patients, with pink (AA) vs. green (Caucasian) reflecting patient race and yellow (TNBC) vs. purple (ER-positive) reflecting tumor subtype. Rows represent individual genes, with normalized expression level represented from blue (low expression) to red (high expression). The heatmap is clustered by rows and columns.
Figure 7. Relative proportions of immune cell populations by patient race in TNBC cases alone.
A) Bars display the mean proportions of 9 aggregated immune cell populations. Race is on the x-axis, and the mean proportion of the leukocyte compartment is on the y-axis. Only TNBC cases are included (n=58 AA, n=114 Caucasian). The height of the bars is < 1.0 due to the fact that the mean proportion of each immune cell population was independently calculated, then aggregated. Colors represent individual immune cell populations.
B) Bars display the mean proportions of 22 immune cell populations. Immune cell population is on the x-axis, and the mean proportion of the leukocyte component, with standard error of the mean, is on the y-axis. All tumor subtypes are included. The mean of AA patients is in blue; the mean of Caucasian patients is in red. All p-values are Bonferroni adjusted for FDR. ** = statistical significance by Student’s t-test p<0.05: T cells CD4+ memory resting p-adjusted=0.014.
We also compared immune metagene expression differences between breast cancer subtypes within each race cohort separately. In AA patients, TNBC (n=58) demonstrated higher median expression of the MHC1 (p-adjusted=0.005) and STAT1 (p-adjusted=4.79e-04) metagenes relative to ER-positive cancers (n=82). In Caucasian patients, TNBC (n=114) demonstrated higher median expression of 11 of 14 metagenes (with the exception of the Macrophage, MHC2, and T-reg metagenes) relative to ER-positive cancers (n=458). These findings are consistent with multiple earlier reports that showed higher immune infiltration in TNBC compared to ER-positive cancers.
Differentially expressed immune genes between AA and Caucasian patients
Next, we examined immune gene expression differences at the individual gene level for 749 immune-related genes. After Bonferroni adjustment, 141 genes were significantly up-regulated and 125 genes were significantly down-regulated in Caucasian tumors across all subtypes relative to AA tumors (Supplementary Table 4).
When we compared AA and Caucasian TNBC, 13 genes were significantly up-regulated and 12 were significantly down-regulated in Caucasian TNBC relative to AA TNBC. None of these genes had an absolute log-fold-change difference of > 1.5 between races (Supplementary Table 4). The 5 most differentially expressed genes between Caucasian and AA TNBC were APOE, TNFRSF25, TYMP (2.13, 2.06, and 1.9 fold higher in AA TNBC, respectively), MRC1 and TLR3 (2.0 and 1.85 higher in Caucasian TNBC, respectively). When we compared AA and Caucasian ER-positive cancers, we found 88 genes were up-regulated and 82 genes were down-regulated in Caucasian cancers relative to AA cancers. ISG15 was significantly up-regulated in AA ER-positive cancers (3.20 fold-change, p-adjusted=2.5e-10), while C7 was significantly up-regulated in Caucasian ER-positive cancers (2.83 fold-change, p-adjusted=4.51e-03).
Comparison of TIL counts, Immunomodulatory Scores, and Vanderbilt Subtype distribution in TNBC by race
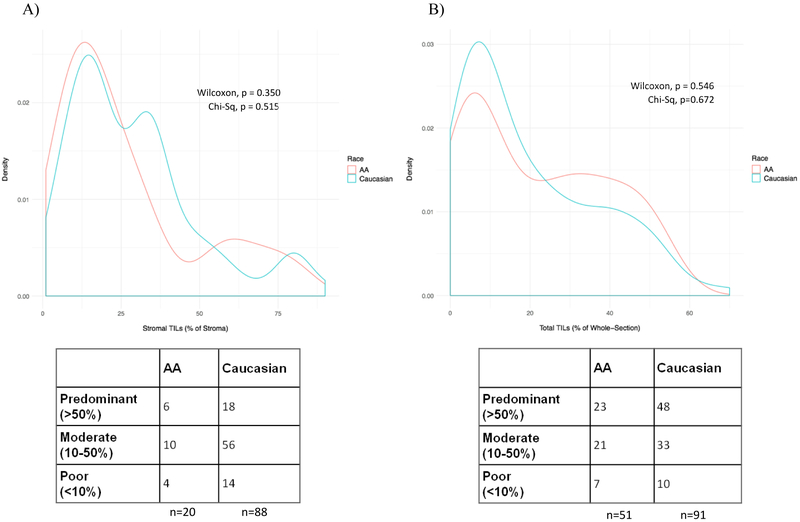
TIL counts were analyzed using two different quantification methods: expressing TILs as percent-area of stroma (n=108) and as percent area of the whole-section (n=142) according to Loi et al [36] and Lehmann et al [35], respectively. In the Loi et al dataset, there were no statistically significant differences between stromal TILs in AA (n=20) and Caucasian (n=88) TNBC cases (Wilcoxon p=0.350, Figure 8A). In the Lehmann et al dataset, we also observed no difference in whole-section mononuclear cell infiltrate by race (AA n=51, Caucasian n=91, Wilcoxon p=0.546, Figure 8B). The distributions of lymphocyte-predominant (>50% TIL), lymphocyte-moderate (10-50% TIL), and lymphocyte-poor (<10% TIL) cases were also not significantly different between races in either dataset (p=0.515 stromal and p=0.672 whole-section).
Figure 8. Stromal and total TIL counts by race in TNBC cases alone.
Density plots display the distributions of TIL counts in TNBC cases by race. Red and blue lines represent AA and Caucasian TNBC, respectively. The corresponding table represents the number of lymphocyte-predominant, lymphocyte-moderate, and lymphocyte-poor cases in each cohort, classified as >50% TIL infiltration, 10-50% TIL infiltration, and <10% TIL infiltration, respectively.
A) Stromal TIL counts from Loi et al are displayed as % of tumor stroma. n=20 AA Caucasian and n=88 Caucasian TNBC were considered. Neither the median stromal TIL counts (Wilcoxon p=0.350) nor the distribution of TIL burden classification (Chi-Square p=0.515) was significantly different between races.
B) Whole-section total TIL counts from Lehmann et al are displayed as % of whole section. n=51 AA Caucasian and n=91 Caucasian TNBC were considered. Neither the median stromal TIL counts (Wilcoxon p=0.546) nor the distribution of TIL burden classification (Chi-Square p=0.672) was significantly different between races.
The distribution of immunomodulatory scores, classified by Lehmann et al [35], was also not significantly different between AA (n=51) and Caucasian (n=91) TNBC patients. Cases with an “intense” immunomodulatory score were few in both the AA and Caucasian cohorts, 14% and 11%, respectively. There was no difference in the distribution of refined-Vanderbilt subtypes between races (p=0.377), with the largest proportion of both AA and Caucasian TNBC classified as basal-like 1 (31% for both race groups).
Comparison of genomic aberration metrics and clonal heterogeneity by race
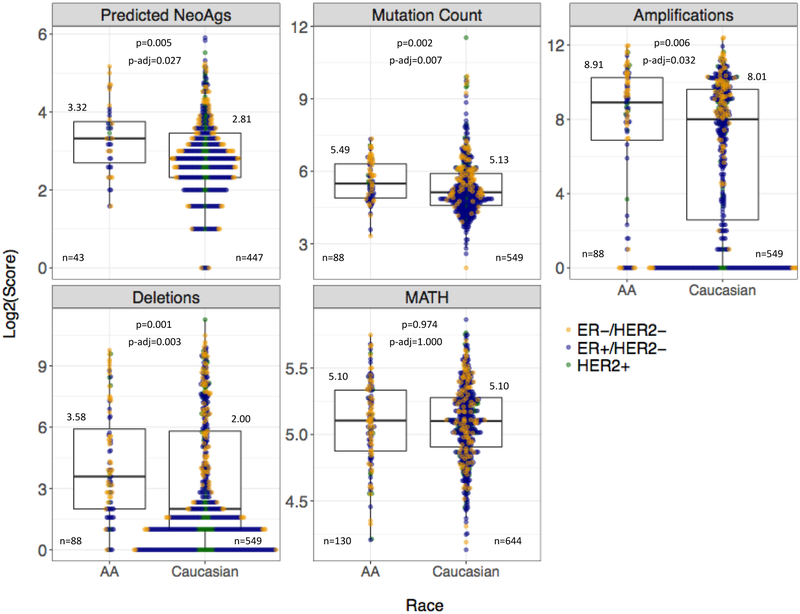
Next, we compared neoantigen, total somatic mutation, deletion, amplification loads, and clonal heterogeneity between AA and Caucasian cancers. Data were available for variable subsets of patients in both race cohorts (Supplementary Table 2). Overall, the neoantigen load was higher in AA compared to Caucasian patients (median=10 vs 7, p-adjusted=0.027) when all subtypes were combined. The somatic mutation burden (AA median=45 vs. Caucasian median=34, p-adjusted=0.007), amplification load (AA median=481 vs. Caucasian median=258, p-adjusted=0.032) and deletion load (AA median=12 vs. Caucasian median=4, p-adjusted=0.003) were higher in AA cases (Figure 9). All these genomic derangement metrics were significantly higher in TNBC compared to ER-positive cancers (Supplementary Table 3). When TNBC and ER-positive subtypes were compared separately between AA and Caucasian cohorts, these racial differences disappeared, indicating that the apparent racial difference across all subtypes was driven by the higher proportion of TNBC among AA patients. We also compared estimates of clonal heterogeneity captured by the MATH score and found no significant differences between AA and Caucasian patients overall or within individual tumor subtypes.
Figure 9. Comparison of genomic aberrations and clonal heterogeneity by race across all tumor subtypes.
Boxplots demonstrate the median and IQR scores of four genomic aberration measures and the MATH clonal heterogeneity score, grouped by race cohort. All tumor subtypes are included. Race is on the x-axis; log2-transformed score of the measure is on the y-axis. Log2-transformed median values, available cases (n), Wilcoxon Rank Sum p-values, and Bonferroni adjusted p-values are displayed for each measure. Colored points represent the log2-transformed scores of ER-positive, HER2-positive, and TNBC cases for each genomic metric. Abbreviations: Predicted NeoAgs = Predicted Neoantigens, MATH = Mutant-Allele Tumor Heterogeneity.
Discussion
In this paper, we examined immunological differences, measured by immune gene mRNA expression and TIL counts, between breast cancers of AA and Caucasian patients in the TCGA. We sought to detect race-associated differences in the immune microenvironment of TNBC, where immune infiltration has been shown to have prognostic and chemotherapy response predictive functions.
We found no statistically significant difference in TIL counts, TIL distribution, molecular subtype distribution, or immunomodulatory scores between AA and Caucasian TNBC. Unfortunately, these analyses were limited by the small number of TCGA cases with race, TIL, and subtype annotation. There were many more cancers with available mRNA expression data, and analysis of immune metagenes and immunotherapy predictive gene signatures yielded more nuanced results, which suggested small, but potentially important differences. Overall, almost all immune metagenes had higher expression in AA compared to Caucasian breast cancers, and this reached significance for the MHC1 metagene. The higher overall expression of immune genes in AA across all subtypes is likely driven by the higher proportion of TNBC in the AA patient cohort, as TNBC in general contains more inflammatory cells. When patients with TNBC were analyzed separately by race, 10 of the 14 metagenes had lower expression in AA patients, suggesting at trend for lower immune activity in AA TNBC (n=58) compared to Caucasian TNBC (n=114). In contrast, ER-positive cancers showed higher expression of 11 of 14 immune metagenes in AA compared to Caucasian patients, with significantly higher expression of MHC1 metagene (p-adjusted=0.019). These results suggest subtle immunological differences between breast cancers in AA and Caucasian patients, but larger data sets will be required to validate these differences.
Racial differences in MHC1 metagene expression may relate to recent findings that germline HLA-I genotypes influence anti-tumor immunity. Chowell et al [39] found that maximal heterozygosity at HLA-I loci, as well as the presence of HLA-B44 superfamily alleles, improved patients’ overall survival after immune checkpoint therapy. A more diverse set of HLA-I molecules from a heterozygous individual is predicted to present a larger repertoire of tumor-derived neoantigens to cytotoxic T-cells, resulting in a more robust immune response. Racial differences in the distributions of HLA-I types have been well-described; in one study, AA participants had higher rates of heterozygosity at all HLA-I loci compared to Caucasian participants, but the HLA-B44*02 allele (a member of the B44 superfamily) was more frequent in Caucasian participants [40]. These differences potentially reflect that immune adaptations suited to ancestral environments differentially influence anti-tumor immunity following immunotherapy and are important areas of future investigation.
A recent study of AA and Caucasian cases from the TCGA, along with 194 Nigerian breast cancer cases, also found only modest racial differences in mRNA immune gene expression [41]. More significant molecular differences were detected at the DNA level, with increased homologous recombination deficiency and more frequent TP53 mutations in Nigerian, ER-positive breast cancers compared to ER-positive cancers in Caucasian patients in the US. Also pointing to racial differences at the somatic DNA level, two previous studies detected more varied and more frequent somatic mutations in AA TNBC than in European-descent TNBC, suggesting more genomic instability in AA cancers [42, 43]. Given these findings, further profiling of germline and somatic aberrations in AA TNBC and the interplay with the tumor immune microenvironment is warranted.
Pitt et al [41] found enriched IFN-gamma activation in Nigerian and AA ER-positive cancers and increased macrophage infiltration in the Nigerian basal-like TNBC. Our study demonstrated no significant difference in IFN-gamma activation, reflected by the TIDE scores, between AA and Caucasian TNBC; however, the TIDE-estimated IFN-gamma score was higher in AA tumors across all subtypes. This difference appears to be driven by a low expression of IFN-gamma in Caucasian ER-positive cancers. Nonetheless, neither the overall TIDE score nor the Ayers metagene score was significantly higher in AA tumors of any subtype, suggesting that the higher IFN-gamma signature measured by TIDE did not translate to higher predicted benefit from immune checkpoint therapy. In another study, an interferon gene signature that was observed to be upregulated in AA prostate cancers was also found to be upregulated in the AA breast cancer microenvironment [44].
CIBERSORT deconvolution allowed us to infer the relative proportions of immune cell populations in AA and Caucasian TNBC. We detected significantly increased proportions of T-regulatory cells and M0 macrophages in AA tumors across all subtypes. However, these differences did not meet statistical significance in AA TNBC compared to Caucasian TNBC. These findings are discordant with a previous CIBERSORT analysis that found a higher proportion of T-regulatory cells in AA TNBC/basal subtype cancers [45]. Interestingly, tumoral expression of MHC1 genes has been shown to augment T-regulatory cell function, and we did observe enrichment of MHC1expression in AA cancers relative to Caucasian cancers [46].
When differential gene expression analyses on the TNBC cases was performed, we found that APOE, encoding Apolipoprotein E, was the most differentially expressed gene between AA and Caucasian TNBC, with 2.13-fold higher expression in AA TNBC. A recent study demonstrated that ApoE signaling mediates levels of circulating myeloid-derived suppressor cells (MDSC), an immunosuppressive innate cell population, and in turn, T-cell activation and immunotherapy efficacy in cancer models [47]. We observed no significant difference in T-cell activation or T-cell exclusion (estimated in part by MDSC abundance) between AA and Caucasian TNBC. Nonetheless, the degree of lipoprotein signaling and the effects on T-cell activation in the tumor microenvironment may be an important distinguishing factor between AA and Caucasian TNBC biology.
In conclusion, we found no large scale immunogenic differences between AA and Caucasian TNBC based on gene expression analysis. Overall, we observed a trend towards lower immune gene expressions in AA TNBC, but this did not reach statistical significance for most immune metrics. The power of our analyses is limited by the relatively small number of AA TNBC in the TCGA. Molecular, histologic and outcome data from the large, ongoing neoadjuvant and adjuvant trials (, , ) will be required to answer the question of whether subtle, race-associated differences in the tumor immune microenvironment influence clinical outcome.
Supplementary Material
Gene members and expression data availability for immune gene expression measures.
Number of available cases for gene expression, TIL, and genomic analyses.
Statistical analyses of metagene expression and genomic metrics by race and tumor subtype.
Differentially expressed immune genes between AA and Caucasian breast cancer subtypes.
Acknowledgments
Funding: This research was supported by an NCI R01 grant (R01CA219647) to L.P.
Footnotes
Conflicts of Interest: Tess O’Meara declares she has no conflict of interest. Anton Safonov declares he has no conflict of interest. David Casadevall declares he has no conflict of interest. Tao Qing declares he has no conflict of interest. Andrea Silber has received remuneration from Astra Zeneca. Brigid Killelea declares she has no conflict of interest. Christos Hatzis is now an employee of Bristol-Myers Squibb Co. Lajos Pusztai has received consulting fees and honoraria from Merck, Astra Zeneca, Novartis, Seattle Genetics, Pfizer, and Almac.
Ethical Approval: This article does not contain studies with human participants or animals performed by any of the authors.
Informed Consent: No informed consent was needed for this study. Human subjects were not involved.
References
- 1.DeSantis C, et al. , Breast cancer statistics, 2013. CA: A Cancer Journal for Clinicians, 2014. 64(1): p. 52–62. [DOI] [PubMed] [Google Scholar]
- 2.DeSantis CE, et al. , Breast cancer statistics, 2015: Convergence of incidence rates between black and white women. CA: A Cancer Journal for Clinicians, 2016. 66(1): p. 31–42. [DOI] [PubMed] [Google Scholar]
- 3.Stark A, et al. , African ancestry and higher prevalence of triple-negative breast cancer. Cancer, 2010. 116(21): p. 4926–4932. [DOI] [PMC free article] [PubMed] [Google Scholar]
- 4.Dietze Eric C., C.S., Miranda-Carboni Gustavo, O'Regan Ruth & Seewaldt Victoria L., Triple-negative breast cancer in African-American women: disparities versus biology. Nature Reviews Cacer, 2015. 15: p. 248–254. [DOI] [PMC free article] [PubMed] [Google Scholar]
- 5.Shinde SS, et al. , Higher parity and shorter breastfeeding duration. Cancer, 2010. 116(21): p. 4933–4943. [DOI] [PubMed] [Google Scholar]
- 6.Liedtke C, G.-A.A., Pusztai L, Definition of triple-negative breast cancer and relationship to basal-like molecular subtype . PPO Updates: Principles and Practice of Oncology. Ed(s) DeVita VT Jr., Lawrence TS, Rosenberg SA. Lippincott Williams & Wilkins: New York, 2010: p. 1–6. [Google Scholar]
- 7.Dezheng Huo M, PhD; Hu Hai, PhD; Rhie Suhn K., PhD; Gamazon Eric R., PhD; Cherniack Andrew D., PhD; Liu Jianfang, MS; Yoshimatsu Toshio F., BA; Pitt Jason J., BA; Hoadley Katherine A., PhD; Troester Melissa, PhD; Ru Yuanbin, PhD; Lichtenberg Tara, BA; Sturtz Lori A., PhD; Shelley Carl S., DPhil; Benz Christopher C., MD; Mills Gordon B., MD, PhD; Laird Peter W., PhD; Shriver Craig D., MD; Perou Charles M., PhD; Olopade Olufunmilayo I., MBBS, Comparison of Breast Cancer Molecular Features and Survival by African and European Ancestry in The Cancer Genome Atlas. JAMA Oncology, 2017. 3(12): p. 1654–1662. [DOI] [PMC free article] [PubMed] [Google Scholar]
- 8.Killelea BK, et al. , Racial Differences in the Use and Outcome of Neoadjuvant Chemotherapy for Breast Cancer: Results From the National Cancer Data Base. Journal of Clinical Oncology, 2015. 33(36): p. 4267–4276. [DOI] [PubMed] [Google Scholar]
- 9.Karn T, et al. , The Influence of Host Factors on the Prognosis of Breast Cancer: Stroma and Immune Cell Components as Cancer Biomarkers. Curr Cancer Drug Targets, 2015. 15(8): p. 652–64. [DOI] [PubMed] [Google Scholar]
- 10.Bianchini G, et al. , Molecular Anatomy of Breast Cancer Stroma and Its Prognostic Value in Estrogen Receptor–Positive and –Negative Cancers. Journal of Clinical Oncology, 2010. 28(28): p. 4316–4323. [DOI] [PubMed] [Google Scholar]
- 11.Adams S, et al. , Prognostic Value of Tumor-Infiltrating Lymphocytes in Triple-Negative Breast Cancers From Two Phase III Randomized Adjuvant Breast Cancer Trials: ECOG 2197 and ECOG 1199. Journal of Clinical Oncology, 2014. 32(27): p. 2959–2966. [DOI] [PMC free article] [PubMed] [Google Scholar]
- 12.Wimberly H, et al. , PD-L1 Expression Correlates with Tumor-Infiltrating Lymphocytes and Response to Neoadjuvant Chemotherapy in Breast Cancer. Cancer Immunology Research, 2015. 3(4): p. 326–332. [DOI] [PMC free article] [PubMed] [Google Scholar]
- 13.Efremova Mirjana, F.F., 1 Rieder Dietmar,1 and Trajanoski Zlatko, Neoantigens Generated by Individual Mutations and Their Role in Cancer Immunity and Immunotherapy. Frontiers in Immunology, 2017. 8: p. 1679. [DOI] [PMC free article] [PubMed] [Google Scholar]
- 14.Safonov A, et al. , Immune Gene Expression Is Associated with Genomic Aberrations in Breast Cancer. Cancer Research, 2017. 77(12): p. 3317–3324. [DOI] [PubMed] [Google Scholar]
- 15.Thomas Karn PTJ, PhD2; Hatzis Christos, PhD2; Sänger Nicole, MD1; El-Balat Ahmed, MD1; Rody Achim, MD3; Holtrich Uwe, PhD1; Becker Sven, MD1; Bianchini Giampaolo, MD4; Pusztai Lajos, MD, Association Between Genomic Metrics and Immune Infiltration in Triple-Negative Breast Cancer. JAMA Oncology, 2017. 3(12): p. 1707–1711. [DOI] [PMC free article] [PubMed] [Google Scholar]
- 16.Jiang T, et al. , Predictors of Chemosensitivity in Triple Negative Breast Cancer: An Integrated Genomic Analysis. PLOS Medicine, 2016. 13(12): p. el002193. [DOI] [PMC free article] [PubMed] [Google Scholar]
- 17.McGranahan N, et al. , Clonal neoantigens elicit T cell immunoreactivity and sensitivity to immune checkpoint blockade. Science, 2016. 351(6280): p. 1463. [DOI] [PMC free article] [PubMed] [Google Scholar]
- 18.Gejman RS, et al. , Rejection of immunogenic tumor clones is limited by clonal fraction. eLife, 2018. 7: p. e41090. [DOI] [PMC free article] [PubMed] [Google Scholar]
- 19.Rody A, et al. , T-cell metagene predicts a favorable prognosis in estrogen receptor-negative and HER2-positive breast cancers. Breast Cancer Research, 2009. 11(2): p. R15. [DOI] [PMC free article] [PubMed] [Google Scholar]
- 20.Callari M, et al. , Subtype-Specific Metagene-Based Prediction of Outcome after Neoadjuvant and Adjuvant Treatment in Breast Cancer. Clinical Cancer Research, 2016. 22(2): p. 337–345. [DOI] [PubMed] [Google Scholar]
- 21.Denkert C, et al. , Tumor-associated lymphocytes as an independent predictor of response to neoadjuvant chemotherapy in breast cancer. J Clin Oncol, 2010. 28(1): p. 105–13. [DOI] [PubMed] [Google Scholar]
- 22.Esteva FJ, et al. , CD40 signaling predicts response to preoperative trastuzumab and concomitant paclitaxel followed by 5-fluorouracil, epirubicin, and cyclophosphamide in HER-2-overexpressing breast cancer. Breast Cancer Res, 2007. 9(6): p. R87. [DOI] [PMC free article] [PubMed] [Google Scholar]
- 23.Lennerz V, et al. , The response of autologous T cells to a human melanoma is dominated by mutated neoantigens. Proc Natl Acad Sci USA, 2005. 102(44): p. 16013–8. [DOI] [PMC free article] [PubMed] [Google Scholar]
- 24.Heemskerk B, Kvistborg P, and Schumacher TN, The cancer antigenome. Embo j, 2013. 32(2): p. 194–203. [DOI] [PMC free article] [PubMed] [Google Scholar]
- 25.Brown SD, et al. , Neo-antigens predicted by tumor genome meta-analysis correlate with increased patient survival. Genome Res, 2014. 24(5): p. 743–50. [DOI] [PMC free article] [PubMed] [Google Scholar]
- 26.Hsiao TH, et al. , Identification of genomic functional hotspots with copy number alteration in liver cancer. EURASIP J Bioinform Syst Biol, 2013. 2013(1): p. 14. [DOI] [PMC free article] [PubMed] [Google Scholar]
- 27.Ciriello G, et al. , Comprehensive Molecular Portraits of Invasive Lobular Breast Cancer. Cell, 2015. 163(2): p. 506–519. [DOI] [PMC free article] [PubMed] [Google Scholar]
- 28.Rooney Michael S., S.A.S., Wu Catherine J., Getz Gad, and Hacohen Nir, Molecular and Genetic Properties of Tumors Associated with Local Immune Cytolytic Activity. Cell, 2015. 160: p. 48–61. [DOI] [PMC free article] [PubMed] [Google Scholar]
- 29.Ayers Mark, J.L., Nebozhyn Michael, Murphy Erin, Loboda Andrey, Kaufman David R., Albright Andrew, Cheng Jonathan D., Kang S. Peter, Shankaran Veena, Piha-Paul Sarina A., Yearley Jennifer, Seiwert Tanguy Y., Ribas Antoni, McClanahan Terrill K., IFN-γ-related mRNA profile predicts clinical response to PD-1 blockade. Journal of Clinical Investigation, 2017. 127(8): p. 2930–2940. [DOI] [PMC free article] [PubMed] [Google Scholar]
- 30.Jiang Peng, S.G., Pan Deng, Fu Jingxin, Sahu Avinash, Hu Xihao, Li Ziyi, Traugh Nicole, Bu Xia, Li Bo, Liu Jun, Freeman Gordon J., Brown Myles A., Wucherpfennig Kai W. & Liu X. Shirley Signatures of T cell dysfunction and exclusion predict cancer immunotherapy response. Nature Medicine, 2018. doi: 10.1038/s41591-018-0136-1. [DOI] [PMC free article] [PubMed] [Google Scholar]
- 31.Newman AM, et al. , Robust enumeration of cell subsets from tissue expression profiles. Nature Methods, 2015. 12: p. 453. [DOI] [PMC free article] [PubMed] [Google Scholar]
- 32.Thorsson V, et al. , The Immune Landscape of Cancer. Immunity, 2018. 48(4): p. 812–830.e14. [DOI] [PMC free article] [PubMed] [Google Scholar]
- 33.Ritchie ME, et al. , limma powers differential expression analyses for RNA-sequencing and microarray studies. Nucleic acids research, 2015. 43(7): p. e47–e47. [DOI] [PMC free article] [PubMed] [Google Scholar]
- 34.Cesano A and Warren S, Bringing the next Generation of Immuno-Oncology Biomarkers to the Clinic. Biomedicines, 2018. 6(1): p. 14. [DOI] [PMC free article] [PubMed] [Google Scholar]
- 35.Lehmann BD, et al. , Refinement of Triple-Negative Breast Cancer Molecular Subtypes: Implications for Neoadjuvant Chemotherapy Selection. PLOS ONE, 2016. 11(6): p. e0157368. [DOI] [PMC free article] [PubMed] [Google Scholar]
- 36.Loi S, et al. , RAS/MAPK Activation Is Associated with Reduced Tumor-Infiltrating Lymphocytes in Triple-Negative Breast Cancer: Therapeutic Cooperation Between MEK and PD-1/PD-L1 Immune Checkpoint Inhibitors. Clinical Cancer Research, 2016. 22(6): p. 1499. [DOI] [PMC free article] [PubMed] [Google Scholar]
- 37.Luen S, et al. , The genomic landscape of breast cancer and its interaction with host immunity. The Breast, 2016. 29: p. 241–250. [DOI] [PubMed] [Google Scholar]
- 38.Mroza Edmund A., J.W.R., MATH, a novel measure of intratumor genetic heterogeneity, is high in poor-outcome classes of head and neck squamous cell carcinoma. Oral Oncology, 2013. 49(3): p. 211–215. [DOI] [PMC free article] [PubMed] [Google Scholar]
- 39.Chowell D, et al. , Patient HLA class I genotype influences cancer response to checkpoint blockade immunotherapy. Science (New York, N.Y.), 2018. 359(6375): p. 582–587. [DOI] [PMC free article] [PubMed] [Google Scholar]
- 40.Cao K, et al. , Analysis of the frequencies of HLA-A, B, and C alleles and haplotypes in the five major ethnic groups of the United States reveals high levels of diversity in these loci and contrasting distribution patterns in these populations. Human Immunology, 2001. 62(9): p. 1009–1030. [DOI] [PubMed] [Google Scholar]
- 41.Pitt JJ, et al. , Characterization of Nigerian breast cancer reveals prevalent homologous recombination deficiency and aggressive molecular features. Nature Communications, 2018. 9(1): p. 4181. [DOI] [PMC free article] [PubMed] [Google Scholar]
- 42.Chang C-S, et al. , Genomic analysis of racial differences in triple negative breast cancer. Genomics, 2018. [DOI] [PubMed] [Google Scholar]
- 43.Keenan T, et al. , Comparison of the Genomic Landscape Between Primary Breast Cancer in African American Versus White Women and the Association of Racial Differences With Tumor Recurrence. Journal of Clinical Oncology, 2015. 33(31): p. 3621–3627. [DOI] [PMC free article] [PubMed] [Google Scholar]
- 44.Martin DN, et al. , Differences in the tumor microenvironment between African-American and European-American breast cancer patients. PLoS One, 2009. 4(2): p. e4531. [DOI] [PMC free article] [PubMed] [Google Scholar]
- 45.Elkhanany A, Katsuta E, and Takabe K, Racial disparity in breast cancer immune microenvironment. Journal of Clinical Oncology, 2018. 36(15_suppl): p. 1081–1081. [Google Scholar]
- 46.Mu J, et al. , Regulation of MHC Class I Expression by Foxp3 and Its Effect on Regulatory T Cell Function. The Journal of Immunology, 2014. 192(6): p. 2892. [DOI] [PMC free article] [PubMed] [Google Scholar]
- 47.Tavazoie MF, et al. , LXR/ApoE Activation Restricts Innate Immune Suppression in Cancer. Cell, 2018. 172(4): p. 825–840.e18. [DOI] [PMC free article] [PubMed] [Google Scholar]
Associated Data
This section collects any data citations, data availability statements, or supplementary materials included in this article.
Supplementary Materials
Gene members and expression data availability for immune gene expression measures.
Number of available cases for gene expression, TIL, and genomic analyses.
Statistical analyses of metagene expression and genomic metrics by race and tumor subtype.
Differentially expressed immune genes between AA and Caucasian breast cancer subtypes.


