

Abstract
In a series of human functional magnetic resonance imaging experiments, we systematically manipulated point-light stimuli to identify the contributions of the various areas implicated in biological motion processing (for review, see Giese and Poggio, 2003). The first experiment consisted of a 2 × 2 factorial design with global shape and kinematics as factors. In two additional experiments, we investigated the contributions of local opponent motion, the complexity of the portrayed movement and a one-back task to the activation pattern. Experiment 1 revealed a clear separation between shape and motion processing, resulting in two branches of activation. A ventral region, extending from the lateral occipital sulcus to the posterior inferior temporal gyrus, showed a main effect of shape and its extension into the fusiform gyrus also an interaction. The dorsal region, including the posterior inferior temporal sulcus and the posterior superior temporal sulcus (pSTS), showed a main effect of kinematics together with an interaction. Region of interest analysis identified these interaction sites as the extrastriate and fusiform body areas (EBA and FBA). The local opponent motion cue yielded only little activation, limited to the ventral region (experiment 3). Our results suggest that the EBA and the FBA correspond to the initial stages in visual action analysis, in which the performed action is linked to the body of the actor. Moreover, experiment 2 indicates that the body areas are activated automatically even in the absence of a task, whereas other cortical areas like pSTS or frontal regions depend on the complexity of movements or task instructions for their activation.
Introduction
Perceiving the actions and intentions of conspecifics is of fundamental importance in our everyday life. As a result, the human visual system is tremendously sensitive to subtle details in human movements, even in highly impoverished stimuli such as point-light walkers (for review, see Blake and Shiffrar, 2007). These stimuli, initially developed by Johansson (1973), convey human actions by presenting only a few points of light moving as if attached to the principal joints of the person. Functional magnetic resonance imaging (fMRI) experiments contrasting intact point-light walker with scrambled versions of the same animations, revealed activations in a number of areas inside and outside the visual pathway. Among these (Fig. 1), an area located in the posterior part of the superior temporal sulcus (pSTS) has been most consistently reported (Howard et al., 1996; Grossman et al., 2000; Grèzes et al., 2001; Vaina et al., 2001; Beauchamp et al., 2003; Saygin et al., 2004; Peuskens et al., 2005). This has led to the conclusion that the posterior STS is the main area involved in the processing of articulated body movements (Vaina et al., 2001; Beauchamp et al., 2002; Grossman and Blake, 2002). However, this area has also been implicated in social perception and the perception of intentional actions (Castelli et al., 2000; Grèzes et al., 2004; Pelphrey et al., 2004; Schultz et al., 2004). Saxe et al. (2004) have even speculated that the differential responses to biological motion (BM) observed in the pSTS might reflect an epiphenomenon given the fact that several point-light stimuli portrayed intentional actions.
Figure 1.

Meta-analysis of studies investigating biological motion processing. Activated areas for the contrast full biological motion versus scrambled biological motion projected onto a rendered right hemisphere and the posterior part of the flattened cortical surface of the PALS atlas. Outlines of areas V1, V2, and V3 are based on a cytoarchitectonic study by Amunts et al. (2000) and functional imaging work by Press et al. (2001). The colored symbols (see inset) indicate the stereotaxic position of the local maxima and their respective labels, as reported in the following studies: Grossman et al. (2000), Grèzes et al. (2001), Vaina et al. (2001), Grossman and Blake (2002), Beauchamp et al. (2003), Santi et al. (2003), Grossman et al. (2004), Saygin et al. (2004), Michels et al. (2005), Peuskens et al. (2005), Peelen et al. (2006), and Pyles et al. (2007). Colored voxels exceed the p < 0.001 uncorrected threshold (fixed-effects analysis) for the subtraction full compared with scrambled biological motion in experiment 2, in which subjects performed a one-back task on biological motion displays portraying complex actions. These conditions of our experiments are most similar to those of the previous studies quoted. Scale and anatomical axes are indicated. FFA, Fusiform face area; OTS, occipito-temporal sulcus.
More recently, the extrastriate and fusiform body areas (EBA and FBA) have been shown to be involved in the processing of biological motion. Peelen et al. (2006) proposed that, in contrast to the pSTS, these areas would respond to the presence of the body form in the point-light displays, ignoring the patterns of changing posture during biological actions. Yet the EBA mostly overlaps with the human MT complex, an area strongly involved in motion processing (Downing et al., 2001).
A third question concerns the cues used to extract biological motion from point-light displays. In a theoretical model by Giese and Poggio (2003), biological motion recognition is based on the integration of shape and motion cues processed in two separate streams. In contrast, a different model by Lange and Lappe (2006) proposes that solely shape information is needed to achieve perfect recognition. Moreover, little is known about a third cue, local opponent motion, the main motion feature shared by fully illuminated and point-light versions of human walkers (Casile and Giese, 2005).
To address these three questions, we performed a series of three fMRI experiments. Experiment 1 was designed to separate the processing of the human form from the processing of the biological kinematics. Experiment 2, based on the same design, investigated the influence of action complexity and of an attentionally demanding one-back task. Experiment 3 investigated the role of the congruent movement of the points belonging to a single limb and of local opponent motion.
Materials and Methods
Participants
Twenty volunteers participated in experiment 1 (12 females and 8 males; mean age, 25 years; range, 20–34 years). Of these 20 volunteers, 10 also participated in experiment 2 (6 females and 4 males; mean age, 26 years; range, 22–34 years) and 17 participated also in experiment 3 (9 females and 8 males; mean age, 26 years; range, 22–34 years), with 7 subjects common to all three experiments. All participants were right-handed, had normal or corrected-to-normal visual acuity, and no history of mental illness or neurological diseases. The study was approved by the Ethical Committee of the Katholieke Universiteit Leuven Medical School, and all volunteers gave their written informed consent in accordance with the Helsinki Declaration before the experiment.
Stimuli
The stimuli for the experiments were presented as point-light displays (Johansson, 1973), 7.5° in height, containing 12 white dots, 0.34° in diameter, presented against a black background (see Fig. 2). For the full biological motion condition, the dots moved according to the motion tracking data from the shoulders, elbows, wrists, hips, knees, and ankles of actual human actors. For all point-light stimuli, the actor moved along a line that was orthogonal to the view direction of the camera for one gait cycle. Additionally, the translation of the body center was cancelled by subtracting the translation of the hips in every frame. The resulting stimulus resembled a person performing the movement on a treadmill. A small red square (0.2°) was superimposed on all individual stimuli. This fixation dot was presented at the center of the display corresponding approximately to the position of the hips of the point-light walker.
Figure 2.

Illustration of the different stimulus conditions defined by the factorial designs used in experiments 1 and 2 (A) and in experiment 3 (B). The dashed lines connecting the joints are not shown in the actual display. C illustrates the nested design with the metafactors complexity and task in experiment 2. Each cell of the nested design contains the basic factorial design used in experiment 1. TM, Translational motion; scr, scrambled.
The motion tracking data for the walking stimuli used in experiments 1, 2, and 3 were obtained from the following database: http://paco.psy.gla.ac.uk/data_csm.php. We chose the data from six different actors and presented them facing rightward and leftward (resulting in 12 different stimuli) during the experiments.
The motion tracking data for the complex actions used in experiment 2 were obtained from http://mocap.cs.cmu.edu/. To include a wide variety of different movements, we chose 12 different complex actions including various boxing movements, movements from aerobics, running, walking, kicking, lifting, and throwing movements. All 12 movements were presented facing leftward and rightward at random.
The experiments were set up using a 2 × 2 factorial design. For experiments 1 and 2, the first factor manipulated the global shape (configuration) of the stimuli by spatially scrambling the starting position of each dot. The second factor modified the kinematics of the stimuli by changing the trajectory of each individual dot to simple translation (see Fig. 2A). These two factors are very similar to the motion-defined structure and pure dynamics described by Troje (2002). Conditions used were as follows: (1) full biological motion: original motion tracking data of walking or complex actions; (2) full translational motion: one frame of the original motion tracking data with maximum extensions of the limbs, translating horizontally or vertically; all dots translated with the same speed, equal to the average speed present in the original data; (3) scrambled biological motion: a constant random offset in horizontal and vertical direction was added to the original movement of each dot; the offset was chosen in such a way that dot density and extension of the stimulus was matched with the original data; (4) scrambled translational motion: a random offset in both the horizontal and vertical direction was added to one frame of the original stimulus. This frame was the same as that chosen for condition 2. One-half of the dots translated horizontally, whereas the other one-half translated vertically. The speed of each dot was the average speed of this dot in the original tracking data. Thus, in all four conditions, the global motion energy was matched.
In the third experiment, the first factor degraded the local opponent motion between the two dots representing the same joint on opposite limbs (e.g., the two wrist joints). The second factor modified partial configuration information, by spatially scrambling the starting position of the dots (see Fig. 2B). Conditions used were as follows: (1) full biological motion: original motion tracking data; (2) half biological motion: points belonging to one side of the human body were presented twice next to each other and moving in phase; (3) local opponent motion: a random offset in the vertical direction was added to the trajectory of each dot of the motion tracking data; this offset was identical for the two dots belonging to the same joint on opposite limbs; (4) scrambled biological motion: identical with condition 3 in experiments 1 and 2.
Apparatus and procedure
The stimuli were projected with a liquid crystal display projector (Barco Reality 6400i; 1024 × 768; 60 Hz refresh frequency; Barco) onto a translucent screen positioned in the bore of the magnet at a distance of 36 cm from the point of observation. Participants viewed the stimuli through a mirror tilted at 45° that was attached to the head coil. To reduce the amount of head motion during the scanning sessions, the participants were asked to bite an individually molded bite bar fixed on the scanner table. Throughout the scanning session, eye movements of the participants were recorded with an ASL eye tracking system 5000 (60 Hz; Applied Science Laboratories).
Before scanning, participants were familiarized with the different conditions outside the scanner and were instructed to maintain fixation on the red fixation dot throughout the experiment. A single time series (run) of the experiment included five different conditions (four stimulus conditions and one fixation condition) that were presented in blocks of 24 s. Within any given run, every condition was repeated twice giving rise to 15 blocks per time series, lasting 360 s overall. The order of the conditions was randomized for each run and counterbalanced across subjects. Every run started with the acquisition of four dummy volumes to assure that the magnetic resonance (MR) signal had reached its steady state.
During the presentation in the scanner, the position of the fixation dot remained constant across all stimuli, but the position of the point-light stimulus was randomly shifted within a range of ±1.5° visual angle horizontally and vertically. The presentation of each stimulus was limited to one gait cycle, which lasted 1–1.5 s depending on the action presented. Every 2 s, a new stimulus was presented and the gap between two consecutive stimuli was filled with black frames. In this manner, 12 different movement stimuli were presented within one block.
In experiments 1 and 3, four time series were collected for all subjects. They were instructed to maintain passive fixation throughout the scan. Experiment 2 consisted of 16 time series per subject, which differed with respect to the stimuli used or the instructions given. Four time series contained walking movements, and the subjects were asked to maintain passive fixation (walking without task; identical with experiment 1). Another four series contained walking movements, but this time subjects were required to perform a one-back task, pressing a button each time the same stimulus was presented twice (walking with task). The stimuli used for the remaining eight runs were complex actions. In four of these runs, subjects maintained passive fixation (complex actions without task), whereas for the other four they performed a one-back task (complex actions with task). The order of the runs was randomized for each subject and counterbalanced across subjects.
In addition to the experimental runs, all subjects were tested with three different standard localizers to individually identify the location of human MT/V5 complex (hMT/V5+), lateral occipital complex (LOC), and the kinetic occipital (KO) region. LOC was localized by contrasting grayscale images and line drawings of both familiar and nonfamiliar objects with their scrambled counterparts (Kourtzi and Kanwisher, 2000) in three time series. For subsequent region of interest (ROI) analysis, we selected the two runs displaying familiar objects. hMT/V5+ was localized by contrasting moving and static random dot texture pattern (Sunaert et al., 1999) in two time series. KO was localized by contrasting activation for motion-defined contours and transparent motion, as described by Van Oostende et al. (1997), in two time series. In addition, in the 10 subjects who participated in both experiments 1 and 2, two additional time series were collected to localize the EBA and FBA. Following Downing et al. (2001), these areas were localized by contrasting human bodies with chairs. The stimulus set can be obtained from http://www.bangor.ac.uk/∼pss811/page7/page7.html.
Data collection
Scanning was performed with a 3T MR scanner (Intera; Philips Medical Systems) located at the University Hospital of Katholieke Universiteit Leuven. Functional images were acquired using gradient-echoplanar imaging with the following parameters: 50 horizontal slices (2.5 mm slice thickness; 0.25 mm gap), repetition time (TR), 3 s; time of echo (TE), 30 ms; flip angle, 90°; 80 × 80 matrix with 2.5 × 2.5 mm in-plane resolution, and SENSE reduction factor of 2. The 50 slices in one volume covered the entire brain from the cerebellum to the vertex. A three-dimensional high-resolution T1-weighted image covering the entire brain was acquired in one of the scanning sessions and used for anatomical reference (TE/TR, 4.6/9.7 ms; inversion time, 900 ms; slice thickness, 1.2 mm; 256 × 256 matrix; 182 coronal slices; SENSE reduction factor, 2.5). A single scanning session lasted ∼90 min.
Data analysis
Data analysis was performed using the SPM2 software package (Wellcome Department of Cognitive Neurology, London, UK) running under MATLAB (The Mathworks). The preprocessing steps involved the following: (1) realignment of the images, (2) coregistration of the anatomical image and the mean functional image, and (3) spatial normalization of all images to a standard stereotaxic space [Montreal Neurological Institute (MNI)] with a voxel size of 2 × 2 × 2 mm. Before additional group analyses, the functional data were smoothed with an isotropic Gaussian kernel of 8 mm.
Statistical analysis of experiments 1 and 3
For every participant, the onset and duration of each condition was modeled by a general linear model (GLM). The design matrix was composed of five regressors modeling the five conditions plus six regressors obtained from the motion correction in the realignment process. The latter were included to account for voxel intensity variations caused by head movement. All regressors were convolved with the canonical hemodynamic response function. Subsequently, we calculated contrast images for each participant for the two main effects and the interaction. A second-level random-effects analysis was performed on the contrasts obtained from the first-level analyses (Holmes and Friston, 1998). The resulting t score maps were thresholded at p < 0.05, corrected for multiple comparisons [false discovery rate (FDR), t > 5.12]. However, for visualization purposes, a more lenient threshold of p < 0.001, uncorrected for multiple comparisons, was applied, and the resulting activations were projected (enclosing voxel projection) onto the population-average, landmark- and surface-based (PALS) atlas surface (Van Essen, 2005) (http://sumsdb.wustl.edu:8081/sums/directory.do?id = 636032) using the Caret software package (Van Essen et al., 2001) (http://brainvis.wustl.edu/wiki/index.php/Caret:About).
Statistical analysis of experiment 2
Given the large number of conditions in this experiment, only 10 representative subjects were scanned (supplemental Fig. 1, available at www.jneurosci.org as supplemental material). Statistical analysis proceeded along two separate lines: (1) a second-level random-effects analysis was performed on the contrasts obtained from the individual first-level analyses of the 10 subjects (as in experiments 1 and 3); (2) the data of the 10 subjects were analyzed only on the first level by applying a fixed-effect model combining all subjects. Otherwise, the modeling of the conditions was identical with the other experiments. Even though we applied two separate analyses, the resulting t score maps (thresholded at p < 0.01, uncorrected, for the random effect, and p < 0.05, corrected level [family-wise error (FWE), t > 4.92], for the fixed-effect model) were very similar. Figures 6 and 7 illustrate the activation patterns projected onto a rendered single subject anatomy (Table 1; supplemental Table 1, available at www.jneurosci.org as supplemental material).
Figure 6.

Results of experiment 2: effect of complexity. A, The pink areas indicate significantly stronger responses for the main effect of kinematics for the runs presenting complex actions compared with the runs presenting walking figures as stimuli, regardless the task performed by the subjects. The large renderings show the activations for the fixed-effect model (p < 0.05, FWE corrected), and the small renderings, the ones for the random-effect model (p < 0.01, uncorrected). B, Activity profiles (± SEM) of the two local maxima (sites 7, 8) indicated in A and listed in Table 1. The MR activity is plotted for the four conditions of the basic design for the two levels of complexity. The contrast shown in A corresponds to (a + b) − (c + d), where a and c are the difference between the full biological motion condition and the full translational motion condition, and b and d are the difference between the scrambled biological motion condition and the scrambled translational condition at the two complexity levels.
Figure 7.

Results of experiment 2: effect of task. A, The yellow areas indicate significantly stronger responses for the main effect of kinematics for the runs in which subjects had to perform a task, compared with the runs in which subjects were passively fixating the stimuli, regardless the complexity of the stimuli. The large renderings show the activations for the fixed-effect model (p < 0.05, FWE corrected), and the small renderings, the ones for the random-effect model (p < 0.01, uncorrected). B, Activity profiles (± SEM) of two local maxima (sites 10, 11) indicated in A and listed in Table 1. The MR activity is plotted for the four conditions of the basic design for the two levels of the metafactor task. The contrast shown in A corresponds to (a + b) − (c + d).
Table 1.
Stereotaxic position (MNI space) of the local maxima and their respective t scores from experiments 1–3
| Region | Coordinates |
t score |
|||||
|---|---|---|---|---|---|---|---|
| x | y | z | Exp. | Motion | Shape | ||
| Experiment 1 (random effect) | |||||||
| Configuration | |||||||
| 1 | LOS/MOG | 36 | −90 | −6 | 5.8 | 4.6 | 3.9 |
| −42 | −94 | −8 | 3.6 | 3.6 | 4.3 | ||
| 2 | Post. ITG | 44 | −68 | −22 | 6.6 | — | 9.4 |
| −46 | −68 | −12 | 6.2 | — | 8.1 | ||
| 3 | Mid-FG | 38 | −50 | −26 | 6.0 | — | 7.3 |
| −42 | −56 | −26 | 4.2 | — | 6.2 | ||
| Kinematics | |||||||
| 4 | Post. ITS | 52 | −76 | 0 | 6.9 | 3.9 | 7.4 |
| −52 | −76 | 2 | 6.7 | 5.0 | 7.9 | ||
| Interaction | |||||||
| 5 | Post. ITS | 48 | −78 | −4 | 7.2 | 4.2 | 7.7 |
| −50 | −82 | 0 | 6.3 | 4.6 | 6.4 | ||
| 6 | Mid-FG | 44 | −46 | −22 | 4.7 | — | 5.5 |
| Experiment 2 (fixed effect) | |||||||
| Kinematics—complexity | |||||||
| 7 | Post. ITS | 54 | −72 | −2 | 14.8 | 6.6 | 5.8 |
| −54 | −72 | 4 | 13.1 | 4.2 | 5.9 | ||
| 8 | Post. STG | 64 | −34 | 18 | 8.8 | — | — |
| −58 | −36 | 24 | 8.6 | — | — | ||
| 9 | Mid-FG | 42 | −42 | −28 | 7.3 | — | 8.0 |
| −44 | −40 | −26 | 5.4 | — | 4.5 | ||
| Kinematics—task | |||||||
| 10 | Post. MTG/STS | 62 | −52 | 2 | 8.1 | — | — |
| −60 | −58 | 0 | 7.3 | — | — | ||
| 11 | Post. IFS | 58 | 22 | 26 | 7.7 | — | — |
| −54 | 24 | 28 | 6.7 | — | — | ||
| vPrCS | 48 | 6 | 44 | 7.5 | — | — | |
| Post. IFG | 58 | 30 | −6 | 10.7 | — | — | |
| Experiment 3 (random effect) | |||||||
| Partial configuration | |||||||
| 12 | LOS/MOG | 28 | −94 | −10 | 7.1 | 3.9 | — |
| −24 | −96 | −10 | 6.8 | 5.5 | — | ||
| 13 | LOS/MOG | 42 | −82 | −6 | 5.4 | 3.2 | 8.3 |
| −44 | −84 | −8 | 4.1 | 4.1 | 8.8 | ||
| 14 | Mid-FG | 36 | −42 | −24 | 7.2 | — | 6.6 |
| −40 | −44 | −26 | 4.3 | — | 6.8 | ||
| Opponency | |||||||
| 15 | Mid-FG | 34 | −40 | −24 | 5.2 | — | 7.6 |
| −30 | −42 | −26 | 4.3 | — | 5.7 | ||
The values in the motion and shape columns correspond to the t scores for the motion (hMT/V5+) and the two-dimensional shape (LOC) localizer, respectively, in the specific location. Italics indicate the corresponding location of the local maxima on the left hemisphere. Bold t scores indicate p < 0.05, FDR corrected for the random-effect analysis (experiments 1 and 3) and FWE corrected for the fixed-effect analysis (experiment 2). Standard font indicates p < 0.001, uncorrected. ITS, Inferior temporal sulcus; ITG, inferior temporal gyrus; FG, fusiform gyrus; MTG, middle temporal gyrus; STS, superior temporal sulcus; STG, superior temporal gyrus; vPrCS, ventral precentral sulcus; IFG, inferior frontal gyrus; Post., posterior; Exp., t scores of the respective experiments 1–3.
Definition of ROIs for the group
For the hMT/V5+, LOC, and KO localizers, random-effect analysis was performed, whereas a fixed-effect analysis was applied for the EBA/FBA localizer obtained in the 10 subjects. The resulting t score maps were thresholded at p < 0.0001, uncorrected for multiple comparisons.
Definition of ROIs for the individual subjects
Several studies have reported substantial overlap between area hMT/V5+ and the extrastriate body area and between the LO complex and the fusiform body area (Downing et al., 2001; Peelen et al., 2006; Spiridon et al., 2006). To investigate whether the main effects and the interaction described for experiment 1 are related to activation of hMT/V5+ or the EBA, or of mid-fusiform gyrus (FG)/LOa or the FBA, respectively, we performed an ROI analysis for each subject individually on the nonsmoothed data, separately for the two hemispheres.
Allocation of voxels to either hMT/V5+ or EBA.
We defined a common local maximum for hMT/V5+ and EBA by creating a GLM containing both the two hMT/V5+ localizer runs and the two EBA/FBA localizer runs for each subject individually. This GLM was used to contrast the average of moving dot patterns and human bodies with the average of static dot patterns and chairs. From this contrast, we identified the local maximum in the posterior part of the inferior temporal sulcus (pITS)/posterior part of the inferior temporal gyrus (pITG) in the right hemisphere. Subsequently, we defined a region of 30 × 30 × 30 mm cube around this local maximum. From this regions, all voxels significantly activated (p < 0.0001, uncorrected) by the hMT/V5+ localizer runs alone were defined as the hMT/V5+ ROI, and all voxels significantly activated (p < 0.0001, uncorrected) by the EBA/FBA localizer runs alone were defined as the EBA ROI (supplemental Fig. 2, available at www.jneurosci.org as supplemental material). This analysis guarantied a maximal separation between hMT/V5+ and EBA because it excluded all voxels commonly activated by both localizers. The average number of voxels included in the EBA ROI was 94, and that of the hMT/V5+ ROI was 104. The number of commonly activated and therefore excluded voxels at this threshold was 34. Afterward, we computed the percentage MR signal change by separately averaging the voxels contained in the two ROIs (see Figs. 5B, 8; supplemental Fig. 3, available at www.jneurosci.org as supplemental material). The left EBA and hMT/V5+ were defined in the same way, resulting on average in 99 voxels for the EBA, 86 voxels for hMT/V5+ and 16 commonly activated voxels. To assure that the effects do not depend on the threshold used, we also conducted the same analysis with a threshold of p < 0.001, uncorrected, and p < 0.00001, uncorrected (supplemental Fig. 4, available at www.jneurosci.org as supplemental material).
Figure 5.

ROI analysis. A, Activations for the main effects and the interaction projected onto a flattened right hemisphere of the PALS atlas (same color code as in Fig. 3D). The symbols indicate the position (group analysis) of the human MT/V5 complex (48, −72, −4), the EBA (52, −70, −4), the FBA (42, −42, −26), the mid-FG/LOa (36, −38, −24), and the two local maxima of the interaction in experiment 1. B, Activity profiles for the four ROIs computed on nonsmoothed data and averaged (± SEM) over subjects. Detailed statistics are shown in Table 2.
Figure 8.
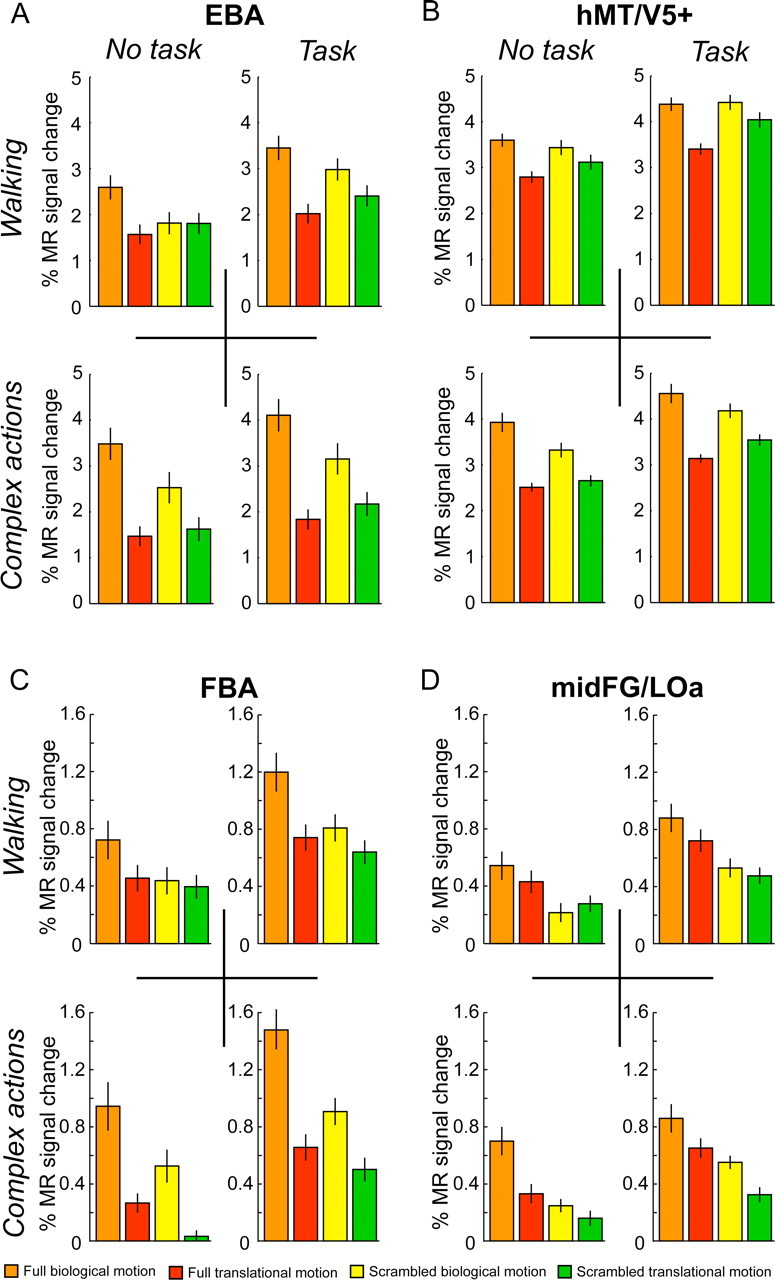
ROI analysis of experiment 2. A–D show the activity profiles (± SEM) for area EBA, hMT/V5+, FBA, and mid-FG/LOa separately for the different types of runs in experiment 2. The profiles were computed on nonsmoothed data and subsequently averaged across subjects. Detailed statistics are presented in Table 2.
Allocation of voxels to either mid-FG/LOa or FBA.
Along the same lines, we first defined a common local maximum for mid-FG/LOa and FBA by computing a new GLM, contrasting activation for familiar intact shapes and bodies with activation for scrambled shapes and chairs. Next, we defined a region of 30 × 30 × 30 mm cube around this local maximum. From this region, all voxels significantly activated (p < 0.0001, uncorrected) by the LO localizer runs alone were defined as the mid-FG/LOa ROI, and all voxels significantly activated (p < 0.0001, uncorrected) by the EBA/FBA localizer runs alone were defined as the FBA ROI. The average number of voxels included in the FBA ROI of the right hemisphere was 75, and that of the mid-FG/LOa ROI was 224. The number of commonly activated and therefore excluded voxels at this threshold was 20. Even though the number of voxels for the mid-FG/LOa ROI was larger than that of the FBA ROI, supplemental Figure 4 (available at www.jneurosci.org as supplemental material) shows that the relative differences in activation between the conditions is not affected by the number of voxels used to define the ROI. Afterward, we computed the percentage MR signal change by separately averaging the voxels contained in the two ROIs (see Figs. 5B, 8; supplemental Fig. 3, available at www.jneurosci.org as supplemental material). As we did not obtain a significant interaction in the left fusiform gyrus (Table 1) and previous studies have shown no or only weak activation in response to human bodies in the left fusiform cortex (Peelen and Downing, 2005; Taylor et al., 2007; Hodzic et al., 2009), we did not define FBA and mid-FG/LOa in the left hemisphere.
Activity profiles
For all experiments, the activity profiles were first computed for each subject individually and subsequently averaged across subjects. They represent the percentage MR signal change relative to fixation baseline in the different conditions. Whenever the analysis was based on a local maximum of the group, they are computed by averaging the response of the 27 voxels surrounding the local maxima on spatially smoothed data. In the special case of an ROI analysis (see Figs. 5B, 8; supplemental Fig. 3, available at www.jneurosci.org as supplemental material), they are generated by averaging the response of all voxels included in the ROI using the nonsmoothed data.
Results
Experiment 1
Experiment 1 was designed to assess the contribution of shape and motion cues in the processing of point-light walker displays. To this end, we used a 2 × 2 factorial design, with the factors configuration and kinematics (Fig. 2A). The configuration factor manipulated the global shape of the stimuli by spatially scrambling the starting position of each dot. The kinematics factor modified the kinematics of the stimuli by changing the trajectory of each individual dot to simple translation. On average, subjects made 4.5 saccades per block (SD, 0.25), and there were no significant differences between the experimental conditions (F(3,57) = 2.2; p = 0.10). Subsequent debriefing of the subjects confirmed that all of them were aware of the manipulations in the different conditions and in particular that the full translational motion condition was perceived as portraying a human body.
Figure 3 presents the results of a random-effects analysis over 20 subjects. The main effect of configuration contrasts full biological and translational motion with their scrambled counterparts. The main effect of kinematics contrasts the full and scrambled biological motion to their translational counterparts. Finally, the interaction contrasts the difference between full and scrambled biological motion against the same difference for translational motion. Even at the lenient threshold of p < 0.001, uncorrected, used for illustration purposes, activation for the two main effects, as well as for their interaction was limited to occipito-temporal regions. This interaction can be formulated in two ways, either resulting in positive signs for the full biological motion and the scrambled translational motion conditions, or with positive signs for the full translational motion and the scrambled biological motion conditions. When we use the term “interaction,” we refer to the former which activates occipito-temporal regions (Fig. 3C). The opposite interaction resulted only in a small activation in left posterior inferior parietal lobule (−36, −48, 62; t = 4.4), outside the areas involved in the processing of biological motion.
Figure 3.

Results of experiment 1. A–C show the t score maps for the main effect of configuration (green), the main effect of kinematics (red), and the interaction (blue) thresholded at p < 0.001, uncorrected, projected onto a rendered brain. D, Activations of the main effects and the interaction projected onto the posterior part of the flattened right hemisphere of the PALS atlas. The symbols indicate the position of the local maxima obtained in the different contrasts (Table 1). The colored outlines indicate the location (group analysis) of the hMT/V5+ (orange) and the LOC (brown). LH, Left hemisphere; RH, right hemisphere.
Moreover, the extent of the activations in the right hemisphere exceeded those of the left hemisphere (Fig. 3A–C). This asymmetry has been previously reported in several other studies investigating fMRI activation for point-light walkers (Grossman et al., 2000; Peuskens et al., 2005; Peelen et al., 2006; Pyles et al., 2007). Therefore, our subsequent analysis focused on the right hemisphere. However, whenever applicable, results for the left hemisphere will be presented at the end of each section.
The local maxima in the right hemisphere for the main effects and their interaction are listed in Table 1 indicating their location in MNI space and t score. All six local maxima reached significance at corrected level (FDR), except for site 6, which was only marginally significant. It should be noted that, since interactions are based on a difference of differences, they incorporate the sum of two variances into their statistics; thus, a lower significance level is acceptable when using t scores for these effects. Figure 3D shows the activation pattern (p < 0.001, uncorrected) for the main effect of configuration in green, the main effect of kinematics in red, and their interaction in blue superimposed onto the flattened right hemisphere of the PALS atlas. The main effect of configuration (sites 1–3) resulted in activation of posterior and ventral areas along the lateral occipital sulcus (LOS), the pITG, and the FG. In contrast, the main effect of kinematics and the interaction (sites 4 and 5) yielded activation in areas located more rostrally and dorsally in the pITS. In addition, a marginally significant interaction site was also present in the fusiform gyrus (site 6).
Activity profiles for the six individual local maxima are presented in Figure 4A. fMRI activations for the different conditions are expressed as percentage MR signal change from fixation baseline. In the first two conditions (orange and red), the factor configuration is positive, and in conditions 1 and 3 (orange and yellow), the kinematics factor is positive. Sites 1–3 show a clear main effect of configuration. Most importantly, activation for the full translational motion condition is very similar or even equal to the activation for the full biological motion condition, indicating that these conditions were similarly effective in driving shape-sensitive regions in the human brain.
Figure 4.

A, Activity profiles of the six different local maxima shown in Figure 3D. fMRI activation is represented as percentage MR signal change from fixation baseline (± SEM) averaged over the 27 voxels surrounding the local maximum and plotted for the four conditions, as indicated. Numbers correspond to those in Figure 3D. B, Split-half analysis of the data. The six local maxima were defined from a random-effects analysis containing only the odd runs of experiment 1. The coordinates of these local maxima (indicated) were then used to plot the activity profiles by considering only the data of the even runs.
Site 4 shows a weak but significant effect of kinematics, in addition to an interaction reflecting the proximity of site 5. To verify the consistency of the main effect of kinematics, we analyzed the main effect in each of the 20 subjects. We were able to identify site 4 in all subjects (within a cube of 10 × 10 × 10 mm; p < 0.001) and subsequent averaging of the percentage MR signal change over all subjects resulted in an enhanced difference between the biological and translational conditions (supplemental Fig. 5A, available at www.jneurosci.org as supplemental material). Moreover, analysis of the independently scanned runs of experiment 2 for site 4 identified in experiment 1 confirmed the presence of a significant main effect of kinematics (supplemental Fig. 5B, available at www.jneurosci.org as supplemental material).
The last two profiles (5 and 6) refer to the two interaction sites and clearly indicate that the interaction is attributable to stronger MR activity in the full biological condition compared with the three other conditions.
Since the same data were used to identify the local maxima and to plot the activity profiles in Figure 4A, we confirmed the reported effects by a split-half analysis of the data. Figure 4B plots the percentage MR signal change for the even runs at the local maxima independently identified from a random-effects analysis containing only data from the odd runs. Statistical analysis confirmed that the described effects are still valid (sites 1–3 main effect of configuration: F(1,19) = 8.7, p < 0.01; F(1,19) = 7.6, p < 0.05; F(1,19) = 11.4, p < 0.001; site 4 main effect of kinematics: F(1,19) = 18.1, p < 0.001; sites 5–6 interaction: F(1,19) = 8.9, p < 0.01; F(1,19) = 5.4, p < 0.05). In addition, the effects do not depend on the number of voxels averaged to generate the profiles (supplemental Fig. 6, available at www.jneurosci.org as supplemental material).
As a result of this experiment, we could identify two different processing streams, a dorsal one for the analysis of the kinematics information and a ventral one for the analysis of the shape information. Moreover, we discovered two regions showing strongest selectivity for intact point-light walker: the two interaction sites. The first site was located in the pITS (5), whereas the second one was located in the fusiform gyrus (6). In the following step, we investigated whether it would be possible to attribute these regions to a functionally defined area. In all subjects, we had the motion and shape localizer data. Given the proximity of the interaction sites to the EBA and FBA, and given that the EBA and the FBA have been implicated in biological motion processing (Peelen et al., 2006), we rescanned 10 representative subjects with an EBA/FBA localizer (supplemental Fig. 1, available at www.jneurosci.org as supplemental material). This allowed us to functionally define areas EBA and FBA in each subject, in addition to hMT/V5+ and LOC. For the LOC, we follow the subdivision in an anterior (LOa) and a posterior (LO) part located in the mid-FG and pITG, respectively (Kourtzi and Kanwisher, 2000; Denys et al., 2004).
Figure 5A displays the location of the two local maxima for the interaction with respect to the mean local maxima of areas hMT/V5+, mid-FG/LOa, EBA, and FBA calculated over the 10 subjects. It has been shown previously that hMT/V5+ and EBA as well as mid-FG/LOa and FBA occupy overlapping regions in posterior ITS/ITG and the fusiform gyrus, respectively (Downing et al., 2001; Peelen et al., 2006). To be able to attribute the different main effects and the interaction to a functionally defined area, we generated ROIs for each subject individually for areas hMT/V5+, mid-FG/LOa, EBA, and FBA on nonsmoothed data. The ROIs were completely separated, ensuring that no single voxel was attributed to two different ROIs (see Materials and Methods).
Figure 5B shows the activity profiles for the four ROIs of the right hemisphere averaged over subjects. It can clearly be seen that the two body areas carry the interaction effect, whereas area hMT/V5+ also shows an enhanced effect of kinematics and area mid-FG/LOa, an enhanced effect of configuration. This observation is also supported by statistical analysis (Table 2). Even though repeated-measures ANOVAs indicate that all areas show a significant interaction (EBA: F(1,9) = 47.3, p < 0.001; hMT/V5+: F(1,9) = 15.7, p < 0.01; FBA: F(1,9) = 11.1, p < 0.01; mid-FG/LOa: F(1,9) = 8.4, p < 0.05), comparisons across areas reveal a stronger interaction between configuration and kinematics cues in areas EBA and FBA, compared with areas hMT/V5+ and mid-FG/LOa. This was tested using a three-way ANOVA with area as additional factor. Contrast analysis within this ANOVA revealed that the difference between the two conditions with biological kinematics (full biological motion and scrambled biological motion) was significantly larger in area EBA compared with area hMT/V5+ (F(1,9) = 9.5; p < 0.05), and the difference between the two conditions showing the full walker (full biological motion and full translational motion) was significantly larger in FBA compared with mid-FG/LOa (F(1,9) = 5.3; p < 0.05).
Table 2.
Statistical analysis and the corresponding p values of experiments 1 and 2 for the four different ROIs
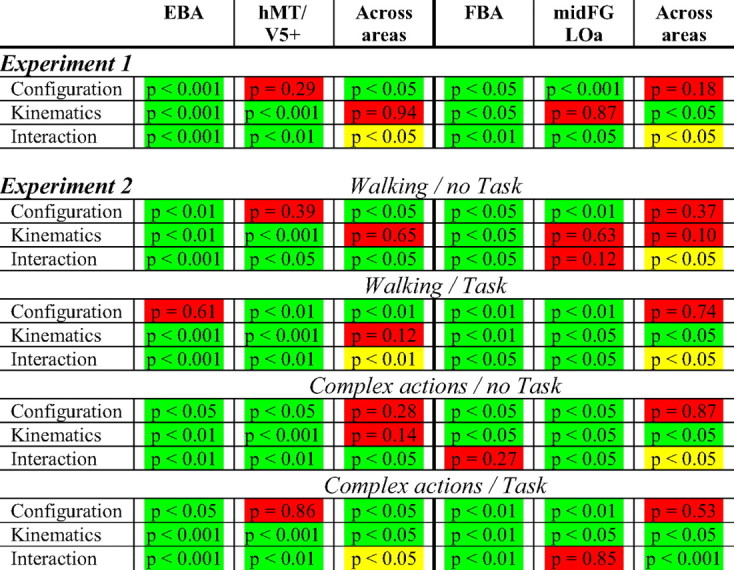
Statistics were performed either as two-way ANOVAs to identify significant effects in a single ROI or as three-way ANOVAs comparing activations across areas (EBA vs hMT/V5+ or FBA vs mid-FG/LOa). Significant effects are color coded in green. Nonsignificant effects are color coded in red. The yellow cells indicate that the three-way interaction was not significant but that the difference between the two conditions showing biological kinematics (full biological vs scrambled biological) was significantly larger in area EBA compared with hMT/V5+ or that the difference between the two conditions showing the full body (full biological vs full translational) was significantly larger in area FBA compared with the mid-FG/LOa.
The analysis of the left hemisphere was limited to the EBA and hMT/V5+ ROIs, because we did not obtain a significant interaction in the left fusiform gyrus (Table 1). This is in agreement with studies showing no or only weak activation in response to human bodies in the left fusiform cortex (Peelen and Downing, 2005; Taylor et al., 2007; Hodzic et al., 2009). Although the left EBA showed, like the right hemisphere, a significant interaction between shape and kinematics (F(1,9) = 6.5; p < 0.05), the interaction in the left hMT/V5+ was not significant (F(1,9) = 2.5; p = 0.15). However, the left hMT/V5+ showed a significant main effect of kinematics similar to the right hemisphere (F(1,9) = 16.3; p < 0.01).
Given these results, we can conclude that the shape and kinematics cues present in biological motion displays are essentially processed in two separate streams. Furthermore, the two streams are integrated at the level of the extrastriate body area and the fusiform body area, which thus represent the endpoints of these streams in the occipito-temporal cortex. At this level, the complete action information is linked to the representation of the human body.
Experiment 2: whole-brain analysis
Interestingly, significant activation in experiment 1 was limited to occipital and ventral temporal areas, but did not extend into the posterior part of the middle temporal gyrus (pMTG) or the pSTS, areas that have been widely associated with the processing of point-light stimuli (Grossman et al., 2000; Vaina et al., 2001; Pelphrey et al., 2003b; Saygin et al., 2004; Peuskens et al., 2005). Our experiment differed in two important aspects from most other fMRI studies of biological motion. First, the actions presented were limited to walking movements, whereas other studies have used a variety of different movements. The second difference was that here the subjects were instructed to passively fixate the stimuli, whereas other studies have used a task to engage the subject's attention. Therefore, in the second experiment, we tested in 10 representative subjects the possibility that the lack of activation in the pMTG/pSTS region could be related to one of these two factors.
The conditions of the experiment were identical with those used in experiment 1, but the actions presented and the instructions given differed between runs in a 2 × 2 manner, resulting in a nested factorial design (Fig. 2C). The first factor modified the complexity of the stimuli. That is, in one-half of the runs, only walking stimuli were used, identical with those of experiment 1, whereas the other one-half comprised 12 different actions such as aerobics movements, boxing, throwing, and kicking. The second factor modified the instructions given. In one-half of the runs, subjects were instructed to maintain passive fixation, whereas in the other one-half, they performed a one-back task. Performance in the one-back task was on average 83% correct responses (±3%) and did not differ significantly between conditions (F(3,27) = 1.8; p = 0.16). On average, subjects made 5.2 saccades per block (SD, 0.32) with no significant differences between the experimental conditions (F(3,36) = 1.7; p = 0.21). Analyzing the eye movements separately comparing runs with and without the task yielded no significant differences, nor did a comparison between runs showing complex movements and runs presenting walking stimuli.
Figure 6 shows the results of a fixed-effect analysis (large renderings) and the results of the random-effect analysis (small renderings) over the 10 subjects for the metafactor complexity. The purple regions indicate areas in which the main effect of kinematics is significantly (p < 0.05, FWE corrected, for the fixed-effect model, and p < 0.01, uncorrected, for the random-effect model) stronger for complex actions than for walking, independently of the task performed. It can clearly be seen that both analyses result in very similar activation patterns. In both hemispheres, the activation extends into the pMTG, and even to the posterior superior temporal gyrus (pSTG) (Table 1; supplemental Table 1, available at www.jneurosci.org as supplemental material). Figure 6B plots the activity profiles of two local maxima in the right hemisphere: one in the pITS (site 7) at a location almost identical with the location of the local maximum for the main effect of kinematics in experiment 1 (Table 1) and one in the pSTG (site 8). The activity profiles for the four conditions of the basic design are plotted separately for the two levels of the metafactor complexity: complex actions and simple walking, averaged across the metafactor task. The contrast superimposed on the rendered brain in Figure 6A is as follows: (a + b) − (c + d), where a and c are the difference between full biological motion and full translational motion, and b and d the difference between scrambled biological motion and scrambled translational motion at the two levels of the metafactor complexity (Fig. 6B). It is worth noting that, in pITS, but not in pSTG, the interaction between shape and motion was significant for both levels of the metafactor complexity (pITS: complex actions, F(1,9) = 28.1, p < 0.001; walking, F(1,9) = 27.3, p < 0.001; pSTG: complex actions, F(1,9) = 0.1, p = 0.93; walking, F(1,9) = 0.3, p = 0.59). We observed no significant difference in the main effect of configuration nor in the interaction between the runs containing complex stimuli and the runs presenting walking stimuli.
Similar to the results of the complexity analysis, we obtained a significant difference between runs with and without task, independent of complexity only for the main effect of kinematics and not for the main effect of configuration or the interaction. The differences between runs in which subjects performed a one-back task compared with runs in which they passively fixated the stimuli are presented in Figure 7A (large rendering, fixed-effect model; small rendering, random-effects model). The yellow regions highlight areas that show a significantly stronger main effect of kinematics (p < 0.05, FWE corrected, for the fixed-effect model, and p < 0.01, uncorrected, for the random-effect model) in runs with task, compared with runs without task, independently of complexity. Areas activated include the posterior MTG/STS and the posterior inferior frontal sulcus (pIFS) bilaterally, and the ventral precentral sulcus (vPrS) and the posterior inferior frontal gyrus (pIFG) in the right hemisphere (Table 1; supplemental Table 1, available at www.jneurosci.org as supplemental material). The latter activations correspond closely to the frontal areas activated in a biological motion study by Saygin et al. (2004). It is worth noting that the activation at the local maximum for the main effect of kinematics identified in experiment 1 again shows a main effect of kinematics. However, this main effect is similar for the active and passive runs (supplemental Fig. 5B, available at www.jneurosci.org as supplemental material) and therefore does not show up in the meta-analysis (Fig. 7A). Figure 7B shows the activity profiles of two local maxima (sites 10, pMTG/STS, and 11, IFS) in the right hemisphere. In a manner analogous to Figure 6, the MR activities for the four basic conditions are plotted for the two levels of the metafactor task, averaged across the factor complexity. The contrast shown in Figure 7A is as follows: (a + b) − (c + d). Activity in the IFS (site 11) is representative of all frontal regions. Interestingly, contrast analysis revealed significantly stronger fMRI responses for intact compared with scrambled point-light stimuli, both presented with biological kinematics, in the pMTG/STS site (pMTG/STS: task, F(1,9) = 7.2, p < 0.05; no task, F(1,9) = 4.9, p < 0.05), whereas the reverse, or no effect, was observed in the frontal sites (IFS: task, F(1,9) = 7.8, p < 0.05; no task, F(1,9) = 0.5, p = 0.51).
Even though activations in the pMTG/STS region (site 10) may seem low, it is important to note that pSTS activation reported in other studies on biological motion is generally computed within ROIs localized beforehand for each subject individually. In this whole-brain analysis, we computed a fixed-effect model and a random-effects model combining the data from all our subjects. Therefore, the local maximum gives the location for the highest significance over all subjects, which might not necessarily be the most optimal location for each individual subject. Moreover, activation levels reported here are significantly different from zero (full BM, task: t(1,9) = 3.6, p < 0.01) and in the range or even higher compared with other fixed-effect studies on biological motion (Peuskens et al., 2005). The same was true for the pSTG region (site 8, full BM, complex actions: t(1,9) = 2.9, p < 0.05).
Together, the results of the whole-brain analysis of experiment 2 indicate that the posterior parts of the MTG, and neighboring STS and the STG, are involved in the processing of the biological kinematics portrayed in a point-light walker. Their activation increases when the stimuli become more complex and/or when the subject performs a task with the stimuli. All these conditions require a more detailed processing of the trajectories of the points. In addition, prefrontal areas are recruited when discrimination between similar biological trajectories must be performed. Even though frontal areas were strongly involved in the processing of biological kinematics when subjects had to respond to a one-back task (Saygin et al., 2004), we observed no preference for the intact point-light walker compared with their scrambled versions, in agreement with Pyles et al. (2007).
Experiment 2: ROI analysis
In addition to a whole-brain analysis, we also analyzed the activation separately for the four ROIs defined for experiment 1 (EBA, hMT/V5+, FBA, and mid-FG/LOa) in the right hemisphere (supplemental Fig. 2, available at www.jneurosci.org as supplemental material). As experiment 2 introduced only two additional metafactors (task and complexity), but was still based on the same conditions as experiment 1, we could investigate how theses additional factors would influence the activity profiles compared with experiment 1. Figure 8 illustrates the activity profiles of the four different ROIs for the four different types of runs. Most importantly, the activity profiles for the runs displaying only walking stimuli without task (Fig. 8A–D, upper left panels) are almost identical with the activity profiles of experiment 1 (Fig. 5B). As these runs contain the identical stimuli with the identical instructions as in experiment 1 but with the difference that these experiments were performed on different days, the new results are a completely independent confirmation of the findings of experiment 1. This observation is supported by the statistical analysis in Table 2.
The other runs differed either in one or two aspects from the runs presented in experiment 1. Interestingly, the main finding of experiment 1, that the two body areas integrate shape and kinematics information to a larger extent than areas hMT/V5+ and mid-FG/LOa was also evident in all the three other types of runs of experiment 2. This was confirmed using a three-way ANOVA with the following factors: area (EBA and hMT/V5+, or FBA and mid-FG/LOa), configuration, and kinematics. In the case of the EBA and hMT/V5+, we obtained either a significant three-way interaction (complex actions without task: F(1,9) = 6.1, p < 0.05), or contrast analyses, testing for specific differences between parts of the three-way ANOVA, revealed that the difference between the two conditions with biological kinematics (full biological motion and scrambled biological motion) was significantly larger in area EBA compared with area hMT/V5+ (walking with task: F(1,9) = 10.7, p < 0.001; complex actions with task: F(1,9) = 7.9, p < 0.05). In the case of the FBA and mid-FG/LOa, we obtained a significant three-way interaction for the runs showing complex actions with task (F(1,9) = 24.1; p < 0.001) and a significantly larger difference between the two conditions showing the full walker (full biological motion and full translational motion) in FBA compared with mid-FG/LOa for the runs presenting walking with task (F(1,9) = 5.2; p < 0.05) and complex actions without task (F(1,9) = 5.7; p < 0.05).
Comparing the activity profiles over all four different runs across the EBA/hMT/V5+ pair revealed an influence of the metafactors task and complexity that differed between areas. A five-way repeated-measures ANOVA with the factors: area, task, complexity, configuration, and kinematics showed a significant three-way interaction between area, task, and kinematics (F(1,9) = 5.4; p < 0.05) and between area, complexity, and kinematics (F(1,9) = 5.2; p < 0.05). That means that both metafactors enhance the main effect of kinematics in area EBA significantly stronger than in area hMT/V5+. A similar ANOVA comparing activations across FBA and mid-FG/LOa revealed only a significant two-way interaction between the metafactor complexity and kinematics (F(1,9) = 11.9; p < 0.01), but no difference between the areas (no three-way interaction between area, complexity, and kinematics: F(1,9) = 3.6, p = 0.09). In contrast to areas EBA and hMT/V5+, the metafactor of task did not lead to any significant interactions (no two-way interaction between task and kinematics: F(1,9) = 2.6, p = 0.14).
Together, the ROI analysis of experiment 2 confirmed the results of experiment 1 in two main aspects: (1) analysis of an independent data set replicated the findings of experiment 1 and (2) in all runs of experiment 2, we observed significantly stronger integration of shape and kinematics in the body areas compared with hMT/V5+ and mid-FG/LOa, respectively. In addition, we found that the engagement in a task, as well as the complexity of the movement pattern, affected the processing of the kinematics in EBA more strongly than in hMT/V5+, whereas the metafactor complexity affected the processing of kinematics in FBA and mid-FG/LOa similarly in the two areas.
Experiment 3
In experiment 3, we investigated the role of two additional factors in biological motion processing. The first factor modified the amount of local opponent motion present in the stimuli, by altering the relationship between the two dots belonging to the same joint on opposite limbs (e.g., the two wrist joints). Indeed, computational results show that local opponent motion is the main motion feature that is shared by fully illuminated and point-light versions of human walkers and psychophysical evidence suggests that relative limb motion is highly relevant for the recognition of human locomotion. This suggested that the ease with which humans generalize from full body actions to point-light walker might rely mostly on local opponent motion (Casile and Giese, 2005). The second factor in the design of experiment 3 modified partial configuration information by degrading the specific relationship between points belonging to the same limb (Fig. 2B). On average, subjects made 4.6 saccades per block (SD, 0.22), and no significant differences were observed between the experimental conditions (F(3,48) = 2.0; p = 0.12).
The results of the random-effects analysis of the third experiment are displayed in Figure 9 and listed in Table 1. The main effect of partial configuration contrasts the full and half biological motion conditions to the local opponent and scrambled biological motion conditions. The main effect of local opponency contrasts the full biological and local opponent motion conditions to the half biological and scrambled biological motion conditions, whereas the interaction compares the difference between full and half biological motion to that between local opponent and scrambled biological motion. Figure 9, A and B, shows regions activated (p < 0.001, uncorrected) by the main effect of partial configuration indicated by light green, and by the main effect of local opponency, in burgundy, superimposed on a rendered brain and the flattened right hemisphere of the PALS atlas, respectively. As expected, the main effect of partial configuration activated a subset of the areas activated by the main effect of configuration in experiment 1 (green outline) in the lateral occipital sulcus and the fusiform gyrus. However, activation reached significance only in posterior LOS/middle occipital gyrus (MOG) sites and in the FG (Table 1). Despite its large perceptual effect (Casile and Giese, 2005), the main effect of opponency resulted in very limited activations in the ventral temporal cortex with only one local maxima reaching significance at corrected level (FDR) in the fusiform gyrus. Yet this activation was present bilaterally. No significant activation (p < 0.001, uncorrected) was observed for the interaction, independent of the direction of the interaction. The activity profiles of the four local maxima in the right hemisphere reaching significance at corrected level (FDR) are shown in Figure 9C. Similar, but generally weaker results were also present in the left hemisphere (Table 1).
Figure 9.

Results of experiment 3. A, B, t score maps thresholded at p < 0.001, uncorrected, for the main effects of partial configuration (olive) and local opponency (burgundy) projected onto a rendered brain and a flattened right hemisphere of the PALS atlas. The symbols indicate the position of the four local maxima reaching significance at corrected level (FDR), listed in Table 1. The colored outlines indicate the location (group analysis) of the KO area (blue), the hMT/V5+ (orange), the LOC (brown), and the main effect of configuration obtained from experiment 1 (Config. Exp 1; green). C, Activity profiles (± SEM) for the four local maxima indicated in B. Scr., Scrambled.
The KO area has been shown to be involved in the processing of kinetic boundaries (Dupont et al., 1997; Van Oostende et al., 1997). However, a number of imaging studies investigating biological motion processing have also shown activation of area KO (Grossman et al., 2000; Grèzes et al., 2001; Vaina et al., 2001; Santi et al., 2003; Michels et al., 2005). One possible role for area KO in the processing of biological motion might be the extraction of local opponent motion conveyed by the same joints on opposite limbs.
To investigate the role that area KO plays in the extraction of local opponent motion, all subjects who participated in experiment 3 were also scanned with an additional KO localizer. Figure 9B shows the outline of area KO in light blue (local maximum at 36–90 4). Interestingly, the main effect of opponency did not reach significance within this outline and the more lenient p < 0.001 level reveals only a few activated voxels. In a more detailed analysis, we defined the local maximum for area KO in each subject individually and extracted the average activation of the 27 voxels surrounding the local maximum. This individual subject analysis also did not reveal a significant main effect of opponency in area KO (F(1,16) = 2.3; p = 0.15). This result supports the notion that activation in area KO critically depends on the presence of kinetic boundaries in the stimulus and not simply on the presence of dots moving in opposite directions (Van Oostende et al., 1997). Local opponent motion might be a dominant feature in displays of locomotion but is far less so in displays of other more complex actions. This might explain why we did not find strong evidence for a special neural machinery devoted to the processing of local opponent motion in point-light displays.
The analysis of the four ROIs (EBA, hMT/V5+, FBA, and mid-FG/LOa) is presented in supplemental Figure 2 (available at www.jneurosci.org as supplemental material). As only 7 of the 10 subjects who were scanned with all localizers participated in experiment 3, the activity profiles and the statistics were based on 7 subjects. A repeated-measures ANOVA showed a main effect of local opponency in area mid-FG/LOa; however, we did not obtain any significant interaction between area and local opponency. All other effects did not reach significance (supplemental Fig. 3, available at www.jneurosci.org as supplemental material).
Together, the main result of experiment 3 is that the opponent motion present in point-light displays is represented in the fusiform gyrus, in close proximity to the representation of configural information, and not in more posterior areas such as area KO. However, the effect is weak compared with the effects of global shape and kinematics tested in experiment 1 and 2. Although no interaction was observed in experiment 3, the overlap of the two main effects suggests a linear integration of the cues.
Discussion
Our results show that the configuration of the human body and its kinematics are processed in two separate streams in agreement with the theoretical model by Giese and Poggio (2003). However, both cues are integrated at an early level in occipito-temporal cortex, in areas EBA and FBA, known to be involved in the processing of the human body (Downing et al., 2001; Peelen and Downing, 2005; Schwarzlose et al., 2005). Interestingly, processing in these two areas seems to be mostly automatic. In contrast, posterior superior temporal cortex and frontal areas show an enhanced activation by biological kinematics when the portrayed movements become more complex, or when subjects are involved in a one-back task. Finally, the third cue, local opponent motion, yielded only a restricted activation in human visual cortex, compared with configuration and kinematics.
The body areas
Many functional imaging studies investigating the processing of biological motion have reported a network of activated cortical areas (Fig. 1). Among these, three areas have been reported most consistently: the posterior ITS, the posterior FG, and the posterior STS (Grossman and Blake, 2002; Michels et al., 2005; Peuskens et al., 2005). In agreement with Peelen et al. (2006), our study supports the notion that the activation in the pITS corresponds to area EBA, and that in pFG to area FBA. Our results further clarify the role of these body areas in biological motion processing in three important ways (Fig. 10A). First, both EBA and FBA integrate shape and motion cues (experiment 1), a finding consistent with the interdependencies between the cues (Troje, 2002). Second, the relative importance of kinematics and configuration differs between EBA and FBA. EBA emphasizes kinematics, not surprising given its location near the hMT/V5+ complex (Downing et al., 2001), whereas FBA emphasizes configuration, in keeping with its vicinity to object- and face-selective cortex (Spiridon et al., 2006). Third, the processing in EBA and FBA is mostly automatic given the fact that they were activated during passive observation, unlike pSTS or frontal regions that became active when subjects performed a one-back task. However, the complexity of the motion as well as task instructions modulated the processing of biological kinematics in both body areas (experiment 2). Together, our findings clearly suggest that both body areas rather than simply responding to the body shape present in the point-light walkers (Peelen et al., 2006), integrate the different action cues, and link the portrayed action with the body. Indeed, actions such as locomotion are characteristic of the human body, and neurons in these regions might be selective for both bodies and locomotion. Alternatively, it may be computationally efficient to juxtapose neurons processing the shape of articulated objects and actions.
Figure 10.

Summary. A, Location of all local maxima obtained from experiments 1–3 in occipito-temporal areas of the right hemisphere. The black outline indicates the activation for the contrast full biological motion versus scrambled biological motion shown in Figure 1 (data from experiment 2). B, Illustration of the possible homology between the lower bank of the monkey STS and the posterior ventral temporal cortex of the human (green arrow) and between the upper bank of the monkey STS and the posterior dorsal temporal cortex of the human (red arrow). The colored outlines indicate the position (group analysis) of the LOC (brown), the hMT/V5+ (orange), and the contrast full biological motion versus scrambled biological motion (black).
The posterior STS
Classical biological motion experiments viewed the pSTS as an area primarily involved in the general processing of articulated human movements (Vaina et al., 2001; Beauchamp et al., 2002; Grossman and Blake, 2002; Pyles et al., 2007). Studies of social neuroscience, however, have emphasized the role of the pSTS region in social perception. Moving geometric shapes depicting complex social interactions activate this area more strongly than animations depicting inanimate motion (Castelli et al., 2000; Schultz et al., 2004). Moreover, Saxe et al. (2004) presented the identical visual action in different contexts, with the result that activation in pSTS depended on the inferred intentions of the actor. Similar results were also reported in several other studies (Pelphrey et al., 2003a, 2004; Grèzes et al., 2004). This led to the seemingly contradictory interpretation that pSTS is not involved in the processing of articulated movements per se, but in the perception of intentional actions and social interactions.
Our results provide an important step forward in resolving these apparent contradictions. Experiment 2 showed that articulated human movements indeed activate pSTS. However, scrambled biological motion (generally used as control condition in classical biological motion experiments) also evokes stronger activation in the pSTS than the full translational motion condition. Both effects become evident only when subjects are instructed to judge whether the stimuli presented in succession are the same or different (Fig. 7). That is, when the motion of the individual dots becomes behaviorally relevant. When we interpret the movements and intentions of others, the specific kinematics of their movements is of utmost importance. Therefore, we propose that activation in EBA and FBA signal articulated human movements per se. These signals can then be further processed for identification and/or classification as visual events, just as visual objects and scenes are. However, temporal areas like the pSTS become involved when a more detailed analysis of the action, especially its kinematics, has to be performed. Nevertheless, the congruent presentation of the human shape adds to the activation of pSTS. Even though the engagement of the subjects in a one-back task might add an attentional component, this is unlikely to explain completely the differential response in the pSTS, because areas located at a similar hierarchy level, like the FBA, do not show a significant task effect.
Our experiments suggest that one destination of the biological motion signals processed in the occipito-temporal cortex is the lower frontal cortex. This is in agreement with known connections between frontal areas and the upper bank of the STS in the monkey (Padberg et al., 2003) (see also next paragraph). For other classes of actions (Jastorff et al., 2007), the parieto-frontal circuits of action observation that feed into the mirror system (Rizzolatti and Craighero, 2004) are an additional destination.
Comparison with monkey studies
fMRI studies in the awake macaque monkeys have revealed a partial overlap between the processing of shapes and human actions. Nelissen et al. (2006) reported that, although areas in the upper and lower banks of the monkey STS responded selectively to hand actions, only areas in the lower bank in front of MT/V5 preferred intact shapes over their scrambled counterparts (Denys et al., 2004; Nelissen et al., 2006). This closely resembles findings from human fMRI experiments, in which ventral temporal areas, but not the posterior STS, respond selectively to intact objects (Malach et al., 1995; Grill-Spector et al., 1998; Kourtzi and Kanwisher, 2000; Grossman and Blake, 2002). Likewise, ventral temporal areas and pSTS respond selectively to the presentation of human actions (Iacoboni et al., 2001; Grèzes et al., 2003; Pelphrey et al., 2005; Cross et al., 2006). This suggests that, beyond the MT/V5 complex, which in monkeys is located in the posterior part of the STS and in humans in pITS, the middle and rostral part of the upper and lower banks of monkey STS are functionally similar to human pSTS and to human pITG and mid-FG, respectively (Fig. 10B).
Single-cell studies have repeatedly shown that neurons in the upper bank of the rostral STS (area STP) of the macaque respond to biological movements (Oram and Perrett, 1994). However, neurons in the lower bank of the rostral STS, which is part of IT, have also been shown to respond selectively to hand actions and human locomotion (Barraclough et al., 2006). In a recent study, Vangeneugden et al. (2009) have investigated the contribution of neurons in both banks of the STS (middle and anterior part) to the processing of human actions presented as stick figures. They reported two main categories of neurons, motion neurons and snapshot neurons. Motion neurons, mainly confined to the fundus and the upper bank of the STS, responded well to the movement sequence, but less so to translating snapshots taken from the same movies. Interestingly, many neurons continued to respond, even when the number of joints presented was reduced. Snapshot neurons, however, located in the lower bank of the STS and the lateral convexity of IT, responded equally well to the action movies and to the presentation of static snapshots.
These results are in close correspondence with our findings, indicating an anatomical segregation between shape and motion processing for point-light displays in the human brain. Experiment 1 showed similar activations in pITG and mid-FG for the full body moving with biological kinematics or simply translating. In contrast, pITS, pMTG, pSTS, and pSTG responded well to biological kinematics, even if the spatial relationship between the points was destroyed. This similarity supports a possible homology between the anterior two-thirds of lower and upper bank of the macaque STS and the ventral temporal cortex of the human (pITG and mid-FG) and the stretch of cortex surrounding the pSTS, respectively (Fig. 10B).
In conclusion, our study provides the first evidence that the initial stage in visual analysis of human movements, in which the body of the actor becomes linked to the action that he performs, occurs earlier in the visual hierarchy than was previously thought, namely in the EBA and the FBA. Activation of these areas might be sufficient for the automatic processing of human actions. Furthermore, our findings advance our understanding of the role of the dorsal posterior temporal cortex, linking results from classical biological motion experiments with findings from social neuroscience.
Footnotes
This work was supported by Fonds Wetenschappelijk Onderzoek G 151.04, Inter-University Pole of Attraction 6/29, and Excellentie Financiering 05/014. We are indebted to M. De Paep, W. Depuydt, P. Kayenbergh, G. Meulemans, and S. Verstraeten for technical support and to S. Raiguel, M. Giese, W. Vanduffel, R. Vogels, E. Grossman, and R. Blake for comments on a previous version.
References
- Amunts K, Malikovic A, Mohlberg H, Schormann T, Zilles K. Brodmann's areas 17 and 18 brought into stereotaxic space—where and how variable? Neuroimage. 2000;11:66–84. doi: 10.1006/nimg.1999.0516. [DOI] [PubMed] [Google Scholar]
- Barraclough NE, Xiao D, Oram MW, Perrett DI. The sensitivity of primate STS neurons to walking sequences and to the degree of articulation in static images. Prog Brain Res. 2006;154:135–148. doi: 10.1016/S0079-6123(06)54007-5. [DOI] [PubMed] [Google Scholar]
- Beauchamp MS, Lee KE, Haxby JV, Martin A. Parallel visual motion processing streams for manipulable objects and human movements. Neuron. 2002;34:149–159. doi: 10.1016/s0896-6273(02)00642-6. [DOI] [PubMed] [Google Scholar]
- Beauchamp MS, Lee KE, Haxby JV, Martin A. FMRI responses to video and point-light displays of moving humans and manipulable objects. J Cogn Neurosci. 2003;15:991–1001. doi: 10.1162/089892903770007380. [DOI] [PubMed] [Google Scholar]
- Blake R, Shiffrar M. Perception of human motion. Annu Rev Psychol. 2007;58:47–73. doi: 10.1146/annurev.psych.57.102904.190152. [DOI] [PubMed] [Google Scholar]
- Casile A, Giese MA. Critical features for the recognition of biological motion. J Vis. 2005;5:348–360. doi: 10.1167/5.4.6. [DOI] [PubMed] [Google Scholar]
- Castelli F, Happé F, Frith U, Frith C. Movement and mind: a functional imaging study of perception and interpretation of complex intentional movement patterns. Neuroimage. 2000;12:314–325. doi: 10.1006/nimg.2000.0612. [DOI] [PubMed] [Google Scholar]
- Cross ES, Hamilton AF, Grafton ST. Building a motor simulation de novo: observation of dance by dancers. Neuroimage. 2006;31:1257–1267. doi: 10.1016/j.neuroimage.2006.01.033. [DOI] [PMC free article] [PubMed] [Google Scholar]
- Denys K, Vanduffel W, Fize D, Nelissen K, Peuskens H, Van Essen D, Orban GA. The processing of visual shape in the cerebral cortex of human and nonhuman primates: a functional magnetic resonance imaging study. J Neurosci. 2004;24:2551–2565. doi: 10.1523/JNEUROSCI.3569-03.2004. [DOI] [PMC free article] [PubMed] [Google Scholar]
- Downing PE, Jiang Y, Shuman M, Kanwisher N. A cortical area selective for visual processing of the human body. Science. 2001;293:2470–2473. doi: 10.1126/science.1063414. [DOI] [PubMed] [Google Scholar]
- Dupont P, De Bruyn B, Vandenberghe R, Rosier AM, Michiels J, Marchal G, Mortelmans L, Orban GA. The kinetic occipital region in human visual cortex. Cereb Cortex. 1997;7:283–292. doi: 10.1093/cercor/7.3.283. [DOI] [PubMed] [Google Scholar]
- Giese MA, Poggio T. Neural mechanisms for the recognition of biological movements. Nat Rev Neurosci. 2003;4:179–192. doi: 10.1038/nrn1057. [DOI] [PubMed] [Google Scholar]
- Grèzes J, Fonlupt P, Bertenthal B, Delon-Martin C, Segebarth C, Decety J. Does perception of biological motion rely on specific brain regions? Neuroimage. 2001;13:775–785. doi: 10.1006/nimg.2000.0740. [DOI] [PubMed] [Google Scholar]
- Grèzes J, Armony JL, Rowe J, Passingham RE. Activations related to “mirror” and “canonical” neurones in the human brain: an fMRI study. Neuroimage. 2003;18:928–937. doi: 10.1016/s1053-8119(03)00042-9. [DOI] [PubMed] [Google Scholar]
- Grèzes J, Frith CD, Passingham RE. Inferring false beliefs from the actions of oneself and others: an fMRI study. Neuroimage. 2004;21:744–750. doi: 10.1016/S1053-8119(03)00665-7. [DOI] [PubMed] [Google Scholar]
- Grill-Spector K, Kushnir T, Edelman S, Itzchak Y, Malach R. Cue-invariant activation in object-related areas of the human occipital lobe. Neuron. 1998;21:191–202. doi: 10.1016/s0896-6273(00)80526-7. [DOI] [PubMed] [Google Scholar]
- Grossman E, Donnelly M, Price R, Pickens D, Morgan V, Neighbor G, Blake R. Brain areas involved in perception of biological motion. J Cogn Neurosci. 2000;12:711–720. doi: 10.1162/089892900562417. [DOI] [PubMed] [Google Scholar]
- Grossman ED, Blake R. Brain areas active during visual perception of biological motion. Neuron. 2002;35:1167–1175. doi: 10.1016/s0896-6273(02)00897-8. [DOI] [PubMed] [Google Scholar]
- Grossman ED, Blake R, Kim CY. Learning to see biological motion: brain activity parallels behavior. J Cogn Neurosci. 2004;16:1669–1679. doi: 10.1162/0898929042568569. [DOI] [PubMed] [Google Scholar]
- Hodzic A, Muckli L, Singer W, Stirn A. Cortical responses to self and others. Hum Brain Mapp. 2009;30:951–962. doi: 10.1002/hbm.20558. [DOI] [PMC free article] [PubMed] [Google Scholar]
- Holmes AP, Friston KJ. Generalizability, random effects and population inference. Neuroimage. 1998;7:S754. [Google Scholar]
- Howard RJ, Brammer M, Wright I, Woodruff PW, Bullmore ET, Zeki S. A direct demonstration of functional specialization within motion-related visual and auditory cortex of the human brain. Curr Biol. 1996;6:1015–1019. doi: 10.1016/s0960-9822(02)00646-2. [DOI] [PubMed] [Google Scholar]
- Iacoboni M, Koski LM, Brass M, Bekkering H, Woods RP, Dubeau MC, Mazziotta JC, Rizzolatti G. Reafferent copies of imitated actions in the right superior temporal cortex. Proc Natl Acad Sci U S A. 2001;98:13995–13999. doi: 10.1073/pnas.241474598. [DOI] [PMC free article] [PubMed] [Google Scholar]
- Jastorff J, Rizzolatti G, Orban GA. Somatotopy vs actinotopy in human parietal and premotor cortex. Soc Neurosci Abstr. 2007;33:127–121. [Google Scholar]
- Johansson G. Visual perception of biological motion and a model for its analysis. Percept Psychophys. 1973;14:201–211. [Google Scholar]
- Kourtzi Z, Kanwisher N. Cortical regions involved in perceiving object shape. J Neurosci. 2000;20:3310–3318. doi: 10.1523/JNEUROSCI.20-09-03310.2000. [DOI] [PMC free article] [PubMed] [Google Scholar]
- Lange J, Lappe M. A model of biological motion perception from configural form cues. J Neurosci. 2006;26:2894–2906. doi: 10.1523/JNEUROSCI.4915-05.2006. [DOI] [PMC free article] [PubMed] [Google Scholar]
- Malach R, Reppas JB, Benson RR, Kwong KK, Jiang H, Kennedy WA, Ledden PJ, Brady TJ, Rosen BR, Tootell RB. Object-related activity revealed by functional magnetic resonance imaging in human occipital cortex. Proc Natl Acad Sci U S A. 1995;92:8135–8139. doi: 10.1073/pnas.92.18.8135. [DOI] [PMC free article] [PubMed] [Google Scholar]
- Michels L, Lappe M, Vaina LM. Visual areas involved in the perception of human movement from dynamic form analysis. Neuroreport. 2005;16:1037–1041. doi: 10.1097/00001756-200507130-00002. [DOI] [PubMed] [Google Scholar]
- Nelissen K, Vanduffel W, Orban GA. Charting the lower superior temporal region, a new motion-sensitive region in monkey superior temporal sulcus. J Neurosci. 2006;26:5929–5947. doi: 10.1523/JNEUROSCI.0824-06.2006. [DOI] [PMC free article] [PubMed] [Google Scholar]
- Oram MW, Perrett DI. Responses of anterior superior temporal polysensory (STPa) neurons to “biological motion” stimuli. J Cogn Neurosci. 1994;6:99–116. doi: 10.1162/jocn.1994.6.2.99. [DOI] [PubMed] [Google Scholar]
- Padberg J, Seltzer B, Cusick CG. Architectonics and cortical connections of the upper bank of the superior temporal sulcus in the rhesus monkey: an analysis in the tangential plane. J Comp Neurol. 2003;467:418–434. doi: 10.1002/cne.10932. [DOI] [PubMed] [Google Scholar]
- Peelen MV, Downing PE. Selectivity for the human body in the fusiform gyrus. J Neurophysiol. 2005;93:603–608. doi: 10.1152/jn.00513.2004. [DOI] [PubMed] [Google Scholar]
- Peelen MV, Wiggett AJ, Downing PE. Patterns of fMRI activity dissociate overlapping functional brain areas that respond to biological motion. Neuron. 2006;49:815–822. doi: 10.1016/j.neuron.2006.02.004. [DOI] [PubMed] [Google Scholar]
- Pelphrey KA, Singerman JD, Allison T, McCarthy G. Brain activation evoked by perception of gaze shifts: the influence of context. Neuropsychologia. 2003a;41:156–170. doi: 10.1016/s0028-3932(02)00146-x. [DOI] [PubMed] [Google Scholar]
- Pelphrey KA, Mitchell TV, McKeown MJ, Goldstein J, Allison T, McCarthy G. Brain activity evoked by the perception of human walking: controlling for meaningful coherent motion. J Neurosci. 2003b;23:6819–6825. doi: 10.1523/JNEUROSCI.23-17-06819.2003. [DOI] [PMC free article] [PubMed] [Google Scholar]
- Pelphrey KA, Morris JP, McCarthy G. Grasping the intentions of others: the perceived intentionality of an action influences activity in the superior temporal sulcus during social perception. J Cogn Neurosci. 2004;16:1706–1716. doi: 10.1162/0898929042947900. [DOI] [PubMed] [Google Scholar]
- Pelphrey KA, Morris JP, Michelich CR, Allison T, McCarthy G. Functional anatomy of biological motion perception in posterior temporal cortex: an FMRI study of eye, mouth and hand movements. Cereb Cortex. 2005;15:1866–1876. doi: 10.1093/cercor/bhi064. [DOI] [PubMed] [Google Scholar]
- Peuskens H, Vanrie J, Verfaillie K, Orban GA. Specificity of regions processing biological motion. Eur J Neurosci. 2005;21:2864–2875. doi: 10.1111/j.1460-9568.2005.04106.x. [DOI] [PubMed] [Google Scholar]
- Press WA, Brewer AA, Dougherty RF, Wade AR, Wandell BA. Visual areas and spatial summation in human visual cortex. Vision Res. 2001;41:1321–1332. doi: 10.1016/s0042-6989(01)00074-8. [DOI] [PubMed] [Google Scholar]
- Pyles JA, Garcia JO, Hoffman DD, Grossman ED. Visual perception and neural correlates of novel “biological motion.”. Vision Res. 2007;47:2786–2797. doi: 10.1016/j.visres.2007.07.017. [DOI] [PubMed] [Google Scholar]
- Rizzolatti G, Craighero L. The mirror-neuron system. Annu Rev Neurosci. 2004;27:169–192. doi: 10.1146/annurev.neuro.27.070203.144230. [DOI] [PubMed] [Google Scholar]
- Santi A, Servos P, Vatikiotis-Bateson E, Kuratate T, Munhall K. Perceiving biological motion: dissociating visible speech from walking. J Cogn Neurosci. 2003;15:800–809. doi: 10.1162/089892903322370726. [DOI] [PubMed] [Google Scholar]
- Saxe R, Xiao DK, Kovacs G, Perrett DI, Kanwisher N. A region of right posterior superior temporal sulcus responds to observed intentional actions. Neuropsychologia. 2004;42:1435–1446. doi: 10.1016/j.neuropsychologia.2004.04.015. [DOI] [PubMed] [Google Scholar]
- Saygin AP, Wilson SM, Hagler DJ, Jr, Bates E, Sereno MI. Point-light biological motion perception activates human premotor cortex. J Neurosci. 2004;24:6181–6188. doi: 10.1523/JNEUROSCI.0504-04.2004. [DOI] [PMC free article] [PubMed] [Google Scholar]
- Schultz J, Imamizu H, Kawato M, Frith CD. Activation of the human superior temporal gyrus during observation of goal attribution by intentional objects. J Cogn Neurosci. 2004;16:1695–1705. doi: 10.1162/0898929042947874. [DOI] [PubMed] [Google Scholar]
- Schwarzlose RF, Baker CI, Kanwisher N. Separate face and body selectivity on the fusiform gyrus. J Neurosci. 2005;25:11055–11059. doi: 10.1523/JNEUROSCI.2621-05.2005. [DOI] [PMC free article] [PubMed] [Google Scholar]
- Spiridon M, Fischl B, Kanwisher N. Location and spatial profile of category-specific regions in human extrastriate cortex. Hum Brain Mapp. 2006;27:77–89. doi: 10.1002/hbm.20169. [DOI] [PMC free article] [PubMed] [Google Scholar]
- Sunaert S, Van Hecke P, Marchal G, Orban GA. Motion-responsive regions of the human brain. Exp Brain Res. 1999;127:355–370. doi: 10.1007/s002210050804. [DOI] [PubMed] [Google Scholar]
- Taylor JC, Wiggett AJ, Downing PE. Functional MRI analysis of body and body part representations in the extrastriate and fusiform body areas. J Neurophysiol. 2007;98:1626–1633. doi: 10.1152/jn.00012.2007. [DOI] [PubMed] [Google Scholar]
- Troje NF. Decomposing biological motion: a framework for analysis and synthesis of human gait patterns. J Vis. 2002;2:371–387. doi: 10.1167/2.5.2. [DOI] [PubMed] [Google Scholar]
- Vaina LM, Solomon J, Chowdhury S, Sinha P, Belliveau JW. Functional neuroanatomy of biological motion perception in humans. Proc Natl Acad Sci U S A. 2001;98:11656–11661. doi: 10.1073/pnas.191374198. [DOI] [PMC free article] [PubMed] [Google Scholar]
- Van Essen DC. A population-average, landmark- and surface-based (PALS) atlas of human cerebral cortex. Neuroimage. 2005;28:635–662. doi: 10.1016/j.neuroimage.2005.06.058. [DOI] [PubMed] [Google Scholar]
- Van Essen DC, Drury HA, Dickson J, Harwell J, Hanlon D, Anderson CH. An integrated software suite for surface-based analyses of cerebral cortex. J Am Med Inform Assoc. 2001;8:443–459. doi: 10.1136/jamia.2001.0080443. [DOI] [PMC free article] [PubMed] [Google Scholar]
- Vangeneugden J, Pollick F, Vogels R. Functional differentiation of macaque visual temporal cortical neurons using a parametric action space. Cereb Cortex. 2009;19:593–611. doi: 10.1093/cercor/bhn109. [DOI] [PubMed] [Google Scholar]
- Van Oostende S, Sunaert S, Van Hecke P, Marchal G, Orban GA. The kinetic occipital (KO) region in man: an fMRI study. Cereb Cortex. 1997;7:690–701. doi: 10.1093/cercor/7.7.690. [DOI] [PubMed] [Google Scholar]