Abstract
The calyx of Held synapse in the medial nucleus of the trapezoid body of the auditory brainstem has become an established in vitro model to study the development of fast glutamatergic transmission in the mammalian brain. However, we still lack in vivo data at this synapse on the maturation of spontaneous and sound-evoked discharge activity before and during the early phase of acoustically evoked signal processing (i.e., before and after hearing onset). Here we report in vivo single-unit recordings in mice from postnatal day 8 (P8) to P28 with a specific focus on developmental changes around hearing onset (P12). Data were obtained from two mouse strains commonly used in brain slice recordings: CBA/J and C57BL/6J. Spontaneous discharge rates progressively increased from P8 to P13, initially showing bursting patterns and large coefficients of variation (CVs), which changed to more continuous and random discharge activity accompanied by gradual decrease of CV around hearing onset. From P12 on, sound-evoked activity yielded phasic-tonic discharge patterns with discharge rates increasing up to P28. Response thresholds and shapes of tuning curves were adult-like by P14. A gradual shortening in response latencies was observed up to P18. The three-dimensional tonotopic organization of the medial nucleus of the trapezoid body yielded a high-to-low frequency gradient along the mediolateral and dorsoventral but not in the rostrocaudal axes. These data emphasize that models of signal transmission at the calyx of Held based on in vitro data have to take developmental changes in firing rates and response latencies up to the fourth postnatal week into account.
Introduction
The calyx synapses in the medial nucleus of the trapezoid body (MNTB) enable a fast and reliable transduction of afferent auditory information, a key component in brainstem processing of sound source localization [for review, see Yin (2002) and Tollin (2003)]. Because of its specific morphology, the calyx of Held has become a preferred model system for studying mechanisms controlling synaptic transmission [for review, see von Gersdorff and Borst (2002) and Schneggenburger and Forsythe (2006)]. Most studies, performed in mice and rats, report presynaptic and postsynaptic developmental changes in receptor distribution and channel kinetics up to the end of the second postnatal week, shortly after the onset of hearing at postnatal day 12 (P12) (von Gersdorff and Borst, 2002). These modifications in synaptic physiology go along with morphological changes of the calyx terminal up to the end of the second postnatal week (Morest, 1968; Kandler and Friauf, 1993; Kil et al., 1995; Hoffpauir et al., 2006).
A functional interpretation of the many and diverse data concerning signal transmission at the calyx synapse calls for equal insight into the respective presynaptic and postsynaptic activity in vivo. However, all available in vivo data on the physiology of MNTB principal neurons were obtained in adult animals [cat: Guinan and Li (1990), Tollin and Yin (2005), and Mc Laughlin et al. (2008); rat: Sommer et al. (1993), Paolini et al. (2001), Kopp-Scheinpflug et al. (2008), and Tolnai et al. (2008b); gerbil: Kopp-Scheinpflug et al. (2003b, 2008), Green and Sanes (2005) (P15–P19), Hermann et al. (2007), and Tolnai et al. (2008a); mouse: Kopp-Scheinpflug et al. (2003a, 2008)]. We still lack the respective information on early postnatal development of presynaptic and postsynaptic activity in the MNTB covering the period from P4 to P14, the age range used in most in vitro studies [for review, see von Gersdorff and Borst (2002) and Schneggenburger and Forsythe (2006)]. The data presented here focus mostly on this developmental period, including (1) postnatal changes before P11 when sound-driven signal processing is neither discernible in mice nor in rats and (2) changes up to P17, when near adult-like auditory processing has been reported on the level of the brainstem in mice [inferior colliculus (IC) (Shnerson and Willott, 1979)].
The present study is based on extracellular, single-unit recordings in vivo in mice and investigates both spontaneous and sound-evoked activity in MNTB principal cells between P8 and P28, with a special focus on the developmental period around hearing onset. In analyzing the data, emphasis was on (1) the development of the rate and pattern of spontaneous and acoustically evoked discharge activity, (2) the development of the latency and jitter of responses to acoustic stimuli, and (3) the relation of physiological features to the units' characteristic frequencies. Data were collected from two mouse strains commonly used in brain slice recordings: CBA/J and C57BL/6J. Additionally, the three-dimensional tonotopy of the MNTB was precisely mapped in a P23 mouse using multiunit recordings. This information will be useful for the evaluation of differences in physiological properties of MNTB neurons recorded in vitro.
Materials and Methods
Animals and surgery
Data were collected from wild-type mice (Mus musculus) of two strains commonly used in brain slice recordings: CBA/J mice (20 animals) and C57BL/6J mice (14 animals). CBA/J mice have the advantage that they show stable hearing long throughout life, while C57BL/6J mice suffer from early onset of hearing loss at ∼2 months of age (Henry and Chole, 1980; Li and Borg, 1991). The latter strain, however, is prominently used as a background strain for knock-out lines. This dual approach enables a direct comparison between the two strains and the data can also serve as reference when studying specific knock-out lines.
The experiments were performed at the Neurobiology Laboratories of the Institute of Biology II at the University of Leipzig. Recordings were obtained from P8–P28 animals spanning the range from earlier developmental stages, when acoustic signals do not elicit any action potentials in the central auditory system (prehearing, P8–P11), until the achievement of adult-like hearing capabilities (P15–P17). For each postnatal age, 2–5 mice were tested. During surgery and recording sessions, animals were anesthetized by an initial intraperitoneal injection of a mixture of ketamine hydrochloride (0.1 mg/g body weight; Pfizer) and xylazine hydrochloride (0.005 mg/g body weight; Bayer). Anesthesia was maintained during recording sessions by supplementary injections of one-third of the initial dose when necessary. Depending on the age of the animals, the additional doses of anesthesia were applied every 160–230 min in P8 animals, every 120–200 min in P10 animals, and every 45–170 min in P11–P28 animals. We estimate possible effects of anesthesia treatment on the units' discharge rates by correlating the spontaneous rates (SRs) to the time after the last application of anesthesia. Data were separately analyzed for P8, P10, and P11–P28 mice, since in all groups the range of spontaneous rates and the time between the supplementary doses of anesthesia differed greatly. The analysis did not yield any significant correlation between the units' spontaneous rates and the depth of anesthesia in both age groups (supplemental Fig. 1, available at www.jneurosci.org as supplemental material). The mice were fixed in a stereotaxic recording device through a small metal bolt glued to the prefrontal skull overlaying the forebrain. Two 500-μm-diameter holes were drilled at a distance of 1800–2000 μm caudal to the lambda suture. The first hole was located at the midline and was used to insert the recording electrode. The second hole was drilled 1000–1500 μm lateral to the midline and enabled insertion of the reference electrode into the superficial cerebellum.
Data collection
The experiments were performed in a sound-attenuated chamber (A400, Industrial Acoustics) on a vibration-isolated table (Physics Instruments T 251.SL). The animals were positioned on a temperature-controlled heating pad to maintain the body temperature at 38°C. Glass micropipettes (Harvard Apparatus; GC150F-10) filled with 3 m KCl were used for recordings. The MNTB was approached dorsally and typically reached at penetration depths of 5000–6000 μm depending on the size of the animal. Voltage signals were bandpass filtered (0.3–7 kHz), amplified (PC1, TDT), and digitized by an A/D converter (RP2.1, TDT) at a sampling rate of 97.7 kHz before storing for offline analysis using custom-written MATLAB software (7.5, The MathWorks).
Tonotopic map.
The three-dimensional, tonotopic arrangement of the MNTB was reconstructed based on multiunit recordings in a P23 CBA/J mouse using electrodes with impedances of 1–4 MΩ. In rats it was shown that auditory brainstem nuclei reveal adult-like tonotopic maps at this postnatal age (Friauf, 1992). The characteristic frequency (CF) of multiunits was systematically documented every 50 μm along the dorsoventral dimension, in ∼100 μm steps mediolaterally (1° change in mediolateral angle of electrode penetration), and in ∼200 μm steps rostrocaudally (2° change in rostrocaudal angle of electrode penetration).
Single-unit recordings.
Single-unit recordings were obtained by using electrodes with high impedances (5–12 MΩ). The main criterion for identifying MNTB principal neurons was the characteristic complex waveform consisting of the calyceal potential (“prepotential”) preceding the postsynaptic action potential (Guinan and Li, 1990). In hearing animals, activity driven by contralateral acoustic stimulation served as an additional criterion (Kopp-Scheinpflug et al., 2008). Since the latter criterion could not be used in prehearing animals, recording sites were verified histologically by iontophoretic injection (4 μA, 10 min) of fluorogold (FG). Thereafter, the experimental animals were allowed to survive for ∼5–7 h to ensure uptake of the tracer by the neurons, before perfusion with 5% paraformaldehyde. The brains were postfixed for another 24 h. After cutting the brain on a vibratome (100 μm sections), the FG mark was visualized under fluorescence microscope with a stimulation wavelength of 361 nm and an emission wavelength of 536 nm.
Acoustic stimulation and data evaluation
Acoustic stimuli were generated by custom-written MATLAB software at a sampling rate of 97.7 kHz, sent to a D/A converter (RP2.1, TDT), and transferred to electrostatic couplers (ES1, TDT) that were controlled by an electrostatic speaker driver (ED1, TDT). The stimuli were delivered through plastic tubes with 5 mm diameter located in the outer ear canal at a distance of ∼4 mm to the eardrum.
Three stimulation protocols were used: (1) Spontaneous discharge activity was acquired in absence of acoustic stimulation. The coefficient of variation (CV) was calculated from these records using sample times of 60–300 s depending on the units' holding times. (2) The excitatory response area was measured by randomized presentation of tone bursts (100 ms stimulus length, 5 ms rise and fall time, 100 ms interstimulus interval) within a predefined matrix of 20 × 10 frequency/intensity pairs (frequencies were scaled logarithmically). The intensity typically ranged from 0 to 90 dB sound pressure level (SPL) and each frequency/intensity pair was presented five times. From these data, the frequency-tuning curve, the maximum discharge rate, and the rate-level function were extracted. (3) Characterization of temporal response properties was based on repetitive presentation of tone bursts (100 ms stimulus length, 5 ms rise and fall time, 100–300 ms interstimulus interval, 250 repetitions) at CF with intensities of 20–50 dB above threshold depending on the units' individual threshold values. This stimulus paradigm was used for evaluation of response patterns, spike latencies, and jitter of evoked responses.
Analysis of spike recordings
Waveform analysis.
The voltage traces were triggered at a visually determined level where all complex spike waveforms could be detected. Each waveform was collected from 2 ms preceding to 2.5 ms following the trigger point. All triggered waveforms were spike-sorted by means of principal component analysis (PCA) followed by cluster analysis. The clusters representing the complex waveforms were chosen and merged. Waveforms were then temporally aligned at the minimum of the postsynaptic component and averaged. Whether the waveform contained a prepotential was determined automatically. Briefly, the largest local maximum preceding the maximum of the postsynaptic component was detected. The height of this maximum was then tested against the distribution of baseline fluctuations (Wilcoxon signed ranks test). Only units with a significant prepotential were included in the dataset.
Coefficient of variation.
The CV serves as a measure for regularity of spike discharges (Young et al., 1988; Jones and Jones, 2000; Jones et al., 2001, 2007). It is defined as the ratio of SD of interspike intervals (ISIs) and mean ISI (CV = SDISI/meanISI). Discharge patterns that follow a near Poisson-distributed process show CV values close to 1 and are found in mature sensory neurons (Walsh et al., 1972; Jones and Jones, 2000; Jones et al., 2001, 2007). Bursting patterns lead to CV values >1 (Jones and Jones, 2000; Jones et al., 2007).
Response area.
The frequency-tuning curve was defined as the outline of the array of frequency/intensity pairs that elicited an increase in discharge rate above the spontaneous rate (1% significance level). From the frequency-tuning curve, the CF (defined as the frequency with the lowest threshold) and the respective threshold at CF were determined. Maximum discharge rate corresponded to the highest rate elicited by one of the 200 frequency/intensity pairs. Typically, the frequencies eliciting maximum discharge rates (best frequencies) were in the range from CF to ¼ octave below CF at intensities between 60 and 80 dB SPL. Rate-level-functions were measured at CF by averaging the discharge rates at each stimulus level (10 levels between 0 and 90 dB SPL, 5 repetitions/stimulus).
Latency and jitter.
The values for latency and jitter were taken from the units' peristimulus time histogram (PSTH; bin width: 0.2 ms). The response latency was measured as the time from the onset of the stimulus to the time when the stimulus evoked response reached its half-maximal value of the onset peak (Kopp-Scheinpflug et al., 2003b; Tolnai et al., 2008a). The jitter of the onset response was measured as the time between the 10% and 90% value of the onset peak. This value enables estimation of temporal fidelity of the onset response during repetitive stimulation.
Data analysis and statistics were performed in MATLAB, SigmaPlot (8.0, SYSTAT), and SigmaStat (3.0, SYSTAT). Results are expressed as mean ± SEM. Unless indicated otherwise, statistical significance was evaluated by the t test or by the Mann–Whitney rank-sum test and by the one-way ANOVA or Kruskal Wallis one-way ANOVA on ranks, respectively, depending on the distribution of the values.
Results
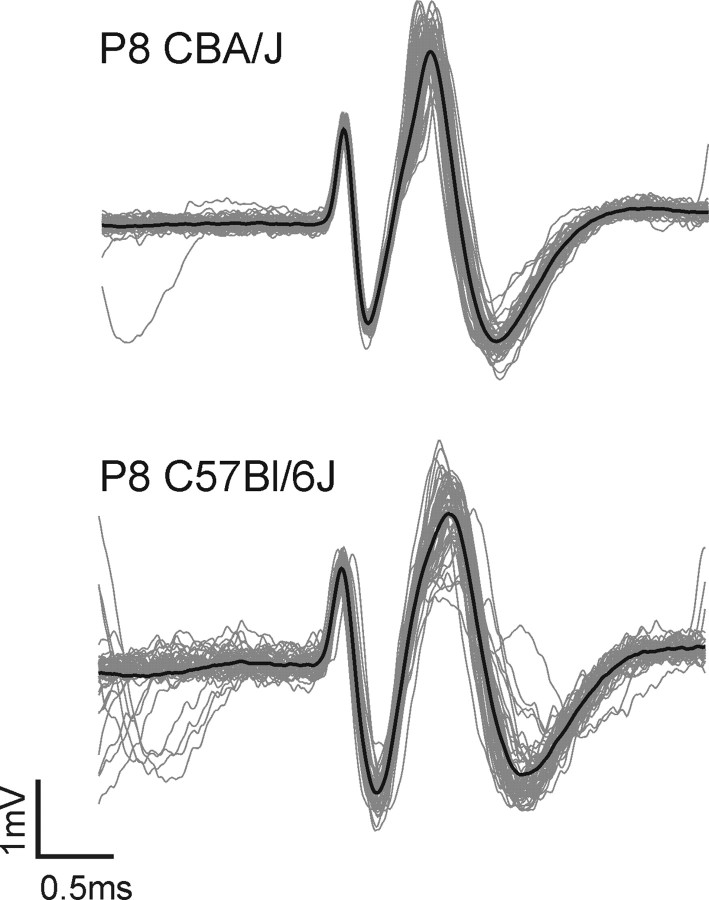
Complex action potentials of MNTB units identified by the clear separation of presynaptic and postsynaptic signal components (Kopp-Scheinpflug et al., 2008) were obtained through extracellular recordings from 179 units in CBA/J and from 110 units in C57BL/6J mice (Fig. 1). Recordings were conducted at postnatal ages P8, P10, P11, P12, P13, P14, P18, P23, and P28 and thus covered the developmental period from 4 d before to 16 d after the onset of hearing at P12.
Figure 1.
Compound waveforms of MNTB units from a CBA/J mouse (upper graph) and a C57BL/6J mouse (lower graph). Each graph shows 50 superimposed waveforms (black line, mean waveform) of a P8 single-unit during spontaneous discharge activity aligned at the positive peak of the first component which shows the activity of the presynaptic calyx terminal. The second component corresponds to the action potential of the postsynaptic cell. Similar compound waveforms were found at all postnatal ages studied, though the amplitude ratio between presynaptic and postsynaptic components may vary.
Spontaneous activity
Spontaneous activity was acquired from 162 units in CBA/J mice and from 107 units in C57BL/6J mice. All units at all postnatal ages, including the units of prehearing mice at P8, P10, and P11, showed spontaneous discharge activity. Although it cannot be ruled out that “silent” MNTB units were missed in prehearing mice, we have circumstantial evidence that this was not the case. When advancing the electrode through the MNTB, (1) the approach of a unit is indicated by a reduction of the baseline amplitude of the recorded baseline signal due to an increase in the input resistance; (2) typically any mechanical stimulation of the neuron's membrane by the electrode tip triggers a few spikes; and ultimately (3) an accidental penetration of the neuron's membrane causes a high-frequency series of injury potentials that eventually die off. None of these indications of “silent” units were observed in the recordings from prehearing mice.
Spontaneous rates were calculated from recordings 60–300 s in duration. Exemplary traces at different ages are illustrated in Figure 2A. At P8 and P10, the discharge rates ranged from 1.5 to 16 spikes/s (sp/s) in CBA/J mice (n = 31) and from 1.4 to 19 spikes/s in C57BL/6J mice (n = 22) (Fig. 2B). At P11 and P12, the range of spontaneous rates expanded to values between 0.08 and 81 spikes/s in CBA/J mice (n = 45) and between 1.3 and 107 spikes/s in C57BL/6J mice (n = 23). From P13 to P28, the cell-to-cell variability in spontaneous rates further increased (0.05–196 spikes/s in CBA/J, n = 86; 0.05–199 spikes/s in C57BL/6J, n = 62). Despite the extended range of spontaneous rates, ∼50% of the units had discharge rates <20 spikes/s (Fig. 2C). At P8–P10, the median and interdecile range of spontaneous rates was lowest (Fig. 2B), both in CBA/J mice (median: 4.8 spikes/s, interdecile range: 3–13 spikes/s; n = 31) and in C57BL/6J mice (median: 7 spikes/s, interdecile range: 2–17.5 spikes/s, n = 22). At P11–P12, the average spontaneous rates shifted toward higher discharge rates (CBA/J median: 37 spikes/s, interdecile range: 0.45–66 spikes/s, n = 45; C57BL/6J median: 35 spikes/s, interdecile range: 4–72 spikes/s, n = 23). No further increase in average spontaneous rate was observed between P13–P28 mice (CBA/J median: 31 spikes/s, n = 86; C57BL/6J median: 28 spikes/s, n = 62). Overall, the course of developmental changes in spontaneous activity was comparable between CBA/J mice and C57BL/6J mice. The rates recorded at P13–P28 were also comparable to measurements in adult gerbils (Hermann et al., 2007) and mice (Kopp-Scheinpflug et al., 2008).
Figure 2.
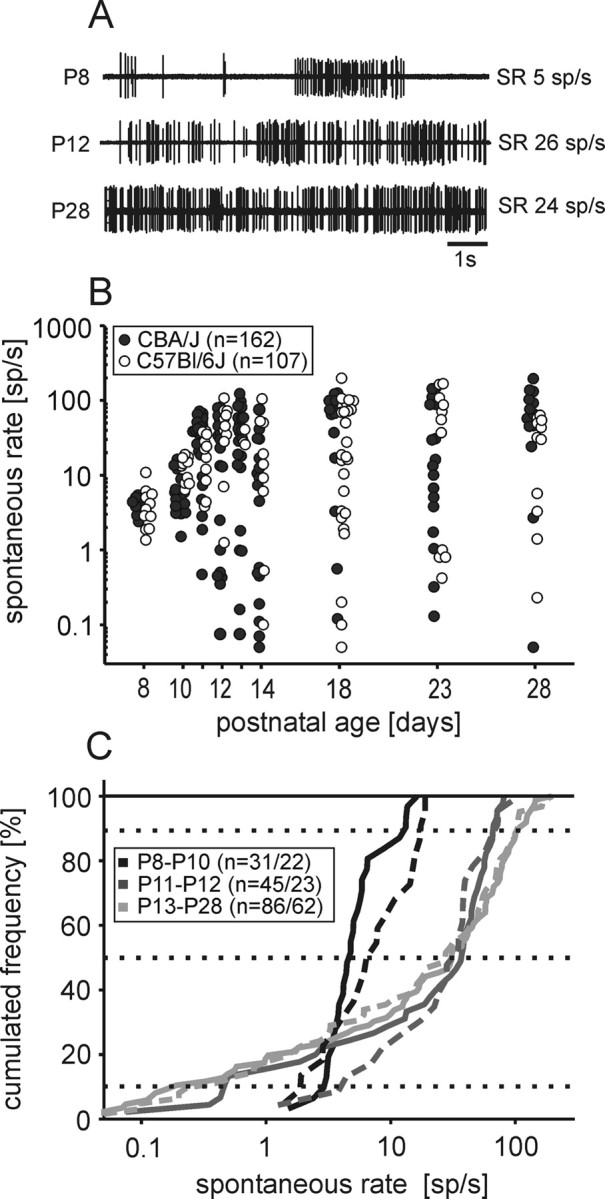
Development of spontaneous activity. A, Exemplary traces (10 s excerpts) of spontaneous discharges at three ages (P8, P12, P28). B, Spontaneous rates of single units. The range of spontaneous rates increased during development, both in CBA/J mice (filled circles, p < 0.001, ANOVA on ranks) and C57BL/6J mice (open circles, p < 0.001, ANOVA on ranks). The number of units recorded in each age group varied between 10 and 26 in CBA/J mice and between 3 and 28 in C57BL/6J mice. C, Cumulated distribution of spontaneous rates at different ages with marks of the respective medians (50%) and interdecile ranges (10–90%). In prehearing mice (P8–P10), units showed low spontaneous discharge rates (1–20 spikes/s). At P11–P12 and P13–P28, the values expanded both to lower (<1 spikes/s) and higher (maximum 200 spikes/s) rates. There was no significant difference between CBA/J (solid lines) and C57BL/6J mice (dashed lines); the respective numbers of units are indicated as follows: n = #CBA/#C57BL.
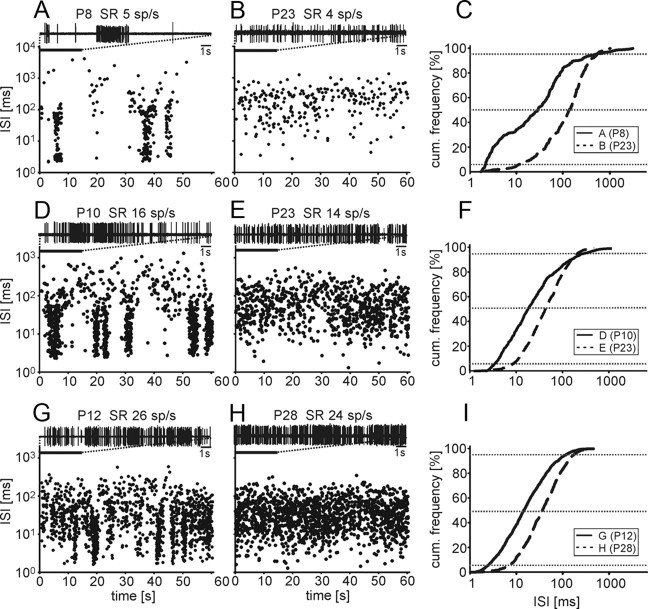
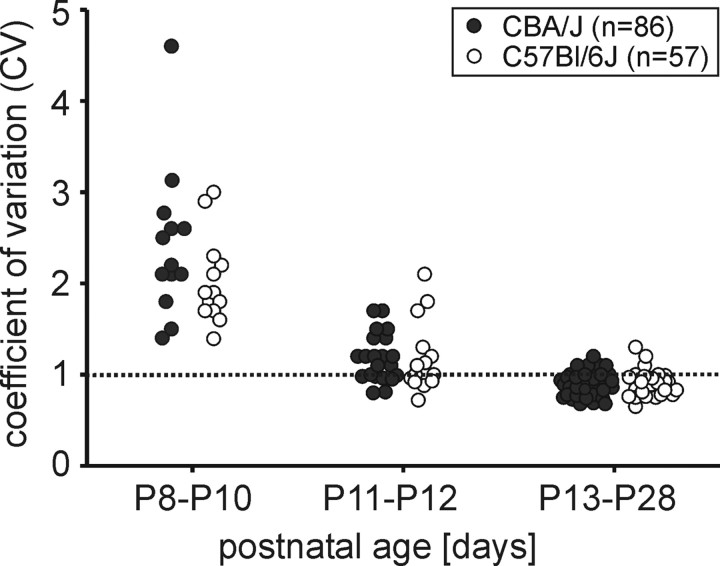
In both mouse strains, the patterns of spontaneous discharges differed strongly between prehearing and hearing mice. At P8 and P10, spontaneous spikes were grouped in bursts (Fig. 3A,D) lasting for 2.5 ± 0.2 s (n = 28 bursts in 5 units) followed by silent periods or periods of greatly reduced discharge activity (lasting between 0.4–30 s, n = 26 interburst intervals in 5 units). At P11 and P12, units with bursting and nonbursting patterns were recorded in one and the same animal (ratio burst/nonburst: CBA/J ∼1:1 at P11 and P12; C57BL/6J ∼2:1 at P11 and ∼1:2 at P12). Still, in this transitional phase the bursting units no longer showed silent periods in between the bursts (Fig. 3G). Within a single burst, the ISI mostly ranged between 2 and 100 ms regardless of the firing rate of the respective unit in animals from P8 to P12 (Fig. 3A,D,G). In hearing animals from P13 to P28, none of the units showed spontaneous bursting discharge activity, i.e., the spontaneous spike discharges were more regularly distributed regardless of the rates of firing of the units (Fig. 3B,E,H). For the six examples shown in Figure 3, the distribution of the ISIs was further quantified from cumulated distributions of ISIs. The medians of ISIs were lower in bursting units compared with nonbursting units (Fig. 3C,F,I) (the respective medians of the three bursting units were 36 ms, 19 ms, and 18 ms, and of the three nonbursting units 176 ms, 46 ms, and 29 ms). In contrast, the range of ISIs were similar between bursting and nonbursting units (5th/95th percentiles of the three bursting units were 3/619 ms, 4/271 ms, and 3/149 ms, and of the three nonbursting units 13/697 ms, 9/221 ms, and 5/127 ms, respectively). So, while the distribution of the ISI differs between bursting and nonbursting units (resulting in patterned or more continuous discharges), the total range of ISIs was mostly comparable between the two groups. Regularity of spontaneous discharges was quantified by the CV (see Materials and Methods). Higher CVs indicate more irregular or complex discharge patterns, e.g., bursting units. At P8 and P10, CV values >1 indicated bursting activity (CBA/J mean: 2.4 ± 0.2, n = 13; C57BL/6J mean: 2 ± 0.1, n = 13) (Fig. 4). In P11 and P12 animals, mean CV values were lower (1.2 ± 0.1 for CBA/J mice, n = 21; and 1.3 ± 0.1 for C57BL/6J mice, n = 16), pointing to the vanishing of bursting activity. Finally, at P13–P28 the CVs were in the range of ∼1 (CBA/J mean: 0.9 ± 0.02, n = 52; C57BL/6J mean: 0.9 ± 0.02, n = 28), which indicates a near-Poisson distribution of spontaneous spikes typical for mature auditory neurons (Fig. 4) [see Jones et al. (2007) for further citations].
Figure 3.
Patterns of spontaneous discharge activity. The distribution of ISIs for 60 s of spontaneous spike discharges and 15 s excerpts of the original spike trains (on top of each graph) of six exemplary single units (3 pairs with comparable spontaneous rates indicated above the respective graphs) is shown; bursting units are on the left side, nonbursting units in the middle, and cumulated distributions of ISI of the respective pairs of units on the right side. In units of prehearing mice and in some units of P11 and P12 mice, spontaneous spikes were grouped in bursts indicated by periods of increased spike rate embedded in silent periods or in periods of reduced discharge activity (A, D, G). Within the bursts, ISIs were mostly in the range of 2–100 ms. From P13 to P28, bursting was never observed and spike discharges were more continuous (B, E, H). The cumulated distributions of ISI of the six units (C, F, I) shows that the median values (middle dotted line) of ISIs in bursting units are always smaller than in nonbursting units with comparable discharge rates. Still, the extremes of the range of ISIs in the two groups as indicated by the 5th and 95th percentiles (upper and lower dotted lines) are mostly in the same range.
Figure 4.
Spontaneous bursting activity decreases with age. Regularity of spontaneous discharge activity was quantified by CV (see Materials and Methods). At P8 and P10, all units in both strains (CBA/J: closed circles, C57BL/6J: open circles) had CV >1, indicating irregular (bursting) spike discharges. From P13 to P28, CV values ranged between 0.7 and 1.3, which reflect more regular, nonbursting discharge patterns (CV ∼1, near-Poisson discharge, dashed line). At P11 and P12, CV values were smaller than at younger ages. Still, some units had CV values >1.3, implying a tendency for bursting discharge activity, while other units (partly in the same animal) had lower CV values, between 0.8 and 1.3, corresponding to nonbursting units in older groups.
Acoustically evoked activity
The onset of acoustically evoked activity at P12 in both mouse strains corresponds to earlier reports of development of auditory brainstem processing in mice and rats [mouse: Kamiya et al. (2001); rat: Blatchley et al. (1987) and Geal-Dor et al. (1993)]. At this age, also the outer ear canal opens in these animals. Presently, we documented developmental changes of sound-evoked response characteristics of MNTB units up to P28, which is beyond the time when the establishment of near adult-like single-unit response characteristics in auditory brainstem units had been assessed in earlier studies (P15–P17 in IC) (Shnerson and Willott, 1979). We focused on the distribution of CFs, response thresholds, maximum-evoked discharge rates, rate-level functions, temporal response patterns, and response latencies.
Characteristic frequencies and threshold values
The CFs and threshold values were obtained from the pure tone response areas of 111 units in CBA/J mice and 68 units in C57BL/6J mice. Representative frequency-tuning curves at P12, P14, and P23 are illustrated in Figure 5. At P12, the units typically showed symmetrically shaped, broad frequency-tuning curves lacking steep high-frequency flanks and prominent low-frequency tails. We aimed at recording single units from as many different positions in the MNTB as possible to cover most of the frequency range represented in the nucleus. The audiogram of mice covers five octaves with frequencies from 2 to ∼75 kHz (Ehret and Moffat, 1984; Egorova et al., 2001; Müller et al., 2005). Our setup enabled stimulus generation up to 50 kHz, so we might have missed the representation of half of the highest octave of the hearing range. The units had CFs between 2.7 and 35 kHz in C57BL/6J mice and between 3 and 40 kHz in CBA/J mice, the highest CF acquired in multiunit recordings was 45 kHz (see below). At P12 and P13, in either strain no CFs >25 kHz and >32 kHz were recorded, respectively (Fig. 6A). At all postnatal ages, the lowest threshold values were between 10 and 20 kHz, which is consistent with behavioral audiograms (Fig. 6A; black line) (Berlin, 1963). Up to P23, no strain-specific differences in hearing thresholds were encountered (Table 1). The threshold values showed a decrease from P12 to P14. Minimum threshold values dropped from 40 dB SPL to 10 dB SPL at P13 and to 0 dB SPL at P14, after which no further improvement of thresholds was observed (Fig. 6A, dotted lines). At P28, C57BL/6J mice showed deteriorated hearing thresholds compared with age-matched CBA/J mice (C57BL/6J mean: 50 ± 5 dB SPL, n = 10; CBA/J mean: 31 ± 5 dB SPL, n = 16; p = 0.012, Mann–Whitney rank-sum test), indicating an early onset of developmental hearing loss previously reported for C57BL/6J mice (Mikaelian, 1979; Henry and Chole, 1980; Li and Borg, 1991). Neither of the mouse strains showed a correlation between spontaneous rate and CF (Fig. 6B) as described for mammals with better low-frequency hearing [gerbil: Kopp-Scheinpflug et al. (2008); cat: Spirou et al. (1990) and Smith et al. (1998)].
Figure 5.
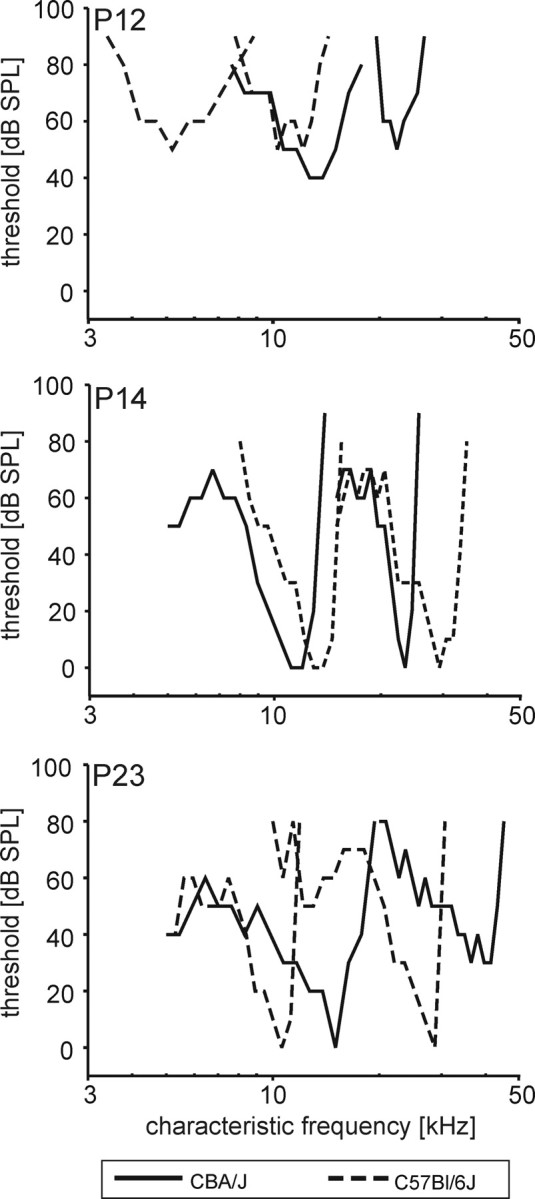
Frequency-tuning curves at P12, P14, and P23. Representative frequency-tuning curves of two units for each mouse strain. At P12 units in both strains (CBA/J, solid lines; C57BL/6J, dashed lines) showed broad, symmetrical tuning curves and high thresholds. From P14 on, tuning curves typically displayed low-frequency tails, sharply tuned peaks, and low threshold values.
Figure 6.
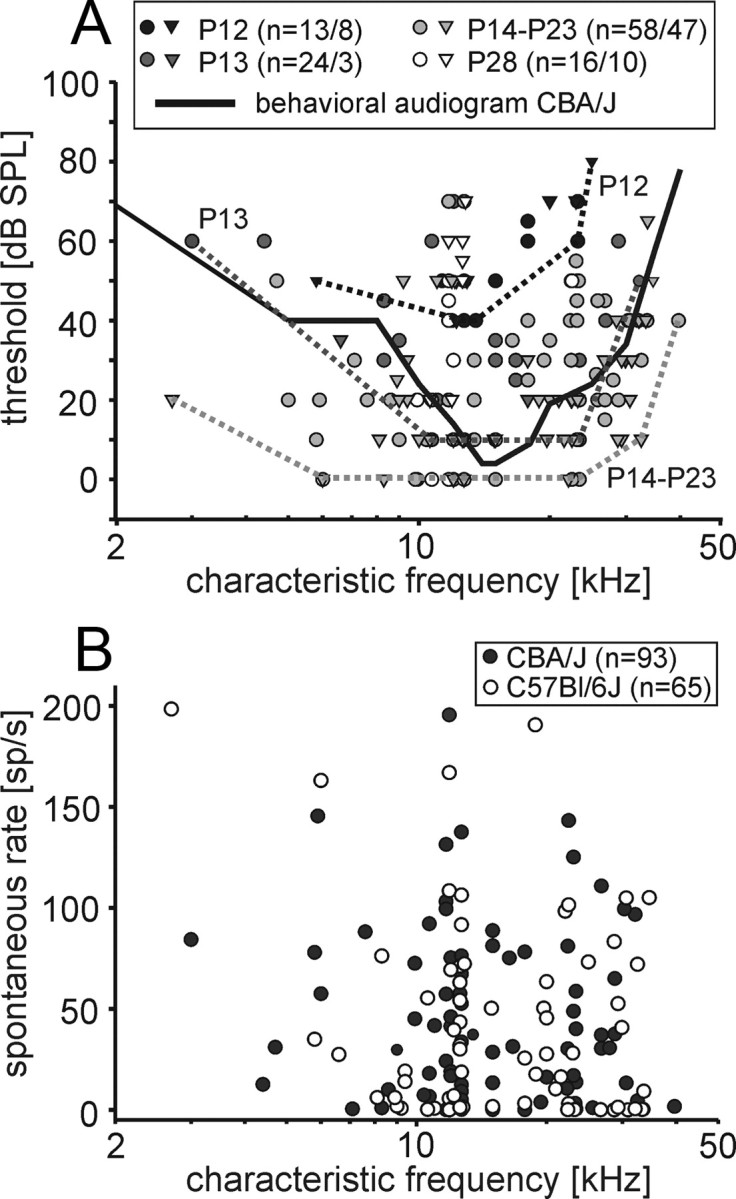
Distribution of characteristic frequencies and thresholds. A, CFs between 3 and 40 kHz were recorded in CBA/J mice (circles) and between 2.7 and 35 kHz in C57BL/6J mice (triangles). No units were recorded with CF >25 kHz at P12 and >32 kHz at P13. At all postnatal ages, the respective lowest threshold values were found for frequencies between 10 and 20 kHz (see dotted lines, visually delineated audiograms at P12, P13, and P14–P23), which is consistent with the behavioral audiogram of mice [black solid line; based on classically conditioned galvanic skin responses recorded from rear paw pads to shock to front paw pads in 50 mice (Berlin, 1963)]. At P12, minimal thresholds were at 40 dB SPL, and they subsequently lowered to the adult-like values of 0 dB SPL at P14. Already at P28 in C57BL/6J mice but not in CBAJ mice, the high-frequency thresholds showed signs of deterioration. Numbers of units are given as follows: n = #CBA/#C57BL. B, Spontaneous discharge rates at different CFs. In both strains (CBA/J: filled circles, C57BL/6J: open circles), spontaneous discharge rates did not systematically change with the units' CFs.
Table 1.
Development of hearing sensitivity
| Age | Threshold (dB SPL) |
Significance | |
|---|---|---|---|
| CBA/J mean ± SEM | C57BI/6J mean ± SEM | ||
| P12 | 53 ± 3 | 60 ± 4 | NS (t test) |
| P13 | 37 ± 4 | 28 ± 4 | NS (t test) |
| P14–P23 | 24 ± 2 | 22 ± 3 | NS (Mann–Whitney rank-sum test) |
| P28 | 31 ± 5 | 50 ± 5 | p = 0.012 (Mann–Whitney rank-sum test) |
Maximum discharge rates
The units' maximum acoustically evoked discharge rates increased with age in both strains (p < 0.001, ANOVA) (Fig. 7A). In CBA/J mice, maximum discharge rates at P12 were 70–270 spikes/s (mean: 158 ± 19 spikes/s, n = 13); at P28, maximum rates had increased to 168–440 spikes/s (mean 327 ± 19 spikes/s, n = 16). In C57BL/6J mice, maximum discharge rates at P12 were 110–226 spikes/s (mean: 168 ± 16 spikes/s; n = 8) and 120–470 spikes/s (mean: 360 ± 36 spikes/s, n = 10) at P28. No significant differences in maximum discharge rates were found between both strains except for P18 (p < 0.001, t test). At all postnatal ages, maximum discharge rates were independent of the units' characteristic frequencies (Fig. 7B).
Figure 7.
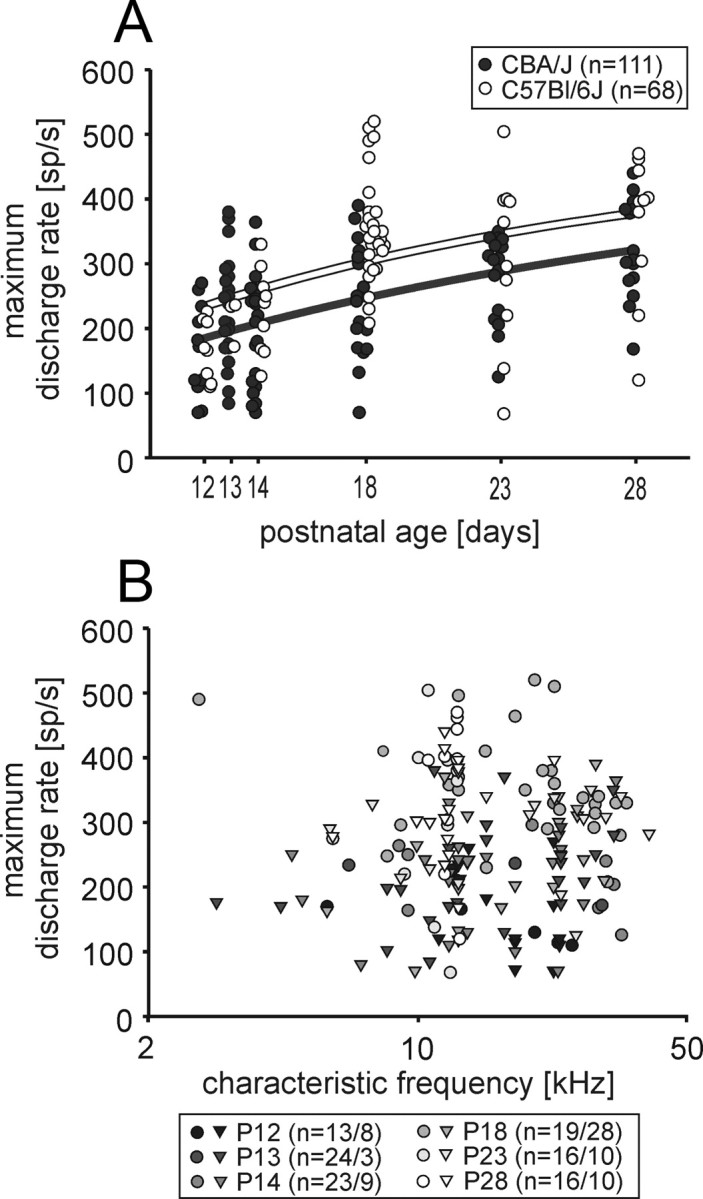
Development of maximum evoked discharge rates. A, Both strains (CBA/J: filled circles; C57BL/6J: open circles) showed an increase in maximum discharge rates with age (p < 0.001; ANOVA; black and white solid lines, exponential fit). B, No discernable correlation was found between the units' maximum discharge rates and the CFs (CBA/J mice, circles; C57BL/6J mice, triangles; ages as indicated by different shades of gray; numbers of units at different ages: n = #CBA/#C57BL).
Rate-level functions
Three types of rate-level functions (RLFs) were classified: (1) nonmonotonic, (2) steadily increasing, and (3) monotonic with plateau. No age-dependent differences in distribution of the RLF types were found in either of the mouse strains (data not shown).
Temporal response patterns
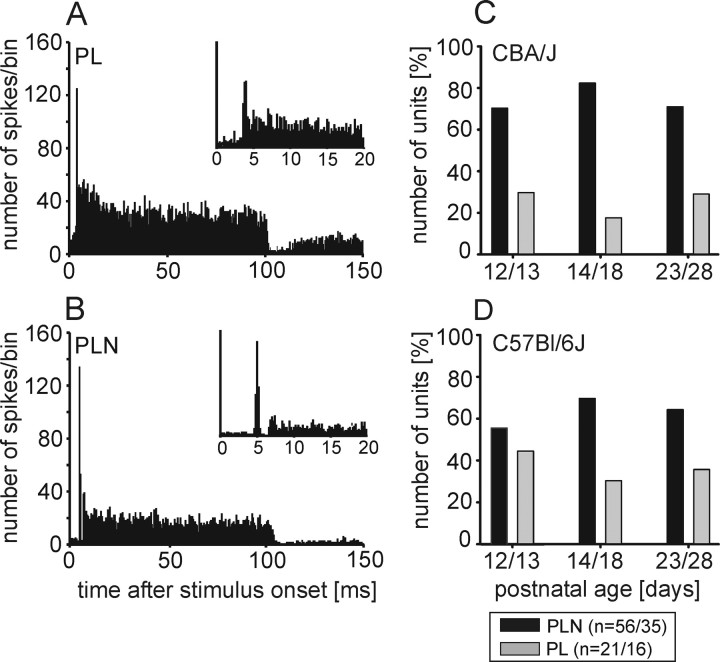
Response patterns were evaluated from the PSTHs (bin width: 0.5 ms) of 77 units in CBA/J mice and 51 units in C57BL/6J mice. In both strains, all units showed phasic-tonic (primary-like, PL) responses (Fig. 8A). In the majority of units (CBA/J: 73%, C57BL/6J: 69%), the onset peak and the tonic response component were separated by a discernable gap (Fig. 8B) classifying their PSTHs as primary-like notch (PLN), a typical feature of MNTB units (Smith et al., 1991; Sommer et al., 1993; Kopp-Scheinpflug et al., 2003b, 2008) and of their afferents, the globular bushy cells (GBCs) in the anterior ventral cochlear nucleus (Smith and Rhode, 1987). In both strains, the respective response types showed significant differences in spontaneous activity with PL units displaying lower spontaneous rates than PLN units [CBA/J: PL mean SR: 16.6 ± 32.1 sp/s (n = 21), PLN mean SR: 47 ± 41.5 sp/s (n = 56), p < 0.001, Mann–Whitney rank-sum test; C57BL/6J: PL mean SR: 21.5 ± 29.8 sp/s (n = 16), PLN mean SR: 50 ± 41.3 sp/s (n = 35), p = 0.012, Mann–Whitney rank-sum test]. No systematic age-dependent change in the percentage between PL and PLN units was observed (Fig. 8C,D).
Figure 8.
Temporal response patterns do not change with age. A, B, All units showed phasic-tonic response patterns classified as PL in approximately one-third of the units (CBA/J: 27%, C57BL/6J: 31%), and as PLN in the remaining units (CBA/J: 73%, C57BL/6J: 69%). Bin width 0.5 ms; in insets 0.2 ms. C, D, No systematic developmental change in the distribution of response types was found in either strain. The numbers of units are given as follows: n = #CBA/#C57BL.
Latency and jitter
The units' response latencies were progressively reduced from P12 to P18 in both strains (p < 0.001, ANOVA on ranks) (Fig. 9A). When the units could first be acoustically driven, the latencies ranged from 5.4 to 9 ms in CBA/J mice (7.1 ± 0.3 ms, n = 11) and from 7.2 to 9.3 ms in C57BL/6J mice (7.9 ± 0.4 ms, n = 5). Subsequently, up to P18 latency values continuously diminished, although at P13 and P14 there was still a wide scatter of latency values between units. At P18, the values and the respective distributions were near adult-like (CBA/J mean: 4.5 ± 0.2 ms, n = 16; C57BL/6J mean: 4.2 ± 0.2 ms, n = 24). Except for P18, no strain-specific differences in response latencies were observed (P18, p = 0.01, Mann–Whitney rank-sum test).
Figure 9.
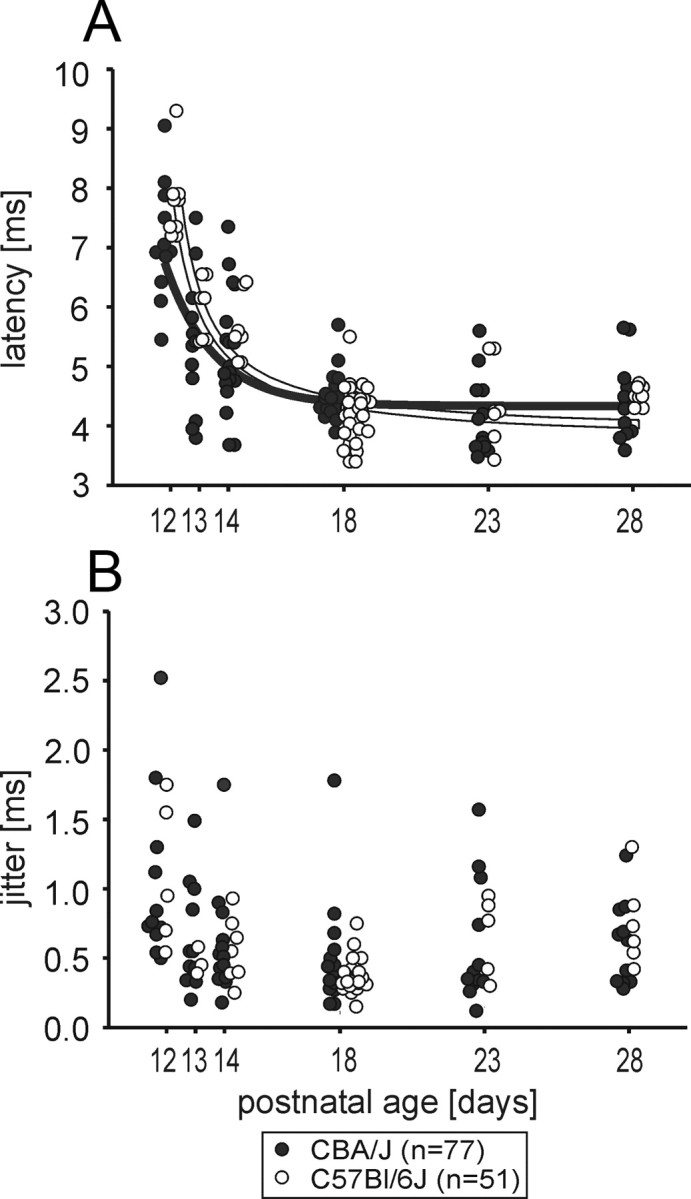
Latency and jitter shorten throughout development. A, In both strains [CBA/J: filled circles, C57BL/6J: open circles, solid lines: standard exponential decay with three parameters: time-constant T, offset B, vertical scaling A, f(t) = Ae−t/T + B], the response latencies shortened from P12 to P18 (p < 0.001 in CBA/J and C57BL/6J, Mann–Whitney rank-sum test). B, Jitter values were significantly reduced from P12 to P14 (CBA/J p = 0.01, Mann–Whitney rank-sum test; C57BL/6J p = 0.009, Mann–Whitney rank-sum test). No further reduction in jitter was found up to P28 in CBA/J mice. In C57BL/6J mice, the jitter again increased from P18 to P28 (p < 0.001, t test).
The jitter of the onset response to repetitive signal presentations was steadily reduced from P12 (CBA/J mean: 1.0 ± 0.2 ms, n = 11; C57BL/6J mean: 1.1 ± 0.2 ms, n = 5) to P14 (CBA/J mean: 0.6 ± 0.1 ms, n = 14, p = 0.01, Mann–Whitney rank-sum test; C57BL/6J mean: 0.56 ± 0.1 ms, n = 6, p = 0.009, Mann–Whitney rank-sum test) (Fig. 9B). After that, no further reduction in jitter was observed until P28 in CBA/J mice (mean: 0.58 ± 0.1 ms, n = 12) and until P18 in C57BL/6J mice (mean: 0.34 ± 0.02 ms, n = 25). In the latter strain, the jitter slightly increased again from P18 to P28 (P28 mean: 0.75 ± 0.1 ms, n = 6, p < 0.001, t test). Both results are in accordance with reduction in calyx of Held synaptic transmission delay up to P18 measured by cell-attached in vitro recordings in rats (Leão et al., 2005).
Tonotopic organization of the MNTB
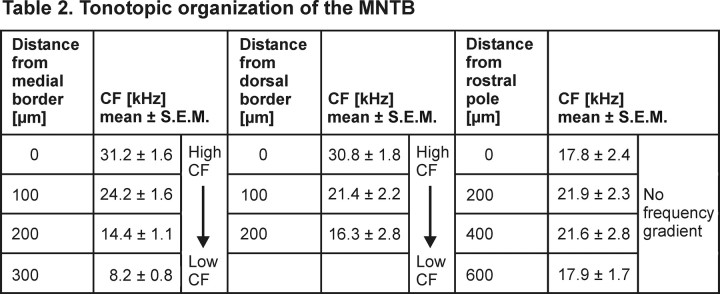
From earlier in vivo studies in different mammals, it is known that the MNTB shows a mediolateral high-to-low frequency gradient [gerbil: Kopp-Scheinpflug et al. (2003b); rat: Sommer et al. (1993); cat: Guinan et al. (1972), Spirou et al. (1990), and Smith et al., (1998)]. So, it is conceivable that the MNTB of mice has a similar tonotopic organization, although a detailed documentation of the frequency representation in all three spatial dimensions is not yet documented. Stereotaxic multiunit recordings were used to gather the distribution of CFs in the whole of the MNTB by systematic variations of electrode positions. Auditory responses were classified as originating from the MNTB if they were elicited by stimulation of the contralateral ear only (Kopp-Scheinpflug et al., 2008). In the rostrocaudal dimension recordings with the required acoustic excitability were collected over a total extent of 800 μm. Mediolaterally, CFs systematically varied over a distance of ∼300 μm in the center of the nucleus and ∼200 μm at its rostral and caudal poles. Dorsoventrally, acoustically evoked activity was recorded over a depth of 250–300 μm. In Figure 10, the borders of the nucleus were determined with respect to the stereotaxic coordinates of the recording sites (gray outlines). At more dorsal and ventral position, the recordings either showed no acoustically evoked activity or broadly tuned, high-threshold activity without clearly definable CFs. The latter might be attributable to passing fibers in the trapezoid body. The MNTB in mice has a tube-like appearance, which, in its rostrocaudal extension, bends toward the midline. Also, the shape of the MNTB changes along the rostrocaudal axis. At its caudal pole, the nucleus exhibited a more elongated shape with short dorsoventral extensions while at its rostral pole the MNTB appeared to be more round. The CFs of the multiunits varied between 5 and 45 kHz. Mean CFs were calculated for each of four rostrocaudal, four mediolateral, and three dorsoventral planes yielding MNTB-like acoustic excitability (Table 2). At the medial-most plane, the mean CF was 31.2 ± 1.6 kHz, and at the lateral plane, the mean CF was 8.2 ± 0.8 kHz, confirming the mediolateral tonotopic gradient. A comparable high-to-low frequency gradient was also determined dorsoventrally with 30.8 ± 1.8 kHz at dorsal and 16 ± 2.8 kHz at ventral positions. In contrast, the mean CF values calculated for the four rostrocaudal planes did not show systematic changes. The respective values ranged between 17.8 kHz and 21.9 kHz.
Figure 10.
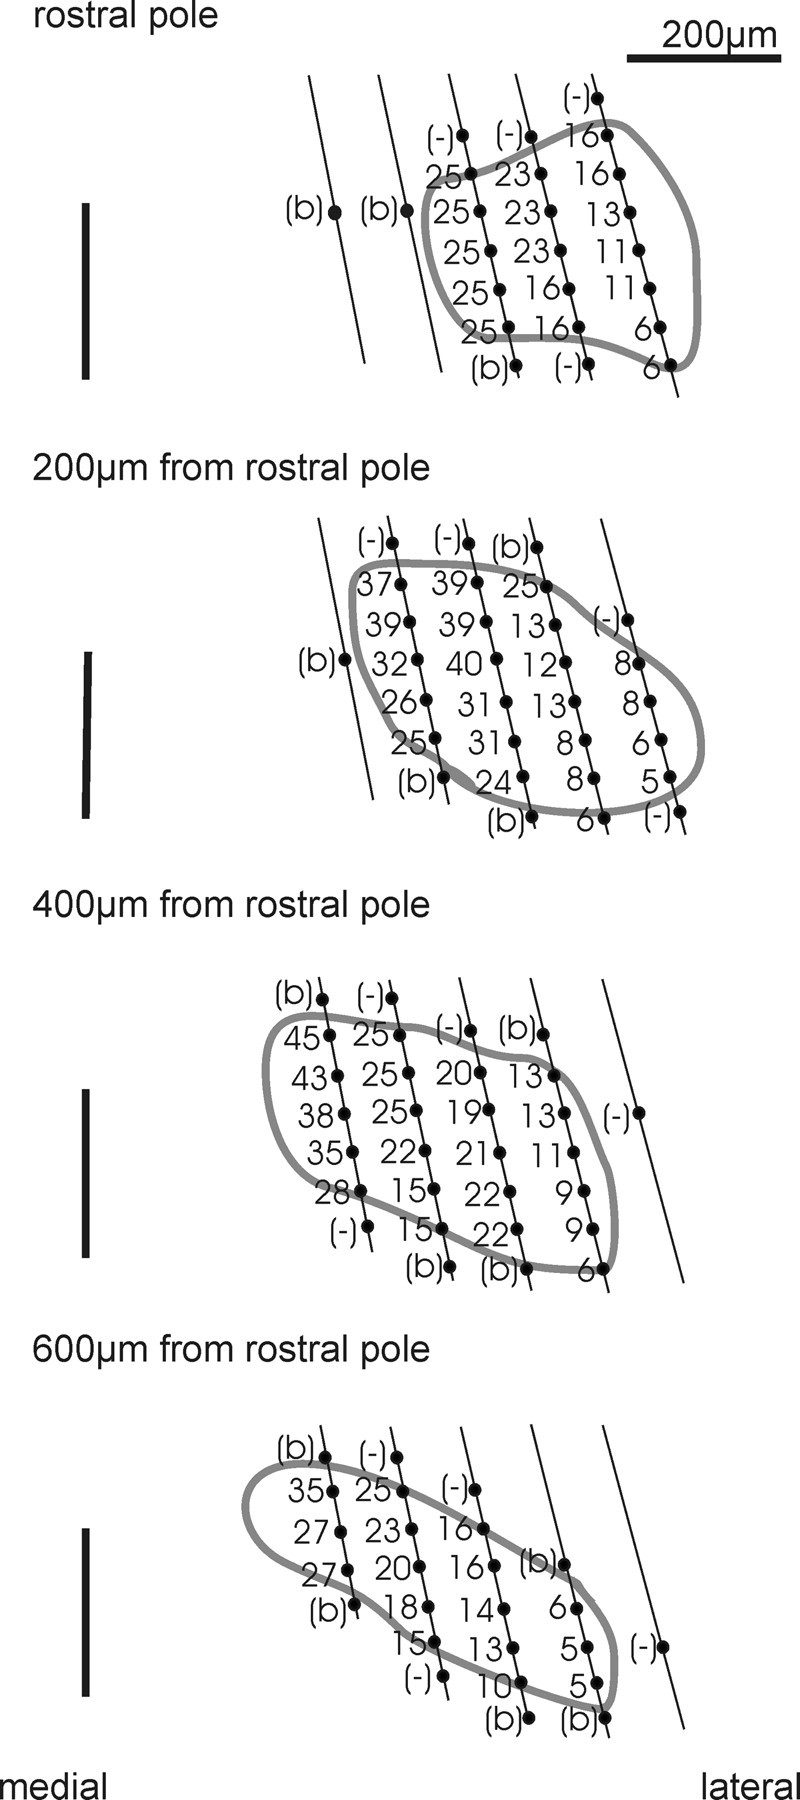
Tonotopic organization of the MNTB. Recordings were obtained from a P23 CBA/J mouse. CFs were acquired from multiunit activity in 20 penetrations (5 penetrations with systematic variation of mediolateral coordinates at 4 different rostrocaudal planes). The spatial resolution was ∼100 μm mediolaterally, ∼200 μm rostrocaudally, and 50 μm dorsoventrally. The recording sites with no acoustically evoked activities were marked with (−), and penetrations that revealed broadly tuned, high-threshold tuning curves lacking a discernable CF were marked with (b). The black vertical line marks the midline of the brainstem. The borders of the MNTB were outlined by eye (gray line) based on the stereotaxic coordinates that yielded clearly definable CFs to monaural contralateral stimulation. The nuclear shape changed from rostral (more round) to caudal (mediolaterally elongated), and the MNTB was shifted away from the midline toward its rostral pole. Also note the high-to-low frequency gradient from medial to lateral and from dorsal to ventral.
Table 2.
Tonotopic organization of the MNTB
While these measurements provide a coherent three-dimensional map of the MNTB's nuclear tonotopy that basically matches anatomical reconstructions of serial sections, it has to be acknowledged that it is difficult to exactly define the borders of the nucleus by means of physiological recordings. Also, due to limitations in acoustic stimulations to frequencies <50 kHz, we might have missed a small mediolateral portion of the MNTB.
Discussion
The present study shows that the spontaneous and sound-evoked discharge activity of MNTB units undergoes substantial developmental changes up to the end of the fourth postnatal week.
Spontaneous activity
Rates and patterns of spontaneous activity
The present results indicate that in prehearing mice (P8–P10) MNTB units are spontaneously active, even though at low rates (1–20 spikes/s), and that this activity occurs in bursts corroborating previous findings [spiral ganglion cells of cat: Jones et al. (2007); inferior colliculus of horseshoe bat: Rübsamen and Schäfer (1990); cochlear nucleus of tammar wallaby: Gummer and Mark (1994); cochlear nucleus of the cat: Walsh and McGee (1988); nucleus magnocellularis in chicken: Lippe (1994)]. This early afferent activity is thought to play a role in the consolidation of auditory pathways (Kitzes et al., 1995; Leake et al., 2006), in refining gradients of ion channel expression (Leao et al., 2006), and in adjustment of synaptic transmission (Erazo-Fischer et al., 2007; McKay and Oleskevich, 2007). In chicken, spontaneous bursting activity turns into more regular spiking in a short time window around hearing onset (Lippe, 1994; Jones and Jones, 2000; Jones et al., 2001). In P11 and P12 mice, similarly, the bursting activity in MNTB units gradually vanishes, with some units still showing bursting activity (though lacking interburst intervals completely devoid of spikes) and others showing near-Poisson discharges. In P11 animals, in which some units failed to show bursting activity, no responses could be elicited by auditory stimuli up to 110 dB SPL. In P12 animals, on the other hand, in which some units still showed bursting activity, all MNTB units could be driven by sound stimulation. These findings suggest that spontaneous bursting and onset of acoustically evoked activity might not be directly connected. At the end of the second week, spontaneous rates in mice were comparable to the values found in adult conspecifics and in other mammals [mouse: Kopp-Scheinpflug et al. (2008); gerbil: Kopp-Scheinpflug et al. (2003b, 2008) and Hermann et al. (2007); rat: Sommer et al. (1993)], indicating that spontaneous activity reaches adult levels soon after hearing onset.
Sources of spontaneous bursting activity
A recent study by Tritsch et al. (2007) supports earlier observations by Lippe (1994) suggesting that spontaneous bursting activity is already generated in the cochlea. In mice, it has been demonstrated in slice studies that before hearing onset, inner hair cells (IHCs) generate spontaneous calcium spikes as early as embryonic day 17.5 (Marcotti et al., 2003, Kros, 2007). The repetitive, regenerative characteristics of these signals are due to an interplay of fast calcium and sodium channels with slow potassium channels (Kros et al., 1998; Marcotti et al., 2003). The activity is evoked by ATP released by supporting cells (Tritsch et al., 2007). Evidence exists that these early calcium spikes activate auditory nerve fibers through exocytosis of glutamate resulting in bursting discharge activity in spiral ganglion cells (Glowatzki and Fuchs, 2002; Tritsch et al., 2007; Tritsch and Bergles, 2009). Around the onset of hearing, IHCs express an additional fast potassium channel (13% of IHCs at P11, 42% at P12, and 100% at P13, respectively). Consequently, the regenerative spiking behavior in IHCs is suppressed through the reduction of the membrane time constant and high-frequency transmission from IHCs to auditory nerve fibers is facilitated (Kros et al., 1998; Marcotti et al., 2003) (see also Kros, 2007). These changes in IHC physiology together with the cessation of spontaneous ATP release between P11 and P13 (Tritsch et al., 2007) are supposedly the immediate causes of the gradual reduction of spontaneous bursting activity in the MNTB in vivo.
Acoustically evoked activity
Characteristic frequencies and thresholds
In both strains, acoustically driven responses could be recorded in MNTB units as early as P12. At this time, CFs of all units were <25 kHz. Recordings of units with higher CFs, i.e., up to 32 kHz at P13 and up to 40 kHz at P23, corroborates the notion of a delayed development of high-frequency inner ear signal transduction [chicken: Rubel (1978) and Rubel et al. (1984); gerbil: Harris and Dallos (1984)]. In the low-to-middle frequency hearing range (2–10 kHz), developmental changes, as shown in the present study, mostly concerned the increase in sensitivity by ∼50 dB from P12 to P14. A comparable increase in sensitivity, but no significant developmental extension toward lower frequencies, was also reported for other mammalian species [mouse: Shnerson and Willott (1979); cat: Walsh and McGee (1987)]. Several causes contribute to increased hearing sensitivity in the first days after hearing onset. They can either relate to signal conduction to the inner ear or to mechanoelectrical signal transduction by hair cells in the inner ear (Finck et al., 1972; Huangfu and Saunders, 1983; Woolf and Ryan, 1988; He et al., 1994; Kaltenbach and Falzarano, 1994; Overstreet et al., 2002).
Sound-evoked discharge properties
Different properties of acoustically evoked spiking of MNTB units revealed a rapid maturation after hearing onset resulting in near adult-like characteristics (Smith et al., 1998; Kopp-Scheinpflug et al., 2003b; Tolnai et al., 2008a) by the end of the second (response latency) to fourth postnatal week (maximum discharge rate).
One reason for this fast development is the early maturation of rapid and secure synaptic transmission at the calyx synapse, which has been intensively investigated in mice and rats in vitro (Iwasaki and Takahashi, 1998, 2001; Taschenberger and von Gersdorff, 2000; Futai et al., 2001; Joshi and Wang, 2002; von Gersdorff and Borst, 2002). These studies mostly revealed adult-like conditions by the end of the second postnatal week, which is in agreement with the majority of the results presented here and which also coincides with the morphological maturation of the calyx synapse up to ∼P14 (Kandler and Friauf, 1993; Kil et al., 1995). Taschenberger and von Gersdorff (2000) reported that at P14 MNTB principal neurons are able to follow short trains of presynaptic stimuli up to 800 Hz (15 stimuli in 20 ms) without spike failures. In the present study, units at P14 showed stimulus evoked discharge rates of up to 400 Hz for the initial 20 ms (600 Hz for 5 ms onset response) of 100 ms tone bursts and up to 370 Hz for the whole of the stimulus. Even in older animals discharge rates did not surpass 550 Hz for the initial 20 ms (700 Hz for 5 ms onset response) and 520 Hz for the entire stimulus. These data show that the upper limits of electrically induced synaptic transmission rates in MNTB neurons in vitro at P14 is not reached under systemic acoustic stimulus conditions in vivo. The cause for this discrepancy might be that the acoustic stimulation not only affects synaptic transmission at the calyx synapses but includes activation of the entire afferent pathway up to these synapses, i.e., synaptic transmission from IHCs to auditory nerve fibers and from the nerve fibers to globular bushy cells in the cochlear nucleus. In addition, it cannot be excluded that our anesthesia treatment may have caused some reduction of nerve excitability.
Comparison between CBA/J and C57BL/6J mice
Data were obtained from two mouse strains commonly used in brain slice recordings. CBA/J mice are known for their persistent hearing sensitivity while C57BL/6J mice suffer from an early onset of high-frequency hearing loss so far reported to start at 2 months of age (Mikaelian, 1979; Henry and Chole, 1980; Li and Borg, 1991; Henry, 2004; Ison et al., 2007) The present data suggest that the deterioration of hearing sensitivity in C57BL/6J mice might even begin at the end of the first postnatal month. Except for threshold values, we did not find any major indications for strain-specific differences in spontaneous and acoustically evoked discharge characteristics of MNTB units. This is in agreement with data from Taberner and Liberman (2005), who investigated the in vivo response characteristics of auditory nerve fibers of CBA/CaJ and C57BL/6 mice.
Tonotopy
The MNTB of mice shows a mediolateral high-to-low frequency gradient corresponding to respective results in other mammals [rat: Sommer et al. (1993); cat: Guinan et al. (1972) and Smith et al. (1998); gerbil: Kopp-Scheinpflug et al. (2003b)]. There was a tendency for a dorsoventral high-to-low frequency gradient, but this observation potentially results from the electrode penetration being angled laterally relative to the sagittal plane. Our recordings clearly vote against a rostrocaudal tonotopy. Thus, at any rostrocaudal extent a MNTB position defined by its laterality bears the same physiological characteristics with respect to CF, and supposedly to spontaneous rates and maximum discharge rates. This might be of interest for closer examinations of physiological differences between MNTB neurons and of variations in synaptic transmission at the calyx of Held synapse.
Conclusion
We could demonstrate that on the one hand spontaneous discharge rates and patterns and the distribution of characteristic frequencies and thresholds were mature by the end of the second postnatal week, which is in agreement with the maturation of physiology and morphology of the calyx of Held and MNTB neurons observed in brain slices. On the other hand, the sound-evoked discharge rates and response latencies even changed up to the third to fourth postnatal week. Thus, studies investigating synaptic transmission at the calyx of Held MNTB system in vitro need to consider developmental changes of discharge properties of MNTB neurons in vivo up to the fourth postnatal week.
Footnotes
Financial support for this work was provided by the Deutsche Forschungsgemeinschaft (Ru 390-18/1, Ru 390-19/1) and by the Graduate College InterNeuro (GRK 1097) of the Deutsche Forschungsgemeinschaft.
References
- Berlin CI. Hearing in mice via GSR audiometry. J Speech Hear Res. 1963;13:359–368. doi: 10.1044/jshr.0604.359. [DOI] [PubMed] [Google Scholar]
- Blatchley BJ, Cooper WA, Coleman JR. Development of auditory brainstem response to tone pip stimuli in the rat. Brain Res. 1987;429:75–84. doi: 10.1016/0165-3806(87)90140-4. [DOI] [PubMed] [Google Scholar]
- Egorova M, Ehret G, Vartanian I, Esser KH. Frequency response areas of neurons in the mouse inferior colliculus. I. Threshold and tuning characteristics. Exp Brain Res. 2001;140:145–161. doi: 10.1007/s002210100786. [DOI] [PubMed] [Google Scholar]
- Ehret G, Moffat AJ. Noise masking of tone responses and critical ratios in single units of the mouse cochlear nerve and cochlear nucleus. Hear Res. 1984;14:45–57. doi: 10.1016/0378-5955(84)90068-6. [DOI] [PubMed] [Google Scholar]
- Erazo-Fischer E, Striessnig J, Taschenberger H. The role of physiological afferent nerve activity during in vivo maturation of the calyx of Held synapse. J Neurosci. 2007;27:1725–1737. doi: 10.1523/JNEUROSCI.4116-06.2007. [DOI] [PMC free article] [PubMed] [Google Scholar]
- Finck A, Schneck CD, Hartman AF. Development of cochlear function in the neonate Mongolian gerbil (Meriones unguiculatus) J Comp Physiol Psychol. 1972;78:375–380. doi: 10.1037/h0032373. [DOI] [PubMed] [Google Scholar]
- Friauf E. Tonotopic order in the adult and developing auditory system of the rat as shown by c-fos immunocytochemistry. Eur J Neurosci. 1992;4:798–812. doi: 10.1111/j.1460-9568.1992.tb00190.x. [DOI] [PubMed] [Google Scholar]
- Futai K, Okada M, Matsuyama K, Takahashi T. High-fidelity transmission acquired via a developmental decrease in NMDA receptor expression at an auditory synapse. J Neurosci. 2001;21:3342–3349. doi: 10.1523/JNEUROSCI.21-10-03342.2001. [DOI] [PMC free article] [PubMed] [Google Scholar]
- Geal-Dor M, Freeman S, Li G, Sohmer H. Development of hearing in neonatal rats: air and bone conducted ABR thresholds. Hear Res. 1993;69:236–242. doi: 10.1016/0378-5955(93)90113-f. [DOI] [PubMed] [Google Scholar]
- Glowatzki E, Fuchs PA. Transmitter release at the hair cell ribbon synapse. Nat Neurosci. 2002;5:147–154. doi: 10.1038/nn796. [DOI] [PubMed] [Google Scholar]
- Green JS, Sanes DH. Early appearance of inhibitory input to the MNTB supports binaural processing during development. J Neurophysiol. 2005;94:3826–3835. doi: 10.1152/jn.00601.2005. [DOI] [PubMed] [Google Scholar]
- Guinan JJ, Jr, Li RY. Signal processing in brainstem auditory neurons which receive giant endings (calyces of Held) in the medial nucleus of the trapezoid body of the cat. Hear Res. 1990;49:321–334. doi: 10.1016/0378-5955(90)90111-2. [DOI] [PubMed] [Google Scholar]
- Guinan JJ, Jr, Norris BE, Guinan SS. Single auditory units in the superior olivary complex II: locations of unit categories and tonotopic organization. Int J Neurosci. 1972;4:147–166. [Google Scholar]
- Gummer AW, Mark RF. Patterned neural activity in brain stem auditory areas of a prehearing mammal, the tammar wallaby (Macropus eugenii) Neuroreport. 1994;5:685–688. doi: 10.1097/00001756-199402000-00006. [DOI] [PubMed] [Google Scholar]
- Harris DM, Dallos P. Ontogenetic changes in frequency mapping of a mammalian ear. Science. 1984;225:741–743. doi: 10.1126/science.6463651. [DOI] [PubMed] [Google Scholar]
- He DZ, Evans BN, Dallos P. First appearance and development of electromotility in neonatal gerbil outer hair cells. Hear Res. 1994;78:77–90. doi: 10.1016/0378-5955(94)90046-9. [DOI] [PubMed] [Google Scholar]
- Henry KR. Males lose hearing earlier in mouse models of late-onset age-related hearing loss; females lose hearing earlier in mouse models of early-onset hearing loss. Hear Res. 2004;190:141–148. doi: 10.1016/S0378-5955(03)00401-5. [DOI] [PubMed] [Google Scholar]
- Henry KR, Chole RA. Genotypic differences in behavioral, physiological and anatomical expressions of age-related hearing loss in the laboratory mouse. Audiology. 1980;19:369–383. doi: 10.3109/00206098009070071. [DOI] [PubMed] [Google Scholar]
- Hermann J, Pecka M, von Gersdorff H, Grothe B, Klug A. Synaptic transmission at the calyx of Held under in vivo like activity levels. J Neurophysiol. 2007;98:807–820. doi: 10.1152/jn.00355.2007. [DOI] [PubMed] [Google Scholar]
- Hoffpauir BK, Grimes JL, Mathers PH, Spirou GA. Synaptogenesis of the calyx of Held: rapid onset of function and one-to-one morphological innervation. J Neurosci. 2006;26:5511–5523. doi: 10.1523/JNEUROSCI.5525-05.2006. [DOI] [PMC free article] [PubMed] [Google Scholar]
- Huangfu M, Saunders JC. Auditory development in the mouse: structural maturation of the middle ear. J Morphol. 1983;176:249–259. doi: 10.1002/jmor.1051760302. [DOI] [PubMed] [Google Scholar]
- Ison JR, Allen PD, O'Neill WE. Age-related hearing loss in C57BL/6J mice has both frequency-specific and non-frequency-specific components that produce a hyperacusis-like exaggeration of the acoustic startle reflex. J Assoc Res Otolaryngol. 2007;8:539–550. doi: 10.1007/s10162-007-0098-3. [DOI] [PMC free article] [PubMed] [Google Scholar]
- Iwasaki S, Takahashi T. Developmental changes in calcium channel types mediating synaptic transmission in rat auditory brainstem. J Physiol. 1998;509:419–423. doi: 10.1111/j.1469-7793.1998.419bn.x. [DOI] [PMC free article] [PubMed] [Google Scholar]
- Iwasaki S, Takahashi T. Developmental regulation of transmitter release at the calyx of Held in rat auditory brainstem. J Physiol. 2001;534:861–871. doi: 10.1111/j.1469-7793.2001.00861.x. [DOI] [PMC free article] [PubMed] [Google Scholar]
- Jones TA, Jones SM. Spontaneous activity in the statoacoustic ganglion of the chicken embryo. J Neurophysiol. 2000;83:1452–1468. doi: 10.1152/jn.2000.83.3.1452. [DOI] [PubMed] [Google Scholar]
- Jones TA, Jones SM, Paggett KC. Primordial rhythmic bursting in embryonic cochlear ganglion cells. J Neurosci. 2001;21:8129–8135. doi: 10.1523/JNEUROSCI.21-20-08129.2001. [DOI] [PMC free article] [PubMed] [Google Scholar]
- Jones TA, Leake PA, Snyder RL, Stakhovskaya O, Bonham B. Spontaneous discharge patterns in cochlear spiral ganglion cells before the onset of hearing in cats. J Neurophysiol. 2007;98:1898–1908. doi: 10.1152/jn.00472.2007. [DOI] [PMC free article] [PubMed] [Google Scholar]
- Joshi I, Wang LY. Developmental profiles of glutamate receptors and synaptic transmission at a single synapse in the mouse auditory brainstem. J Physiol. 2002;540:861–873. doi: 10.1113/jphysiol.2001.013506. [DOI] [PMC free article] [PubMed] [Google Scholar]
- Kaltenbach JA, Falzarano PR. Postnatal development of the hamster cochlea. I. Growth of hair cells and the organ of Corti. J Comp Neurol. 1994;340:87–97. doi: 10.1002/cne.903400107. [DOI] [PubMed] [Google Scholar]
- Kamiya K, Takahashi K, Kitamura K, Momoi T, Yoshikawa Y. Mitosis and apoptosis in postnatal auditory system of the C3H/He strain. Brain Res. 2001;901:296–302. doi: 10.1016/s0006-8993(01)02300-9. [DOI] [PubMed] [Google Scholar]
- Kandler K, Friauf E. Pre- and postnatal development of efferent connections of the cochlear nucleus in the rat. J Comp Neurol. 1993;328:161–184. doi: 10.1002/cne.903280202. [DOI] [PubMed] [Google Scholar]
- Kil J, Kageyama GH, Semple MN, Kitzes LM. Development of ventral cochlear nucleus projections to the superior olivary complex in gerbil. J Comp Neurol. 1995;353:317–340. doi: 10.1002/cne.903530302. [DOI] [PubMed] [Google Scholar]
- Kitzes LM, Kageyama GH, Semple MN, Kil J. Development of ectopic projections from the ventral cochlear nucleus to the superior olivary complex induced by neonatal ablation of the contralateral cochlea. J Comp Neurol. 1995;353:341–363. doi: 10.1002/cne.903530303. [DOI] [PubMed] [Google Scholar]
- Kopp-Scheinpflug C, Fuchs K, Lippe WR, Tempel BL, Rübsamen R. Decreased temporal precision of auditory signaling in Kcna1-null mice: an electrophysiological study in vivo. J Neurosci. 2003a;23:9199–9207. doi: 10.1523/JNEUROSCI.23-27-09199.2003. [DOI] [PMC free article] [PubMed] [Google Scholar]
- Kopp-Scheinpflug C, Lippe WR, Dörrscheidt GJ, Rübsamen R. The medial nucleus of the trapezoid body in the gerbil is more than a relay: comparison of pre- and postsynaptic activity. J Assoc Res Otolaryngol. 2003b;4:1–23. doi: 10.1007/s10162-002-2010-5. [DOI] [PMC free article] [PubMed] [Google Scholar]
- Kopp-Scheinpflug C, Tolnai S, Malmierca MS, Rübsamen R. The medial nucleus of the trapezoid body: comparative physiology. Neuroscience. 2008;154:160–170. doi: 10.1016/j.neuroscience.2008.01.088. [DOI] [PubMed] [Google Scholar]
- Kros CJ. How to build an inner hair cell: challenges for regeneration. Hear Res. 2007;227:3–10. doi: 10.1016/j.heares.2006.12.005. [DOI] [PubMed] [Google Scholar]
- Kros CJ, Ruppersberg JP, Rüsch A. Expression of a potassium current in inner hair cells during development of hearing in mice. Nature. 1998;394:281–284. doi: 10.1038/28401. [DOI] [PubMed] [Google Scholar]
- Leake PA, Hradek GT, Chair L, Snyder RL. Neonatal deafness results in degraded topographic specificity of auditory nerve projections to the cochlear nucleus in cats. J Comp Neurol. 2006;497:13–31. doi: 10.1002/cne.20968. [DOI] [PMC free article] [PubMed] [Google Scholar]
- Leão RM, Kushmerick C, Pinaud R, Renden R, Li GL, Taschenberger H, Spirou G, Levinson SR, von Gersdorff H. Presynaptic Na+ channels: locus, development, and recovery from inactivation at a high-fidelity synapse. J Neurosci. 2005;25:3724–3738. doi: 10.1523/JNEUROSCI.3983-04.2005. [DOI] [PMC free article] [PubMed] [Google Scholar]
- Leao RN, Sun H, Svahn K, Berntson A, Youssoufian M, Paolini AG, Fyffe RE, Walmsley B. Topographic organization in the auditory brainstem of juvenile mice is disrupted in congenital deafness. J Physiol. 2006;571:563–578. doi: 10.1113/jphysiol.2005.098780. [DOI] [PMC free article] [PubMed] [Google Scholar]
- Li HS, Borg E. Age-related loss of auditory sensitivity in two mouse genotypes. Acta Otolaryngol. 1991;111:827–834. doi: 10.3109/00016489109138418. [DOI] [PubMed] [Google Scholar]
- Lippe WR. Rhythmic spontaneous activity in the developing avian auditory system. J Neurosci. 1994;14:1486–1495. doi: 10.1523/JNEUROSCI.14-03-01486.1994. [DOI] [PMC free article] [PubMed] [Google Scholar]
- Marcotti W, Johnson SL, Holley MC, Kros CJ. Developmental changes in the expression of potassium currents of embryonic, neonatal and mature mouse inner hair cells. J Physiol. 2003;548:383–400. doi: 10.1113/jphysiol.2002.034801. [DOI] [PMC free article] [PubMed] [Google Scholar]
- McKay SM, Oleskevich S. The role of spontaneous activity in development of the endbulb of Held synapse. Hear Res. 2007;230:53–63. doi: 10.1016/j.heares.2007.05.006. [DOI] [PubMed] [Google Scholar]
- Mc Laughlin M, van der Heijden M, Joris PX. How secure is in vivo synaptic transmission at the calyx of Held? J Neurosci. 2008;28:10206–10219. doi: 10.1523/JNEUROSCI.2735-08.2008. [DOI] [PMC free article] [PubMed] [Google Scholar]
- Mikaelian DO. Development and degeneration of hearing in the C57/b16 mouse: relation of electrophysiologic responses from the round window and cochlear nucleus to cochlear anatomy and behavioral responses. Laryngoscope. 1979;89:1–15. doi: 10.1288/00005537-197901000-00001. [DOI] [PubMed] [Google Scholar]
- Morest DK. The growth of synaptic endings in the mammalian brain: a study of the calyces of the trapezoid body. Z Anat Entwicklungsgesch. 1968;127:201–220. doi: 10.1007/BF00526129. [DOI] [PubMed] [Google Scholar]
- Müller M, von Hünerbein K, Hoidis S, Smolders JW. A physiological place-frequency map of the cochlea in the CBA/J mouse. Hear Res. 2005;202:63–73. doi: 10.1016/j.heares.2004.08.011. [DOI] [PubMed] [Google Scholar]
- Overstreet EH, 3rd, Temchin AN, Ruggero MA. Passive basilar membrane vibrations in gerbil neonates: mechanical bases of cochlear maturation. J Physiol. 2002;545:279–288. doi: 10.1113/jphysiol.2002.025205. [DOI] [PMC free article] [PubMed] [Google Scholar]
- Paolini AG, FitzGerald JV, Burkitt AN, Clark GM. Temporal processing from the auditory nerve to the medial nucleus of the trapezoid body in the rat. Hear Res. 2001;159:101–116. doi: 10.1016/s0378-5955(01)00327-6. [DOI] [PubMed] [Google Scholar]
- Rubel EW. Ontogeny of structure and function in the vertebrate auditory system. In: Jacobson M, editor. Handbook of sensory physiology, Vol 9. Development of sensory systems. Berlin: Springer; 1978. pp. 213–229. [Google Scholar]
- Rubel EW, Lippe WR, Ryals BM. Development of the place principle. Ann Otol Rhinol Laryngol. 1984;93:609–615. doi: 10.1177/000348948409300614. [DOI] [PubMed] [Google Scholar]
- Rübsamen R, Schäfer M. Ontogenesis of auditory fovea representation in the inferior colliculus of the Sri Lankan rufous horseshoe bat, Rhinolophus rouxi. J Comp Physiol A. 1990;167:757–769. doi: 10.1007/BF00189766. [DOI] [PubMed] [Google Scholar]
- Schneggenburger R, Forsythe ID. The calyx of Held. Cell Tissue Res. 2006;326:311–337. doi: 10.1007/s00441-006-0272-7. [DOI] [PubMed] [Google Scholar]
- Shnerson A, Willott JF. Development of inferior colliculus response properties in C57BL/6J mouse pups. Exp Brain Res. 1979;37:373–385. doi: 10.1007/BF00237720. [DOI] [PubMed] [Google Scholar]
- Smith PH, Rhode WS. Characterization of HRP-labeled globular bushy cells in the cat anteroventral cochlear nucleus. J Comp Neurol. 1987;266:360–375. doi: 10.1002/cne.902660305. [DOI] [PubMed] [Google Scholar]
- Smith PH, Joris PX, Carney LH, Yin TC. Projections of physiologically characterized globular bushy cell axons from the cochlear nucleus of the cat. J Comp Neurol. 1991;304:387–407. doi: 10.1002/cne.903040305. [DOI] [PubMed] [Google Scholar]
- Smith PH, Joris PX, Yin TC. Anatomy and physiology of principal cells of the medial nucleus of the trapezoid body (MNTB) of the cat. J Neurophysiol. 1998;79:3127–3142. doi: 10.1152/jn.1998.79.6.3127. [DOI] [PubMed] [Google Scholar]
- Sommer I, Lingenhöhl K, Friauf E. Principal cells of the rat medial nucleus of the trapezoid body: an intracellular in vivo study of their physiology and morphology. Exp Brain Res. 1993;95:223–239. doi: 10.1007/BF00229781. [DOI] [PubMed] [Google Scholar]
- Spirou GA, Brownell WE, Zidanic M. Recordings from cat trapezoid body and HRP labeling of globular bushy cell axons. J Neurophysiol. 1990;63:1169–1190. doi: 10.1152/jn.1990.63.5.1169. [DOI] [PubMed] [Google Scholar]
- Taberner AM, Liberman MC. Response properties of single auditory nerve fibers in the mouse. J Neurophysiol. 2005;93:557–569. doi: 10.1152/jn.00574.2004. [DOI] [PubMed] [Google Scholar]
- Taschenberger H, von Gersdorff H. Fine-tuning an auditory synapse for speed and fidelity: developmental changes in presynaptic waveform, EPSC kinetics, and synaptic plasticity. J Neurosci. 2000;20:9162–9173. doi: 10.1523/JNEUROSCI.20-24-09162.2000. [DOI] [PMC free article] [PubMed] [Google Scholar]
- Tollin DJ. The lateral superior olive: a functional role in sound source localization. Neuroscientist. 2003;9:127–143. doi: 10.1177/1073858403252228. [DOI] [PubMed] [Google Scholar]
- Tollin DJ, Yin TC. Interaural phase and level difference sensitivity in low-frequency neurons in the lateral superior olive. J Neurosci. 2005;25:10648–10657. doi: 10.1523/JNEUROSCI.1609-05.2005. [DOI] [PMC free article] [PubMed] [Google Scholar]
- Tolnai S, Englitz B, Kopp-Scheinpflug C, Dehmel S, Jost J, Rübsamen R. Dynamic coupling of excitatory and inhibitory responses in the medial nucleus of the trapezoid body. Eur J Neurosci. 2008a;27:3191–3204. doi: 10.1111/j.1460-9568.2008.06292.x. [DOI] [PubMed] [Google Scholar]
- Tolnai S, Hernandez O, Englitz B, Rübsamen R, Malmierca MS. The medial nucleus of the trapezoid body in rat: spectral and temporal properties vary with anatomical location of the units. Eur J Neurosci. 2008b;27:2587–2598. doi: 10.1111/j.1460-9568.2008.06228.x. [DOI] [PubMed] [Google Scholar]
- Tritsch NX, Bergles DE. Inner hair cell calcium action potentials pattern neural activity before the onset of hearing. Assoc Res Otolaryngol Abstr. 2009;32:774. [Google Scholar]
- Tritsch NX, Yi E, Gale JE, Glowatzki E, Bergles DE. The origin of spontaneous activity in the developing auditory system. Nature. 2007;450:50–55. doi: 10.1038/nature06233. [DOI] [PubMed] [Google Scholar]
- von Gersdorff H, Borst JG. Short-term plasticity at the calyx of held. Nat Rev Neurosci. 2002;3:53–64. doi: 10.1038/nrn705. [DOI] [PubMed] [Google Scholar]
- Walsh BT, Miller JB, Gacek RR, Kiang NYS. Spontaneous activity in the eighth cranial nerve of the cat. Int J Neurosci. 1972;3:221–236. [Google Scholar]
- Walsh EJ, McGee J. Postnatal development of auditory nerve and cochlear nucleus neuronal responses in kittens. Hear Res. 1987;28:97–116. doi: 10.1016/0378-5955(87)90157-2. [DOI] [PubMed] [Google Scholar]
- Walsh EJ, McGee J. Rhythmic discharge properties of caudal cochlear nucleus neurons during postnatal development in cats. Hear Res. 1988;36:233–247. doi: 10.1016/0378-5955(88)90065-2. [DOI] [PubMed] [Google Scholar]
- Woolf NK, Ryan AF. Contributions of the middle ear to the development of function in the cochlea. Hear Res. 1988;35:131–142. doi: 10.1016/0378-5955(88)90112-8. [DOI] [PubMed] [Google Scholar]
- Yin TC. Neuronal mechanisms of encoding binaural localization cues in auditory brainstem. In: Oertel D, Popper AN, Fay RR, editors. Integrative functions in the mammalian auditory pathway. New York: Springer; 2002. pp. 99–159. [Google Scholar]
- Young ED, Robert JM, Shofner WP. Regularity and latency of units in ventral cochlear nucleus: implications for unit classification and generation of response properties. J Neurophysiol. 1988;60:1–29. doi: 10.1152/jn.1988.60.1.1. [DOI] [PubMed] [Google Scholar]


