

Abstract
A common visual pathway in all amniotes is the tectofugal pathway connecting the optic tectum with the forebrain. The tectofugal pathway has been suggested to be involved in tasks such as orienting and attention, tasks that may benefit from integrating information across senses. Nevertheless, previous research has characterized the tectofugal pathway as strictly visual. Here we recorded from two stations along the tectofugal pathway of the barn owl: the thalamic nucleus rotundus (nRt) and the forebrain entopallium (E). We report that neurons in E and nRt respond to auditory stimuli as well as to visual stimuli. Visual tuning to the horizontal position of the stimulus and auditory tuning to the corresponding spatial cue (interaural time difference) were generally broad, covering a large portion of the contralateral space. Responses to spatiotemporally coinciding multisensory stimuli were mostly enhanced above the responses to the single modality stimuli, whereas spatially misaligned stimuli were not. Results from inactivation experiments suggest that the auditory responses in E are of tectal origin. These findings support the notion that the tectofugal pathway is involved in multisensory processing. In addition, the findings suggest that the ascending auditory information to the forebrain is not as bottlenecked through the auditory thalamus as previously thought.
Introduction
A common feature in the organization of the visual system in birds is the existence of two visual pathways from the retina to the telencephalon: the thalamofugal pathway and the tectofugal pathway (Karten, 1969; Shimizu and Bowers, 1999). The tectofugal pathway has been suggested to be homologous to the colliculopulvinar–cortical pathway in mammals (Karten, 1969; Karten and Shimizu, 1989) (but see Guirado et al., 2005 for an alternative view). The pathway ascends from the retina to the optic tectum (OT) (the avian homolog of the superior colliculus), which in turn projects to the nucleus rotundus (nRt) (Benowitz and Karten, 1976) of the dorsal thalamus [considered comparable with parts of pulvinar nuclei and lateral posterior complex in the thalamus (Raczkowski and Diamond, 1981; Shimizu and Karten, 1993; Reiner et al., 2005)]. The forebrain recipient of the tectofugal pathway (receiving direct inputs from nRt) is a nidopallial area called the entopallium (E) (Karten and Hodos, 1970). This region has been compared with parts of the mammalian extrastriate cortices (Karten and Shimizu, 1989; Shimizu and Bowers, 1999; Nguyen et al., 2004; Jarvis et al., 2005), although its mammalian homology remained unresolved (Reiner et al., 2005).
Behavioral and lesion studies indicated that the E is related to visual discrimination (Hodos and Karten, 1970; Hodos et al., 1986, 1988; Nguyen et al., 2004) and visual motion (Nguyen et al., 2004). Electrophysiological studies have demonstrated sensitivity to visual motion (Revzin, 1970; Kimberly et al., 1971; Engelage and Bischof, 1993) and visual looming (Xiao et al., 2006). More recently, electrophysiological studies (Marín et al., 2007), suggested involvement of the tectofugal pathway in saliency mapping.
Across species, the tectofugal pathway has been characterized as a strictly visual pathway (Chalupa et al., 1983; Robinson, 1993; Krützfeldt and Wild, 2004; Xiao et al., 2006) and is considered the main visual pathway in lateral-eyed birds (Bischof and Watanabe, 1997). However, several exceptions from this rule can be found in the literature. The tectofugal pathway in rattlesnakes, for example, carries infrared information as well as visual (Berson and Hartline, 1988). This raises the possibility that the tectofugal pathway may have a yet undiscovered multisensory function in other species.
Here we study the tectofugal pathway in the barn owl, a nocturnal predator that has evolved highly precise visual and auditory systems (Knudsen et al., 1979; Pettigrew, 1979; Nieder and Wagner, 1999; Bala et al., 2003; Harmening et al., 2007). The barn owl depends on both hearing and vision to detect its prey, providing a unique opportunity to study the multisensory hypothesis of the tectofugal pathway. We report that neurons in E and nRt respond to auditory stimuli as well as to visual stimuli. Inactivation experiments suggest that the auditory responses in E are of tectal origin. These findings support the notion that the function of the tectofugal pathway is modality independent. In addition, the findings suggest a link between the two auditory localization pathways, the midbrain and the forebrain, pathways that have been thought previously to be independent (Cohen et al., 1998; Arthur, 2005).
Materials and Methods
For this study, 10 barn owls (Tyto alba) were used. All owls were hatched in captivity, raised, and kept in a large flying cage equipped with perching spots and nesting boxes. The owls were provided for in accordance with the guidelines of the Technion Institutional Animal Care and Use Committee.
Electrophysiological measures.
Owls were prepared for repeated electrophysiological experiments in a single surgical procedure. A craniotomy was performed, and a recording chamber was cemented to the skull. At the beginning of each recording session, the owl underwent anesthesia using isoflurane (2%) and nitrous oxide in oxygen (4:5). Once anesthetized, the animal was positioned in a stereotaxic apparatus at the center of a double-wall sound-attenuating chamber lined with acoustic foam to suppress echoes. The head was bolted to the stereotaxic apparatus and aligned using retinal landmarks (as described by Gold and Knudsen, 2000). Within the chamber, the bird was maintained on a fixed mixture of nitrous oxide and oxygen (4:5). A glass-coated tungsten microelectrode (∼1 MΩ; NAN Biosystems) was driven into the recording chamber using a motorized manipulator (Narishige SM-191). An MPC Plus-8 System (Αlpha Omega) was used to amplify and filter the signal (350–4000 Hz). Unit recordings were obtained by manually setting a threshold and consistently selecting the largest unit waveforms in the recorded site. The highly bursty activity characterizing the E and nRt (see Figs. 1C,D, 8C) precluded the isolation of single-unit templates. Therefore, in this study, we could not tell with confidence to what extent the recorded activity reflected a single neuron or a small cluster of neurons near the tip of the electrode. At the end of each recording session, the exposed surface of the brain within the chamber was treated with chloramphenicol 5% ointment and closed. The owl was then returned to its home flying cage.
Figure 1.

Histological reconstruction of the recording site. A, Schematic illustration of a coronal section through the E. Adapted from Knudsen and Knudsen (1996). Ar, Arcopallium; PA, paleostriatum augmentum; PP, paleostriatum primitivum; N, neopallium; SPC, nucleus superficialis parvocellularis. B, Nissl-stained coronal forebrain section. Arrowheads mark the histological borders of the E. Electrode track was reconstructed based on two electrolytic lesions performed along the route of penetration (white arrows). Estimated recording site in the bimodal bursty layer was within the boundaries of the E (white asterisk). C, Spontaneous oscillatory bursts recorded in the E site. D, An expanded short segment of the activity displayed in C (horizontal bar in C).
Figure 8.

Histological identification of a recording site in the nRt. A, Nissl-stained coronal section through the midbrain. The dashed square shows the area of the enlarged fluorescent image in B. B, An FG injection site, revealed by fluorescent imaging, was within the borders of the nRt. C, Spontaneous bursty activity recorded in the nRt site in B.
Targeting of the nuclei.
The OT was identified by characteristic bursting activity and spatially restricted visual receptive fields (Knudsen, 1982). The position within the OT was determined based on the location of the visual receptive field (RF). To target the E, we obtained the position in the OT corresponding to the visual RF at zero azimuth and zero elevation (directly in front). From this point, the electrode was advanced 2 mm rostrally, 0.4 mm laterally, and 6.5–7 mm dorsally. To target the nRt, we obtained the position in the OT corresponding to the visual RF of 0 azimuth and +10° elevation. From this point, the electrode was advanced 1.2 mm rostrally and 2.6 mm medially. The dorsoventral position of the nRt was approximately the same as that of the tectal reference point. Electrolytic lesions (+5 μA for 30 s) and Fluorogold (FG) injections performed in several experiments validated the above coordinates (see Results).
Stimuli presentation.
Auditory stimuli generated on a computer (custom MATLAB programs; MathWorks) were converted to analog (48 kHz sampling rate; RP2; Tucker-Davis Technologies) and transduced by a pair of matched miniature earphones (Knowles ED-1914). The earphones were placed in the center of the ear canal ∼8 mm from the tympanic membrane. The amplitude and phase spectra of the earphones were equalized within ±2 dB and ±2 μs between 1 and 12 kHz by computer adjustment of the stimulus waveform. Stimuli consisted of bursts of broadband (1–12 kHz) noise, presented at an interstimulus interval (ISI) of 2 s. Sound levels were controlled by two independent attenuators (PA5; Tucker-Davis Technologies) and are reported as average binaural sound intensity (ABSI) relative to a fixed sound pressure level. Tuning curves were generated by varying a single parameter [interaural time difference (ITD), interaural level difference (ILD), or ABSI] while holding all other parameters constant. ILD was maintained at the best ILD of the site. The value of the tested parameter was varied randomly in stimulus sets that were repeated 10 times.
Visual stimuli were presented using the MATLAB Psychophysics Toolbox extensions (Brainard, 1997; Pelli, 1997) and projected (refresh rate of 72 Hz; XD400U; Mitsubishi) on a calibrated screen inside the sound-attenuating chamber (screen size, 150 × 115 cm; 1.5 m away from the owl). The projector was positioned outside the chamber, projecting the image through a double-glass window. The visual stimulus was a moving black dot on a gray background (1.9° diameter; low contrast was used in bimodal tests, luminance of background screen was 6.16 cd/m2, and luminance of dot was 2.74 cd/m2. High contrast was used in unimodal visual tests, luminance of background screen was 68.52 cd/m2, and luminance of dot was 0.68 cd/m2). The stimulus appeared on the screen at onset, moved a short distance of ∼4° for duration of 200–300 ms, and disappeared. Horizontal position tuning curves were obtained by presenting a randomly interleaved series of sweeps varying in 5° steps while maintaining elevation constant at best value.
Bimodal stimulation protocol.
To test bimodal integration, visual, auditory, and bimodal stimuli were randomly interleaved with an ISI of 2 s. The azimuth of the visual stimulus was set at the best visual position that, when available, was in the contralateral side. However, in the majority of the cases, the broad tuning curves did not allow to establish a best position. In these cases, the visual stimulus was positioned at 20° contralaterally to the recording side. The ITD of a congruent auditory stimulus was set to approximately match the position of the visual stimulus [ITD in microseconds equals 2.5 times the azimuth (Brainard and Knudsen, 1993)]. The ITD of a noncongruent stimulus was set in the opposite hemifield (25–50 μs). The ABSI of both stimuli was set to 10–20 dB above threshold level. All other acoustic parameters were as described above. The bimodal stimuli consisted of the combinations of the visual stimulus with either the congruent or the noncongruent auditory stimulus. The visual and auditory stimuli were presented approximately in temporal synchrony. A photodetector on the screen was used to measure the actual synchrony. In our setup, the visual stimulus appeared on the screen 7–26 ms after the onset of the auditory stimulus. This synchrony error resulted from the discrete refresh rate of the visual projecting system. We regarded this synchrony error as negligible because of the long durations of the typical visual responses in the E and the highly variable delay of the response onset (see Figs. 3B, 4C, 6A).
Figure 3.

Example of visual and auditory responses in a single E site. A, Raster plot showing responses to sounds with ITD values ranging from −200 to 200 μs. Negative ITD values represent left ear-leading (here ipsilateral) sounds. The gray shaded bar denotes the duration of stimulus. B, Average response per trial as a function of the ITD of the sound. Error bars represent SEM. C, The PSTH accumulated over all ITD values in A. The gray shaded bar denotes the duration of stimulus. D–F, Responses of the same site as in A to visual stimuli. Visual stimuli varied in horizontal location between 20° left to 20° right of the center. Figure format as in A–C.
Figure 4.

Population summary of auditory responses in the E. A, ITD tuning curves of 53 recording sites in the E are shown. Each row represents an ITD tuning curve from a single recording site. Each tuning curve was normalized to its maximal response. ITD values on the left side of the x-axis represent contralateral ear-leading sounds. B, Average of all ITD tuning curves presented in A. Error bars represent the SEM. C, Raster plot from a single site showing responses to increasing levels of sound. The ordinate denotes level of sound attenuation. The shaded area marks the duration of stimulation. D, Average rate level function of all recorded sites. The abscissa depicts level of sound attenuation, and the ordinate displays average spike count. The error bars designate the SEM. Asterisks mark intensity values with mean response significantly smaller (t test, p < 0.01) than the mean response to a weaker sound (ABI of −70 dB).
Figure 6.

Example of bimodal enhancement in a single E site. A, Raster plots showing responses to an auditory stimulus with an ITD of 50 μs contralateral ear leading (Ac, 30 repetitions, bottom raster), to an auditory stimulus with an ITD of 50 μs ipsilateral ear leading (Ai, 30 repetitions, second plot from bottom), to a visual stimulus 20° in the contralateral side (V, 30 repetitions, middle plot), to the visual together with the contralateral auditory stimulus (AcV, 30 repetitions, second plot from top), and to the visual stimulus with the ipsilateral auditory stimulus (AiV, 30 repetitions, top plot). The shaded bar shows the duration of stimuli. B, The PSTH of responses to the congruent bimodal stimulus (AcV, cyan) is compared with the PSTHs of responses to the visual stimulus (red) and with the contralateral auditory stimulus (blue). The vertical dashed line designates the onset of visual responses. Note that bimodal enhancement (deviation of cyan curve) begins with the visual response. C, Average spike count of stimuli presented in A. The error bars represent the SEM. The bimodal congruent response (AcV) significantly exceeded the sum of its unimodal components (dashed horizontal line; t test, p < 0.01).
Data analysis.
Responses were quantified as the average number of spikes in a given time window after stimulus onset minus the average number of spikes during the same amount of time immediately before stimulus onset (baseline activity). Averages were calculated over at least 10 stimulus repetitions. To quantify the degree of multisensory enhancement and suppression, an enhancement index (EI) (Stein and Meredith, 1993) was used: EI = (AV − max (A, V))/max(A, V), where AV is the average response to the bimodal stimulus, and A and V are the average responses to the auditory and visual components, respectively.
To obtain population average responses, single test poststimulus time histograms (PSTHs) with 2-ms-wide bins were normalized to their maximum and averaged across the entire population (see Fig. 7). PSTHs were smoothed for display purposes (see Figs. 6, 7, 10, 11).
Figure 7.

Population summary of bimodal enhancement. A, Overlaid are the population PSTHs normalized and averaged across all sites. The average response to the congruent bimodal stimulus is shown in cyan, to the incongruent bimodal stimulus in magenta, to the visual stimulus in red, to the contralateral auditory stimulus in blue, and to the auditory ipsilateral stimulus in black. The peak responses to the visual and to the congruent bimodal stimuli are marked by the dashed vertical lines. The average response to the congruent bimodal stimulus peaked significantly earlier than the visual stimulus (t test, p < 0.01). Inset denotes average spike counts of bimodal (cyan and magenta) and visual (red) stimuli. Mean response to bimodal congruent stimulus was significantly larger than mean response to visual only or to bimodal incongruent stimulus (t test, p < 0.01). B, A scatter plot showing the responses to the congruent bimodal stimulus versus the responses to the unimodal stimulus that induced maximal response. Most recording sites were above the midline (sign test, p < 0.01). D, A scatter plot showing the responses to the incongruent bimodal stimulus versus the responses to the maximal unimodal stimulus. Recording sites were evenly distributed below or above the midline (sign test, p > 0.05). C, E, Distributions of the enhancement indices in the population of sites recorded for congruent (C) and incongruent (E) bimodal stimuli.
Figure 10.

Local inactivation in the OT. A, Multiunit responses to a broad band auditory stimulus (2–10 kHz, indicated by the shaded area) in the OT (left raster) and in the E (right raster). The auditory stimulus was presented every 5 s, starting at time 0 and ending 15 min later. The red arrow points to the time of lidocaine injection in the OT. Each line represents a response to a single auditory stimulus. B–D, Average PSTHs of 10 responses in the E, before (blue), during (green), and after inactivation (red). Results from a different experiment are shown in each plot. Time between inactivation and recovery is presented in the top right corner. The bars below each graph indicate the time of stimulation.
Figure 11.
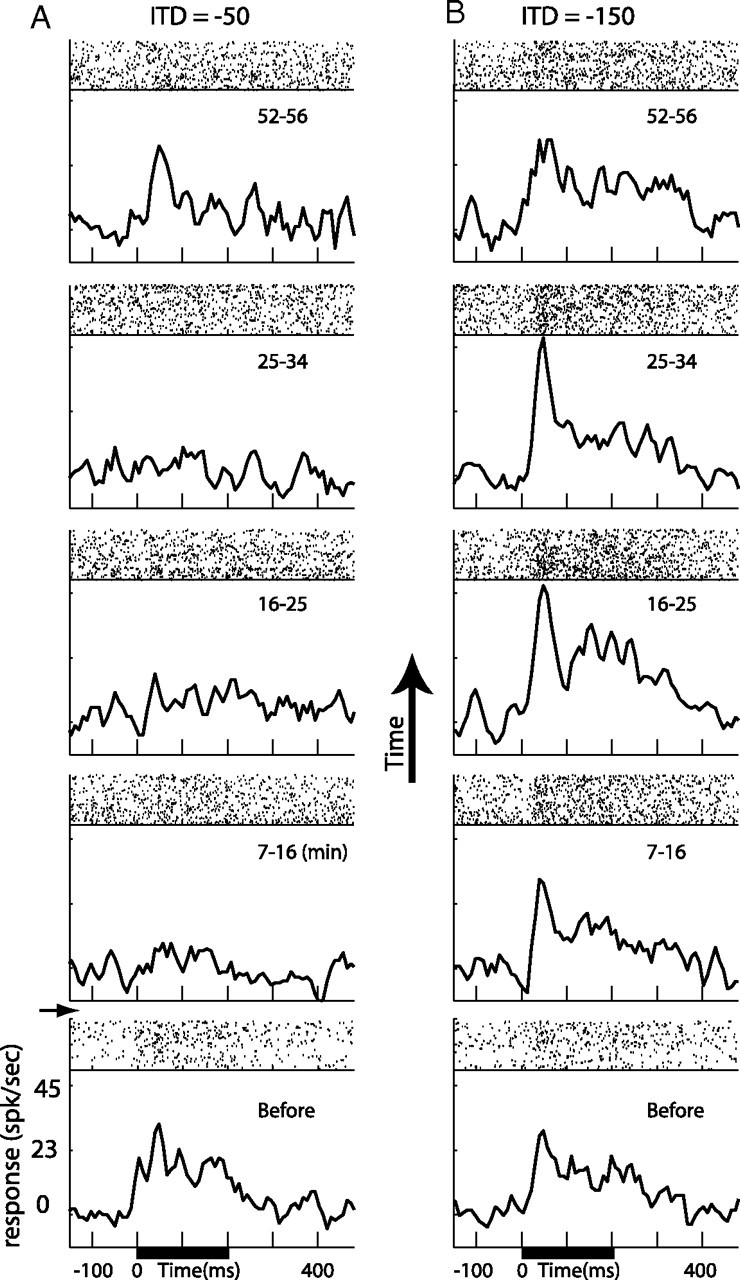
Local inactivation affect on multiple sounds. A, B, Average PSTHs of responses in the E to matched (A) and nonmatched (B) auditory stimuli (see Results). Stimuli were presented every 3 s alternating between matched and nonmatched sounds. Black horizontal bars indicate stimulus duration. The corresponding raster plots are presented above each PSTH. Bottom plots indicate activity before lidocaine injection. Plots above the horizontal arrow show results collected at incrementally increasing times after the injection. Numbers at the top right corner of each plot indicate the time of data collection relative to the time of injection in minutes.
Tracer injection.
Focal iontophoretic application of FG was used for retrograde tracings. Glass electrodes were prepared as follows: borosilicate glass (1 mm) was pulled on a vertical puller (Kation Scientific), and the electrode tip was broken to a diameter of ∼20 μm. The electrodes were filled with FG solution (10% in dH2O; Fluorochrome) and lowered to the target site. Multiunit activity recorded with the glass electrode was used to verify physiological characteristics of target nuclei. Once a desirable position was achieved, the tracer was injected iontophoretically by passing a constant positive current of 3–5 μA for 10 min (A-365 stimulus isolator; World Precision Instruments).
Histology.
Seven days after FG injections or electrolytic lesions, owls were deeply anesthetized with isoflurane and nitrous oxide/oxygen and given a dose of heparin (0.3 ml) and Nembutal (0.5 ml) injected directly into the left ventricle. Owls were then perfused through the heart with 500 ml of 0.4 m phosphate buffer (PO4), pH 7.4, followed by 500 ml of 4% formaldehyde solution. Brains were immersed in 20% sucrose and 4% formaldehyde for at least 2 d and were transversely sliced in 40 μm sections on a freezing cryostat. Sections were then mounted onto Superfrost Plus glass slides, Nissl stained, dehydrated, cleared in xylene, and coverslipped.
Inactivation experiments.
A guide cannula was made as follows: first a glass-coated tungsten microelectrode (∼1 MΩ; NAN Biosystems) was externally fastened to a stainless steel tube (3.5 cm length; 24 gauge; A-M Systems) using a small-diameter shrink tube (0.6 mm; Advanced Polymers). The tip of the electrode was set, under stereo microscope supervision, to extend ∼500 μm beyond the tip of the guide tube. The attached electrode allowed the continuous monitoring of unit activity at the injection site. The tip of the electrode was positioned at the intermediate layers of the OT, and the best ITD of the site was obtained. A second microelectrode (∼1 MΩ; NAN Biosystems) was then lowered into the E to assess auditory responses. If the ITD value obtained at the tectal site elicited significant responses in the E, the inactivation procedure was initiated. An injection cannula (30 gauge; A-M Systems) connected to a 10 or 100 μl Hamilton syringe by a 1 m length of polyethylene tubing filled with either TTX solution (10 μm in artificial CSF) or lidocaine HCl (2%) was inserted through the guide tube. The opening of the inner cannula was located 150–300 μm from the tip of the recording electrode. An auditory stimulus was presented every 3–5 s while the response discharge rate in the OT was monitored. An injection of 300 nl (TTX) or 1 μl (lidocaine) was applied. If a clear reduction in the discharge rate was not observed, an additional injection was applied 1 min later.
Results
Identification of the E
At approximately 4 mm above the auditory arcopallium (Knudsen et al., 1995), we have identified a layer of neurons characterized by a high level of spontaneous bursty activity (Fig. 1C,D). This layer was ∼1.5 mm thick (dorsoventral) and commonly displayed visual and auditory responses.
To identify the site of recording, we have reconstructed electrode tracks in three separated experiments, using at least two electrolytic lesions in each experiment. In all cases, the multisensory bursty layer was estimated to be within the boundaries of the E (Mikula et al., 2007). The asterisk in Figure 1B designates the estimated position of the recording site whose results are shown in Figure 3.
In two experiments, we have injected FG into the multisensory layer in the entopallium (Fig. 2A,B). In both cases, retrogradely labeled cell bodies were observed in the ipsilateral thalamic nRt (Fig. 2C). This result, which confirmed the identification of the entopallium based on its connections from the thalamus, suggests that the multisensory entopallium receives direct inputs from the thalamus. Most labeled cell bodies in nRt appeared in clusters. However, in this study, we did not further quantify the distribution of cell locations.
Figure 2.

FG iontophoretic injection in the E. A, Nissl-stained coronal section through the forebrain and midbrain. The position of an FG injection in the E (B) and the position of retrograde labeled cell bodies in nRt (C) are pointed. Arco, Arcopallium; nOv, nucleus ovoidalis; PA, paleostriatum augmentum; PP, paleostriatum primitivum.
Auditory and visual responses in the E
Figure 3 shows multiunit responses of a single site in the left E. The neurons strongly favored positive ITD values (contralateral ear leading), displaying no responses to negative ITDs (ipsilateral ear leading) (Fig. 3A,B). Conversely, visual responses were induced by stimuli in both ipsilateral and contralateral space covering the range between left and right 20° (Fig. 3D,E). Because of the limitation of our visual projection system, we did not examine responses to more lateral stimuli. Interestingly, both visual and auditory responses showed sustained activity exceeding the duration of the stimulus.
We have recorded from 78 sites in the E. In 67% of the sites (53 of 78), significant auditory responses were recorded (t test, p < 0.05). The auditory responses could be roughly divided to three response types. In most cases, the responses were characterized by a relatively early component (20–30 ms latency), followed by a late long-lasting response (Fig. 3A–C). Occasionally, either the late component (Fig. 4C) (see Fig. 10A) or the early component (see Fig. 10C,D) appeared alone. From the auditory responding sites, 56% (30 of 53) were significantly modulated by the ITD of the sound (p < 0.05, ANOVA). Entopallial neurons showed strong preference to contralateral ear-leading ITDs. This can be seen in the single-site curves in Figures 3B and 4A and in the population average ITD response in Figure 4B. Neurons generally responded to a wide range of frequency tones ranging between 2 and 10 kHz (data not shown).
Another apparent characteristic of the auditory responses in E was a tendency to respond better to low- and high-level sounds compared with mid-level sounds. This is demonstrated in the single-site example in Figure 4C. The non-monotonic rise in response can also be seen in the population average rate level function (Fig. 4D). The population average response to low-level sounds (−70 dB) was significantly higher than the average responses to louder sounds (t test, p < 0.01).
The visual responses in the E were more robust than the auditory responses, significantly observed in 88% of the recording sites. From these, only 40% (28 of 69) were significantly modulated by the horizontal position of the visual stimulus within the recorded range (p < 0.05, ANOVA). Unlike the auditory responses, the visual responses usually covered the measured horizontal range that was between contralateral 25° to ipsilateral 15° (Fig. 5A). The horizontal positions that evoked the maximal responses were not significantly biased to the contralateral field (sign test, p > 0.05).
Figure 5.

Population summary of visual responses in the E. A, Color plot depicting the azimuthal tuning curves from 68 recorded sites. Each row represents a tuning curve from a single recording site. Each tuning curve was normalized to its maximal response. Horizontal position values on the left side of the x-axis represent contralaterally positioned visual stimuli. B, Average of all visual tuning curves presented in A. Error bars represent the SEM.
Sites significantly responding to both visual and auditory stimuli (bimodal sites) were common in the E. Sixty percent (47 of 78) of the recording sites were bimodal (example in Fig. 3). From the sites in which only one modality passed the significance level, most were visual (22 of 28). In bimodal sites, spatial alignment of auditory and visual receptive fields was coarse; correlation of best ITD values with best horizontal positions of visual receptive fields did not reach statistical significance (data not shown). However, because of the large width of the receptive fields, the visual and auditory response ranges overlapped substantially in the contralateral side (compare Figs. 4A, 5A). As a result of the multiunit recordings, we cannot conclusively say whether the auditory and visual signals were carried by the same neurons (multisensory neurons) or by neighboring neurons (but see Results and Discussion below for evidence in favor of multisensory neurons in the E).
Multisensory integration
To assess the integration of visual and auditory signals in the E, we recorded responses to bimodal stimuli (stimuli that consisted of synchronous visual and auditory stimuli) and compared them with the responses to the unimodal components (visual or auditory alone). In the example shown in Figure 6A, we presented 30 repetitions of five different stimuli: one auditory stimulus with an ITD of 50 μs ipsilateral ear leading (Ai), one auditory stimulus with an ITD of 50 μs contralateral ear leading (Ac), one visual stimulus positioned 20° to the contralateral side (V), and two bimodal combinations of the visual stimulus with the auditory stimuli (AiV and AcV). When the visual and auditory stimuli congruently appeared at the contralateral side (AcV), the bimodal response was clearly enhanced above the unimodal responses. Incongruent bimodal stimuli, composed of the ipsilateral auditory stimulus and the visual stimulus (AiV), induced a response that was not significantly different from the visual response (Fig. 6C).
This enhancement cannot be attributed to an electrode summation of independent visual and auditory responses (as would be expected if the visual and auditory responses are carried by distinct populations of neurons) because the strength of the bimodal response exceeded the sum of the unimodal responses (Fig. 6C, dashed horizontal line). Close inspection of the time course of the responses further emphasizes the nonlinear relation between the visual and the auditory inputs. The late visual component is strongly enhanced (beyond the dashed vertical line in Fig. 6B), although it hardly overlaps with the early auditory response.
The experiment described in Figure 6 was repeated in 41 recording sites in the E. The normalized average responses of the population of sites to the five different stimuli are shown in Figure 7A. The results described in Figure 6 can be seen in the population average as well. The congruent bimodal stimuli induced an average response (cyan curve) that was substantially larger than the average response to the visual stimuli (compare with red curve and see inset in Fig. 7A). The enhancement was apparent not only in the amplitude but also in the timing. The average bimodal response peaked earlier compared with the peak of the average visual response (20 ms) (Fig. 7A, dashed vertical lines), an effect that was significant at the population level: the mean difference between the congruent bimodal peaks and the corresponding visual peaks was significantly smaller than zero (one tailed t test, p < 0.05). The incongruent bimodal stimulus (magenta curve) induced an average response that was very similar to the early part of the visual response with a slight reduction of the response at later times (Fig. 7A, arrowhead).
To assess the bimodal integration in the population, we compared for each recording site the response to the congruent bimodal stimulus with the response to the unimodal stimulus that elicited the maximal response. This comparison is shown in the scatter plot in Figure 7B. The majority of the points were above the diagonal line (sign test, p < 0.01), indicating a significant tendency for bimodal enhancement. The incongruent bimodal responses were compared with the unimodal responses (Fig. 7D). In this case, most of the points were below the diagonal line (24 of 41); however, this tendency for bimodal suppression was not significant. The distribution of the bimodal enhancement indices are shown in Figure 7, C and E, showing a significant enhancement tendency in the congruent stimuli (sign test, p < 0.01) (Fig. 7C) and no such effect in the noncongruent stimuli (Fig. 7E).
Visual and auditory responses in nRt
An important question is whether the auditory signals recorded in the entopallium ascend in the tectofugal pathway alongside visual information or whether they are contributed from other forebrain areas. To examine this question, we recorded from neurons in nRt, the thalamic nucleus projecting to the E. Recordings in nRt were performed in two owls. An FG injection, performed in one of the experiments, was within the distinct borders of the nRt (Mikula et al., 2007), validating the location of the recording site (Fig. 8A,B). Recordings in this brain area were characterized by a high level of spontaneous bursty activity (Fig. 8C). Surveying the region, we encountered sites with clear responses to both visual and auditory signals. An example from one such bimodal site is shown in Figure 9. In this example, the electrode was positioned in the right side of the brain. Auditory responses (Fig. 9A,B) were highly specific to contralateral ear-leading sounds (negative ITDs). The visual responses (Fig. 9E,F) were also stronger in the contralateral side of the visual field but were less specific than the auditory responses. The observed responses in nRt were remarkably similar to the typical responses recorded in the E, not only in their spatial preferences but also in the high level of spontaneous activity and in the elongated responses exceeding the stimulus duration (compare Figs. 9, 3).
Figure 9.

Visual and auditory responses in nRt. A–C, Responses to auditory stimuli with an ITD ranging from −200 μs to +200 μs from a single site in the nRt. Negative ITD values represent left ear-leading (here contralateral) sounds. The gray shaded bar denotes the duration of stimulus. B, Average of responses presented in A as a function of the ITD of the sound. Error bars represent SEM. C, The PSTH accumulated over all ITD values in A. The gray shaded bar denotes the duration of stimulus. D, Average of all ITD tuning curves recorded in the nRt. Error bars represent the SEM. E–G, Responses of the same site as in A–C to visual stimuli. Visual stimuli varied in horizontal location between 30° left to 20° right of the center. Figure format as in A–C. H, Average of all visual tuning curves recorded in the nRt. Error bars represent the SEM.
We have recorded from 19 different sites in nRt that significantly responded to auditory stimuli (t test, p < 0.05). All sites were characterized by bursty activity and all responded significantly to visual stimuli as well (t test, p < 0.05). The average visual and auditory responses of all 19 sites are shown in Figure 9, D and H. It can be seen that the observations described in the single-site example were maintained in the population averages. Bimodal sites were found adjacent to sites with visual only responses. We did not encounter sites that responded to the auditory stimulus only. Bimodal sites seemed to be clustered, suggesting functional subdivisions within nRt, yet our data at the moment is not sufficient to resolve the topographical arrangement of these different subregions.
Inactivation of the OT
We investigated the effect of focal pharmacological inactivation in the OT on the auditory responses in the E. Injections were performed in bursty layers: 600–1000 μm below the surface of the OT. The raster plot in Figure 10A shows the time course of one injection (lidocaine). Multiunit activity recorded near the injection site in the OT is shown on the left, and the multiunit activity recorded simultaneously at an E site is shown on the right. An auditory stimulus of 200 ms duration was presented every 5 s for 15 min. The ITD and the ILD of the sound were chosen to match the best ITD and best ILD recorded at the injection site in the OT (in this example, ITD of −50 μs and ILD of 5 dB). The strong auditory responses in the OT were dramatically reduced after the injection of lidocaine (the time of injection is indicated by the red arrow in Fig. 10A). This reduction in response was accompanied by a complete diminishment of the long-lasting auditory responses in the E. A later gradual recovery from inactivation in the OT was followed by a parallel recovery of the auditory responses in the E. This effect of diminishment and recovery can be seen in the PSTHs shown in Figure 10B. Reduction of auditory responses in the E and recovery to baseline activity was also observed in the two TTX injections (Fig. 10C,D).
To assess the locality of the effective inactivation in the OT, we have injected in an additional experiment lidocaine into the OT while recording entopallial responses to two different sounds (Fig. 11): one with an ITD set to match the optimal ITD recorded at the injection site (−50 μs; matched sound) and another with an ITD set to be outside of the response range of the tectal injection site (−150 μs; nonmatched sound). The two sounds were alternately presented every 3 s. The neural representation of ITD is topographically mapped along the rostrocaudal axis of the OT (Olsen et al., 1989). Therefore, local inactivation is expected to preferentially affect responses to the matched sound. Figure 11 shows the responses in the E to the matched sound (Fig. 11A) and to the nonmatched sound (Fig. 11B) before and after the inactivation. Because of the wide ITD tuning in the E, both sounds elicited responses before the injection of lidocaine (Fig. 11, bottom graphs). After the injection (Fig. 11, above the horizontal arrow) the responses to the matched sound (Fig. 11A) were abolished, whereas the responses to the nonmatched sound were maintained throughout the experiment (Fig. 11B). After ∼50 min, responses returned toward their initial level (Fig. 11A, top graph). In two additional sites in which this experiment was performed, a similar result, i.e., stronger reduction in responses to matched sounds compared with nonmatched sounds, was observed. Furthermore, we have observed similar inactivation effects in the visual modality: responses were abolished to visual stimuli inside the visual receptive field of the tectal injection site and not to signals outside of the receptive field (data not shown).
Discussion
Auditory pathways to the forebrain
The ascending auditory pathway in barn owls diverges at the level of the central nucleus of the inferior colliculus. One branch goes to nOv (Proctor and Konishi, 1997; Pérez and Peña, 2006), the main auditory nucleus of the thalamus, and on to the forebrain (Cohen and Knudsen, 1998, 1999; Vonderschen and Wagner, 2009). The other branch goes to the external nucleus of the inferior colliculus and on to the OT (Knudsen, 1983; Brainard et al., 1992; Peña and Konishi, 2001; Euston and Takahashi, 2002). Based on this anatomical organization, it was postulated that the final stages of the computation of auditory space are replicated twice in the brain (Cohen and Knudsen, 1999) (but see Arthur, 2005): once in the midbrain, resulting in space specific neurons organized as a map in the OT (Knudsen, 1982), and a second time in the forebrain, resulting in space specific neurons organized in clusters in the auditory arcopallium (Cohen and Knudsen, 1995; Cohen and Knudsen, 1999). The results reported here question the fundamental assumption that the two auditory pathways are indeed independent.
The auditory responses we have observed in nRt, and the results from the inactivation experiments support the notion that auditory information from the OT ascends through the tectofugal pathway to the forebrain. Still, alternative interpretations exist. It is possible that the inactivating substances managed to diffuse to auditory areas outside the OT, such as the nearby inferior colliculus, affecting auditory responses in the E not through the tectofugal pathway. Another possible interpretation is that, by inactivating the OT, which is a source of an ascending pathway to the E, we affect the properties of entopallial neurons so that they cease to respond to auditory inputs coming from elsewhere in the brain. However, both these possibilities are not likely. The inactivation specifically affected sounds corresponding to the ITD tuning properties at the injection site in the OT (Fig. 11), a result that is inconsistent with the alternative possibilities. The likely interpretation is that the focal injection inactivated a limited patch of the ITD map in the OT, sparing auditory signals with ITDs outside this patch. In addition, in the example shown in Figure 10A, the lidocaine reduced but did not completely abolish the neural activity at the tectal electrode (note the continuity of responses throughout the experiment), suggesting that the radius of the inactivated patch was not more than several hundred micrometers. This estimation is consistent with results from a systematic assessment of the effective spread of lidocaine injections (Tehovnik and Sommer, 1997). Together, the tectofugal pathway provides an anatomical and physiological substrate for a link that may break the barrier between the midbrain and forebrain pathways.
The existence of an extra-ovoidalis auditory pathway is of interest from both an evolutionary and a functional point of view. It is possible that there are more pathways that bypass nOv. For example, Wild et al. (2001) showed direct auditory inputs from the brainstem into the forebrain nucleus basalis of the barn owl. Overall, the emerging picture is that of an ascending auditory pathway that is not as bottlenecked through nOv as previously thought.
The avian tectofugal pathway
The physiological properties of the avian tectofugal pathway have been studied mostly in pigeons (Wang et al., 1993; Nguyen et al., 2004; Xiao et al., 2006; Marín et al., 2007). The tectofugal pathway originates in large neurons known as tectal ganglion cells (TGCs) (Wang et al., 2006) residing in tectal layer 13 (Karten et al., 1997). These cells possess large dendritic arbors and have been shown to have large visual receptive fields with high sensitivity to moving visual stimuli (Luksch et al., 1998). Interestingly, a single site in nRt receives inputs from TGCs that are evenly distributed throughout the OT (Marín et al., 2003). This arrangement implies a strong reduction of spatial sensitivity from the superficial and intermediate layers of the OT to nRt. Indeed, neurons in nRt and in E of pigeons had large visual receptive fields (Revzin, 1970; Wang et al., 1993) and high sensitivity to complex stimuli such as motion and looming (Wang and Frost, 1992; Wang et al., 1993; Xiao et al., 2006). Our recordings of visual responses in nRt and E of barn owls confirmed similar types of visual responses, including large receptive fields (Figs. 3D,E, 5) and high sensitivity to motion and looming (data not shown). Interestingly, the auditory responses in nRt and E, reported here for the first time, point to a similar transformation from a highly specific representation of ITD in the OT (Olsen et al., 1989) to a broad representation in nRt and E. The ability to inactivate responses only to sounds with ITDs that corresponded to the inactivated area of the tectal map (Fig. 11) suggests that the broad tuning of the single site in the E is a result of space-specific inputs converging from a wide area of the OT. Thus, the results presented here provide physiological evidence in favor of spatial information convergence, as suggested by the anatomical organization (Karten et al., 1997; Luksch et al., 1998; Marín et al., 2003).
In pigeons, experimental data support the notion that the tectofugal pathway is composed of several parallel pathways engaged in different aspects of visual processing (Wang et al., 1993; Hellmann et al., 1995; Hellmann and Güntürkün, 2001; Nguyen et al., 2004). This parceling into parallel pathways originates in the OT in which different subclasses of TGCs project to separate regions in nRt (Benowitz and Karten, 1976; Mpodozis et al., 1996; Karten et al., 1997; Marín et al., 2003). It is possible that the bimodal information we report here is originating in a subclass of multisensory TGCs and is transferred alongside other visual pathways.
Multisensory integration in the forebrain
Multisensory neurons that respond both to visual and auditory signals are common in the OT of birds (Knudsen, 1982; Lewald and Dörrscheidt, 1998) and in the superior colliculus of mammals (King and Palmer, 1985; Wallace et al., 1996). Clearly in mammals, multisensory processing is not limited to the midbrain. Several cortical areas, such as the anterior ectosylvian sulcus in cats, the intraparietal sulcus in primates, and others, combine visual and auditory information (Wallace et al., 1992; Kaas and Collins, 2004). Here we found that an area in the pallium [the avian pallium is considered analogous to the mammalian neocortex (Jarvis et al., 2005)] is bimodal. In the E, responses to spatially coinciding bimodal stimuli were commonly enhanced, whereas spatially misaligned stimuli were not. Such spatial integration, also reported in cats (Stein and Meredith, 1993) and primates (Wallace et al., 1996), was suggested to underlie the behavioral ability to integrate visual and auditory signals in an adaptive manner (Stein et al., 1988). Interestingly, multisensory enhancement occurred in the E despite the fact that visual responses usually had longer response delays (Fig. 7). A similar effect was reported in the OT of the barn owl (Zahar et al., 2009). Although we did not show unequivocally that visual and auditory signals are conveyed in single neurons, the results presented here (Figs. 6, 7) demonstrate that the entopallium is involved in multisensory processing. Thus, in barn owls as in mammals, multisensory integration is achieved by a broad network, involving forebrain and midbrain nuclei.
Comparison with the tectofugal pathway in other species
Previous studies in barn owls have shown auditory or bimodal responses in areas that are considered visual in other species. Nucleus isthmi and the superficial layers of the OT are reported as visual areas in birds and in homologues structures in mammals (Wang, 2003; King, 2004). However, in barn owls, these areas are bimodal (Knudsen, 1982; Maczko et al., 2006). Our study adds two additional structures to this count: the thalamic nRt and the forebrain E. Both areas are considered to be visual in birds and in the mammalian homolog structures (Frost et al., 1990; Robinson and Petersen, 1992; Butler and Cotterill, 2006). Why does this proliferation of auditory responses in visual areas occur in the barn owl's brain? One possibility is that, in barn owls, which are auditory specialists, functions that are only visual in other species are taken over by the auditory system, hence auditory information finds its way to visual regions. The other possibility, which we find more plausible, is that these areas are multisensory in other species as well but the contribution of the other modalities may vary according to the species under study. In visually dominant animals such as primates and pigeons, the weight of the auditory modality is expected to be smaller and therefore this trait may pass unnoticed. Supporting this possibility are several reports of nonvisual responses in the mammalian tectofugal pathway. For example, Yirmiya and Hocherman (1987) reported auditory responses of pulvinar neurons from monkeys engaged in auditory discrimination tasks. Avanzini et al. (1980) reported sparse responses to passive somatosensory and auditory stimuli in cat pulvinar neurons.
Interestingly, the output of the isthmo-tectal loop, which has been recently shown to process auditory as well as visual information (Maczko et al., 2006), is conveyed through the tectofugal pathway (Marín et al., 2007). It is important to note that the functions that have been traditionally attributed to the tectofugal pathway and the isthmo-tectal loop such as attention control, stimulus selection, and motion detection (Robinson and Petersen, 1992; Casanova et al., 2001; Shipp, 2004; Marín et al., 2005, 2007) are modality independent. Such functions may benefit from the integration of information from different senses (Stein and Meredith, 1993).
Footnotes
This work was supported by a Bikura grant from the Israel Science Foundation and by the Joel Elkes grant from the National Psychobiology Institute in Israel (founded by the E. Smith family). We thank Prof. Harald Luksch for advice and careful reading of this manuscript and Felix Milman for technical support.
References
- Arthur BJ. Distribution within the barn owl's inferior colliculus of neurons projecting to the optic tectum and thalamus. J Comp Neurol. 2005;492:110–121. doi: 10.1002/cne.20726. [DOI] [PubMed] [Google Scholar]
- Avanzini G, Broggi G, Franceschetti S, Spreafico R. Multisensory convergence and interaction in the pulvinar-lateralis posterior complex of the cat's thalamus. Neurosci Lett. 1980;19:27–32. doi: 10.1016/0304-3940(80)90250-5. [DOI] [PubMed] [Google Scholar]
- Bala AD, Spitzer MW, Takahashi TT. Prediction of auditory spatial acuity from neural images on the owl's auditory space map. Nature. 2003;424:771–774. doi: 10.1038/nature01835. [DOI] [PubMed] [Google Scholar]
- Benowitz LI, Karten HJ. Organization of the tectofugal visual pathway in the pigeon: a retrograde transport study. J Comp Neurol. 1976;167:503–520. doi: 10.1002/cne.901670407. [DOI] [PubMed] [Google Scholar]
- Berson DM, Hartline PH. A tecto-rotundo-telencephalic pathway in the rattlesnake: evidence for a forebrain representation of the infrared sense. J Neurosci. 1988;8:1074–1088. doi: 10.1523/JNEUROSCI.08-03-01074.1988. [DOI] [PMC free article] [PubMed] [Google Scholar]
- Bischof HJ, Watanabe S. On the structure and function of the tectofugal visual pathway in laterally eyed birds. Eur J Morphol. 1997;35:246–254. doi: 10.1076/ejom.35.4.246.13080. [DOI] [PubMed] [Google Scholar]
- Brainard DH. The psychophysics toolbox. Spat Vis. 1997;10:433–436. [PubMed] [Google Scholar]
- Brainard MS, Knudsen EI. Experience-dependent plasticity in the inferior colliculus: a site for visual calibration of the neural representation of auditory space in the barn owl. J Neurosci. 1993;13:4589–4608. doi: 10.1523/JNEUROSCI.13-11-04589.1993. [DOI] [PMC free article] [PubMed] [Google Scholar]
- Brainard MS, Knudsen EI, Esterly SD. Neural derivation of sound source location: resolution of spatial ambiguities in binaural cues. J Acoust Soc Am. 1992;91:1015–1027. doi: 10.1121/1.402627. [DOI] [PubMed] [Google Scholar]
- Butler AB, Cotterill RM. Mammalian and avian neuroanatomy and the question of consciousness in birds. Biol Bull. 2006;211:106–127. doi: 10.2307/4134586. [DOI] [PubMed] [Google Scholar]
- Casanova C, Merabet L, Desautels A, Minville K. Higher-order motion processing in the pulvinar. Prog Brain Res. 2001;134:71–82. doi: 10.1016/s0079-6123(01)34006-2. [DOI] [PubMed] [Google Scholar]
- Chalupa LM, Williams RW, Hughes MJ. Visual response properties in the tectorecipient zone of the cat's lateral posterior-pulvinar complex: a comparison with the superior colliculus. J Neurosci. 1983;3:2587–2596. doi: 10.1523/JNEUROSCI.03-12-02587.1983. [DOI] [PMC free article] [PubMed] [Google Scholar]
- Cohen YE, Knudsen EI. Binaural tuning of auditory units in the forebrain archistriatal gaze fields of the barn owl: local organization but no space map. J Neurosci. 1995;15:5152–5168. doi: 10.1523/JNEUROSCI.15-07-05152.1995. [DOI] [PMC free article] [PubMed] [Google Scholar]
- Cohen YE, Knudsen EI. Representation of binaural spatial cues in field L of the barn owl forebrain. J Neurophysiol. 1998;79:879–890. doi: 10.1152/jn.1998.79.2.879. [DOI] [PubMed] [Google Scholar]
- Cohen YE, Knudsen EI. Maps versus clusters: different representations of auditory space in the midbrain and forebrain. Trends Neurosci. 1999;22:128–135. doi: 10.1016/s0166-2236(98)01295-8. [DOI] [PubMed] [Google Scholar]
- Cohen YE, Miller GL, Knudsen EI. Forebrain pathway for auditory space processing in the barn owl. J Neurophysiol. 1998;79:891–902. doi: 10.1152/jn.1998.79.2.891. [DOI] [PubMed] [Google Scholar]
- Engelage J, Bischof HJ. The organization of the tectofugal pathway in birds: a comparative view. In: Zeigler HP, Bischof HJ, editors. Vision, brain, and behavior in birds. Cambridge, MA: MIT; 1993. pp. 137–158. [Google Scholar]
- Euston DR, Takahashi TT. From spectrum to space: the contribution of level difference cues to spatial receptive fields in the barn owl inferior colliculus. J Neurosci. 2002;22:284–293. doi: 10.1523/JNEUROSCI.22-01-00284.2002. [DOI] [PMC free article] [PubMed] [Google Scholar]
- Frost BJ, Wylie DR, Wang YC. The processing of object and self-motion in the tectofugal and accessory optic pathways of birds. Vision Res. 1990;30:1677–1688. doi: 10.1016/0042-6989(90)90152-b. [DOI] [PubMed] [Google Scholar]
- Gold JI, Knudsen EI. A site of auditory experience-dependent plasticity in the neural representation of auditory space in the barn owl's inferior colliculus. J Neurosci. 2000;20:3469–3486. doi: 10.1523/JNEUROSCI.20-09-03469.2000. [DOI] [PMC free article] [PubMed] [Google Scholar]
- Guirado S, Real MA, Dávila JC. The ascending tectofugal visual system in amniotes: new insights. Brain Res Bull. 2005;66:290–296. doi: 10.1016/j.brainresbull.2005.02.015. [DOI] [PubMed] [Google Scholar]
- Harmening WM, Göbbels K, Wagner H. Vernier acuity in barn owls. Vision Res. 2007;47:1020–1026. doi: 10.1016/j.visres.2007.01.005. [DOI] [PubMed] [Google Scholar]
- Hellmann B, Güntürkün O. Structural organization of parallel information processing within the tectofugal visual system of the pigeon. J Comp Neurol. 2001;429:94–112. doi: 10.1002/1096-9861(20000101)429:1<94::aid-cne8>3.0.co;2-5. [DOI] [PubMed] [Google Scholar]
- Hellmann B, Waldmann C, Güntürkün O. Cytochrome oxidase activity reveals parcellations of the pigeon's ectostriatum. Neuroreport. 1995;6:881–885. doi: 10.1097/00001756-199504190-00014. [DOI] [PubMed] [Google Scholar]
- Hodos W, Karten HJ. Visual intensity and pattern discrimination deficits after lesions of ectostriatum in pigeons. J Comp Neurol. 1970;140:53–68. doi: 10.1002/cne.901400104. [DOI] [PubMed] [Google Scholar]
- Hodos W, Weiss SR, Bessette BB. Size-threshold changes after lesions of the visual telencephalon in pigeons. Behav Brain Res. 1986;21:203–214. doi: 10.1016/0166-4328(86)90238-x. [DOI] [PubMed] [Google Scholar]
- Hodos W, Weiss SR, Bessette BB. Intensity difference thresholds after lesions of ectostriatum in pigeons. Behav Brain Res. 1988;30:43–53. doi: 10.1016/0166-4328(88)90007-1. [DOI] [PubMed] [Google Scholar]
- Jarvis ED, Güntürkün O, Bruce L, Csillag A, Karten H, Kuenzel W, Medina L, Paxinos G, Perkel DJ, Shimizu T, Striedter G, Wild JM, Ball GF, Dugas-Ford J, Durand SE, Hough GE, Husband S, Kubikova L, Lee DW, Mello CV, Powers A, Siang C, Smulders TV, Wada K, White SA, Yamamoto K, Yu J, Reiner A, Butler AB. Avian brains and a new understanding of vertebrate brain evolution. Nat Rev Neurosci. 2005;6:151–159. doi: 10.1038/nrn1606. [DOI] [PMC free article] [PubMed] [Google Scholar]
- Kaas JH, Collins CE. The resurrection of multisensory cortex in primates: connection patterns that integrate modalities. In: Calvert G, Spence C, Stein BE, editors. The handbook of multisensory processes. Cambridge, MA: MIT; 2004. pp. 285–293. [Google Scholar]
- Karten HJ. Organization of avian telencephalon and some speculations on phylogeny of amniote telencephalon. Ann N Y Acad Sci. 1969;167:164–179. [Google Scholar]
- Karten HJ, Hodos W. Telencephalic projections of the nucleus rotundus in the pigeon (Columba livia) J Comp Neurol. 1970;140:35–51. doi: 10.1002/cne.901400103. [DOI] [PubMed] [Google Scholar]
- Karten HJ, Shimizu T. The origins of neocortex: connections and lamination as distinct events in evolution. J Cogn Neurosci. 1989;1:290–301. doi: 10.1162/jocn.1989.1.4.291. [DOI] [PubMed] [Google Scholar]
- Karten HJ, Cox K, Mpodozis J. Two distinct populations of tectal neurons have unique connections within the retinotectorotundal pathway of the pigeon (Columba livia) J Comp Neurol. 1997;387:449–465. [PubMed] [Google Scholar]
- Kimberly RP, Holden AL, Bamborough P. Response characteristics of pigeon forebrain cells to visual stimulation. Vision Res. 1971;11:475–478. doi: 10.1016/0042-6989(71)90088-5. [DOI] [PubMed] [Google Scholar]
- King AJ. The superior colliculus. Curr Biol. 2004;14:R335–R338. doi: 10.1016/j.cub.2004.04.018. [DOI] [PubMed] [Google Scholar]
- King AJ, Palmer AR. Integration of visual and auditory information in bimodal neurones in the guinea-pig superior colliculus. Exp Brain Res. 1985;60:492–500. doi: 10.1007/BF00236934. [DOI] [PubMed] [Google Scholar]
- Knudsen EI. Auditory and visual maps of space in the optic tectum of the owl. J Neurosci. 1982;2:1177–1194. doi: 10.1523/JNEUROSCI.02-09-01177.1982. [DOI] [PMC free article] [PubMed] [Google Scholar]
- Knudsen EI. Subdivisions of the inferior colliculus in the barn owl (Tyto alba) J Comp Neurol. 1983;218:174–186. doi: 10.1002/cne.902180205. [DOI] [PubMed] [Google Scholar]
- Knudsen EI, Knudsen PF. Contribution of the forebrain archistriatal gaze fields to auditory orienting behavior in the barn owl. Exp Brain Res. 1996;108:23–32. doi: 10.1007/BF00242901. [DOI] [PubMed] [Google Scholar]
- Knudsen EI, Blasdel GG, Konishi M. Sound localization by the barn owl (Tyto alba) measured with the search coil technique. J Comp Physiol A Neuroethol Sens Neural Behav Physiol. 1979;133:1–11. [Google Scholar]
- Knudsen EI, Cohen YE, Masino T. Characterization of a forebrain gaze field in the archistriatum of the barn owl: microstimulation and anatomical connections. J Neurosci. 1995;15:5139–5151. doi: 10.1523/JNEUROSCI.15-07-05139.1995. [DOI] [PMC free article] [PubMed] [Google Scholar]
- Krützfeldt NO, Wild JM. Definition and connections of the entopallium in the zebra finch (Taeniopygia guttata) J Comp Neurol. 2004;468:452–465. doi: 10.1002/cne.10972. [DOI] [PubMed] [Google Scholar]
- Lewald J, Dörrscheidt GJ. Spatial-tuning properties of auditory neurons in the optic tectum of the pigeon. Brain Res. 1998;790:339–342. doi: 10.1016/s0006-8993(98)00177-2. [DOI] [PubMed] [Google Scholar]
- Luksch H, Cox K, Karten HJ. Bottlebrush dendritic endings and large dendritic fields: motion-detecting neurons in the tectofugal pathway. J Comp Neurol. 1998;396:399–414. [PubMed] [Google Scholar]
- Maczko KA, Knudsen PF, Knudsen EI. Auditory and visual space maps in the cholinergic nucleus isthmi pars parvocellularis of the barn owl. J Neurosci. 2006;26:12799–12806. doi: 10.1523/JNEUROSCI.3946-06.2006. [DOI] [PMC free article] [PubMed] [Google Scholar]
- Marín G, Letelier JC, Henny P, Sentis E, Farfán G, Fredes F, Pohl N, Karten H, Mpodozis J. Spatial organization of the pigeon tectorotundal pathway: an interdigitating topographic arrangement. J Comp Neurol. 2003;458:361–380. doi: 10.1002/cne.10591. [DOI] [PubMed] [Google Scholar]
- Marín G, Mpodozis J, Sentis E, Ossandón T, Letelier JC. Oscillatory bursts in the optic tectum of birds represent re-entrant signals from the nucleus isthmi pars parvocellularis. J Neurosci. 2005;25:7081–7089. doi: 10.1523/JNEUROSCI.1379-05.2005. [DOI] [PMC free article] [PubMed] [Google Scholar]
- Marín G, Salas C, Sentis E, Rojas X, Letelier JC, Mpodozis J. A cholinergic gating mechanism controlled by competitive interactions in the optic tectum of the pigeon. J Neurosci. 2007;27:8112–8121. doi: 10.1523/JNEUROSCI.1420-07.2007. [DOI] [PMC free article] [PubMed] [Google Scholar]
- Mikula S, Trotts I, Stone JM, Jones EG. Internet-enabled high-resolution brain mapping and virtual microscopy. Neuroimage. 2007;35:9–15. doi: 10.1016/j.neuroimage.2006.11.053. [DOI] [PMC free article] [PubMed] [Google Scholar]
- Mpodozis J, Cox K, Shimizu T, Bischof HJ, Woodson W, Karten HJ. GABAergic inputs to the nucleus rotundus (pulvinar inferior) of the pigeon (Columba livia) J Comp Neurol. 1996;374:204–222. doi: 10.1002/(SICI)1096-9861(19961014)374:2<204::AID-CNE4>3.0.CO;2-6. [DOI] [PubMed] [Google Scholar]
- Nguyen AP, Spetch ML, Crowder NA, Winship IR, Hurd PL, Wylie DR. A dissociation of motion and spatial-pattern vision in the avian telencephalon: implications for the evolution of “visual streams.”. J Neurosci. 2004;24:4962–4970. doi: 10.1523/JNEUROSCI.0146-04.2004. [DOI] [PMC free article] [PubMed] [Google Scholar]
- Nieder A, Wagner H. Perception and neuronal coding of subjective contours in the owl. Nat Neurosci. 1999;2:660–663. doi: 10.1038/10217. [DOI] [PubMed] [Google Scholar]
- Olsen JF, Knudsen EI, Esterly SD. Neural maps of interaural time and intensity differences in the optic tectum of the barn owl. J Neurosci. 1989;9:2591–2605. doi: 10.1523/JNEUROSCI.09-07-02591.1989. [DOI] [PMC free article] [PubMed] [Google Scholar]
- Pelli DG. The VideoToolbox software for visual psychophysics: transforming numbers into movies. Spat Vis. 1997;10:437–442. [PubMed] [Google Scholar]
- Peña JL, Konishi M. Auditory spatial receptive fields created by multiplication. Science. 2001;292:249–252. doi: 10.1126/science.1059201. [DOI] [PubMed] [Google Scholar]
- Pérez ML, Peña JL. Comparison of midbrain and thalamic space-specific neurons in barn owls. J Neurophysiol. 2006;95:783–790. doi: 10.1152/jn.00833.2005. [DOI] [PMC free article] [PubMed] [Google Scholar]
- Pettigrew JD. Binocular visual processing in the owl's telencephalon. Proc R Soc Lond B Biol Sci. 1979;204:435–454. doi: 10.2196/49307. [DOI] [PMC free article] [PubMed] [Google Scholar]
- Proctor L, Konishi M. Representation of sound localization cues in the auditory thalamus of the barn owl. Proc Natl Acad Sci U S A. 1997;94:10421–10425. doi: 10.1073/pnas.94.19.10421. [DOI] [PMC free article] [PubMed] [Google Scholar]
- Raczkowski D, Diamond IT. Projections from the superior colliculus and the neocortex to the pulvinar nucleus in Galago. J Comp Neurol. 1981;200:231–254. doi: 10.1002/cne.902000205. [DOI] [PubMed] [Google Scholar]
- Reiner A, Yamamoto K, Karten HJ. Organization and evolution of the avian forebrain. Anat Rec A Discov Mol Cell Evol Biol. 2005;287:1080–1102. doi: 10.1002/ar.a.20253. [DOI] [PubMed] [Google Scholar]
- Revzin AM. Some characteristics of wide-field units in the brain of the pigeon. Brain Behav Evol. 1970;3:195–204. doi: 10.1159/000125471. [DOI] [PubMed] [Google Scholar]
- Robinson DL. Functional contributions of the primate pulvinar. Prog Brain Res. 1993;95:371–380. doi: 10.1016/s0079-6123(08)60382-9. [DOI] [PubMed] [Google Scholar]
- Robinson DL, Petersen SE. The pulvinar and visual salience. Trends Neurosci. 1992;15:127–132. doi: 10.1016/0166-2236(92)90354-b. [DOI] [PubMed] [Google Scholar]
- Shimizu T, Bowers AN. Visual circuits of the avian telencephalon: evolutionary implications. Behav Brain Res. 1999;98:183–191. doi: 10.1016/s0166-4328(98)00083-7. [DOI] [PubMed] [Google Scholar]
- Shimizu T, Karten HJ. The avian visual system and the evolution of the neocortex. In: Zeigler HP, Bischof HJ, editors. Vision, brain, and behavior in birds. Cambridge, MA: MIT; 1993. pp. 103–114. [Google Scholar]
- Shipp S. The brain circuitry of attention. Trends Cogn Sci. 2004;8:223–230. doi: 10.1016/j.tics.2004.03.004. [DOI] [PubMed] [Google Scholar]
- Stein BE, Meredith MA. Cambridge, MA: MIT; 1993. The merging of the senses. [Google Scholar]
- Stein BE, Huneycutt WS, Meredith MA. Neurons and behavior: the same rules of multisensory integration apply. Brain Res. 1988;448:355–358. doi: 10.1016/0006-8993(88)91276-0. [DOI] [PubMed] [Google Scholar]
- Tehovnik EJ, Sommer MA. Effective spread and timecourse of neural inactivation caused by lidocaine injection in monkey cerebral cortex. J Neurosci Methods. 1997;74:17–26. doi: 10.1016/s0165-0270(97)02229-2. [DOI] [PubMed] [Google Scholar]
- Vonderschen K, Wagner H. Tuning to interaural time difference and frequency differs between the auditory arcopallium and the external nucleus of the inferior colliculus. J Neurophysiol. 2009;101:2348–2361. doi: 10.1152/jn.91196.2008. [DOI] [PubMed] [Google Scholar]
- Wallace MT, Meredith MA, Stein BE. Integration of multiple sensory modalities in cat cortex. Exp Brain Res. 1992;91:484–488. doi: 10.1007/BF00227844. [DOI] [PubMed] [Google Scholar]
- Wallace MT, Wilkinson LK, Stein BE. Representation and integration of multiple sensory inputs in primate superior colliculus. J Neurophysiol. 1996;76:1246–1266. doi: 10.1152/jn.1996.76.2.1246. [DOI] [PubMed] [Google Scholar]
- Wang SR. The nucleus isthmi and dual modulation of the receptive field of tectal neurons in non-mammals. Brain Res Brain Res Rev. 2003;41:13–25. doi: 10.1016/s0165-0173(02)00217-5. [DOI] [PubMed] [Google Scholar]
- Wang Y, Frost BJ. Time to collision is signalled by neurons in the nucleus rotundus of pigeons. Nature. 1992;356:236–238. doi: 10.1038/356236a0. [DOI] [PubMed] [Google Scholar]
- Wang Y, Luksch H, Brecha NC, Karten HJ. Columnar projections from the cholinergic nucleus isthmi to the optic tectum in chicks (Gallus gallus): a possible substrate for synchronizing tectal channels. J Comp Neurol. 2006;494:7–35. doi: 10.1002/cne.20821. [DOI] [PubMed] [Google Scholar]
- Wang YC, Jiang S, Frost BJ. Visual processing in pigeon nucleus rotundus: luminance, color, motion, and looming subdivisions. Vis Neurosci. 1993;10:21–30. doi: 10.1017/s0952523800003199. [DOI] [PubMed] [Google Scholar]
- Wild JM, Kubke MF, Carr CE. Tonotopic and somatotopic representation in the nucleus basalis of the barn owl, Tyto alba. Brain Behav Evol. 2001;57:39–62. doi: 10.1159/000047225. [DOI] [PubMed] [Google Scholar]
- Xiao Q, Li DP, Wang SR. Looming-sensitive responses and receptive field organization of telencephalic neurons in the pigeon. Brain Res Bull. 2006;68:322–328. doi: 10.1016/j.brainresbull.2005.09.003. [DOI] [PubMed] [Google Scholar]
- Yirmiya R, Hocherman S. Auditory- and movement-related neural activity interact in the pulvinar of the behaving rhesus monkey. Brain Res. 1987;402:93–102. doi: 10.1016/0006-8993(87)91051-1. [DOI] [PubMed] [Google Scholar]
- Zahar Y, Reches A, Gutfreund Y. Multisensory enhancement in the optic tectum of the barn owl: spike count and spike timing. J Neurophysiol. 2009;101:2380–2394. doi: 10.1152/jn.91193.2008. [DOI] [PubMed] [Google Scholar]