

Abstract
Presenilin mutations result in exaggerated endoplasmic reticulum (ER) calcium release in cellular and animal models of Alzheimer's disease (AD). In this study, we examined whether dysregulated ER calcium release in young 3xTg-AD neurons alters synaptic transmission and plasticity mechanisms before the onset of histopathology and cognitive deficits. Using electrophysiological recordings and two-photon calcium imaging in young (6–8 weeks old) 3xTg-AD and non-transgenic (NonTg) hippocampal slices, we show a marked increase in ryanodine receptor (RyR)-evoked calcium release within synapse-dense regions of CA1 pyramidal neurons. In addition, we uncovered a deviant contribution of presynaptic and postsynaptic ryanodine receptor-sensitive calcium stores to synaptic transmission and plasticity in 3xTg-AD mice that is not present in NonTg mice. As a possible underlying mechanism, the RyR2 isoform was found to be selectively increased more than fivefold in the hippocampus of 3xTg-AD mice relative to the NonTg controls. These novel findings demonstrate that 3xTg-AD CA1 neurons at presymptomatic ages operate under an aberrant, yet seemingly functional, calcium signaling and synaptic transmission system long before AD histopathology onset. These early signaling alterations may underlie the later synaptic breakdown and cognitive deficits characteristic of later stage AD.
Introduction
Alzheimer's disease (AD) is a progressive neurodegenerative disorder characterized clinically by cognitive impairments and histopathologically by amyloid plaques, neurofibrillary tangles, and synaptic loss. AD is defined by these late-stage deficits, but identifying early pathogenic mechanisms has primarily been elusive except for increased endoplasmic reticulum (ER) calcium release linked to presenilin (PS) mutations. Dysregulated ER calcium is increasingly implicated as a pathogenic factor in AD (LaFerla, 2002; Mattson and Chan, 2003; Stutzmann, 2007) and is observed across several mutant PS1-expressing systems, mouse models, and human fibroblasts (Ito et al., 1994; Guo et al., 1996; Leissring et al., 1999; Stutzmann et al., 2004, 2006).
There are several mechanisms proposed for the effects of mutant PS on calcium signaling. Bezprozvanny and colleagues suggest that the function of mutant PS as an ER leak channel is impaired, resulting in overfilled ER calcium stores (Tu et al., 2006; Nelson et al., 2007). Alternatively, mutant PS1 may increase the IP3 receptor (IP3R) channel open probability at normally threshold IP3 concentrations, thereby increasing calcium release (Cheung et al., 2008). We and others propose that PS1-mediated calcium dysregulation is primarily mediated through ryanodine receptor (RyR) upregulation (Smith et al., 2005; Stutzmann et al., 2006, 2007). Consistent with this, the PS1 N-terminal region binds to and potentiates RyR activity (Rybalchenko et al., 2008), and mutant PS1 may represent a gain of function. Regardless of mechanism, it is evident that mutant PS increases ER calcium release long before histopathology onset.
ER calcium signaling has a central role in neuronal physiology, synaptic transmission, and plasticity (Berridge, 1998; Verkhratsky, 2002; M. K. Park et al., 2008). Presynaptically, calcium is fundamental in neurotransmitter release and paired pulse facilitation (PPF) (Bouchard et al., 2003) (but see Carter et al., 2002). Postsynaptically, ER calcium integrates with synaptically evoked responses (Ross et al., 2005; Watanabe et al., 2006), modulates membrane excitability and channel function (Stutzmann et al., 2003; Hagenston et al., 2008), and initiates gene transcription (Mellström and Naranjo, 2001; Watanabe et al., 2006). Long-term synaptic plasticity is also modulated by ER calcium signaling. Blocking ER calcium obstructs long-term potentiation (LTP) expression, whereas recruitment of ER calcium can reverse polarity from LTP to long-term depression (LTD) (Obenaus et al., 1989; Nishiyama et al., 2000; C. S. Park et al., 2008).
Previous studies in 3xTg-AD and other AD mouse models have examined hippocampal plasticity and found no functional alterations until the onset of β-amyloid (Aβ) deposition (Oddo et al., 2003; Rowan et al., 2003). In addition, numerous studies have implicated various Aβ species in synaptic impairments (Townsend et al., 2006; Selkoe, 2008; Shankar et al., 2008). However, given the early and dramatic calcium dysregulation in the 3xTg-AD mice and considering the critical role of calcium in synaptic function, we further investigated the impact of aberrant RyR-calcium release on synaptic activity in young 3xTg-AD mice before Aβ deposition. Here, we uncover marked differences in the utilization of RyR-calcium stores that affect both basal synaptic transmission and plasticity in the 3xTg-AD mice.
Materials and Methods
Transgenic mice
Six- to 8-week-old triple transgenic (3xTg-AD) mice and age-matched non-transgenic (NonTg) controls were used in all experiments. The derivation and characterization of the 3xTg-AD (APPswe, TauP301L, and PS1M146VKI) mice have been described previously (Oddo et al., 2003). NonTg control mice were of the same background strain (129/C57BL/6) as the 3xTg-AD mice.
Hippocampal slice preparation
Transverse hippocampal slices were prepared in observance with protocols approved by the Rosalind Franklin University Institutional Animal Care and Use Committee. Briefly, mice were deeply anesthetized with halothane in an enclosed chamber and decapitated. The brains were rapidly extracted, and transverse hippocampal slices (400 μm for field potential recordings and 300 μm for patch-clamp/imaging experiments) were cut with a Vibroslice oscillating microslicer (Campden Instruments) into ice-cold oxygenated artificial CSF (aCSF) with the following composition (in mm): 125 NaCl, 2.5 KCl, 1.25 KH2PO4, 10 dextrose, 25 NaHCO3, 2 CaCl2, and 1.2 MgSO4, pH 7.4 (Stutzmann et al., 2003). Intact slices were placed in a holding chamber containing aCSF at room temperature (27°C) and oxygenated with 95% O2–5% CO2. For recording extracellular field potentials, slices were transferred to an interface chamber (Harvard Apparatus) and perfused with oxygenated aCSF (1.5 ml/min) at room temperature (27°C) and covered with a continuous flow of humidified gas (95% O2–5% CO2).
Field potential recordings and drug treatment protocol
Data were acquired at 10 kHz using pClamp 9.2 software with an Axoclamp 2B amplifier and a DigiData 1322 board for digitization (Molecular Devices). Field EPSP (fEPSPs) were recorded in the stratum radiatum of the CA1 subfield of the hippocampus at room temperature (27°C) using recording microelectrodes (2–6 MΩ) filled with standard aCSF. Microelectrodes were pulled from glass capillaries (World Precision Instruments) on a P-2000 pipette puller (Sutter Instruments). Synaptic responses were evoked by stimulation of the Schaffer collateral/commissural pathway with a bipolar stimulating electrode. Baseline fEPSPs were evoked at 50% of the maximum fEPSP at 0.05 Hz for 20 min before and for 1 h after induction of LTP. LTP was induced at baseline intensity using high-frequency stimulation consisting of two trains of 100 Hz at a 10 s interval. Input/output (I/O) curves were generated using stimulus intensities from 0 to 225 μA in increments of 25 μA. PPF was assessed using an interstimulus interval of 50 ms. Ten successive traces were recorded for PPF at 0.05 Hz. In protocols with drug treatment, a 20 min baseline at 0.05 Hz was recorded in aCSF, after which dantrolene (RyR antagonist, 10 μm; Tocris Bioscience), caffeine (RyR agonist, 5 mm; Sigma-Aldrich), or DPCPX (8-cyclopentyl-1,3-dipropylxanthine) [adenosine A1 receptor (A1R) antagonist, 1 μm; Sigma-Aldrich] in aCSF was perfused continuously over the slice. The same stimulus was used to record a 20 min baseline in the drug, after which LTP was induced, followed by a 1 h baseline in the drug. Apamin (SK channel antagonist, 1 μm; Sigma-Aldrich) was used in the I/O protocol.
Picrotoxin (GABAA receptor antagonist, 50 μm; Sigma-Aldrich) had been tested in initial field potential experiments in both NonTg and 3xTg-AD slices but was not used in the experiments presented in this study. We analyzed data with and without picrotoxin and found no significant differences between them (I/O, t(1,10) = 0.54, p > 0.05; PPF, t(1,10) = 0.17, p > 0.05; LTP, t(1,10) = 1.47, p > 0.05; n = 7 for aCSF, n = 5 for picrotoxin). We feel this reflects the anatomical characteristics of the medial and distal portions of the stratum radiatum of the CA1 subfield, in which we placed our recording electrodes, which receive sparse GABAergic inputs (Megías et al., 2001). For clarity, the data shown include only non-picrotoxin conditions.
Patch-clamp recordings and two-photon calcium imaging
Whole-cell recordings and solutions.
In a separate set of experiments, visualized whole-cell patch-clamp recordings were performed using infrared-differential interference contrast optics. Slices were placed in a perfusion chamber mounted on a movable stage assembly on a fixed upright microscope (BX51WI; Olympus). Patch pipettes (4–5 MΩ) were pulled from borosilicate glass capillaries (World Precision Instruments) and filled with the following (in mm): 135 K-methylsulfonate, 10 HEPES, 10 Na-phosphocreatine, 2 MgCl2, 4 NaATP, and 0.4 NaGTP, pH adjusted to 7.3–7.4 with KOH (as well as 50 μm fura-2) (Invitrogen). Recordings were performed at room temperature (27°C). In these experiments, TTX was not included in the bath solution because previous experiments showed no differences in the spontaneous synaptic events in pyramidal neurons from NonTg or 3xTg-AD mice, with or without TTX (frequency, p = 0.34; amplitude, p = 0.65, respectively). This likely reflects the lack of spontaneous action potentials in the slice preparation. Signals were acquired at 1 kHz using a MultiClamp 700B amplifier (Molecular Devices) and analyzed using pClamp 10.0 software. Access resistance was continually monitored, and cells were used for recording only if the access resistance was maintained at <7 MΩ.
Calcium imaging.
Imaging of fluorescent calcium signals was performed using a custom built two-photon microscope. In brief, excitation was provided by trains (80 MHz) of ultra-short (<100 fs) pulses at 780 nm from a titanium/sapphire laser (Mai Tai Broadband; Spectra Physics) pumped by a solid-state laser (Millenia 5X; Spectra Physics). The laser beam was scanned by a resonant galvanometer (General Scanning Lumonics) allowing rapid (7.9 kHz) bidirectional scanning in the x-axis and by a conventional linear galvanometer in the y-axis, to provide a frame-scan rate of 30 frames/s. The scanned beam was focused onto the specimen through a 40× water-immersion objective (numerical aperture 0.8). Emitted fluorescence light was collected through the same objective and, after passing through a short-pass filter (<650 nm) to block laser light, was detected by a wide-field photomultiplier (Electron Tubes) mounted on the photo-port of the trinocular head. Data were obtained using fura-2 as the calcium ion indicator. Two-photon excitation of fura-2 at 780 nm is equivalent to conventional (one-photon) excitation at 380 nm, in that it shows a decrease in fluorescence on binding calcium ions rather than an increase as with most other indicators. The basal fluorescence is thus high, facilitating identification of cellular structures and measurement of small calcium increases over the resting level. Second, fura-2 shows a large dynamic range, with the fluorescence intensity changing >10-fold from resting to saturating [Ca2+]. Fura-2 was chosen for this study based on these reasons and after assays of multiple fluorescent Ca2+ indicators were performed examining a range of Kd values (50 μm to 140 nm). For clarity of presentation, images and traces of fura-2 fluorescence were expressed as a pseudo-ratio F0/ΔF (where F0 is resting fluorescence and ΔF is the decrease of fluorescence on stimulation), so that increases in [Ca2+] correspond to increasing ratios, and fura-2 produced the highest fluorescent signal with little saturation or phototoxicity.
RNA extraction and reverse transcription
Total mouse hippocampal RNA was extracted and purified from 20–40 mg samples (wet weight) dissected from young (6–8 weeks old) 3xTg-AD and NonTg animals using TRI Reagent and the corresponding protocol (Invitrogen). RNA was constituted in sterile, nuclease-free water, and sample concentrations were determined spectrophotometrically at DO260nm. After DNase treatment of 1 μg of total RNA (DNAfree kit; Ambion), dNTP and random primers were used for cDNA synthesis using the High Capacity Reverse Transcription kit (Applied Biosystems) and associated protocol.
Quantitative real-time PCR
One microliter of the resulting cDNA products was evaluated using real-time PCR. Target genes were amplified and evaluated using the 7500 RT PCR System and SYBR green detection (Applied Biosystems). Cycling parameters were as follows: 2 min at 50°C, 10 min at 95°C, and then 40 cycles at 95°C for 15 s, followed by 60°C for 60 s. A dissociation phase was added to the end of each cycle to determine product purity. Oligonucleotide primers were synthesized by Invitrogen for target gene amplification. Cyclophilin A was used as an endogenous control (housekeeping) gene. Primer sequences are as follows: RyR1: forward (F), 5′-TCTTCCCTGCTGGAGACTGT-3′; reverse (R), 5′-GTGGAGAAGGCACTTGAGG-3′; RyR2: F, 5′-TCAAACCACGAACACATTGAGG-3′; R, 5′-AGGCGGTAAAACATGATGTCAG-3′; RyR3: F, 5′-CTGGCCATCATTCAAGGTCT-3′; R, 5′-GTCTCCATGTCTTCCCGTA-3′; CycloA: F, 5′-GGCCGATGACGAGCCC-3′; R, 5′-TGTCTTTGGAACTTTGTCTGCAAAT-3′. Primer specificities were validated by the presence of a single amplicon for each primer set at the predicted sizes (95, 125, and 83 bp for RyR1, RyR2, and RyR3, respectively) after agarose gel electrophoresis of PCR products and ethidium bromide detection. Product purity was supported by the presence of a single peak present on dissociation/melt curves for each primer set. Each sample was evaluated in triplicate. Amplification data were analyzed using the comparative cycle threshold (ΔΔCt) method after normalization to Cyclophilin A and are represented as mean ± SEM relative mRNA expression levels. A two-tailed t test was used to determine statistical significance.
Data analysis and statistics
For LTP recordings, maximum fEPSP slopes were measured offline using pClamp 9.2 software and analyzed using Origin Pro8 and Microsoft Excel software. The maximum fEPSP slopes were expressed as a percentage of the average slope from the 20 min baseline recordings. PPF fEPSP amplitudes were measured offline using the same software and expressed as a ratio of second fEPSP amplitude over first fEPSP amplitude. For I/O curves, the first 5 ms of the fEPSP slopes were measured offline using the same software. Data are expressed as mean ±SEM and assessed for significance using the Student's two-tailed t test or paired t test, or one-way ANOVA with Scheffé's post hoc analysis, where n denotes the number of slices examined unless otherwise stated. For calcium imaging and intracellular recordings, relative changes in maximal intracellular calcium were calculated after background subtraction as a pseudo-ratio based on changes in fura-2 fluorescence intensity levels relative to baseline (Stutzmann et al., 2003, 2004). Statistical differences in evoked calcium responses between the NonTg and 3xTg-AD neurons were determined by unpaired t tests. For determining significance in cumulative probability histograms, nonparametric Kolmogorov–Smirnov (K–S) tests were performed using Origin Pro8 software.
Results
Enhanced RyR-evoked calcium release within 3xTg-AD CA1 neuronal compartments: effects on spontaneous postsynaptic potentials
Hippocampal CA1 pyramidal neurons from 6- to 8-week-old mice were visually selected based on morphology and confirmed electrophysiologically (Shelbourne et al., 2007). Once whole-cell configuration was established, the calcium indicator dye fura-2 diffused throughout the cell for 10 min before imaging. Baseline fluorescence was not different between NonTg and 3xTg-AD neurons at rest (p > 0.05; data not shown). Caffeine (5 mm) was bath applied for 1 min, and maximal relative calcium changes from baseline were measured either in the soma/proximal dendrite regions or distal dendrites/spines in the CA1 stratum radiatum subfield, followed by a 10 min washout period (Fig. 1). This relatively low caffeine dose was chosen for this study based on its threshold calcium response in the NonTg mice and minimal epileptiform activity via disinhibition of the adenosine A1 receptor in field potential recordings. In the soma/proximal dendrite regions, RyR activation evoked a significantly greater calcium response in the 3xTg-AD neurons (F0/ΔF = 0.17 ± 0.05, n = 5) compared with the NonTg mice (F0/ΔF = 0.02 ± 0.03, n = 5; t(1,9) = 2.7; p < 0.05). In the distal dendrites, there was a significantly greater caffeine-evoked calcium response from 3xTg-AD mice (F0/ΔF = 0.16 ± 0.04, n = 12) relative to NonTg (F0/ΔF = 0.018 ± 0.01, n = 13; t(1,24) = 0.11 ± 0.03), and, in spine heads, there was a significant 12-fold increase in the RyR-calcium response from 3xTg-AD mice (F0/ΔF = 0.18 ± 0.02, n = 98) relative to NonTg (F0/ΔF = 0.015 ± 0.01, n = 25; t(1,122) = 2.7; p < 0.05).
Figure 1.
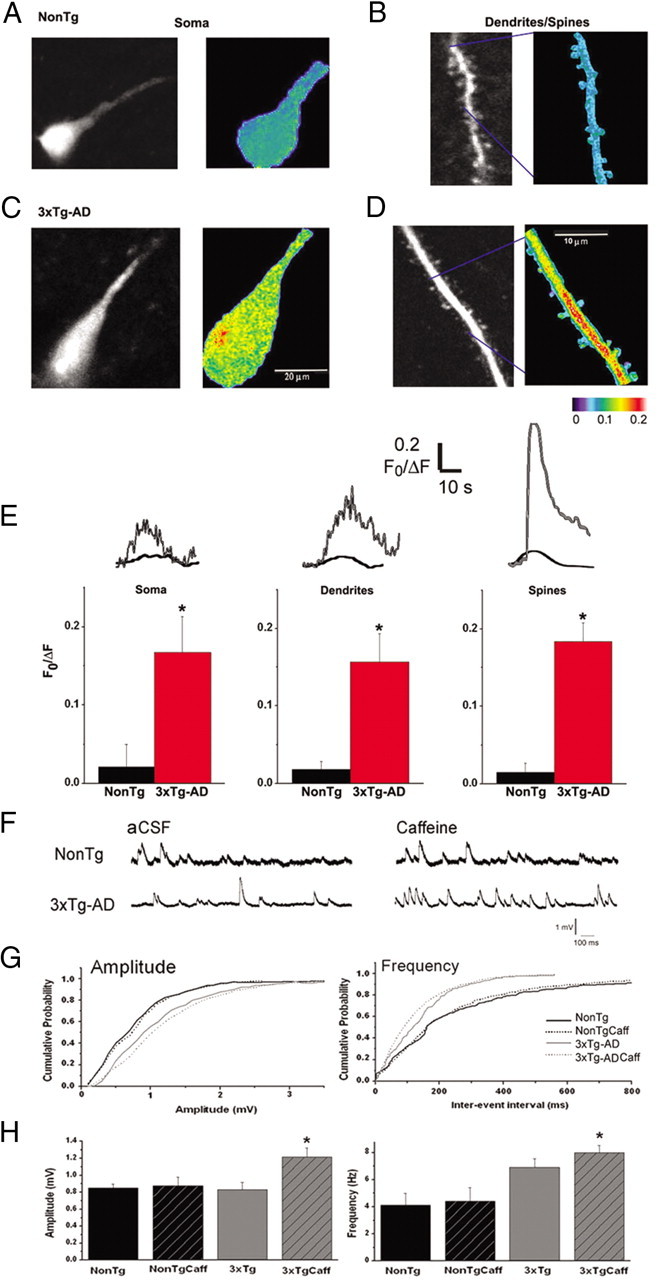
Increased RyR-evoked Ca2+ release in CA1 hippocampal neurons from 3xTg-AD mice. A, Left, Baseline two-photon Ca2+ image of a representative CA1 pyramidal neuron from a NonTg mouse. Right, Pseudocolored image of Ca2+ signals evoked by 5 mm caffeine. Colors correspond to relative Ca2+ changes indicated by the color scale below. B, Left, Two-photon image of a segment of dendrite and spines from a NonTg CA1 pyramidal neuron at rest. Right, Pseudocolored image of same dendritic region showing relative Ca2+ changes after caffeine application. C, Same as in A but from a 3xTg-AD neuron. D, Same as in B but from a 3xTg-AD neuron. E, Bar graphs comparing averaged maximal Ca2+ changes in the soma (left), dendrite (middle), and spine heads (right) between NonTg and 3xTg-AD CA1 pyramidal neurons. *p < 0.05, significantly different from NonTg within anatomical subregions,. F, Representative traces of spontaneous postsynaptic potentials recorded from CA1 pyramidal neurons from NonTg (top) and 3xTg-AD mice (bottom) in control aCSF (left) and 5 mm caffeine (right). G, Cumulative probability histograms demonstrating that caffeine increases the amplitude (left) and frequency (right) of spontaneous potentials only in the 3xTg-AD mice (K–S test, p < 0.05). H, Bar graphs show averaged amplitude (left) and frequency (right) values of spontaneous postsynaptic potentials for NonTg (black) and 3xTg-AD (gray) neurons in control aCSF (solid) or 5 mm caffeine (stripes). Caffeine significantly increased both amplitude and frequency measurements in the 3xTg-AD neurons relative to all NonTg conditions, *p < 0.05.
With the concurrent patch-clamp recordings, spontaneous postsynaptic potentials were recorded for a period of 30–60 s in both control aCSF and 5 mm caffeine for NonTg and 3xTg-AD neurons (n = 4 in each condition), and their amplitude and frequency characteristics were analyzed using MiniAnalysis software (version 6.0.9; Synaptosoft). As shown in Figure 1, F and G, cumulative probability histograms of event amplitudes demonstrate that caffeine significantly increases the amplitude (rightward shift) of spontaneous potentials only in the 3xTg-AD neurons relative to NonTg responses in aCSF and caffeine and 3xTg-AD responses in aCSF (K–S test, p < 0.05). Similarly, for analysis of interevent intervals, caffeine significantly increased the frequency of event responses (leftward shift) for the 3xTg-AD neurons in caffeine relative to NonTg and 3xTg-AD neurons in aCSF (K–S test, p < 0.05). Notably, baseline 3xTg-AD responses in aCSF were also shifted leftward relative to NonTg responses in either aCSF or caffeine (K–S test, p < 0.05). Averaged event amplitude and frequency values are shown in Figure 1H, and, in each bar graph, significant increases are demonstrated only in the 3xTg-AD/caffeine conditions relative to NonTg values (amplitude: one-way ANOVA, F(3,15) = 3.9, p < 0.05, Scheffé's post hoc analysis, p < 0.05 for 3xTg-AD/caffeine vs 3xTg-AD/aCSF, NonTg/aCSF, and NonTg/caffeine; frequency: one-way ANOVA, F(3,15) = 5.4, p < 0.05, Scheffé's post hoc analysis, p < 0.05 for 3xTg-AD/ caffeine vs NonTg/aCSF and NonTg/caffeine). This indicates that RyR activation increases the average spontaneous postsynaptic potential amplitude, generally considered a postsynaptic measure, in the 3xTg-AD neurons but has no significant effects in NonTg neurons. In addition, baseline event amplitudes are not different between NonTg and 3xTg-AD mice in control aCSF. A similar pattern exists for their frequency, which is generally considered a measure of presynaptic activity and vesicle release. Here, RyR activation increases frequency in the 3xTg-AD neurons relative to NonTg neurons (either in aCSF or caffeine) but not in relation to 3xTg-AD neurons in aCSF.
RyR2 mRNA levels are upregulated in young 3xTg-AD mice
To elucidate a possible mechanism for aberrant RyR-mediated ER calcium utilization in 3xTg-AD mice, we compared mRNA expression levels of the three RyR isoforms between NonTg and 3xTg-AD mice using quantitative reverse transcription-PCR (Fig. 2). The RyR mRNA levels from NonTg and 3xTg-AD mice were normalized to expression levels of Cyclophilin A. There were no differences in RyR1 (n = 3, t(1,2) = 1.45; p > 0.05) or RyR3 expression levels (n = 5, t(1,4) = 0.67; p > 0.05) between NonTg and 3xTg-AD mice. However, RyR2 mRNA expression levels were significantly increased in the hippocampus of 3xTg-AD mice relative to the NonTg controls (n = 5, t(1,5) = 3.53; p < 0.05). Therefore, RyR2 upregulation may underlie the exaggerated RyR-mediated ER calcium release and altered synaptic transmission properties in young 3xTg-AD mice.
Figure 2.

Upregulation of the RyR2 isoform in 3xTg-AD hippocampus. Bar graphs show relative mRNA expression levels of RyR1 (top), RyR2 (middle), and RyR3 (bottom) isoforms from the hippocampus of NonTg (black) and 3xTg-AD (gray) mice. To the right of each graph are the PCR products detected on an agarose gel along with relevant positive and negative controls for each RyR isoform. mRNA levels are relative to control Cyclophilin A levels. *p < 0.05, significantly different from NonTg levels. Error bars represent ±SEM.
Aberrant contribution of RyR-evoked calcium to synaptic transmission in 3xTg-AD neurons
Extracellular field potential recordings were used to study synaptic transmission in the hippocampal CA1 subfield from NonTg and 3xTg-AD mice. In control aCSF, there were no apparent differences in basal synaptic transmission between NonTg (n = 15) and 3xTg-AD (n = 26) mice as determined by the first 5 ms of the slope of the I/O functions (t(1,39) = 0.28; p > 0.05) (Fig. 3A). However, during RyR blockade with 10 μm dantrolene, very different patterns of synaptic activity emerged (Fig. 4A–C). Dantrolene treatment had little effect on basal synaptic transmission in NonTg mice (n = 5; t(1,4) = 1.92; p > 0.05), whereas in the 3xTg-AD mice, blocking the RyR resulted in a significantly greater I/O function (n = 9; t(1,8) = 6.17; p < 0.05). These findings are consistent with RyR-evoked calcium release activating postsynaptic calcium-activated K+ channels, likely the SK channels, which mediate the medium afterhyperpolarization and suppress membrane excitability (Stutzmann et al., 2006; Brennan et al., 2008). To assess the role of SK channels in synaptic transmission, we compared the I/O function after blocking these channels with 1 μm apamin (Fig. 4D, E). In parallel with the effects of dantrolene, apamin had no effect in NonTg mice (n = 3; t(1,2) = 0.5; p > 0.05) yet significantly increased the I/O function in 3xTg-AD mice at higher stimulus intensities (n = 4; t(1,3) = 5.84; p < 0.05). Plotting presynaptic fiber volley (FV) amplitude with postsynaptic fEPSP slopes suggest that neither dantrolene nor apamin altered the properties of presynaptic fibers in NonTg or in 3xTg-AD mice (one-way ANOVA, F(1,17) = 1.62; p > 0.05) (data not shown).
Figure 3.

Basal synaptic transmission properties of CA3–CA1 Schaffer collaterals recorded from 6- to 8-week-old NonTg and 3xTg-AD mice. A, Top, Representative I/O traces show changes in fEPSP amplitude with increasing stimulus intensity for NonTg (black) and 3xTg-AD (gray) mice. Bottom, I/O function shows changes in fEPSP slope with increasing stimulus intensity (0–225 μA) for NonTg (black circles; n = 15) and 3xTg-AD (gray squares; n = 25) mice. B, PPF was measured at an interstimulus interval of 50 ms. Top, Representative PPF traces from NonTg (black) and 3xTg-AD (gray) mice. Bottom, Bar graphs show paired pulse ratio for NonTg (black; n = 21) and 3xTg-AD (gray; n = 33) mice. C, Top, Representative fEPSP traces before (1) and after (2) induction of LTP from NonTg (black; n = 7) and 3xTg-AD (gray; n = 6) mice. Bottom, Graph shows averaged time course of LTP. Baseline fEPSPs were recorded for 20 min at 0.05 Hz before and for 60 min at 0.05 Hz after induction of LTP. The arrow indicates the time of tetanus (2 trains at 100 Hz, 10 s apart). Error bars represent ±SEM, and n denotes number of slices.
Figure 4.

Disparity in the contribution of RyR-mediated ER Ca2+ stores to synaptic transmission in NonTg and 3xTg-AD mice. A–F, Top, Representative I/O traces show changes in fEPSP amplitude with increasing stimulus intensity for NonTg mice (A, black) and 3xTg-AD mice (B, gray) before and after treatment with 10 μm dantrolene, for NonTg mice (D, black) and 3xTg-AD mice (E, gray) before and after treatment with 1 μm apamin, and for 3xTg-AD mice (F, gray) before and after treatment with 10 μm dantrolene at low stimulus intensity (0–20 μA). Bottom, I/O function shows changes in fEPSP slope with increasing stimulus intensity for NonTg mice before (A, filled black circles; n = 5) and after (open black circles) and for 3xTg-AD mice before (B, filled gray squares; n = 9) and after (open gray squares), and comparing NonTg (C) (open black circles) and 3xTg-AD (open gray squares) mice after treatment with 10 μm dantrolene, for NonTg mice before (filled black circles; n = 3) and after (open black circles) (D), and 3xTg-AD mice before (filled gray squares; n = 4) and after (open gray squares) (E) treatment with 1 μm apamin. F, I/O function shows changes in fEPSP slope at low stimulus intensity (0–20 μA) for 3xTg-AD mice before (filled gray squares; n = 3) and after (open gray squares) treatment with 10 μm dantrolene. G–I, PPF was measured at an interstimulus interval of 50 ms. Top, Representative PPF traces from NonTg (G, black) and 3xTg-AD (H, gray) mice before (1) and after (2) and comparing NonTg (black) and 3xTg-AD (gray) mice (I) after treatment with 10 μm dantrolene. Bottom, Bar graphs show paired pulse ratio for NonTg (n = 5) (G) and 3xTg-AD (n = 9) (H) before (black and dark gray, respectively) and after (white and light gray, respectively), and comparing NonTg (white) and 3xTg-AD (light gray) mice after treatment with 10 μm dantrolene (I). * indicates significantly different from 3xTg-AD before dantrolene treatment. ** indicates significantly different from NonTg. Error bars represent ±SEM, p < 0.05, and n denotes the number of slices.
Short- and long-term plasticity are differentially modulated by RyR-evoked calcium release in 3xTg-AD neurons
Presynaptic short-term plasticity was measured by PPF, a form of calcium-dependent plasticity and an indicator of neurotransmitter release probability. In control aCSF (Fig. 3B), PPF was similar between NonTg (n = 21) and 3xTg-AD (n = 33) mice, yet distinctions arise between the mouse strains when manipulating RyR-sensitive calcium stores (Fig. 4G–I). Although dantrolene treatment had no observable effects in NonTg mice (n = 5), it significantly increased PPF in 3xTg-AD mice (n = 9, PPF; one-way ANOVA, F(3,13) = 16.68; p < 0.05, Scheffé's post hoc analysis, p < 0.05 for 3xTg-AD/dantrolene vs 3xTg-AD/aCSF, NonTg/aCSF, and NonTg/dantrolene). This suggests that presynaptic RyR-sensitive calcium stores are functionally active and contribute to the readily releasable pool of neurotransmitter vesicles in the 3xTg-AD mice but less so in the NonTg mice.
LTP was measured by normalizing the posttetanus fEPSP slope to the pretetanus fEPSP slope values. At 6–8 weeks of age, LTP appeared similar between the two strains of mice [t(1,11) = 0.31; p > 0.05; 78.26 ± 2.0% over baseline for NonTg mice (n = 7) and 80.66 ± 2.3% over baseline for 3xTg-AD mice (n = 6)] (Fig. 3C). It is well established that ER calcium stores are involved in LTP mechanisms. When both baseline and posttetanic responses are measured in the presence of a RyR blocker, LTP is essentially abolished (Obenaus et al., 1989). However, this approach does not take into account drug treatment effects on baseline responses. In this study, we performed a more extensive three-step protocol by recording baseline responses in control aCSF, followed by a new baseline recording in 10 μm dantrolene, and then administering the tetanus and measuring potentiation in dantrolene. This allows comparison of LTP expression against both a control baseline and a drug treatment baseline. With this approach, striking differences in RyR-evoked calcium utilization were observed between NonTg and 3xTg-AD mice (Fig. 5). In NonTg mice (n = 7), there was no change in the baseline fEPSP slope after treatment with dantrolene (5.84 ± 1.7% over aCSF baseline; t(1,6) = 0.91; p > 0.05), although LTP was reduced when compared with its control aCSF baseline (32.62 ± 2.3% over baseline). In 3xTg-AD mice (n = 5), there was a significant decrease in baseline fEPSP slope after dantrolene application (34.85 ± 2.3% below aCSF baseline; t(1,4) = 12.22; p < 0.05) and modest LTD when compared with control aCSF baseline (17.07 ± 1.2% below baseline). Nevertheless, when compared with baseline in dantrolene, LTP was essentially abolished in both NonTg (25.29 ± 1.4%) and 3xTg-AD (7.02 ± 1.9%) mice, in accordance with previous studies (Obenaus et al., 1989). To monitor long-term dantrolene effects on baseline responses in NonTg and 3xTg-AD mice, we applied 10 μm dantrolene for 60 min (LTP protocol duration) and measured baseline synaptic responses at 0.05 Hz (supplemental Fig. 2A, B, available at www.jneurosci.org as supplemental material). We demonstrate here that long-term dantrolene exposure generates a stable response over time in both the NonTg (2.77 ± 1.0% over aCSF baseline; t(1,4) = 1.2; p > 0.05) and 3xTg-AD (38.36 ± 1.3% below aCSF baseline; t(1,3) = 9.22; p < 0.05) mice. Therefore, the differential responses in LTP expression are not attributable to shifting baseline values.
Figure 5.

RyR-mediated ER Ca2+ stores contribute differently to LTP in NonTg and 3xTg-AD mice. A, Graph shows changes in baseline fEPSP slope from NonTg (black circles; n = 7) and 3xTg-AD (gray squares; n = 5) mice after treatment with 10 μm dantrolene. B, Bar graph shows fEPSP slope of pretetanus (white and light gray, respectively) and posttetanus (black and gray hatched, respectively) baselines in the presence of dantrolene as percentage of predantrolene baseline (black and dark gray, respectively) in NonTg and 3xTg-AD mice. C, Top, Representative pretetanus fEPSP traces before (1) and after (2) treatment with dantrolene and posttetanus fEPSP traces (3) with dantrolene from NonTg (black) and 3xTg-AD (gray) mice. Bottom, Graph shows averaged time course of LTP with predrug baseline, pretetanic, and posttetanic baseline with dantrolene treatment from NonTg (black circles) and 3xTg-AD (gray squares) mice. The black arrow indicates the time of tetanus. * indicates significantly different from 3xTg-AD before dantrolene treatment. Error bars represent ±SEM, p < 0.05, and n denotes the number of slices.
Divergent synaptic responses to stimulus intensity with RyR blockade in 3xTg-AD mice
In 3xTg-AD mice, the dantrolene-mediated reduction in baseline fEPSP (as measured before the LTP tetanus) (Fig. 5A) is consistent with the observed increase in PPF (indicative of decreased synaptic strength). However, this finding appears in conflict with the increased I/O function during dantrolene application, especially at higher stimulus intensities. To address this disparity, we recorded fEPSPs in control aCSF using a higher stimulus intensity (75 μA rather than ∼20μA), followed by recordings in dantrolene (10 μm) at the same stimulus intensity (Fig. 6). The 75 μA stimulation was chosen because it evoked near-maximal fEPSP slope responses. Here, too, dantrolene did not change the baseline fEPSP slope in NonTg mice (2.84 ± 1.9% over aCSF baseline; n = 4; t(1,3) = 0.97; p > 0.05). However, in 3xTg-AD mice, dantrolene still increased the fEPSP slope at this stimulus intensity (163.45 ± 5.1% over baseline in aCSF; n = 5; t(1,4) = 37.95; p < 0.05). The effects of dantrolene on PPF using the 75 μA stimulus intensity were also examined, and there were no significant differences in the NonTg (n = 4; t(1,3) = 1.34; p > 0.05) or 3xTg-AD (n = 4; t(1,3) = 0.86; p > 0.05) mice. To further clarify the disparity between the excitatory and inhibitory role of RyR on synaptic transmission, we next examined the effect of dantrolene on basal synaptic transmission using low stimulus intensities (0–20 μA) (Fig. 4F). Dantrolene decreased I/O responses at low stimulus intensities when compared with responses in aCSF in 3xTg-AD mice (t(1,2) = 1.96; p > 0.05). These findings suggest activity-dependent variations in RyR-mediated calcium signaling in presynaptic and postsynaptic neurons of 3xTg-AD mice that are not present in NonTg mice.
Figure 6.

Strong synaptic stimulation differentially recruits RyR-Ca2+ stores in an activity-dependent manner in 3xTg-AD mice. A–C, PPF was measured at an interstimulus interval of 50 ms at a stimulus intensity of 75 μA. This stimulus intensity evoked maximal fEPSP slope responses. The fEPSP slope responses evoked at higher stimulus intensities were not significantly greater than those at 75 μA. Top, Representative PPF traces from NonTg (A, black) and 3xTg-AD (B, gray) mice before (1) and after (2) and comparing NonTg (black) and 3xTg-AD (gray) mice after treatment with 10 μm dantrolene (C). Bottom, Bar graphs show paired pulse ratio for NonTg (n = 4) (A) and 3xTg-AD (n = 4) (B) mice before (black and dark gray, respectively) and after (white and light gray, respectively) and comparing NonTg (white) and 3xTg-AD (light gray) mice after treatment with 10 μm dantrolene (C). D, Left, Graph shows changes in baseline fEPSP slope from NonTg (black circles; n = 4) and 3xTg-AD (gray squares; n = 5) mice after treatment with 10 μm dantrolene at a stimulus intensity of 75 μA. Right, Representative fEPSP traces from NonTg (black) and 3xTg-AD (gray) mice before (1) and after (2) treatment with dantrolene. Error bars represent ±SEM, and n denotes number of slices.
Effects of RyR stimulation on basal synaptic transmission and short-term presynaptic plasticity
Basal synaptic transmission and synaptic strength were measured by I/O curves as described (stimulus intensity, 0–225 μA in increments of 25μA) and then repeated in the presence of the RyR agonist caffeine (Fig. 7). In addition to stimulating the RyR, caffeine is also an effective antagonist of the adenosine A1 receptor that is found in the CA1 hippocampal subfield (Ochiishi et al., 1999; Stutzmann et al., 2001). Caffeine (5 mm) significantly increased the I/O function for the NonTg (n = 5; t(1,4) = 4.96; p < 0.05) and 3xTg-AD (n = 6; t(1,5) = 5.14; p < 0.05) mice, with no significant difference between the two mouse strains in caffeine (p > 0.05). Caffeine did not affect the excitability properties of presynaptic fibers in NonTg or 3xTg-AD mice (FV amplitude vs fEPSP slope: one-way ANOVA, F(1,9) = 2; p > 0.05) (data not shown). Caffeine decreased PPF in NonTg (n = 5) as well as in 3xTg-AD mice (n = 9), although to a greater extent in the 3xTg-AD mice (PPF: one-way ANOVA, F(3,13) = 22.52; p < 0.05, Scheffé's post hoc analysis, p < 0.05 for NonTg/caffeine vs NonTg/aCSF and 3xTg-aCSF; p < 0.05 for 3xTg-AD/caffeine vs NonTg/aCSF and 3xTg-AD/aCSF).
Figure 7.

Effect of activating RyR-mediated ER Ca2+ stores on synaptic transmission in NonTg and 3xTg-AD mice. A–C, Top, Representative I/O traces show changes in fEPSP amplitude with increasing stimulus intensity for NonTg mice (A, black) and for 3xTg-AD mice (B, gray) before and after treatment with 5 mm caffeine. Bottom, I/O function shows changes in fEPSP slope with increasing stimulus intensity (0–225 μA) for NonTg mice before (A) (filled black circles; n = 5) and after (open black circles), for 3xTg-AD mice before (filled gray squares; n = 6) and after (open gray squares) (B), and comparing NonTg (open black circles) and 3xTg-AD (open gray squares) mice after treatment with 5 mm caffeine (C). D–F, PPF was measured at an interstimulus interval of 50 ms. Top, Representative PPF traces from NonTg (D, black) and 3xTg-AD (E, gray) mice before (1) and after (2) and comparing NonTg (black) and 3xTg-AD (gray) mice after treatment with 5 mm caffeine (F). Bottom, Bar graphs show paired pulse ratio for NonTg (n = 5) (D) and 3xTg-AD (n = 9) (E) mice before (black and dark gray, respectively) and after (white and light gray, respectively) and comparing NonTg (white) and 3xTg-AD (light gray) mice after treatment with 5 mm caffeine (F). * indicates significantly different from NonTg before caffeine treatment. ** indicates significantly different from 3xTg-AD before caffeine treatment. *** indicates significantly different from NonTg. Error bars represent ±SEM, p < 0.05, and n denotes the number of slices.
Effects of RyR stimulation on long-term plasticity
Here we performed the more extensive LTP protocol by recording baseline responses in control aCSF and also in the presence of caffeine (5 mm) and then administering the tetanus and measuring plasticity in caffeine. As with the dantrolene studies, this allowed us to compare the LTP expression against both a control baseline and a drug baseline (Fig. 8).
Figure 8.

Effect of activating RyR-mediated ER Ca2+ stores on LTP in NonTg and 3xTg-AD mice. A, Graph shows changes in baseline fEPSP slope from NonTg (black circles; n = 4) and 3xTg-AD (gray squares; n = 4) mice after treatment with 5 mm caffeine. B, Bar graph shows fEPSP slope of pretetanus (white and light gray, respectively) and posttetanus (black and gray hatched, respectively) baselines in presence of caffeine as percentage of precaffeine baseline (black and dark gray, respectively) in NonTg and 3xTg-AD mice. C, Top, Representative pretetanus fEPSP traces before (1) and after (2) treatment with caffeine and posttetanus fEPSP traces (3) with caffeine from NonTg (black) and 3xTg-AD (gray) mice. Bottom, Graph shows averaged time course of LTP with predrug baseline and pretetanic and posttetanic baseline with caffeine treatment from NonTg (black circles) and 3xTg-AD (gray squares) mice. D, Top, Representative pretetanus fEPSP traces before (1) and after (2) treatment with caffeine and posttetanus fEPSP traces (3) with caffeine from NonTg mice (black). Bottom, Graph shows averaged time course of LTP with predrug baseline and pretetanic and posttetanic baseline with caffeine treatment from NonTg mice (black circles; n = 4). Here, the stimulus intensity was adjusted so that the fEPSP size after caffeine treatment matched the precaffeine fEPSP size. The tetanus was applied at the readjusted stimulus intensity. The black arrow indicates the time of tetanus. * indicates significantly different from NonTg before caffeine treatment. ** indicates significantly different from 3xTg-AD before caffeine treatment. Error bars represent ±SEM, p < 0.05, and n denotes the number of slices.
There was a substantial increase in baseline fEPSP slopes after caffeine treatment in both NonTg (n = 4; 312.51 ± 5.3% over aCSF baseline; t(1,3) = 67.39; p < 0.05) and 3xTg-AD (n = 4; 337.23 ± 7.9% over aCSF baseline; t(1,3) = 43.34; p < 0.05) mice. In NonTg mice after caffeine exposure, LTP was increased when compared with its control aCSF baseline (415.32 ± 9.7%) but essentially abolished when compared with the caffeine baseline (20.25 ± 0.9%). This finding is consistent with depletion of neurotransmitter stores in NonTg mice. To further explore this mechanism, we repeated this experiment in caffeine after reducing the stimulus intensity to return the fEPSP amplitude to control levels. Under these conditions, there was a transient expression of LTP 20–30 min after tetanus (106.99 ± 6.8% over caffeine baseline) that returned to pretetanus baseline levels by 50–60 min (24.29 ± 7.3% over caffeine baseline). However, in the 3xTg-AD mice, caffeine generated different patterns of LTP expression. LTP was greatly increased when compared with its control aCSF baseline (800.84 ± 20.3%), and considerable potentiation remained when compared with its caffeine baseline (143.07 ± 3.2% over baseline). To ensure that caffeine was not altering baseline responses, we also monitored the long-term effects of caffeine and measured baseline synaptic responses at 0.05 Hz for 60 min in 5 mm caffeine (supplemental Fig. 2C, D, available at www.jneurosci.org as supplemental material). Long-term caffeine application results in a stable response over time in both the NonTg (233.43 ± 7.63% over aCSF baseline; t(1,3) = 28.51; p < 0.05) and the 3xTg-AD (226.45 ± 6.4% over aCSF baseline; t(1,3) = 38.57; p < 0.05) mice. These results suggest that RyR-mediated calcium stores contribute differentially to synaptic plasticity in NonTg and 3xTg-AD mice.
Because caffeine also blocks the inhibitory presynaptic A1R, we examined synaptic properties in the presence of DPCPX, a selective A1R antagonist to distinguish between A1R effects and RyR effects (Fig. 9). DPCPX resulted in a significant and similar increase in the I/O function for both the NonTg (n = 7; t(1,6) = 4.62; p < 0.05) and 3xTg-AD (n = 4; t(1,3) = 6.19; p < 0.05) mice. DPCPX did not change excitability properties of presynaptic fibers in NonTg or 3xTg-AD mice (FV amplitude vs fEPSP slope: one-way ANOVA, F(1,6) = 2.3 for NonTg and F(1,3) = 3.6 for 3xTg-AD; p > 0.05) (data not shown). DPCPX also did not significantly change PPF properties in NonTg (n = 8) or in 3xTg-AD (n = 9) mice (one-way ANOVA, F(3,16) = 1.16; p > 0.05). Treatment with DPCPX similarly increased the baseline fEPSP slope in both NonTg (n = 4; 71.47 ± 3.6% over aCSF baseline; t(1,3) = 16.89; p < 0.05) and 3xTg-AD (n = 4; 84.26 ± 3.6% over aCSF baseline; t(1,3) = 21.68; p < 0.05) mice. A1R antagonism resulted in comparable expression of LTP when compared with control aCSF baseline (248.88 ± 5.3% for NonTg and 235.69 ± 6.1% for 3xTg-AD; t(1,6) = 2.25; p > 0.05) and baseline in DPCPX (176.64 ± 4.1% in NonTg and 172.82 ± 4.7% in 3xTg-AD; t(1,6) = 1.71; p > 0.05) in both NonTg and 3xTg-AD mice.
Figure 9.

Adenosine A1 receptors contribute comparably to synaptic transmission and plasticity in NonTg and 3xTg-AD mice. A–C, Top, Representative I/O traces show changes in fEPSP amplitude with increasing stimulus intensity for NonTg mice (A, black) and for 3xTg-AD mice (B, gray) before and after treatment with 1 μm DPCPX. Bottom, I/O function shows changes in fEPSP slope with increasing stimulus intensity (0–225 μA) for NonTg mice before (filled black circles; n = 7) and after (open black circles) (A), for 3xTg-AD mice before (filled gray squares; n = 4) and after (open gray squares) (B), and comparing NonTg (open black circles) and 3xTg-AD (open gray squares) mice after treatment with 1 μm DPCPX (C). D–F, PPF was measured at an interstimulus interval of 50 ms. Top, Representative PPF traces from NonTg (D, black) and 3xTg-AD (E, gray) mice before (1) and after (2) and comparing NonTg (black) and 3xTg-AD (gray) mice after treatment with 1 μm DPCPX (F). Bottom, Bar graphs show paired pulse ratio for NonTg (n = 8) (D) and 3xTg-AD (n = 9) (E) mice before (black and dark gray, respectively) and after (white and light gray, respectively) and comparing NonTg (white) and 3xTg-AD (light gray) mice after treatment with 1 μm DPCPX (F). G, Graph shows changes in baseline fEPSP slope from NonTg (black circles; n = 4) and 3xTg-AD (gray squares; n = 4) mice after treatment with 1 μm DPCPX. H, Top, Representative pretetanus fEPSP traces before (1) and after (2) treatment with DPCPX and posttetanus fEPSP traces (3) with DPCPX from NonTg (black) and 3xTg-AD (gray) mice. Bottom, Graph shows averaged time course of LTP with predrug baseline and pretetanic and posttetanic baseline with DPCPX treatment from NonTg (black circles) and 3xTg-AD (gray squares) mice. The black arrow indicates the time of tetanus. Error bars represent ±SEM, p > 0.05, and n denotes the number of slices.
To further parse the distinctive functions of the A1R and RyR in the NonTg and 3xTg-AD mice, we compared the effects of caffeine (5 mm) and DPCPX (1 μm) within each mouse group (supplemental Fig. 1, available at www.jneurosci.org as supplemental material). In the NonTg mice, caffeine and DPCPX generated similar responses in the I/O curves (t(1,10) = 0.19; p > 0.05) and PPF (t(1,10) = 1.96; p > 0.05). In 3xTg-AD mice, however, there were significant differences between the effects of caffeine and DPCPX on these synaptic functions. The I/O function was decreased by caffeine but not with DPCPX (t(1,8) = 2.66; p < 0.05). This discrepant effect may be ascribed to increased coupling efficiency between RyR and postsynaptic hyperpolarizing Ca2+-activated K+ (SK) channels (Stutzmann et al., 2006, 2007) resulting in decreased membrane excitability. Furthermore, PPF was decreased to a much greater extent in caffeine than in DPCPX (t(1,16) = 9.13; p < 0.05), indicating that RyR-mediated ER calcium release plays a prominent role in basal synaptic transmission and presynaptic neurotransmitter release mechanisms in 3xTg-AD mice but is not a dominant modulator of these mechanisms in the NonTg mice. The increase in baseline and LTP expression was much greater with caffeine than with DPCPX in both NonTg (t(1,6) = 17.12; p < 0.05) and 3xTg-AD (t(1,6) = 17.39; p < 0.05) mice. The greater increase in baseline and LTP with caffeine could reflect an additive effect of RyR activation as well as A1R inhibition and is consistent with increased probability of neurotransmitter release as indicated by decreased PPF with caffeine.
Discussion
Mutant PS1-expressing neurons generate markedly enhanced ER calcium responses from young mice (Stutzmann et al., 2004, 2006), yet existing studies show that synaptic physiology and plasticity appear normal until later Aβ deposition (Oddo et al., 2003; Volianskis et al., 2008). These observations are inconsistent with the tk;4known calcium requirements for electrochemical neurotransmission. Tight regulation of calcium signaling is a fundamental component of synaptic transmission, modulating both presynaptic and postsynaptic activity as well as complex processes such as plasticity (Nakamura et al., 2000; Lisman, 2003, Bardo et al., 2006). The ER calcium stores are intimately involved in these events while also modifying other calcium sources (Nishiyama et al., 2000; Bardo et al., 2006). For example, LTP at the CA3–CA1 synapse is initiated by calcium entry through the NMDA receptor, yet total calcium is amplified by calcium-induced calcium release) between and within the IP3R and RyR channels (Bliss and Collingridge, 1993; Malenka and Bear, 2004). Given the profound ER calcium alterations in 3xTg-AD mice at young ages, we hypothesize that synaptic transmission and plasticity alterations are occurring but are masked by compensatory mechanisms. We observed seemingly normal synaptic transmission in the young 3xTg-AD mice, yet, on additional investigation, striking differences involving RyR-sensitive calcium stores become apparent. RyR-evoked calcium release may not play a significant role in basal synaptic transmission in NonTg mice, yet this calcium source aberrantly modifies both presynaptic and postsynaptic transmission in 3xTg-AD mice.
Subcellular patterns of RyR-evoked calcium release
The contribution of ER calcium to synaptic transmission varies according to the subcellular localization of RyR and IP3R channels. In CA1 pyramidal neurons, the soma and dendritic shafts express both RyRs and IP3Rs, whereas distal processes and spine heads express a greater proportion of the RyR (Fitzjohn and Collingridge, 2002; Hertle and Yeckel, 2007; van de Vrede et al., 2007). Thus, the RyR is well positioned for modulating incoming synaptic activity.
Before this study, ER calcium release within 3xTg-AD spine heads had yet to be measured and could have been normal, despite demonstrated differences in the soma and proximal dendrites (Stutzmann et al., 2006, 2007). This could account for the apparent similarity between the NonTg and 3xTg-AD synaptic functions. Here we demonstrate that RyR activation results in significant calcium increases within spines and distal dendrites as well as the soma in 3xTg-AD mice. The ER extends into ∼50% of spine heads, and there can modify synaptic signaling through increased glutamate receptor trafficking, CaMKII activation, modification of spine head geometry, and altering signal integration between neighboring spines (Spacek and Harris, 1997; Matsuzaki et al., 2004; Korkotian and Segal, 2007; Jones et al., 2008). Thus, the enhanced RyR-mediated calcium release in synapse-dense regions of 3xTg-AD CA1 neurons may exert distinct modulatory effects on synaptic signals that are not present in the NonTg neurons.
Selective increase in RyR2 mRNA expression in 3xTg-AD hippocampus
We had shown previously that the 3xTg-AD mice have increased RyR protein expression levels in whole-brain extracts relative to age-matched NonTg mice (Stutzmann et al., 2006). Here, we further investigated the three RyR isoforms using quantitative PCR methods and found marked increases in the RyR2 isoform in the 3xTg-AD hippocampus (more than fivefold), with relatively little differences in the RyR1 and RyR3 isoforms. In adult rats, all three RyR isoforms are found in the hippocampus, albeit at relatively different levels (Hertle and Yeckel, 2007). Among them, RyR2 is most heavily expressed in the hippocampus (Mori et al., 2000), and, interestingly, selective RyR2 knockdown has been shown to impair hippocampal-dependent learning and memory (Galeotti et al., 2008). In the 3xTg-AD mice, the RyR2 upregulation could primarily account for the increased ER calcium release within the hippocampus, although the mechanism for the specific RyR2 increase is unknown.
Uncovering a deviant synaptic signaling role of ER calcium in 3xTg-AD mice: presynaptic and postsynaptic effects
In NonTg mice, blocking the RyR produced no changes in PPF, which suggests little RyR-mediated calcium involvement in presynaptic vesicle release. However, in the 3xTg-AD mice, dantrolene increased PPF, suggesting an inhibitory effect of presynaptic RyR-evoked calcium release. Likewise, dantrolene did not affect the I/O function in NonTg mice yet significantly increased the I/O function in the 3xTg-AD mice, particularly at higher stimulation intensities. This is consistent with RyR-evoked calcium release activating postsynaptic calcium-activated SK channels (Stutzmann et al., 2006; Brennan et al., 2008). In parallel with the effects of dantrolene, blocking the SK channel had little effect on the I/O function in NonTg mice yet increased the I/O function in the 3xTg-AD mice at higher stimulus intensities.
Stimulating the RyR with caffeine generated different yet complementary patterns. Caffeine, in addition to activating the RyR, also blocks the inhibitory A1R and thereby increases neurotransmitter release via presynaptic disinhibition (Martín and Buño, 2003; Gundlfinger et al., 2007; Wang, 2007). Consistent with this, caffeine decreased PPF in both mouse strains, although the decrement was significantly greater in 3xTg-AD mice. This may reflect the effects of caffeine on the presynaptic A1R in both mouse strains but with additional RyR recruitment in the 3xTg-AD neurons. To dissociate A1R effects from RyR effects, we used the A1R antagonist (DPCPX) and found similar responses between NonTg and 3xTg-AD neurons. The spontaneous EPSP data also suggest that RyR-mediated calcium release influences both presynaptic and postsynaptic events in the 3xTg-AD mice yet has a significantly smaller role in NonTg mice. RyR activation increases both the frequency and amplitude of spontaneous EPSPs in the 3xTg-AD mice only, consistent with presynaptic and postsynaptic effects, respectively.
Differences in ER calcium contribution to LTP
In NonTg mice, the baseline evoked fEPSP was not significantly affected by dantrolene, which is consistent with the patterns of synaptic activity measured by PPF and I/O functions. Interestingly, the 3xTg-AD neurons exhibit a decrease in the dantrolene baseline compared with the aCSF baseline, presumably attributable to decreased presynaptic neurotransmitter release. This demonstrates opposing roles of RyR-mediated calcium release between the NonTg and 3xTg-AD mice. When using the dantrolene baseline as a reference for degree of plasticity, LTP decreased in the NonTg and 3xTg-AD mice, consistent with existing literature (Obenaus et al., 1989; Alford et al., 1993; Emptage et al., 1999). However, these measurements reflect an fEPSP baseline affected by drug application, so we additionally calculated LTP magnitude using the true control baseline. Now, marked differences between the mouse lines arise. When comparing against control fEPSP baseline, there is a modest reduction in LTP expression in the NonTg mice when RyRs are blocked, yet there is a shift from LTP to LTD in the 3xTg-AD mice. Basal synaptic transmission properties are differentially regulated by RyR between the NonTg and 3xTg-AD mice; therefore, subsequent interpretation of plasticity mechanisms relative to drug baselines will also need to be considered differently.
With caffeine, both NonTg and 3xTg-AD mice exhibited a striking increase in drug fEPSP baseline over predrug fEPSP baseline, which likely reflects increased neurotransmitter release via A1R antagonism. Using the caffeine baseline, there was no additional LTP increase in the NonTg mice, possibly resulting from depletion of presynaptic neurotransmitter pools. By reducing the stimulus intensity to return the fEPSP amplitude in caffeine back to original baseline levels, the likelihood of depletion becomes more evident. Here, short-term potentiation is seen but long-term effects are not sustained. In contrast, the 3xTg-AD mice generated considerably greater LTP in caffeine, demonstrating a large reserve for LTP enhancement. These distinctions exposed by RyR manipulation further demonstrate opposing contributions of RyR-sensitive calcium release to plasticity expression between the NonTg and 3xTg-AD mice.
Differential responses to high and low stimulus intensities reflect distinct presynaptic and postsynaptic RyR effects in 3xTg-AD mice
In the 3xTg-AD mice, RyR blockade appears to exert conflicting effects on synaptic transmission. Dantrolene reduced the baseline field potential slope recorded before the LTP tetanus yet increased the slope of the I/O functions and increased the PPF ratio. These discrepancies can likely be explained by stimulus strength differences differentially affecting presynaptic and postsynaptic functions. For LTP baseline and PPF recordings, relatively low stimulus intensities (∼20–25 μA) were used. PPF is inversely correlated to presynaptic calcium entry, so when blocking RyR-calcium release in the terminal, vesicle release/synaptic strength decreases and PPF increases. This is consistent with the decreased pre-LTP baseline measurements in dantrolene. However, with the higher stimulus intensities used in the I/O functions, the postsynaptic recruitment of inhibitory RyR-activated SK channels overcomes the presynaptic effects. The coupling or efficiency between RyR-mediated calcium release and the SK channel is significantly greater in the 3xTg-AD mice, such that the same ER calcium response generates a larger outward current in the 3xTg-AD neurons than in NonTg neurons (Stutzmann et al., 2006, 2007). At higher stimulus intensities, blocking this inhibitory influence therefore results in a greater evoked field potential response. In support of these observations, apamin, which selectively blocks the SK channel, increased the I/O functions in the 3xTg-AD mice but had no effect in the NonTg mice.
The dissociation between high and low stimulus intensity effects in the 3xTg-AD mice was further verified by repeating the LTP baseline and PPF protocols using higher stimulus intensities that generated near-maximal fEPSPs. There was a significant increase in the fEPSP slope with dantrolene and no change in the PPF, demonstrating a net inhibitory postsynaptic effect of RyR-evoked calcium release on synaptic function. In addition, the excitatory effects of dantrolene seen at higher stimulus intensities are reversed at low and threshold stimulus intensities; here, dantrolene suppresses fEPSPs.
Despite the profound differences in ER calcium release in distal dendrites and spine heads, synaptic function does not appear disrupted in the young 3xTg-AD mice. This suggests that neurons are maintaining a “normal” state, but, in actuality, compensatory mechanisms are likely being recruited to maintain homeostasis. In summary, there are subtle yet profound calcium-mediated alterations in young 3xTg-AD mice that affect synaptic transmission and plasticity mechanisms in the short term and may contribute to more extensive pathology in synaptic function and cognitive deficits in the later stages of AD.
Footnotes
We thank Dr. Thanos Tzounopoulos for assistance and guidance with the plasticity experiments.
References
- Alford S, Frenguelli BG, Schofield JG, Collingridge GL. Characterization of Ca2+ signals induced in hippocampal CA1 neurons by the synaptic activation of NMDA receptors. J Physiol. 1993;469:693–716. doi: 10.1113/jphysiol.1993.sp019838. [DOI] [PMC free article] [PubMed] [Google Scholar]
- Bardo S, Cavazzini MG, Emptage N. The role of endoplasmic reticulum calcium stores in the plasticity of central neurons. Trends Pharmacol Sci. 2006;27:78–84. doi: 10.1016/j.tips.2005.12.008. [DOI] [PubMed] [Google Scholar]
- Berridge MJ. Neuronal calcium signaling. Neuron. 1998;21:13–26. doi: 10.1016/s0896-6273(00)80510-3. [DOI] [PubMed] [Google Scholar]
- Bliss TV, Collingridge GL. A synaptic model of memory: LTP in the hippocampus. Nature. 1993;361:31–39. doi: 10.1038/361031a0. [DOI] [PubMed] [Google Scholar]
- Bouchard R, Pattarini R, Geiger JD. Presence and functional significance of presynaptic ryanodine receptors. Prog Neurobiol. 2003;69:391–418. doi: 10.1016/s0301-0082(03)00053-4. [DOI] [PubMed] [Google Scholar]
- Brennan AR, Dolinsky B, Vu MA, Stanley M, Yeckel MF, Arnsten AF. Blockade of IP3-mediated SK channel signaling in the rat medial prefrontal cortex improves spatial working memory. Learn Mem. 2008;15:93–96. doi: 10.1101/lm.767408. [DOI] [PMC free article] [PubMed] [Google Scholar]
- Carter AG, Vogt KE, Foster KA, Regehr WG. Assessing the role of calcium-induced calcium release in short-term presynaptic plasticity at excitatory central synapses. J Neurosci. 2002;22:21–28. doi: 10.1523/JNEUROSCI.22-01-00021.2002. [DOI] [PMC free article] [PubMed] [Google Scholar]
- Cheung KH, Shineman D, Müller M, Cárdenas C, Mei L, Yang J, Tomita T, Iwatsubo T, Lee VM, Foskett JK. Mechanism of Ca2+ disruption in Alzheimer's disease by presenilin regulation of InsP3 receptor channel gating. Neuron. 2008;58:871–883. doi: 10.1016/j.neuron.2008.04.015. [DOI] [PMC free article] [PubMed] [Google Scholar]
- Emptage N, Bliss TV, Fine A. Single synaptic events evoke NMDA receptor-mediated release of calcium from internal stores in hippocampal dendritic spines. Neuron. 1999;22:115–124. doi: 10.1016/s0896-6273(00)80683-2. [DOI] [PubMed] [Google Scholar]
- Fitzjohn SM, Collingridge GL. Calcium stores and synaptic plasticity. Cell Calcium. 2002;32:405–411. doi: 10.1016/s0143416002001999. [DOI] [PubMed] [Google Scholar]
- Galeotti N, Quattrone A, Vivoli E, Norcini M, Bartolini A, Ghelardini C. Different involvement of type 1, 2, and 3 ryanodine receptors in memory processes. Learn Mem. 2008;15:315–323. doi: 10.1101/lm.929008. [DOI] [PMC free article] [PubMed] [Google Scholar]
- Gundlfinger A, Bischofberger J, Johenning FW, Torvinen M, Schmitz D, Breustedt J. Adenosine modulates transmission at the hippocampal mossy fiber synapse via direct inhibition of presynaptic calcium channels. J Physiol. 2007;582:263–277. doi: 10.1113/jphysiol.2007.132613. [DOI] [PMC free article] [PubMed] [Google Scholar]
- Guo Q, Furukawa K, Sopher BL, Pham DG, Xie J, Robinson N, Martin GM, Mattson MP. Alzheimer's PS-1 mutation perturbs calcium homeostasis and sensitizes PC12 cells to death induced by amyloid beta-peptide. Neuroreport. 1996;8:379–383. doi: 10.1097/00001756-199612200-00074. [DOI] [PubMed] [Google Scholar]
- Hagenston AM, Fitzpatrick JS, Yeckel MF. mGluR-mediated calcium waves that invade the soma regulate firing in layer V medial prefrontal cortical pyramidal neurons. Cereb Cortex. 2008;18:407–423. doi: 10.1093/cercor/bhm075. [DOI] [PMC free article] [PubMed] [Google Scholar]
- Hertle DN, Yeckel MF. Distribution of inositol-1, 4, 5-trisphosphate receptor isotypes and ryanodine receptor isotypes during maturation of the rat hippocampus. Neuroscience. 2007;150:625–638. doi: 10.1016/j.neuroscience.2007.09.058. [DOI] [PMC free article] [PubMed] [Google Scholar]
- Ito E, Oka K, Etcheberrigaray R, Nelson TJ, McPhie DL, Tofel-Grehl B, Gibson GE, Alkon DL. Internal Ca2+ mobilization is altered in fibroblasts from patients with Alzheimer's disease. Proc Natl Acad Sci U S A. 1994;91:534–538. doi: 10.1073/pnas.91.2.534. [DOI] [PMC free article] [PubMed] [Google Scholar]
- Jones VC, McKeown L, Verkhratsky A, Jones OT. LV-pIN-KDEL: a novel lentiviral vector demonstrates the morphology, dynamics and continuity of the endoplasmic reticulum in live neurons. BMC Neurosci. 2008;9:10. doi: 10.1186/1471-2202-9-10. [DOI] [PMC free article] [PubMed] [Google Scholar]
- Korkotian E, Segal M. Morphological constraints on calcium dependent glutamate receptor trafficking into individual dendritic spine. Cell Calcium. 2007;42:41–57. doi: 10.1016/j.ceca.2006.11.006. [DOI] [PubMed] [Google Scholar]
- LaFerla FM. Calcium dyshomeostasis and intracellular signaling in Alzheimer's disease. Nat Rev Neurosci. 2002;3:862–872. doi: 10.1038/nrn960. [DOI] [PubMed] [Google Scholar]
- Leissring MA, Paul BA, Parker I, Cotman CW, LaFerla FM. Alzheimer's presenilin-1 mutation potentiates inositol 1,4,5-trisphosphate-mediated calcium signaling in Xenopus oocytes. J Neurochem. 1999;72:1061–1068. doi: 10.1046/j.1471-4159.1999.0721061.x. [DOI] [PubMed] [Google Scholar]
- Lisman J. Long-term potentiation: outstanding questions and attempted synthesis. Philos Trans R Soc Lond B Biol Sci. 2003;358:829–842. doi: 10.1098/rstb.2002.1242. [DOI] [PMC free article] [PubMed] [Google Scholar]
- Malenka RC, Bear MF. LTP and LTD: an embarrassment of riches. Neuron. 2004;44:5–21. doi: 10.1016/j.neuron.2004.09.012. [DOI] [PubMed] [Google Scholar]
- Martín ED, Buño W. Caffeine-mediated presynaptic long-term potentiation in hippocampal CA1 pyramidal neurons. J Neurophysiol. 2003;89:3029–3038. doi: 10.1152/jn.00601.2002. [DOI] [PubMed] [Google Scholar]
- Matsuzaki M, Honkura N, Ellis-Davies GC, Kasai H. Structural basis of long-term potentiation in single dendritic spines. Nature. 2004;429:761–766. doi: 10.1038/nature02617. [DOI] [PMC free article] [PubMed] [Google Scholar]
- Mattson MP, Chan SL. Neuronal and glial calcium signaling in Alzheimer's disease. Cell Calcium. 2003;34:385–397. doi: 10.1016/s0143-4160(03)00128-3. [DOI] [PubMed] [Google Scholar]
- Megías M, Emri Z, Freund TF, Gulyás AI. Total number and distribution of inhibitory and excitatory synapses on hippocampal CA1 pyramidal cells. Neuroscience. 2001;102:527–540. doi: 10.1016/s0306-4522(00)00496-6. [DOI] [PubMed] [Google Scholar]
- Mellström B, Naranjo JR. Mechanisms of Ca2+-dependent transcription. Curr Opin Neurobiol. 2001;11:312–319. doi: 10.1016/s0959-4388(00)00213-0. [DOI] [PubMed] [Google Scholar]
- Mori F, Fukaya M, Abe H, Wakabayashi K, Watanabe M. Developmental changes in expression of the three ryanodine receptor mRNAs in the mouse brain. Neurosci Lett. 2000;285:57–60. doi: 10.1016/s0304-3940(00)01046-6. [DOI] [PubMed] [Google Scholar]
- Nakamura T, Nakamura K, Lasser-Ross N, Barbara JG, Sandler VM, Ross WN. Inositol 1,4,5-trisphosphate (IP3)-mediated Ca2+ release evoked by metabotropic agonists and backpropagating action potentials in hippocampal CA1 pyramidal neurons. J Neurosci. 2000;20:8365–8376. doi: 10.1523/JNEUROSCI.20-22-08365.2000. [DOI] [PMC free article] [PubMed] [Google Scholar]
- Nelson O, Tu H, Lei T, Bentahir M, de Strooper B, Bezprozvanny I. Familial Alzheimer's disease-linked mutations specifically disrupt Ca2+ leak function of presenilin 1. J Clin Invest. 2007;117:1230–1239. doi: 10.1172/JCI30447. [DOI] [PMC free article] [PubMed] [Google Scholar]
- Nishiyama M, Hong K, Mikoshiba K, Poo MM, Kato K. Calcium stores regulate the polarity and input specificity of synaptic modification. Nature. 2000;408:584–588. doi: 10.1038/35046067. [DOI] [PubMed] [Google Scholar]
- Obenaus A, Mody I, Baimbridge KG. Dantrolene-Na (Dantrium) blocks induction of long-term potentiation in hippocampal slices. Neurosci Lett. 1989;98:172–178. doi: 10.1016/0304-3940(89)90505-3. [DOI] [PubMed] [Google Scholar]
- Ochiishi T, Chen L, Yukawa A, Saitoh Y, Sekino Y, Arai T, Nakata H, Miyamoto H. Cellular localization of adenosine A1 receptors in rat forebrain: Immunohistochemical analysis using adenosine A1 receptor-specific monoclonal antibody. J Comp Neurol. 1999;411:301–316. [PubMed] [Google Scholar]
- Oddo S, Caccamo A, Shepherd JD, Murphy MP, Golde TE, Kayed R, Metherate R, Mattson MP, Akbari Y, LaFerla FM. Triple-transgenic model of Alzheimer's disease with plaques and tangles: intracellular Aβ and synaptic dysfunction. Neuron. 2003;39:409–421. doi: 10.1016/s0896-6273(03)00434-3. [DOI] [PubMed] [Google Scholar]
- Park CS, Elgersma Y, Grant SG, Morrison JH. Alpha-isoform of calcium-calmodulin-dependent protein kinase II and postsynaptic density protein 95 differentially regulate synaptic expression of NR2A- and NR2B-containing N-methyl-d-aspartate receptors in hippocampus. Neuroscience. 2008;151:43–55. doi: 10.1016/j.neuroscience.2007.09.075. [DOI] [PMC free article] [PubMed] [Google Scholar]
- Park MK, Choi YM, Kang YK, Petersen OH. The endoplasmic reticulum as an integrator of multiple dendritic events. Neuroscientist. 2008;14:68–77. doi: 10.1177/1073858407305691. [DOI] [PubMed] [Google Scholar]
- Ross WN, Nakamura T, Watanabe S, Larkum M, Lasser-Ross N. Synaptically activated Ca2+ release from internal stores in CNS neurons. Cell Mol Neurobiol. 2005;25:283–295. doi: 10.1007/s10571-005-3060-0. [DOI] [PMC free article] [PubMed] [Google Scholar]
- Rowan MJ, Klyubin I, Cullen WK, Anwyl R. Synaptic plasticity in animal models of early Alzheimer's disease. Philos Trans R Soc Lond B Biol Sci. 2003;358:821–828. doi: 10.1098/rstb.2002.1240. [DOI] [PMC free article] [PubMed] [Google Scholar]
- Rybalchenko V, Hwang SY, Rybalchenko N, Koulen P. The cytosolic N-terminus of presenilin-1 potentiates mouse ryanodine receptor single channel activity. Int J Biochem Cell Biol. 2008;40:84–97. doi: 10.1016/j.biocel.2007.06.023. [DOI] [PubMed] [Google Scholar]
- Selkoe DJ. Soluble oligomers of the amyloid beta-protein impair synaptic plasticity and behavior. Behav Brain Res. 2008;192:106–113. doi: 10.1016/j.bbr.2008.02.016. [DOI] [PMC free article] [PubMed] [Google Scholar]
- Shankar GM, Li S, Mehta TH, Garcia-Munoz A, Shepardson NE, Smith I, Brett FM, Farrell MA, Rowan MJ, Lemere CA, Regan CM, Walsh DM, Sabatini BL, Selkoe DJ. Amyloid-beta protein dimers isolated directly from Alzheimer's brains impair synaptic plasticity and memory. Nat Med. 2008;14:837–842. doi: 10.1038/nm1782. [DOI] [PMC free article] [PubMed] [Google Scholar]
- Shelbourne P, Coote E, Dadak S, Cobb SR. Normal electrical properties of hippocampal neurons modeling early Huntington disease pathogenesis. Brain Res. 2007;1139:226–234. doi: 10.1016/j.brainres.2006.12.091. [DOI] [PubMed] [Google Scholar]
- Smith IF, Hitt B, Green KN, Oddo S, LaFerla FM. Enhanced caffeine-induced Ca2+ release in the 3xTg-AD mouse model of Alzheimer's disease. J Neurochem. 2005;94:1711–1718. doi: 10.1111/j.1471-4159.2005.03332.x. [DOI] [PubMed] [Google Scholar]
- Spacek J, Harris KM. Three dimensional organization of smooth endoplasmic reticulum in hippocampal CA1 dendrites and dendritic spines of immature and mature rat. J Neurosci. 1997;17:190–203. doi: 10.1523/JNEUROSCI.17-01-00190.1997. [DOI] [PMC free article] [PubMed] [Google Scholar]
- Stutzmann GE. The pathogenesis of Alzheimer's disease is it a lifelong “calciumopathy”? Neuroscientist. 2007;13:546–559. doi: 10.1177/1073858407299730. [DOI] [PubMed] [Google Scholar]
- Stutzmann GE, Marek GJ, Aghajanian GK. Adenosine preferentially suppresses serotonin2A-receptor enhanced EPSC's in layer V neurons of the medial prefrontal cortex. Neuroscience. 2001;105:55–69. doi: 10.1016/s0306-4522(01)00170-1. [DOI] [PubMed] [Google Scholar]
- Stutzmann GE, LaFerla FM, Parker I. Ca2+ signaling in mouse cortical neurons studied by two-photon imaging and photoreleased inositol triphosphate. J Neurosci. 2003;23:758–765. doi: 10.1523/JNEUROSCI.23-03-00758.2003. [DOI] [PMC free article] [PubMed] [Google Scholar]
- Stutzmann GE, Caccamo A, LaFerla FM, Parker I. Dysregulated IP3 signaling in cortical neurons of knock-in mice expressing an Alzheimer's-linked mutation in presenilin1 results in exaggerated Ca2+ signals and altered membrane excitability. J Neurosci. 2004;24:508–513. doi: 10.1523/JNEUROSCI.4386-03.2004. [DOI] [PMC free article] [PubMed] [Google Scholar]
- Stutzmann GE, Smith I, Caccamo A, Oddo S, Laferla FM, Parker I. Enhanced ryanodine receptor recruitment contributes to Ca2+ disruptions in young, adult, and aged Alzheimer's disease mice. J Neurosci. 2006;26:5180–5189. doi: 10.1523/JNEUROSCI.0739-06.2006. [DOI] [PMC free article] [PubMed] [Google Scholar]
- Stutzmann GE, Smith I, Caccamo A, Oddo S, Parker I, Laferla FM. Enhanced ryanodine-mediated calcium release in mutant PS1-expressing Alzheimer's mouse models. Ann N Y Acad Sci. 2007;1097:265–277. doi: 10.1196/annals.1379.025. [DOI] [PubMed] [Google Scholar]
- Townsend M, Shankar GM, Mehta T, Walsh DM, Selkoe DJ. Effects of secreted oligomers of amyloid {beta}-protein on hippocampal synaptic plasticity: a potent role for trimers. J Physiol. 2006;572:477–492. doi: 10.1113/jphysiol.2005.103754. [DOI] [PMC free article] [PubMed] [Google Scholar]
- Tu H, Nelson O, Bezprozvanny A, Wang Z, Lee SF, Hao YH, Serneels L, De Strooper B, Yu G, Bezprozvanny I. Presenilins form ER Ca2+ leak channels, a function disrupted by familial Alzheimer's disease-linked mutations. Cell. 2006;126:981–993. doi: 10.1016/j.cell.2006.06.059. [DOI] [PMC free article] [PubMed] [Google Scholar]
- van de Vrede Y, Fossier P, Baux G, Joels M, Chameau P. Control of IsAHP in mouse hippocampus CA1 pyramidal neurons by RyR3-mediated calcium-induced calcium release. Pflugers Arch. 2007;455:297–308. doi: 10.1007/s00424-007-0277-4. [DOI] [PubMed] [Google Scholar]
- Verkhratsky A. The endoplasmic reticulum and neuronal calcium signaling. Cell Calcium. 2002;32:393–404. doi: 10.1016/s0143416002001896. [DOI] [PubMed] [Google Scholar]
- Volianskis A, Kostner R, Molgaard M, Hass S, Jensen MS. Episodic memory deficits are not related to altered glutamatergic synaptic transmission and plasticity in the CA1 hippocampus of the APPswe/PS1DeltaE9-deleted transgenic mice model of beta-amyloidogenesis. Neurobiol Aging. 2008 doi: 10.1016/j.neurobiolaging.2008.08.005. [DOI] [PubMed] [Google Scholar]
- Wang SJ. Caffeine facilitation of glutamate release from rat cerebral cortex nerve terminals (synaptosomes) through activation protein kinase C pathway: an interaction with presynaptic adenosine A1 receptors. Synapse. 2007;61:401–411. doi: 10.1002/syn.20384. [DOI] [PubMed] [Google Scholar]
- Watanabe S, Hong M, Lasser-Ross N, Ross WN. Modulation of calcium wave propagation in the dendrites and to the soma of rat hippocampal pyramidal neurons. J Physiol. 2006;575:455–468. doi: 10.1113/jphysiol.2006.114231. [DOI] [PMC free article] [PubMed] [Google Scholar]