Abstract
Because of its central position in the ascending auditory pathway, its large number of converging auditory brainstem inputs, and its fundamental role as a relay to auditory cortex and midbrain superior colliculus, the mammalian inferior colliculus (IC) is regarded pivotal for the integration of acoustic spectral–temporal cues to mediate sound-evoked behavior. However, detailed quantitative analyses of spectrotemporal neural responses are scarce. Moreover, most studies have been performed in anesthetized preparations, and it is unclear how to extrapolate findings to awake and behaving animals. Here, we characterize spectrotemporal receptive fields (STRFs) of single units in alert monkey IC by using a variety of broadband sounds with rippled amplitude spectra. We measured the response sensitivity to the ripple parameters density, Ω (cycles/octave), velocity, w (hertz), and direction selectivity, D. We observed a variety of dynamic STRFs, with a strong preference for low ripple densities, and a generally weak direction selectivity. Most cells preferred dynamic rippled stimuli above pure amplitude modulated noise (i.e., Ω = 0). Half of the cells could be characterized by good spectral–temporal separability, in which the ripple transfer function can be written as T(w, Ω) = F(w) × G(Ω). Inseparability could be attributed to a difference in responses to up and downward direction with respect to both amplitude and temporal phase. We tested linearity of IC neurons by using the STRF to predict neural responses to natural stimuli and broadband noise and discuss our results in the light of findings obtained from auditory cortex.
Introduction
The inferior colliculus (IC) is at the core of the ascending auditory pathway, receiving converging inputs from all auditory brainstem nuclei, and is thought to encode the spectral and temporal features of sounds, and of sound locations (Knudsen and Konishi, 1978; Schreiner and Langner, 1997; Groh et al., 2003; Zwiers et al., 2004; Ehret and Schreiner, 2005; Palmer and Kuwada, 2005; Rees and Langner, 2005). It constitutes an obligatory relay between auditory brainstem and cortex and with the midbrain superior colliculus (SC), which is crucial for rapid orienting (Robinson, 1972; Sparks, 1986).
IC studies that used sounds to characterize either spectral (tones, narrow-band noise) or temporal (amplitude and frequency modulations) tuning properties demonstrated a tonotopic organization by frequency-band laminae (Schreiner and Langner, 1997), as well as tuning to amplitude-modulated (AM) sounds within a periodicity map (Langner et al., 2002). However, to understand neural processing of arbitrary sounds, including natural stimuli, such separate characterizations may not suffice because they lack the ability to describe sensitivity to more complex spectrotemporal patterns, such as frequency sweeps.
Stimuli characterized by spectrotemporal modulations such as dynamic ripples (Kowalski et al., 1996a,b; Depireux et al., 2001; Miller et al., 2002; Atencio et al., 2008) and random chords (deCharms et al., 1998; Schnupp et al., 2001; Linden et al., 2003; Garcia-Lazaro et al., 2006) would be more appropriate. Several studies in primary auditory cortex (A1) used such stimuli to derive the spectrotemporal receptive field (STRF) of a cell and addressed spectral–temporal separability and linear response predictability to naturalistic sounds (i.e., the prediction of neural responses by convolution of the stimuli with the STRF). The majority of cortical neurons had separable STRFs, whereas a significant minority was reported to have inseparable responses (Depireux et al., 2001; Linden et al., 2003). Many cortical neurons were found to be approximately linear (Kowalski et al., 1996b; deCharms et al., 1998; Schnupp et al., 2001). By using spectrotemporally dynamic stimuli with naturalistic higher-order correlations, nonlinear response characteristics could be derived (Atencio et al., 2008).
This study addresses spectrotemporal response properties, including separability and linearity in the IC of alert monkeys. Recent IC studies used spectrotemporal stimuli (Escabi and Schreiner, 2002; Andoni et al., 2007; Lesica and Grothe, 2008), all showing a degree of linearity as found in A1. However, these studies were in either anesthetized preparations or bat, which has an auditory system specialized for processing echolocation calls and thus is different from the primate auditory system. Anesthesia strongly affects neural response properties, including inhibitory mechanisms (Populin, 2005), and reduced inhibition was shown to affect spectral–temporal separability (Andoni et al., 2007). It is therefore unclear how to extrapolate findings from anesthetized preparations to the awake animal. Moreover, a comparison of STRF properties in IC, obtained in the current study, with those in A1, as described in literature, will elucidate IC-to-A1 processing of spectrotemporal features of auditory input. For instance, the type of inseparability observed in A1 is thought to result from separability at subcortical levels (Simon et al., 2007).
To examine spectrotemporal response characteristics in IC, we used a wide range of single ripples (Depireux et al., 2001). This allowed a direct assessment of the spectrotemporal transfer function of a cell, from which various response parameters including separability measures could be derived. The STRF could be obtained from the transfer function, and the extent of linearity could be examined by comparing linear predictions with actual responses to natural stimuli. Although ripples share spectrotemporal properties of natural sounds (spectrotemporal envelopes of which can be described as superpositions of ripples), the ripples lack statistical properties of natural sounds that auditory neurons might be sensitive to such as higher-order correlations (Atencio et al., 2008) and 1/f dynamics (Garcia-Lazaro et al., 2006). As a result, nonlinearities cannot be specified using ripples. Finally, a motive for using ripples is its straightforward parameterization, which makes them suitable for comparative behavioral studies in macaque and man (Chi et al., 1999) and for functional neuroimaging (Langers et al., 2003).
Materials and Methods
Neurophysiological recordings from single units were performed in the IC of two adult male rhesus monkeys (Macaca mulatta, Gi and Br; weights, 7–8 kg). The data presented here were collected during recording sessions in which also the spatial sensitivity of IC neurons was tested (Zwiers et al., 2004). All experiments were conducted in accordance with the European Communities Council Directive of November 24, 1986 (86/609/EEC) and were approved by the local ethics committee (dierexperimentencommissie) of the university for the use of laboratory animals.
Surgery and animal preparation.
Both monkeys were trained to foveate visual targets [light-emitting diodes (LEDs)] against small liquid rewards. Shortly before (∼24 h), as well as during, recording periods, the monkeys were deprived from their normal ad libitum water supply, and daily water intake was limited to ∼200 ml. In a recording session, the monkey could earn liquid rewards until he was satiated. After training was completed, two separate surgeries were performed under full anesthesia and sterile conditions. Anesthesia was maintained by artificial respiration (0.5% isoflurane and N2O), and additional pentobarbital, ketamine, and fentanyl were administered intravenously. In the first surgery, a thin golden eye ring was implanted underneath the conjunctiva to allow for precise eye-movement recordings with the so-called double-magnetic induction technique (Bour et al., 1984; Zwiers et al., 2004). In the second surgery, a stainless steel recording chamber (16 mm diameter) was placed over a trepane hole in the skull (12 mm diameter), centered above the midline, and 2 mm posterior of the interaural line. This position of the chamber allowed a vertical approach of the IC and SC on both the left and right side. Four stainless-steel bolts, embedded in dental cement, allowed firm fixation of the head during recording sessions (Frens and Van Opstal, 1998).
Recordings.
The head-restrained monkey sat in a primate chair in a completely dark and sound-attenuated room (3 × 3 × 3 m). A glass-coated tungsten microelectrode (0.5–2.5 MΩ) was carefully positioned and lowered into the brain through a short stainless-steel guide tube by a hydraulic stepping motor (Trent Wells). The analog electrode signal was amplified (A-1; BAK Electronics) low-pass filtered (15 kHz cutoff), and monitored on an oscilloscope. To detect action potentials, the signal was fed through a level detector that was connected to a four-bit counter. Each spike caused an increase in the direct current (DC) output of the counter. This DC signal (16 different levels) was subsequently digitized (1 kHz sampling rate), allowing to unambiguously detect up to 16 spikes/ms. A real-time principal component analyzer was used to visually verify whether triggered signals were obtained from single neurons (Epping and Eggermont, 1987).
The recording sites were in IC as based on the following observations. (1) Histology of both monkeys confirmed that the electrode tracks passed through the central nucleus of the IC. (2) The stereotaxic coordinates of the recording sites corresponded closely to the coordinates of the IC as given by the neuroanatomical atlas of Snider and Lee (1961). (3) Often, saccade-related neural activity that was indicative of the deep layers of the SC was encountered before entering the auditory nucleus. (4) When lowering the electrode from dorsal to ventral locations, the best frequency (BF) for evoking auditory responses increased in an orderly manner (up to 20 kHz), over a depth range of ∼3 mm (for details, see Zwiers et al., 2004, their Fig. 2). Such tonotopic ordering with depth has been reported previously (Ryan and Miller, 1978). (5) Latencies of auditory responses were 10–20 ms, which also concurs with the study of Ryan and Miller (1978).
Figure 2.
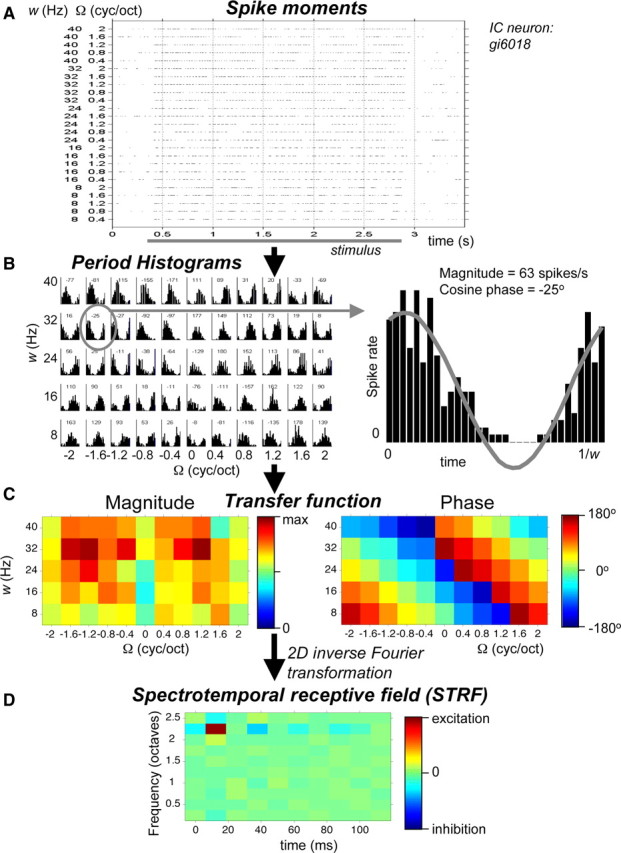
Paradigm to derive STRF from responses to ripples varied in full velocity–density range. A, Spike events of IC neuron responding to ripples with densities of 0.4–2 cycles/octave and velocities of 8 to 40 Hz. Responses are shown for downward sweep direction (Ω > 0). B, Period histograms derived from responses as shown in A. Histograms are shown for responses to all stimuli (both sweep directions and Ω = 0). Phases in degrees are shown above each histogram. C, Magnitude and phase of ripple transfer function. D, STRF: descriptor of the response to spectrotemporal envelope modulations. It can be considered a time-dependent frequency filter or a frequency-dependent impulse response.
During the experiment, the monkey was alert as it was engaged in a visual behavioral task. Trials started with the presentation of a fixation light (LED) straight ahead (near the speaker), after 500 ms followed by the presentation of the acoustic stimulus. The monkey was rewarded with a drop of water for fixating the LED during sound presentation. Trials in which the monkey was not accurately fixating the visual target (error larger than 4°) before and during the presentation of the sound were aborted and repeated in the same experiment. Occasionally, the fixation criterion was relaxed to finish a block of trials.
Sound stimuli.
All stimuli were presented in free field at the frontal central position at a distance of 0.9 m from the monkey. They were produced by a speaker (Philips AD-44725) with a flat frequency characteristic within 5 dB between 0.2 and 20 kHz after equalization (Behringer Ultra-Curve). The sound stimuli were generated digitally at a 50 kHz sampling rate (National Instruments digital-to-analog board, DT2821). The signal was amplified (Luxman A-331) and bandpass filtered between 200 Hz and 20 kHz (Krohn-Hite 3343). The sound intensity was measured at the position of the monkeys' head with a calibrated sound amplifier and microphone (BK2610/BK4134; Brüel and Kjær). Ambient background noise level was ∼30 dBA (A-weighted). Reflections above 500 Hz were effectively absorbed by acoustic foam that was mounted on the walls, floor, ceiling, and every large object present.
Four different types of stimuli were presented: (1) pure tones, (2) ripple stimuli, (3) Gaussian white-noise stimuli, and (4) vocalizations. The tone, noise, and ripple stimuli were presented to both monkeys, and vocalizations were presented to one monkey (Br). The tone, noise, and ripple stimuli had a 5 ms rise and fall time.
Pure tones with a duration of 200 ms were presented over a wide range of frequencies (223–20159 Hz; ⅙ octave steps). Each trial consisted of three tone pips of the same frequency at different intensities [40, 50, and 60 dB sound pressure level (SPL)], separated by a 500 ms interval and played in two different sequences, i.e., from low to high intensity and vice versa. Each sequence was presented once. Trials were presented in random order. The tuning curve of the neuron was determined by averaging, for each frequency, the activity across the six tone presentations. The BF of the neuron [log(BF)] was taken at the maximum of the frequency tuning curve (Zwiers et al., 2004). Its (excitatory) bandwidth was estimated between frequencies at which the mean firing rate exceeded the background plus twice its SD.
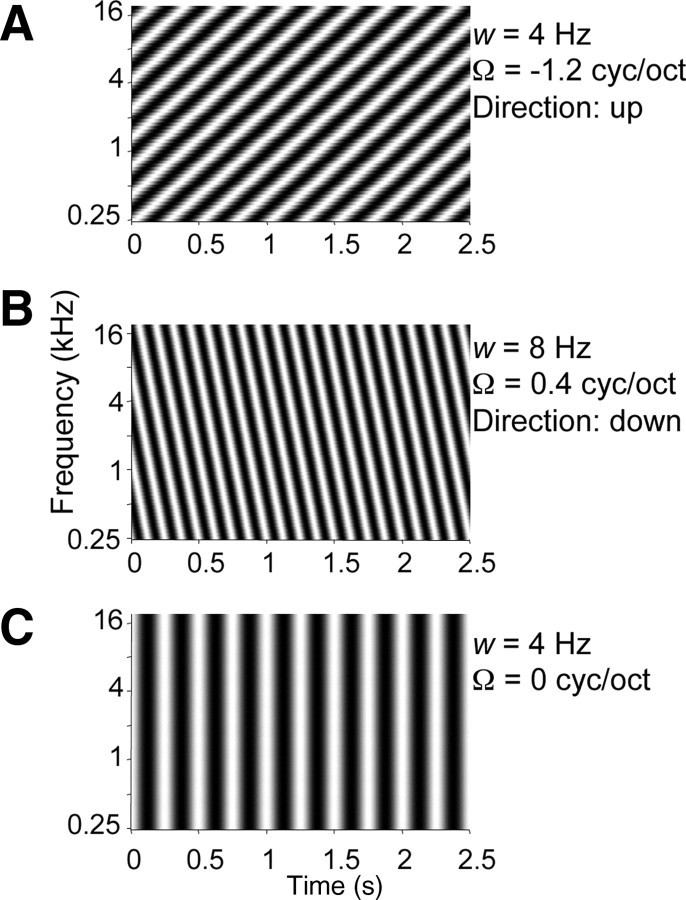
Ripple stimuli were generated according to the study of Depireux et al. (2001). The ripples consisted of a broadband complex of 126 components equally distributed (20/octave) from 250 Hz to 20 kHz. All components had random phases. The envelopes were sinusoidally modulated in the spectrotemporal domain, such as shown in Figure 1. The amplitude of each component is described as follows:
with t time, x position of the spectral component in octaves above the lowest frequency (250 Hz), w ripple velocity (in hertz), Ω ripple density [in cycles/octave (or cyc/oct)], and ΔM the modulation depth on a linear scale between 0 and 1.
Figure 1.
Spectra of ripple stimuli as used in experiment. A, Ripple with upward sweep direction, velocity w = 4 Hz, and density Ω = −1.2 cyc/oct. B, Ripple with downward sweep direction, w = 8 Hz, and Ω = 0.4 cyc/oct. C, Ripple with flat spectrum: amplitude-modulating stimulus, w = 4 Hz, and Ω = 0 cyc/oct.
In a typical experimental run, illustrated in Figure 2, we presented all combinations of the ripple density Ω (−2:0.4:2 cyc/oct) and the ripple velocity w (8:8:40 Hz), once (55 different ripples). Note that Ω < 0 corresponds to an upward direction of the spectral envelope (Fig. 1A), Ω > 0 to a downward direction (Fig. 1B), and that Ω = 0 is equivalent to a pure amplitude modulation (AM) (Fig. 1C). The modulation depth was 100%, the sound level was 56 dB SPL, and the duration was 2500 ms.
Three different frozen samples of unmodulated broadband Gaussian white noise were presented at three levels (40, 50, and 60 dB SPL). The noise stimuli had a duration of 500 ms, and the number of repetitions was 10.
Various natural stimuli were presented to monkey Br: three different macaque calls and three different bird calls. The macaque vocalizations were obtained from the website of Dr. M. Hauser (Harvard University, Cambridge, MA; http://www.wjh.harvard.edu/∼mnkylab/media/rhesuscalls.html) and the bird vocalizations from the website of Dr. T. Phillips (State University of New York Stony Brook; http://www.mathlab.sunysb.edu/∼tony/birds). All vocalizations were resampled to 50 kHz. Artifacts and background noises were removed by cutting and high-pass filtering. The calls were presented at three sound levels (40, 50, and 60 dB SPL), durations varied from 300 to 1600 ms, and the number of repetitions was five.
Data analysis: ripple responses.
A response window of 2250 ms was used, from 250 ms after stimulus onset (to avoid transient onset responses) to stimulus offset. Period histograms (Fig. 2B) were constructed based on the period of the temporal modulation of the stimulus (inverse of w). Subsequently, a Fourier analysis was performed on the period histograms. The magnitude A(w, Ω) (in spikes per second) and phase ϕ(w, Ω) of the period histograms were derived from the first harmonic of the spectrum to generate a complete spectrotemporal transfer function (Fig. 2C):
Inverse Fourier transformation of T(w, Ω) produces the spectrotemporal response field, or STRF of the cell (Fig. 2D):
with x the tonotopic distance in octaves. The spectral section of the STRF reflects frequency tuning, and the temporal section reflects the impulse response.
The frequency range of the STRF is determined by the step size of the ripple density, as a consequence of the inverse Fourier transformation: [range x] = 1/[step size Ω]. Typically, the step size was 0.4 cyc/oct, resulting in a frequency range of 1/0.4 = 2.5 octaves. In 38 cells, we additionally used a finer grid of ripples (step size, 0.2 cyc/oct), which resulted in a frequency range of 5 octaves. The position of the range, in particular when it is 2.5 octaves, is ambiguous. The lower frequency is then either 250 Hz (lowest component of the ripple stimulus), 2.5 octaves above 250 Hz (1414 Hz), or 5 octaves above 250 Hz (8 kHz). The tone responses were used to resolve this ambiguity. For instance, the neuron of which the responses are shown in Figure 2 had best tone responses ∼1 kHz, and, because the maximum response of the STRF is at ∼2 octaves above the lower frequency, this implies that the frequency range of the STRF was 250–1414 Hz. Note that with a frequency range of 2.5 octaves multiple excitatory peaks could only be observed for multipeak intervals less than ∼2 octaves.
Parameters of phase locking, transfer function, and STRF.
A measure to quantify the phase locking of a cell to the ripple stimuli, q, was computed as follows:
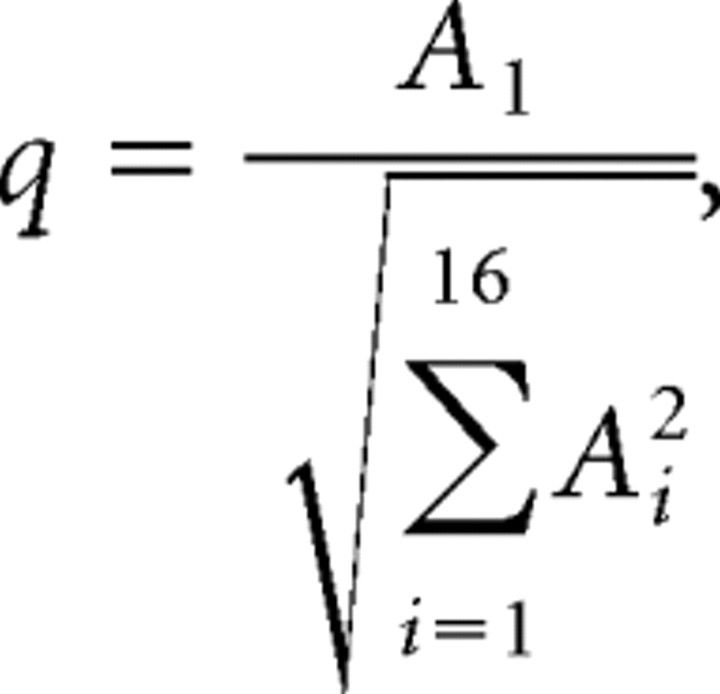 |
with Ai amplitude of ith harmonic.
The parameter q reflects the best sinusoidal fit with the period histogram. We applied q as an index to judge the sensitivity of the neuron to the ripple stimulus. The sensitivities to moving ripples (Ω ≠ 0) and amplitude modulations (Ω = 0) were treated separately. For Ω < 0 and Ω > 0, the 25% percentile of q values found to the set of stimuli, q25, was compared with a criterion set at p = 0.01. For Ω = 0, the median of q values, q50, was compared with that criterion. By simulating random responses, criterion levels of q25 = 0.387 for Ω ≠ 0 and q50 = 0.376 for Ω = 0 were found. Thus, for instance, it is unlikely (p < 0.01) that q25 > 0.387 if a neuron responds in a random way to moving ripples.
Three response parameters were derived from the transfer function T: the best ripple velocity wB of a cell, its best ripple density ΩB, and its direction selectivity D. The parameters wB and ΩB were determined as the Ω and w at which the largest response amplitude was found (in Fig. 2C: wB = 32 Hz; ΩB = 1.2 cyc/oct). The parameter D was computed as follows (Mendelson and Cynader, 1985):
 |
where Rup and Rdown are the sum of the response amplitudes to the upward (Ω < 0) (Fig. 1A) and downward (Ω > 0) (Fig. 1B) ripples, respectively. A ripple/AM ratio was derived to indicate the preference of a neuron for moving ripples versus AM noise. To that end, the responses to the best Ω ≠ 0 were summed for all presented velocities and divided by the sum of the responses to Ω = 0 at all velocities.
Finally, a best frequency (BFstrf) and latency were derived as the frequency and latency at which the STRF had its maximum.
Separability.
We examined whether the two-dimensional ripple transfer function T(w, Ω) can be obtained by the product of two separate, one-dimensional, transfer functions, the temporal function F(w) and the spectral function G(Ω). The separability analysis was performed for the complete transfer function (−2 ≤ Ω ≤ 2 cyc/oct), as well as for each of the two quadrants of the transfer function (Ω < 0 and Ω > 0). The former is targeted at full separability and the latter at quadrant separability (Depireux et al., 2001). We applied two different methods to examine the extent of separability.
First, singular value decomposition (SVD) of the ripple transfer function was performed (Depireux et al., 2001). For a fully separable function, the following equation applies:
Briefly, the SVD method decomposes T(w, Ω) as follows: T(w, Ω) = F(w) × S × G(Ω), with S a diagonal matrix with eigenvalues λi with λ1 ≥ λ2 ≥ λ3 and so forth. For a separable function, λ1 = 1, and the other eigenvalues are zero. As a measure to quantify the separability strength, we determined the inseparability index α as used by Depireux et al. (2001) and Linden et al. (2003):
 |
with λi the eigenvalues.
The transfer function is inseparable when α = 1 and separable for α = 0.
Second, a temporal transfer function, F(w), at Ω = ΩB, and a spectral function, G(Ω), at w = wB were selected from the recorded complete transfer function T(w, Ω). Subsequently, an estimate Test(w, Ω) was computed according to Equation 5, Test(w, Ω) = F(w) × G(Ω), and the resulting STRFest (Eq. 3) was then correlated with the original STRF. The correlation coefficient, ρ, was used as an additional measure of separability.
Phase functions.
For a majority of transfer functions, the phase functions ϕ(w, Ω) appeared to be linear, such as the example in Figure 2C, and thus can be described for each direction as follows (Depireux et al., 2001):
The phase intercepts for downward and upward sweep directions, χdown and χup, consist of temporal and spectral components, θ and ϕ. This can be written as follows (Depireux et al., 2001):
 |
and
The separated phase functions that resulted from the SVD analysis were used to derive the parameters τ, x, θ, and ϕ. The slope τ corresponds to temporal position (group delay), and the slope x corresponds to spectral position (reflecting a BF); these parameters can be determined for both ripple directions. The phase constants θ and ϕ are related to asymmetry of the STRF around BF. The parameter θ reflects inhibition before and/or after excitation at BF: θ < 0 reflects excitation at onset followed by inhibition, and θ > 0 reflects inhibition at onset followed by excitation. The parameter ϕ reflects the extent of sideband inhibition above and/or below BF: ϕ < 0 indicates inhibition dominant below BF, and ϕ > 0 indicates inhibition dominant above BF.
Predictions.
From the STRF, a linear estimate of the temporal response pattern of a cell, R(t), to any sound stimulus can be predicted by time convolution and spectral integration with the stimulus spectrogram, S(x, t):
Applying this equation, we predicted responses to the vocalizations (monkey Br, 19 cells) and to three different frozen noise samples (presented to both monkeys: 16 cells for Br and 44 cells Gi) and compared the predictions with the recorded responses. In case of STRFs with 2.5 octave spectral range, a spectral shift of the STRF was applied to align the maximum with the center of the STRF. Note that the summation, Σx, is performed over the full spectral range of the STRF. The bin size, (df, dt), of S(x, t) in both the spectral and temporal dimension was set according to the bin size of the STRF, typically df = 0.25 octave, and dt = 12.5 ms.
Results
General characteristics of ripple responses in IC
Neural activity in response to ripple stimuli was recorded from 91 neurons (53 in monkey Gi, 38 in monkey Br), which were all responsive to tones and/or broadband noise. Response features of these neurons to tones and noise have been described by Zwiers et al. (2004). Best frequencies ranged from 0.3 to 20 kHz, generally increasing from dorsal to ventral IC locations (Zwiers et al., 2004, their Fig. 2). Eighty-two neurons (90%) responded to the moving ripples (Ω ≠ 0) as judged by the index q, which quantifies the phase locking to the ripple (see Materials and Methods). In general, responses to the ripples were strong, such as shown by the dense spike-train pattern with short interspike intervals (1–3 ms) in Figure 2A. Of the nine nonresponding neurons, two neurons responded to the AM stimulus (Ω = 0) (Fig. 1C). The nonresponding neurons had typically either low (n = 4; ≤0.6 kHz) or high (n = 3; ≥8 kHz) BFs. A substantial part of neurons that responded to moving ripples did not respond to AM (n = 16, 20%). The numbers of neurons responding to ripples and/or AM are summarized in Table 1.
Table 1.
Number of neurons sensitive to moving ripples (Ω ≠ 0) and AM noise (Ω = 0)
| Ripples | Not ripples | Total | |
|---|---|---|---|
| AM | 66 | 2 | 68 |
| Not AM | 16 | 7 | 23 |
| Total | 82 | 9 | 91 |
The responses to the ripples have been judged on the basis of the amount of phase locking, which is quantified by index q (see Materials and Methods).
Figure 3 shows transfer functions and corresponding STRFs of four different example neurons. The spectral range of the STRFs is 2.5 octaves, and thus the spectral position of the STRFs could not be determined unambiguously. Instead the spectral range of the cell was based on the tone–response curves, which are shown in the right-hand column (see Materials and Methods). An important feature revealed by the transfer functions is selectivity to a limited range of ripple densities, Ω, and velocities, w, which strongly varied among the neurons. Neurons were found that preferred low Ω (Fig. 3B,C) or high Ω (Fig. 3A), and neurons preferred low w (Fig. 3A,C) or high w (Fig. 3B). Also, direction selectivity varied: neurons could prefer downward moving ripples (Fig. 3A) or upward moving ripples (Fig. 3C) or responses to both directions were equally strong (Fig. 3B). Furthermore, Figure 3 shows three neurons that responded significantly better to moving ripples than to AM noise (Fig. 3A–C) and one neuron that clearly preferred AM noise (Ω = 0) over ripples (Fig. 3D). Various neurons responded to both ripples and AM noise (Fig. 2C).
Figure 3.
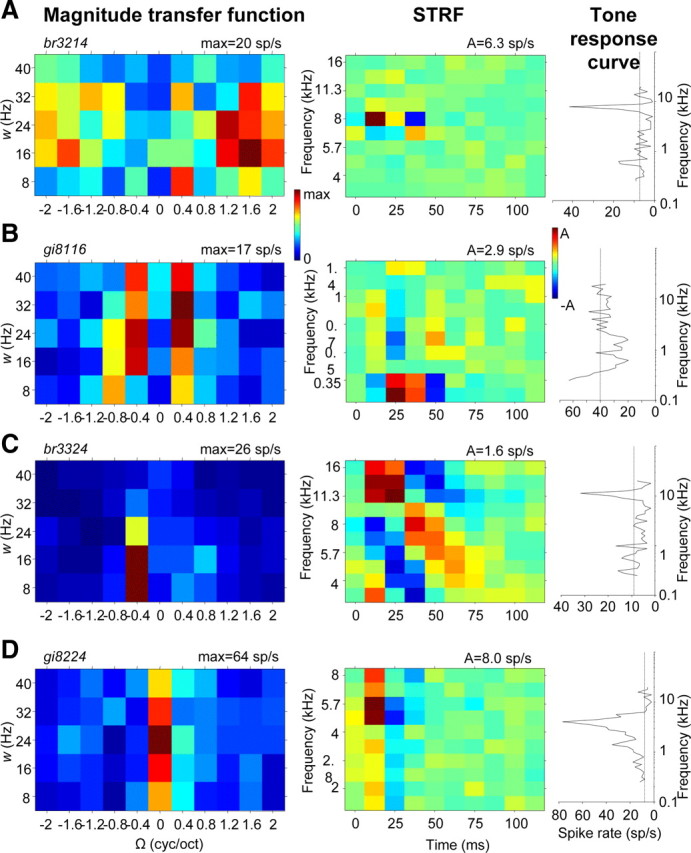
Ripple transfer functions (magnitude), corresponding STRFs, and tone responses of four different cells. A, Example of low best ripple velocity and high best ripple density: best w = 16 Hz; best Ω = 1.6 cyc/oct; direction selectivity D = −0.11; ripple/AM response ratio = 2.61. B, Example of high best ripple velocity and low best ripple density: best w = 32 Hz; best Ω = 0.4 cyc/oct; direction selectivity D = 0.03; ripple/AM response ratio = 3.50. C, Example of asymmetric transfer function with preference for upward direction: best w = 16 Hz; best Ω = 0.4 cyc/oct; direction selectivity D = 0.23; ripple/AM response ratio = 4.60. D, Example of preference for amplitude modulation (Ω = 0) above ripple: best w = 24 Hz; best Ω = 0 cyc/oct; direction selectivity D = −0.18; ripple/AM response ratio = 0.43.
The STRFs generally showed excitation for a narrow range of frequencies with a latency between 10 and 30 ms so that a BFstrf could easily be defined. Inhibition occurred around excitation, typically after excitation as in Figure 3D, and/or in frequency bands near BF (as “sideband inhibition”), for example, below BFstrf, as in Figure 3A. The frequency tuning reflected by the STRF was approximately similar to the frequency tuning to pure tones. In particular, BFs agreed. Furthermore, the excitatory bandwidths correlated: the increase of bandwidth from Figure 3A to C to D is found in both the STRF and the tone–response curve. Agreement was also found for position of the inhibitory sidebands, as in Figure 3A, or for lack of sideband inhibition, as in Figure 3D.
Distributions of ripple responses
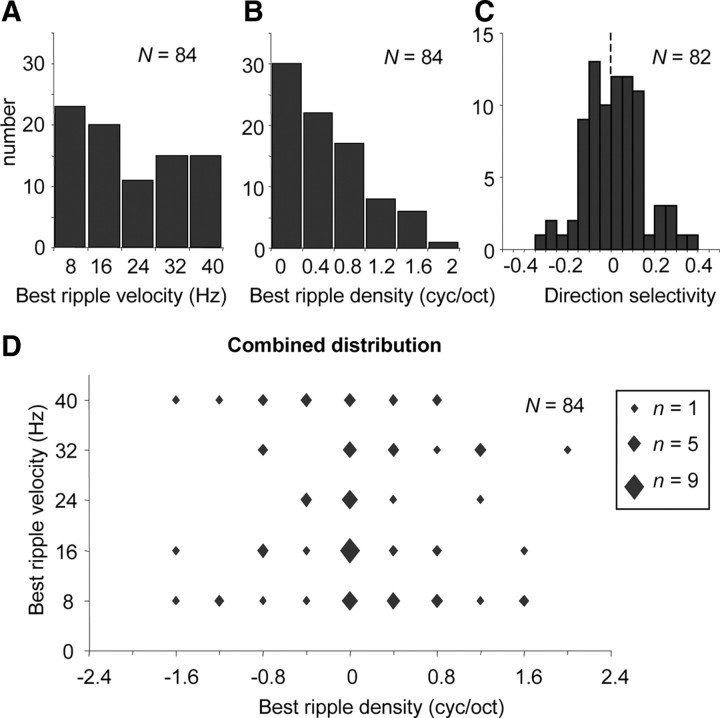
On the basis of the transfer function, a best ripple velocity wB, best ripple density ΩB, and direction selectivity D was determined for each neuron responding to ripple or AM noise. The distributions of these parameters, shown in Figure 4, display a wide range of ripple selectivities in monkey IC. The distribution of wB in the range routinely tested (8–40 Hz) was almost uniform (Fig. 4A), whereas the distribution of ΩB was skewed toward low densities with a large majority of neurons (82%) preferring low ripple densities (0–0.8 cyc/oct) (Fig. 4B). Direction selectivity D was symmetrically distributed around 0 mean, indicating a majority of neurons (58%) with similar preference for upward as for downward moving ripples (−0.1 < D < 0.1) (Fig. 4C). Strong direction preference (D < −0.2 or D > 0.2) was found for 14% of the neurons. The combined distribution of wB and ΩB indicates that selectivity varied over a wide range of combinations; furthermore, selectivity to Ω did not correlate to selectivity to w (Fig. 4D).
Figure 4.
Distributions of ripple parameters derived from the magnitude of ripple transfer functions. A, Distribution of best ripple velocity; B, best ripple density; C, distribution of direction selectivity; D, combined distribution of best ripple velocity versus best ripple density. The size of the data points reflect the number of neurons.
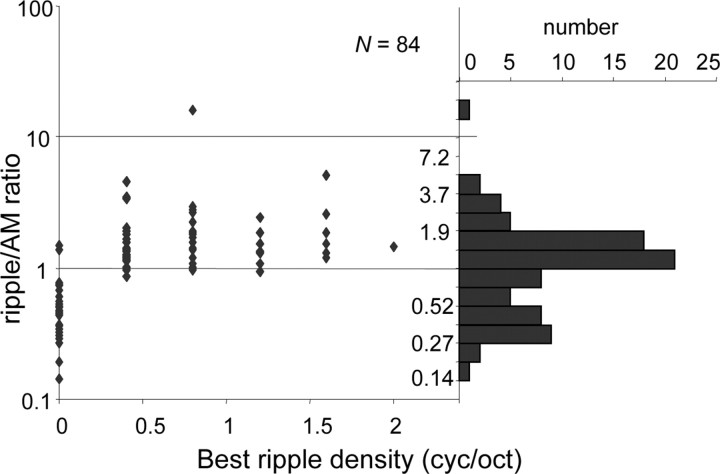
Figure 5 presents the distribution of the ripple/AM ratio. Generally, as expected, the neurons with ΩB = 0 had a ratio <1, and the neurons with ΩB > 0 had a ratio >1. Note that exceptions also occurred, because ΩB was obtained at a single velocity and the ripple/AM ratio was computed across all velocities. The ratio did not depend on ΩB, which means that, on average, neurons with a low ΩB responded equally strong to AM noise as neurons with a high ΩB. The distribution appeared bimodal, with peaks around 1.2 and around 0.3. This implies that most neurons preferring AM noise responded relatively weakly to ripples (ratio of 0.3), and most neurons preferring ripples respond nearly as well to AM noise as to ripples (ratio of 1.2).
Figure 5.
Ratio of responses to moving ripple (Ω ≠ 0) and AM (Ω = 0) as a function of best Ω and the corresponding distribution of ripple/AM response ratio. Bin size, bs, is chosen according to bs = range/√n with range computed over data without outliers.
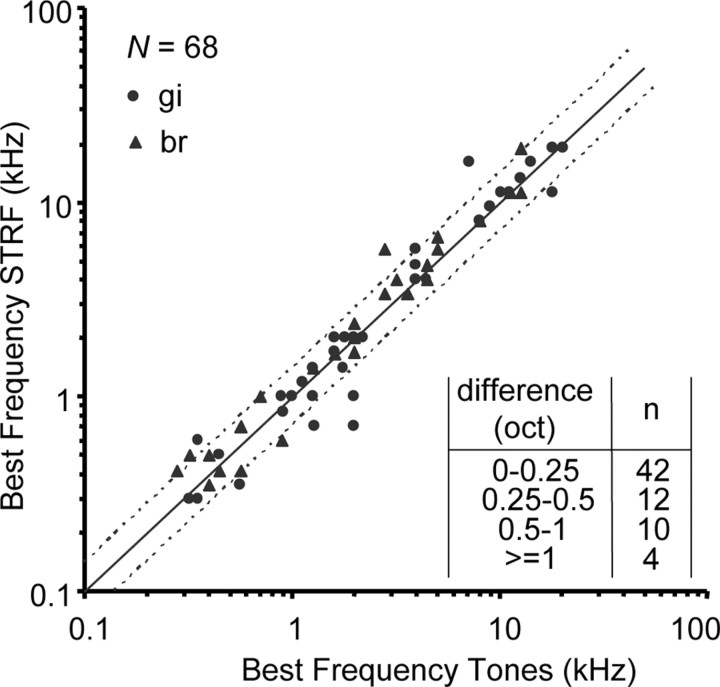
For 68 neurons, a BF could be assessed on the basis of both the tone responses and the STRF. Generally, as demonstrated by Figure 6, there was close agreement between the two assessments: for 42 of 68 (62%), the difference was <0.25 octave, which equals the spectral resolution of the constructed STRF. Fourteen neurons (21%) showed a poor correspondence (difference of >0.5 octave). Furthermore, the wide distribution of BFs in our database from 0.3 to 20 kHz can also be observed in Figure 6.
Figure 6.
Best frequency derived from STRF as a function of BF derived from tone responses. The solid line represents y = x, and the dotted lines represent differences of half octave (y = x − 0.5; y = x + 0.5). For 42 of 68 neurons (62%), the difference is <0.25 octave. There is no bias in the difference (mean difference, 0.04 octave; not significantly different from 0; t test, p > 0.1).
Separability
The transfer functions shown in Figures 2C and 3, A and B, were well separable, i.e., the spectral transfer functions found at different velocities w are scaled versions of one another (the same holds for the temporal transfer functions at different densities Ω). The extent of separability was first tested with the SVD method (see Materials and Methods). Figure 7 shows the result of the SVD analysis on the transfer function of an IC neuron for downward ripple directions (Ω > 0). At all velocities apart from 40 Hz, the magnitude curves peaked at ∼0.8 cyc/oct, and the phase curves were all very similar, running parallel to each other (Fig. 7A). These similarities imply a high degree of separability, which is indeed reflected by a low inseparability index for this neuron (α = 0.02). The responses can therefore be well described by the main separated spectral and temporal curves (corresponding to λ1), obtained from SVD (Fig. 7B). An STRF reconstructed by multiplying these separate temporal and spectral functions (Eq. 5) is very similar to the original STRF (r = 0.97) (Fig. 7C).
Figure 7.
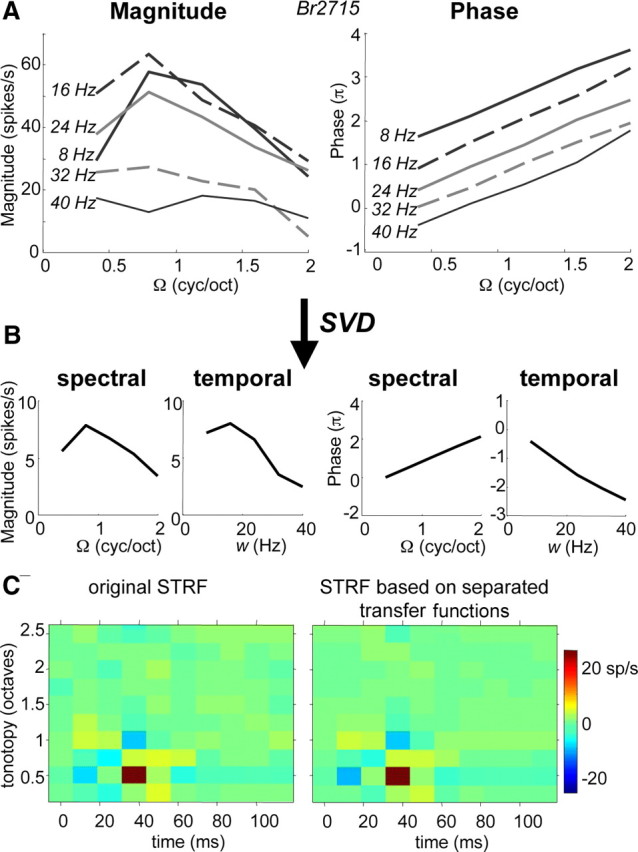
SVD of ripple transfer functions (magnitude and phase), shown for downward ripple direction (Ω > 0). Eigenvalues in this example (normalized with respect to λ1) are λ1 = 1, λ2 = 0.13, λ3 = 0.07, λ4 = 0.04, λ5 = 0.02, and the inseparability index α = 0.02. A, Recorded transfer function in IC neuron. B, Separated spectral and temporal transfer functions corresponding to λ1. C, An STRF is reconstructed by multiplying separated transfer functions (B) according to Equation 5. The reconstructed STRF (right) is compared with original STRF (left). The correlation between the STRFs has an r of 0.97.
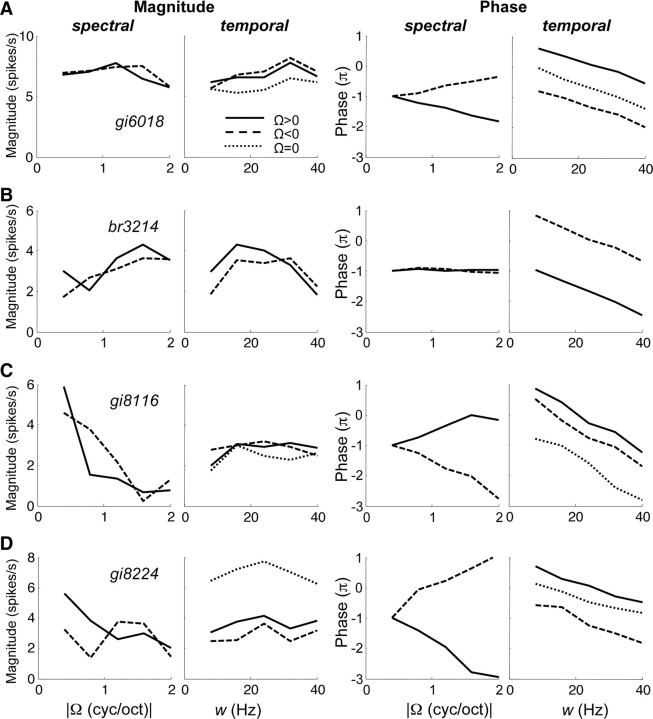
Figure 8 shows separated transfer functions of four different neurons for which the complete magnitude transfer functions are shown in Figures 2C and 3, A, B, and D. The responses of these neurons were appreciable over a wide enough range of ripples for SVD to be relevant (median q over total transfer function >0.4). In the quadrant-separated representation of the data, the shape of the transfer functions found for the two ripple directions (solid and dashed curves) appeared very similar. Note also that the phase function could be well approximated by straight lines, as predicted by Equation 7. Only the intercepts of the phase curves differed for the two directions. The slopes of the phase curves, which reflect the spectral position and group delay (see Eq. 7), were similar (note that slopes for Ω < 0 are shown inverted, for clarity). For neurons responding well to AM noise (Ω = 0), the recorded AM transfer function has been plotted in the temporal graphs for comparison. Note that, in those cases, the AM curves were similar to the separated ripple transfer functions, differing only in magnitude.
Figure 8.
Separated transfer functions of four different neurons: magnitude (spikes per seconds) and phase (radians) versus ripple density and ripple velocity. Solid curves represent functions for downward sweep direction (Ω > 0), and dashed curves represent functions for upward direction (Ω < 0). Dotted curves represent AM transfer functions (Ω = 0) for three cells that yielded significant responses (q50 > 0.376). Note that, for comparison purposes, the spectral data for Ω < 0 are shown along the positive Ω axis. Inseparability indices α were as follows, with αdown for downward, αup for upward sweep direction, and αtotal for total transfer function (downward, upward, and Ω = 0). A, αdown = 0.03; αup = 0.02; αtotal = 0.04. B, αdown = 0.08; αup = 0.08; αtotal = 0.13. C, αdown = 0.05; αup = 0.16; αtotal = 0.16. D, αdown = 0.14; αup = 0.34; αtotal = 0.18. The corresponding complete transfer functions are shown in Figures 2 and 3.
The SVD analysis was performed for cells with good phase locking to a wide range of presented ripples (median q > 0.4; n = 48). Figure 9A shows that, for a large majority of those neurons, the transfer functions in at least one direction could be characterized as separable (α < 0.2 for 92%). The direction for which the lowest α was found typically coincided with the preferred direction D. A statistical simulation indicated that the probability of finding a value α < 0.3 for a random 5 × 5 transfer function is <0.01. Using α = 0.3 as a criterion, we found that 7% of the single-direction transfer functions were inseparable, and only one neuron had inseparable transfer functions for both directions. In conclusion, IC neurons show a significant degree of spectral–temporal separability for a single direction, a feature that has become known as quadrant separability (Depireux et al., 2001).
Figure 9.
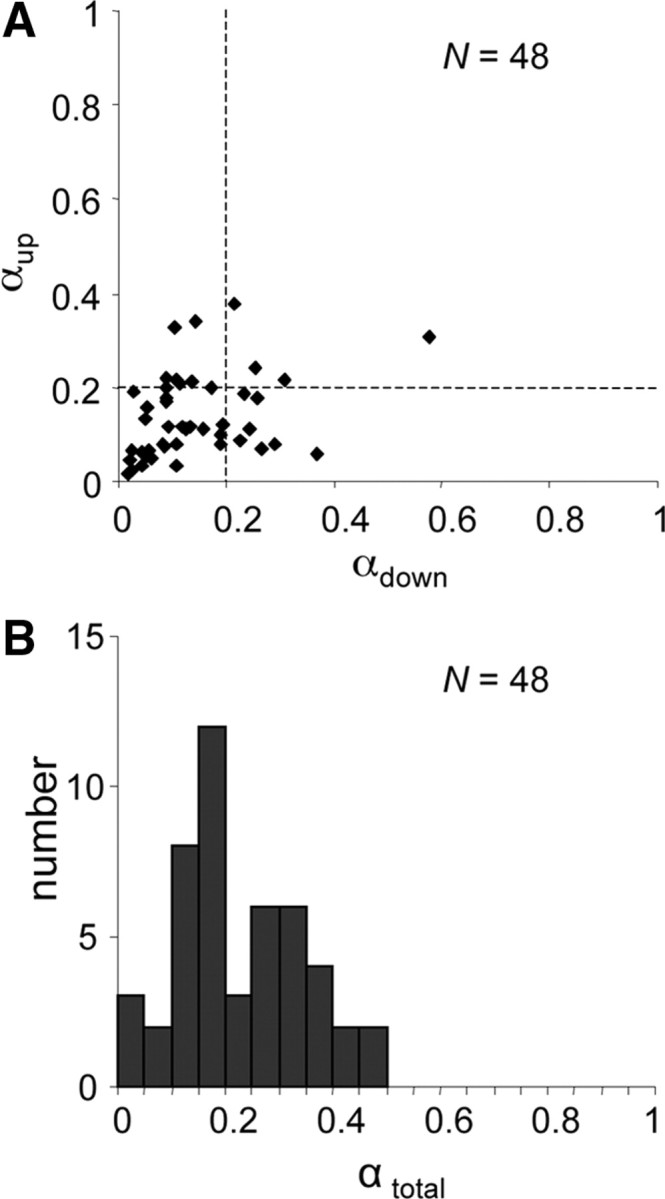
Distributions of inseparability indices α. A, Quadrant separabilities αup versus αdown. B, αtotal, for total transfer function.
Figure 9B addresses the separability for the complete transfer function (i.e., for both directions and for Ω = 0) or, equivalently, the separability of the STRF. The separability of the complete transfer function depends on quadrant separability, the similarity in responses between the two directions, and the similarity between the AM noise transfer function and the ripple transfer functions (Fig. 8).
One should bear in mind that the value of α for the complete transfer function always exceeds the lowest index of the two directions. Assuming quadrant separability, a statistical simulation was performed on complete 11 × 5 transfer functions consisting of three components: two different quadrant-separable 5 × 5 matrices representing transfer functions to both directions, and a 1 × 5 matrix representing the AM noise transfer function. The three components differed randomly, which yielded a probability <0.01 of finding a value α < 0.3. Using α = 0.3 as a criterion, we found that 29% of the complete transfer functions were inseparable. The inseparability of these transfer functions was in a medium range (0.3 < α < 0.5). Direction selectivity partially explains the inseparability: α correlated with absolute direction selectivity (r2 = 0.12; p < 0.05). Moreover, some neurons with a large D were not analyzed with SVD because such cells had a narrow range of responses (Fig. 3C). Nonetheless, inseparability in those cases is obvious (see diagonal organization in the STRF of Fig. 3C).
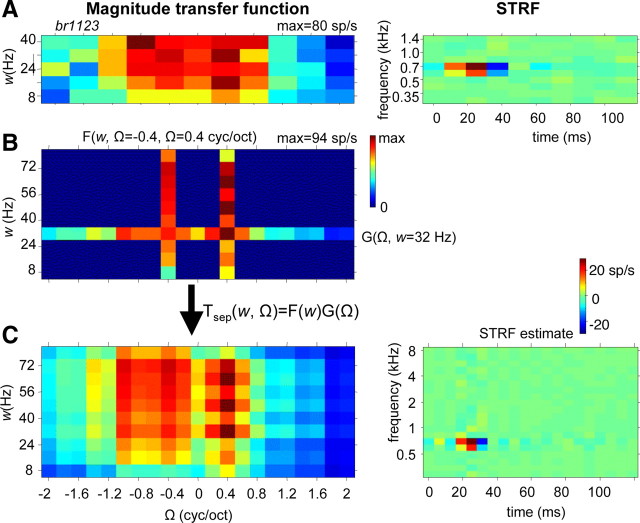
Because the data indicated quadrant separability for the ripple responses of most IC neurons (see above), the full transfer function Tsep(w, Ω) can in principle be obtained by determining only the temporal and spectral transfer functions, F(w) and G(Ω), and subsequently applying Equation 5: Tsep(w, Ω) = F(w) × G(Ω). To test whether this approach would yield a good STRF estimate, temporal and spectral slices F(w, Ω = ΩB) and G(Ω, w = wB) were taken from the recorded transfer function T(w, Ω) at their optimal velocity wB and density ΩB. The correlation between T(w, Ω) and Tsep(w, Ω) was applied as a measure of this approach; the correlation coefficient ρ also served as a second separability measure, with ρ = 1 indicating pure separability (vs α = 0). As expected, ρ was significantly related to the inseparability index α (r2 = 0.32; p < 0.0001). The median ρ was 0.82, confirming the high degree of quadrant separability and validity of this approach to estimate the STRF of a cell. The correlation coefficients ρ were also estimated separately for the amplitude and phase of the transfer function, resulting in a median ρ of 0.69 for amplitude and a median ρ of 0.79 for phase. This indicated that the separability of phase was slightly higher than for amplitude.
In 38 neurons, we recorded separate transfer functions either with a higher resolution or over a wider range of ripple parameters. An example of such recorded separate transfer functions, together with the resulting reconstructed transfer function, is shown in Figure 10. In this particular example, the velocity range of F(w) was extended to 80 Hz because the fully recorded transfer function (Fig. 10A) showed strong responses toward high velocities. Indeed F(w) revealed strong responses between 32 and 72 Hz. The resulting STRFsep (Fig. 10C) was similar to the STRF obtained from the fully recorded transfer function (Fig. 10A), in particular the latency and BF. The temporal resolution of the reconstructed separated STRF was higher than for the original recording because of the wider velocity range. As a consequence, the excitatory responses of STRFsep were narrower than in the original STRF; the spectral widths of two STRF estimates (0.5 octave) were similar.
Figure 10.
A, Magnitude of ripple transfer function T(w, Ω) of IC unit and corresponding STRF. T(w, Ω) was recorded in full typical w–Ω range between 8 and 40 Hz with 8 Hz steps and between −2 and 2 cyc/oct with 0.4 cyc/oct steps (as in Fig. 3). B, Magnitude of ripple transfer functions F(w) at Ω = 0.4 cyc/oct and G(Ω) at w = 32 Hz of same unit. The ranges are 8–80 Hz with 8 Hz steps and −2 to 2 cyc/oct with 0.2 cyc/oct steps. C, Full transfer function computed according to Equation 5 and the corresponding STRF. Because the w range has been doubled compared with the recording in A, the temporal bin size of the STRF is halved, and, because the Ω step size has been halved, the frequency range is doubled.
For the 38 neurons in which both the full recordings and separate recordings were compared, we found that STRFs and direction preferences were very similar (data not shown). Estimates of wB and ΩB correlated (r2 = 0.27 and r2 = 0.37, respectively) but could substantially deviate in some neurons. For instance, in six cases (as in the example of Fig. 10), wB would be above 40 Hz on the basis of Tsep(w, Ω). In addition, we examined whether neurons might respond to a beat caused by neighboring components of the ripple carrier (Elhilali et al., 2004). For BFs above 1 kHz, these beat frequencies are above 40 Hz. For instance, the neuron of Figure 7 is sensitive to components ∼2 kHz, in which components are separated by ∼70 Hz. If the neuron would respond to this beat, a high proportion of interspike intervals of 14 ms are expected. However, the best interspike intervals (interval at which the distribution has its maximum) were 2 ms, and the distribution of intervals did not reveal a peak ∼14 ms. For most IC neurons, the best interspike intervals were between 1 and 5 ms, which is also demonstrated in the spike-event plot in Figure 2A. The best intervals did not correlate with BF, which indicates that the neurons were not particularly responsive to beats.
Phase functions
The phase functions, such as the separated curves shown in Figures 7 and 8, could be well described by straight lines. This is further quantified in Figure 11A for the neuron of Figure 8A. The slopes and intercepts yielded meaningful parameters (see Eq. 7): the slopes can be associated to group delay and spectral position, and parameters derived from the intercepts (see Eq. 8) can be associated to STRF asymmetries in excitatory and inhibitory sidebands in the spectral and temporal domains.
Figure 11.
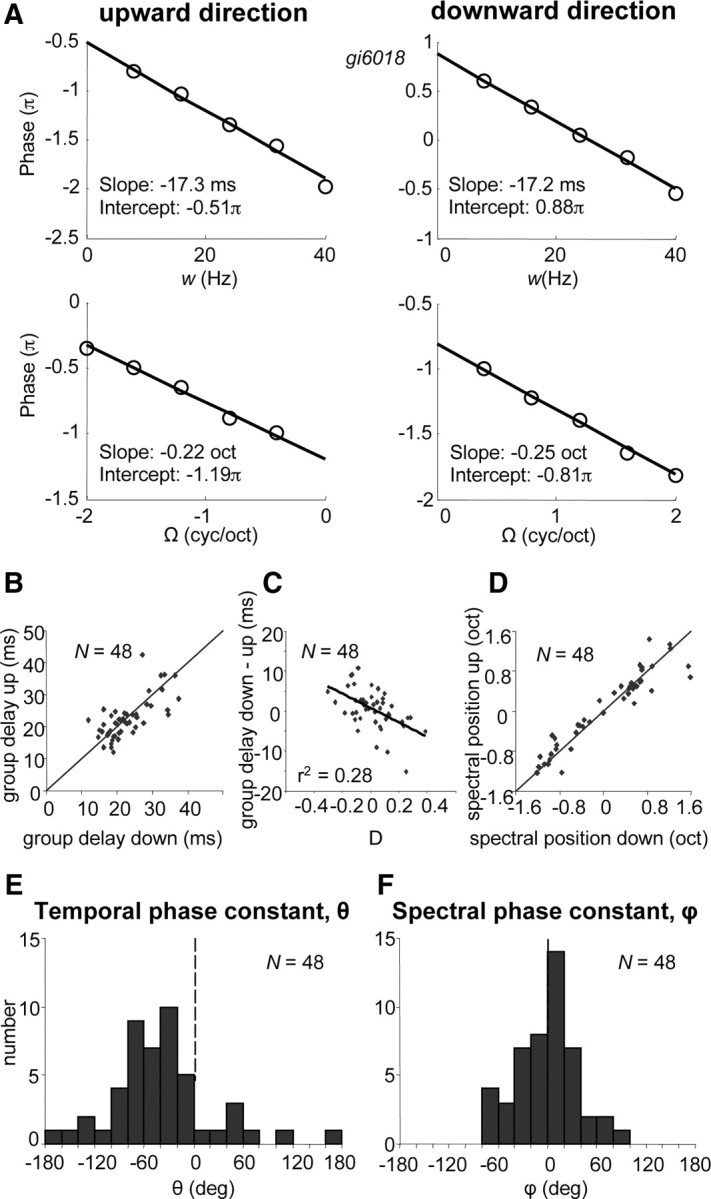
A, Phase functions of neuron shown in Figure 2. Phase, derived from SVD (see Fig. 7B), plotted as a function of velocity and density. For both directions, slopes correspond to temporal position (group delay) and spectral position (BF), see Equation 7. Phases for downward/upward sweep directions, χdown and χup, consist of temporal and spectral parts, θ and ϕ (Eq. 8). In this example, χdown = 0.88π − 0.81π = 0.07π and χup = −(−0.51π − 1.19π + 2π) = −0.30π, thus ϕ = (χup + χdown)/2 = −0.36 = −21° and θ = (χup - χdown)/2 = −0.57 = −33°. B, Temporal positions, or group delays, for upward versus those for downward sweep direction. C, Differences of group delays for upward and downward as shown in B, as a function of direction selectivity D. D, Spectral positions for upward versus those for downward sweep direction. The spectral positions are between −1.25 and 1.25 octave. When the difference between the two positions is >1.25 octave, a 2.5 octave correction is made. The diagonal in B and C represents the y = x line. E, Distribution of temporal phase constant θ (−180° < θ < 180°). F, Distribution of spectral phase constant ϕ (−90° < ϕ < 90°).
Figure 11B shows that group delays were in a range of 15–30 ms. Note that these group delays were longer than the typical onset latencies to tone stimuli, approximately by 6 ms on average, which was highly significant (paired t test, p < 0.0001), and that they only weakly correlated to the tone latencies (r2 = 0.10; p < 0.05). The group delays for upward and downward direction agreed within 3 ms for a majority of neurons (60%). The latency discrepancies, which are substantial for several neurons, appeared to correlate significantly with their direction selectivity D (r2 = 0.28; p < 0.001) in that, interestingly, longer group delays were found for the preferred direction (Fig. 11C). The spectral positions found for the two directions were very similar for a large majority of neurons (difference <0.25 octave for 81%) (Fig. 11D). Spectral position differences, in contrast to temporal position (group delay) differences, were not correlated with the preferred direction (p > 0.1).
Figure 11E shows that the temporal phase constant θ varied between −90 and 0° for most neurons, which implies onset excitation at BF (see Materials and Methods). Responses in a small number of neurons were inhibitory at onset as indicated by a positive θ. The spectral phase constant ϕ (Fig. 11F) was normally distributed around 0. This means that dominant inhibition above BF (ϕ > 0) was found in a similar number of neurons as dominant inhibition below BF (ϕ < 0).
Spatial distribution of ripple responses
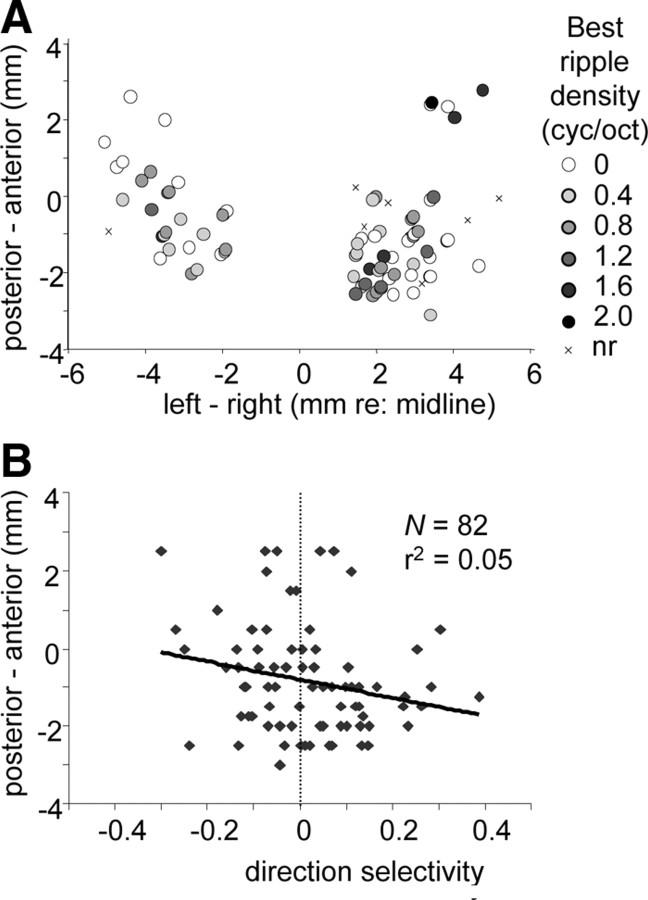
Figure 12A shows the spatial organization of ripple density along the lateromedial and anteroposterior axes. To combine the data of the two animals, 0 mm anteroposterior was aligned with the center of the overlying superior colliculus motor maps (Zwiers et al., 2004). An obvious topography was not present. Neurons responding to tones but not to ripples appeared to be found on the edges of the responsive regions (crosses). The best ripple density varied weakly with recording depth (r2 = 0.06; p < 0.05), with most neurons preferring Ω = 0 dorsally located. Also, the maps of the following other response parameters were examined: ripple velocity, direction selectivity D, separability α, group delay, and temporal and spectral phases θ and ϕ. Only for two of these parameters some topography was observed. A spatial pattern along the anteroposterior axis appeared for direction selectivity (Fig. 12B): anteriorly (−0.5 to 2.5 mm), most neurons prefer downward moving ripples, and, posteriorly (−0.5 to −2 mm), most neurons prefer upward moving ripples (r2 = 0.05; p < 0.05). Group delay (average of delays for up and down direction) (see Fig. 11B) weakly varied with depth as well as along the anteroposterior axis: delays decreased from dorsal to ventral (r2 = 0.13; p < 0.01) and from posterior to anterior sites (r2 = 0.08; p < 0.05).
Figure 12.
Spatial distributions of response parameters. A, Map of best ripple density along lateromedial and anteroposterior axis. To allow a combined map for the two monkeys, anteroposterior coordinates are given relative to the center of the overlying motor SC. Sites with neurons not responding to ripple stimuli are indicated with x. B, Direction selectivity along anteroposterior axis.
Predictions
In 60 cells from both monkeys for which an STRF had been obtained, responses to three different noise samples were also recorded. In addition, in 19 cells from monkey Br, responses to six different vocalizations were recorded. The responses to the noise stimuli and vocalizations were predicted following the linear model of Equation 9, which is illustrated in Figure 13. The STRF of a neuron and the spectrogram of a stimulus, both taken over the same spectral range and at the same spectral–temporal resolution (Fig. 13A), were first convolved in the temporal domain for each spectral bin, resulting in a response spectrogram (Fig. 13B). Subsequently, the response spectrogram was summed along the spectral domain to yield a prediction of the response of the cell as shown in Figure 13C (black curve). The response signal of the model was not rectified; thus, R(t) < 0 should be interpreted as an inhibitory response of the neurons, whereas R(t) > 0 may be interpreted as the firing rate of the neuron. The recorded neural response (gray curve) is shown for comparison. Note that the measured neural response followed the prediction reasonably well (r = 0.50). The broad excitatory response of the measurement appeared as a smoothed version of the prediction, which showed multiple excitatory peaks. A near-zero response of the neuron (after ∼300 ms) corresponded closely to a predicted inhibition.
Figure 13.
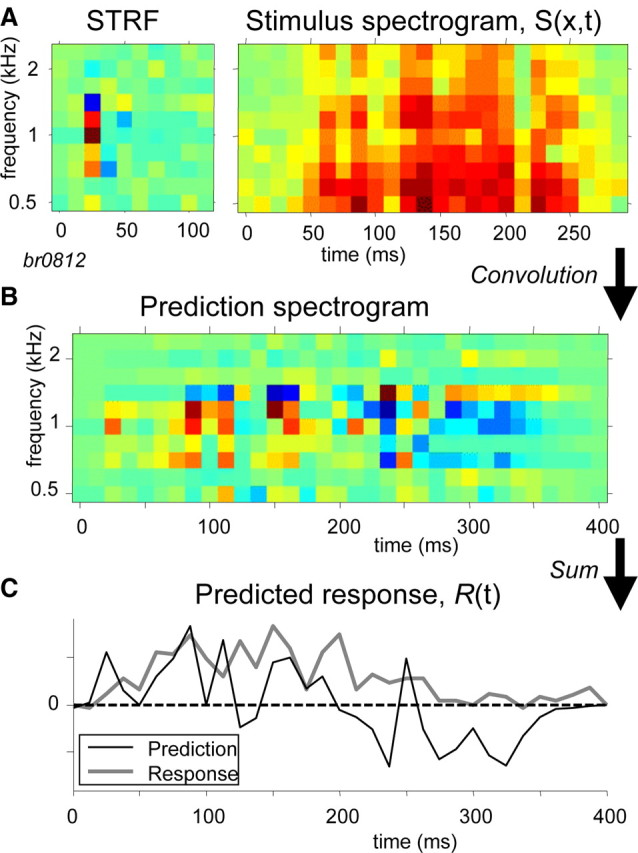
Prediction of response R(t) according to Equation 9. A, STRF and spectrogram of stimulus, S (in this example: macaque vocalization, grunt). The STRF is spectrally positioned around the best response (here, 1 kHz). The stimulus spectrogram is shown in the frequency range of the STRF (here, 0.5–2.8 kHz). B, Response spectrogram obtained by convolution along temporal dimension of STRF and stimulus spectrogram. C, Predicted response, R(t), obtained by sum along spectral dimension of response spectrogram. The black curve represents the prediction, and the gray curve represents the actual neural response to the vocalization. The average spontaneous spike rate (here, 16 spikes/s) is subtracted from the response. The amplitude of the predicted response is scaled to the actual response. The correlation between prediction and response is 0.50.
Figure 14 shows four other examples of predicted and measured responses, two for noise stimuli (A,B) and two for vocalizations (C,D). Almost all excitatory peaks in the response patterns were reproduced by the predictions. Low-response segments corresponded to small deflections or inhibitory troughs of the predicted traces. Figure 14A shows an example of a neuron responding to the spectrotemporal details of the noise envelope, for example, after 200 ms, the neuron was excited by a favorable spectral event in the noise. More often, a pattern such as in Figure 14B was encountered for noise responses: it was characterized by a strong excitatory onset response lasting 30–50 ms, which was then followed by a weak response and finally an inhibitory offset response. The weak response in the middle segment can be expected from a balance of excitation and inhibition. The STRF in Figure 14D is interesting in that it reveals onset inhibition followed by excitation. Consequently, the vocalization response showed a relatively late onset (after 100 ms) and an excitatory peak after a near-zero response around stimulus offset (the reverse is seen in examples A–C); the excitatory parts of these events were correctly predicted. Note that, although most energy of the bird call was below BFstrf, the prediction was fair (r = 0.55). A discrepancy between the predicted troughs and recorded near-zero response as seen in these examples is a direct result of the straightforward linear prediction, which does not account for half-wave rectification as exhibited by neural firings and, therefore, in most cases, underestimates the actual correspondence between measured and predicted responses. On average, correlations were 0.04 higher when rectification was taken into account.
Figure 14.
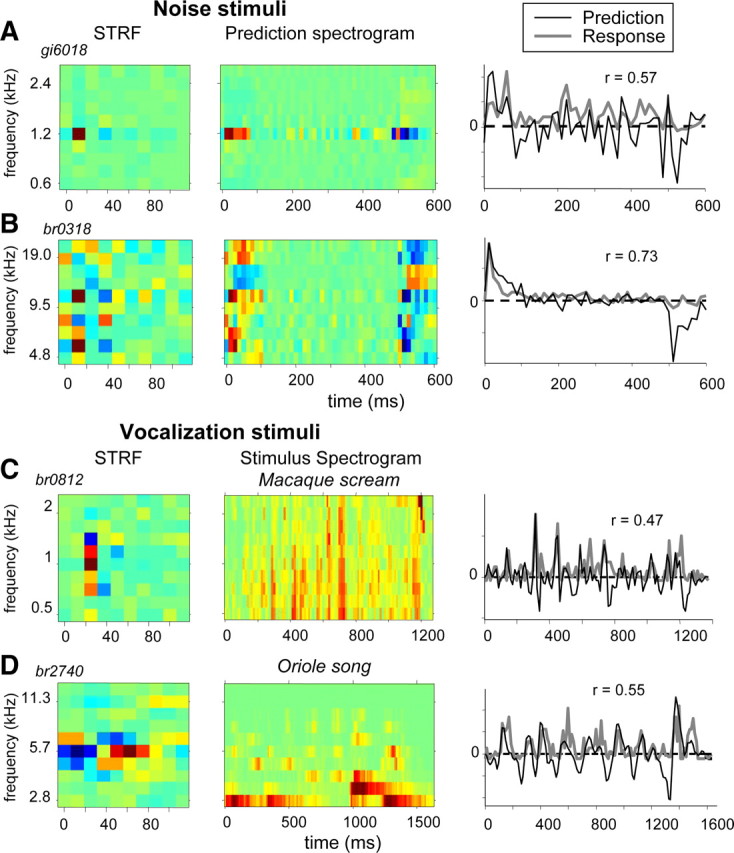
Predictions of responses to noise stimuli or vocalizations according to Equation 9 compared with the actual responses for four different IC neurons. The left column shows the STRFs of the neuron, and the middle column shows either response spectrograms as in Figure 13B (A, B) or stimulus spectrograms (C, D), and the right column shows the predicted (black curve) and recorded (gray curve) responses. A, Neuron with low BF (1.2 kHz) responding to noise stimulus. B, Neuron with double-peak STRF (6 and 11 kHz). C, Neuron with low BF (1 kHz) responding to an undulating macaque scream. D, Neuron with medium-high BF (6 kHz) and inhibition preceding excitation responding to a bird song (northern oriole).
Figure 15A indicates that the stronger a response was predicted, the better the prediction. Generally, this was the case when the spectrogram of the sound and the STRF of the neuron at least partly covered the same frequency range. Figure 15, B and C, shows for each cell the best correlation between prediction and response out of three noise stimuli (B) or six vocalizations (C). For 54% of the neurons, correlations were >0.4, comparable with those of the five examples of Figures 13C and 14. For cells with non-monotonic responses, predictions were typically better at 40 or 50 dB SPL than at 60 dB SPL (Fig. 15C). In 30% of the cells, predictions were poor (r < 0.3), which in case of the vocalization responses might be explained by considering their BFs. Two cells had BFs above 10 kHz and were narrowly tuned, and, because the vocalizations did not contain such high frequencies, the cells did not respond well to them. Two other cells had BFs below 400 Hz, and, because the ripples lacked energy below 250 Hz, their STRF might not have been estimated well.
Figure 15.
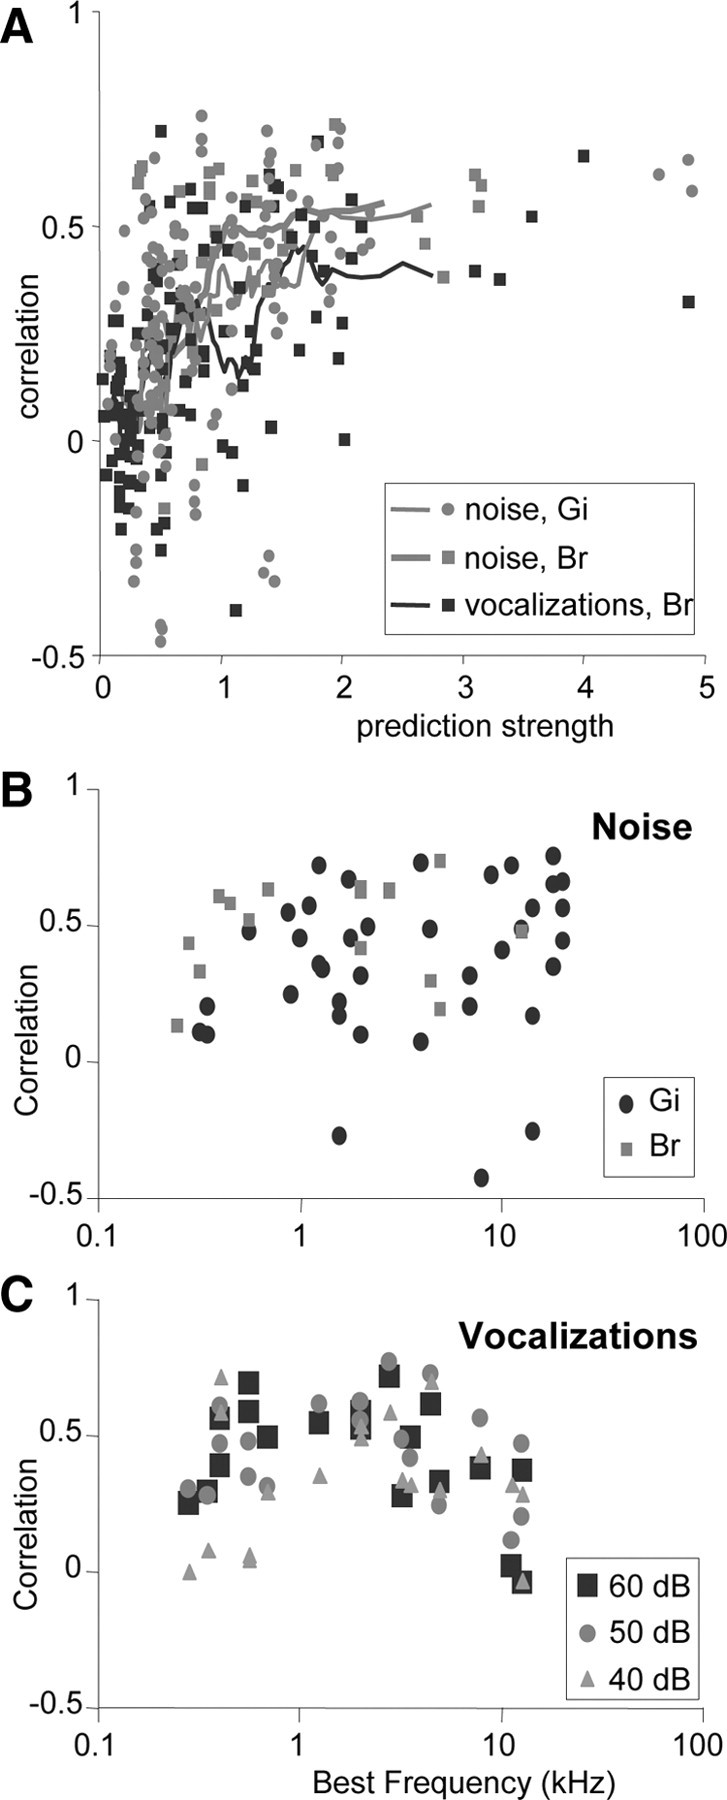
Correlations of predicted with recorded responses. A, Correlations versus strength of predicted response. The prediction strength is computed by taking the root mean square of the predicted response (which is both positive and negative; see black curves in Fig. 14). The curves represent running averages over 12 data points. Sound levels of noise and vocalizations were 60 dB SPL. Responses to three different noise samples were recorded in 44 cells in Gi and 16 cells in Br; responses to six different vocalizations were recorded in 19 cells in Br. B, Correlations versus BF of the neuron for 60 IC neurons in monkey Gi (circles; n = 44) and Br (squares; n = 16). For each neuron, the largest of correlations found for three different noise stimuli at 60 dB SPL is shown. C, Correlations versus BF for vocalization responses for 19 IC neurons in monkey Br. For each neuron, the largest of correlations found for six different vocalizations at three sound levels (40, 50, and 60 dB SPL) is shown.
Discussion
IC neurons in alert monkey reveal various response properties that are similar to those reported in mammalian A1: (1) a wide diversity of selectivity to ripple densities and velocities (Fig. 4); (2) quadrant separability in nearly all neurons, full separability in a majority of the neurons (Fig. 9); and (3) in many neurons, responses to dynamic broadband sounds can be linearly predicted with the STRF (Fig. 15). In addition, we found that most neurons prefer dynamic ripples above amplitude-modulated noise (Fig. 5), and, in contrast to cortical data, we found temporal asymmetry in case of directional selectivity (Fig. 11C).
General characteristics
Two previous studies applied ripple stimuli to derive STRFs of IC neurons and reported that most neurons (52–75%) phase lock to ripples (anesthetized cat, Escabí and Schreiner, 2002; awake, not alert bat, Andoni et al., 2007). A substantial fraction of neurons, however, did not phase lock or responded to few ripples only. In the alert macaque, 90% of neurons had good phase locking to ripples. These differences could be attributable to the applied range of ripple densities and velocities, to differences in recording sites within the IC, to species, or to the state of the animal.
Recordings in IC and cortex have shown a strong correspondence between BFs derived from STRFs and tone responses (Fig. 6) (Kowalski et al., 1996a; Versnel and Shamma, 1998; Escabí and Schreiner, 2002; Andoni et al., 2007). This correspondence reveals a linear component in the neural responses, which is further corroborated by our linear predictions (Figs. 13–15) (see below).
The distribution of the best ripple density, ΩB, shows a predominant preference <1 cyc/oct (Fig. 4B) and is similar to results from IC, thalamus, and A1 in anesthetized animals (Shamma et al., 1995; Kowalski et al., 1996a; Versnel and Shamma, 1998; Escabí and Schreiner, 2002; Miller et al., 2002). Thus, ripple density selectivity is likely passed on from IC to A1 and is not substantially affected by anesthesia. The preference for low ripple densities was also reported for human auditory cortex (Langers et al., 2003) and human psychophysics (Chi et al., 1999).
IC neurons are tuned to amplitude modulations over a wide range of modulation frequencies (Rees and Møller, 1983; Langner and Schreiner, 1988; Rees and Langner, 2005). The current study suggests that the synchronization AM transfer function of an IC neuron can be regarded as one slice of its spectrotemporal transfer function (at Ω = 0). A preference for AM noise above dynamic ripples corresponds to broad frequency tuning (Fig. 3D). A preference for dynamic ripples, which corresponds to narrow frequency tuning (Fig. 3A–C), was found for most neurons (Fig. 5). Thus, IC neurons might be regarded as spectrotemporal filters rather than as temporal filters.
The range of preferred ripple velocities decreases from IC to cortex (Escabí and Schreiner, 2002; Miller et al., 2002) similar to what is known from AM studies. The percentage of neurons preferring 40 Hz or higher (Fig. 10) was ∼20%, which is somewhat less than in cat IC (Escabí and Schreiner, 2002). This difference may be explained by missed tuning to high velocities because of the range of ripple velocities routinely used. The velocity–density space is well covered by our sample of IC neurons (Figs. 3, 4D), implying that IC can process sound features over at least the entire two-dimensional range of 0–1 cyc/oct and up to 40 Hz.
The phase functions of the transfer function were linear in each quadrant as observed previously for ferret A1. The phase constants derived from these phase relations are descriptors of the STRF, indicating asymmetries in excitatory and inhibitory bands around BF. We found similar distributions for the temporal and spectral phase constants as reported for ferret A1 (Kowalski et al., 1996a; Depireux et al., 2001).
Separability and direction selectivity
In A1 of anesthetized mammals, STRFs are inseparable for a minority (20–40%) of neurons (ferret, Depireux et al., 2001; Simon et al., 2007; cat, Miller et al., 2002; mouse, Linden et al., 2003). The inseparability is caused by an asymmetry between responses to the two directions because transfer functions that correspond to the inseparable STRFs are mostly quadrant separable (Kowalski et al., 1996a; Depireux et al., 2001; Linden et al., 2003; Simon et al., 2007). Our sample of STRFs had similar characteristics; 71% of the neurons had fully separable STRFs, and most of the inseparable STRFs were quadrant separable. This similarity might be the result of two counterbalancing effects. First, inseparability increases from IC to A1 as indicated by evidence based on directional selectivity to FM sweeps (Felsheim and Ostwald, 1996). Second, inseparable STRFs are more often encountered in awake than in anesthetized preparations (Simon et al., 2007). It should be noted that, in mammals specialized to certain sounds, the organization of separability may differ substantially. For example, directional selectivity is clearly present in bat IC (Andoni et al., 2007) and thus to a much larger extent than in monkey IC.
Interestingly, when the response depended on direction, not only its amplitude differed but also its temporal phase (Fig. 11C). The longer delay for the preferred direction can be explained as follows. Suppose a neuron prefers an upsweeping frequency (Fig. 3C). Then, when frequency sweeps up, the neuron responds well when it is excited late by early appearing low frequencies and excited early by late appearing high frequencies, giving rise to a late response. The difference in group delays indicates temporal asymmetry in monkey IC STRFs. This property differs from STRFs of ferret A1, which are characterized by temporal symmetry, in both anesthetized and awake conditions (Simon et al., 2007). Moreover, these authors demonstrate that, to obtain temporal symmetry in cortex, fully separable STRFs are required at subcortical stages, which we encountered for 71% of the IC cells (Fig. 9B).
Predictions and linearity
When a large response is expected, i.e., when the spectrotemporal features of the sound stimulus match the STRF of the neuron (much energy around BF, little energy in inhibitory areas, speed, and direction of frequency transitions according to preferred modulation and direction) (deCharms et al., 1998), the temporal response pattern is typically predicted well (Fig. 15A). When weak responses are expected, the predictions vary from poor to good, which is probably a result of low signal-to-noise ratio in the STRF and/or response. The predictions are useful to interpret specific temporal response patterns. For instance, the noise responses depicted in Figure 14, A and B, were distinct, one being sustained (A) and the other more phasic (B). The STRF in Figure 14A is narrow, both spectrally and temporally, which allows the neuron to respond predominantly to spectral events in the noise around BF of 1.2 kHz. The STRF in Figure 14B is broad and multipeaked, and consequently the neuron responds to the noise rather indiscriminately. The first 40 ms of the STRF is excitatory, and therefore the noise response shows an early peak lasting ∼40 ms. Thereafter, inhibition and excitation mostly cancel the response, and, after stimulus offset, the late inhibitory part of the STRF dominates the response. The vocalizations obviously possess various specific spectrotemporal features that causes neurons to respond in a quasi-sustained manner (Fig. 14C,D).
The picture emerging from experiments in auditory cortex applying the STRF method is that most neurons in auditory cortex behave linearly in their responses to broadband sounds. This was shown in anesthetized ferrets for responses to superpositions of ripples (Kowalski et al., 1996b; Klein et al., 2006) and in anesthetized ferrets and cats for responses to virtual acoustic space stimuli (Jenison et al., 2001; Schnupp et al., 2001). deCharms et al. (1998) predicted optimal stimuli to drive neurons in awake behaving owl monkeys. Theunissen et al. (2000) showed in anesthetized zebra finches that responses to natural sounds (conspecific songs) are well predicted by Equation 9 when the STRF is based on responses to similar sounds. The extent of linearity decreases when test stimuli increasingly deviate from stimuli used to derive STRFs (Versnel and Shamma, 1998; Theunissen et al., 2000). The present data, together with those of Andoni et al. (2007) and Lesica and Grothe (2008), indicate that responses can be predicted on the basis of STRFs similarly well in IC as in A1.
However, our finding that correlations fell below 0.6 suggests that neural responses in IC are not fully determined by the STRF and the stimulus spectrogram. An important acoustic parameter that modulates IC responses, but is not captured by the STRF, is sound level. As a result, cells characterized by non-monotonic level-response behavior yielded better predictions for low than for high sound levels. We used a moderate fixed level to obtain STRFs, but the STRF might differ at high levels (gerbil IC, Lesica and Grothe, 2008). Another point to be considered is that the neuron might respond to features in the vocalization as higher-order correlations (Atencio et al., 2008), which are not captured by the ripple responses.
Several non-acoustic factors may also change IC cell responses. The state of the animal (anesthetic, alertness) is one such factor (Ryan and Miller, 1977; Populin, 2005). Moreover, changes in eye position can weakly modulate IC activity (Groh et al., 2001; Zwiers et al., 2004), whereas Metzger et al. (2006) observed relatively late response modulations related to task constraints. The origin of these modulations is unknown. Interestingly, Brosch et al. (2005) demonstrated responses in monkey AI and cortical belt that were synchronized to non-acoustic behaviorally relevant events. It would therefore be of interest to assess whether task-related modulations of cortical and IC responses are causally related, in particular their spectrotemporal tuning, spectral–temporal separability, and response linearity.
Footnotes
This research was supported by the Netherlands Organization for Scientific Research (NWO) [NWO-ALW Grant 809.37.002 (H.V.), NWO-Aard- en Levenswetenschappen/Vici Grant 805.05.003 (A.J.v.O.)], the Nijmegen Institute for Cognition and Information (M.P.Z.), the Human Frontiers Science Program Grant RG 0174-1998/B (M.P.Z., H.V.), and the Radboud University Nijmegen (A.J.v.O.). We thank G. van Lingen, H. Kleijnen, and T. Van Dreumel for technical assistance and F. Philipsen, A. Hanssen, F. van Munsteren, and T. Peters of the central animal facility (Central Dierenlaboratorium) for taking excellent care of our monkeys. We are grateful to Dr. F. van der Werf (Department of Neuroscience, Erasmus University Rotterdam, Rotterdam, The Netherlands) for performing the histology.
References
- Andoni S, Li N, Pollak GD. Spectrotemporal receptive fields in the inferior colliculus revealing selectivity for spectral motion in conspecific vocalizations. J Neurosci. 2007;27:4882–4893. doi: 10.1523/JNEUROSCI.4342-06.2007. [DOI] [PMC free article] [PubMed] [Google Scholar]
- Atencio CA, Sharpee TO, Schreiner CE. Cooperative nonlinearities in auditory cortical neurons. Neuron. 2008;58:956–966. doi: 10.1016/j.neuron.2008.04.026. [DOI] [PMC free article] [PubMed] [Google Scholar]
- Bour LJ, van Gisbergen JA, Bruijns J, Ottes FP. The double magnetic induction method for measuring eye movement: results in monkey and man. IEEE Trans Biomed Eng. 1984;31:419–427. doi: 10.1109/TBME.1984.325281. [DOI] [PubMed] [Google Scholar]
- Brosch M, Selezneva E, Scheich H. Nonauditory events of a behavioral procedure activate auditory cortex of highly trained monkeys. J Neurosci. 2005;25:6797–6806. doi: 10.1523/JNEUROSCI.1571-05.2005. [DOI] [PMC free article] [PubMed] [Google Scholar]
- Chi T, Gao Y, Guyton MC, Ru P, Shamma S. Spectro-temporal modulation transfer functions and speech intelligibility. J Acoust Soc Am. 1999;106:2719–2732. doi: 10.1121/1.428100. [DOI] [PubMed] [Google Scholar]
- deCharms RC, Blake DT, Merzenich MM. Optimizing sound features for cortical neurons. Science. 1998;280:1439–1443. doi: 10.1126/science.280.5368.1439. [DOI] [PubMed] [Google Scholar]
- Depireux DA, Simon JZ, Klein DJ, Shamma SA. Spectro-temporal response field characterization with dynamic ripples in ferret primary auditory cortex. J Neurophysiol. 2001;85:1220–1234. doi: 10.1152/jn.2001.85.3.1220. [DOI] [PubMed] [Google Scholar]
- Ehret G, Schreiner CE. Spectral and intensity coding in the auditory midbrain. In: Winer JA, Schreiner CE, editors. The inferior colliculus. New York: Springer; 2005. pp. 312–345. [Google Scholar]
- Elhilali M, Fritz JB, Klein DJ, Simon JZ, Shamma SA. Dynamics of precise spike timing in primary auditory cortex. J Neurosci. 2004;24:1159–1172. doi: 10.1523/JNEUROSCI.3825-03.2004. [DOI] [PMC free article] [PubMed] [Google Scholar]
- Epping WJ, Eggermont JJ. Coherent neural activity in the auditory midbrain of the grassfrog. J Neurophysiol. 1987;57:1464–1483. doi: 10.1152/jn.1987.57.5.1464. [DOI] [PubMed] [Google Scholar]
- Escabi MA, Schreiner CE. Nonlinear spectrotemporal sound analysis by neurons in the auditory midbrain. J Neurosci. 2002;22:4114–4131. doi: 10.1523/JNEUROSCI.22-10-04114.2002. [DOI] [PMC free article] [PubMed] [Google Scholar]
- Felsheim C, Ostwald J. Responses to exponential frequency modulations in the rat inferior colliculus. Hear Res. 1996;98:137–151. doi: 10.1016/0378-5955(96)00078-0. [DOI] [PubMed] [Google Scholar]
- Frens MA, Van Opstal AJ. Visual-auditory interactions modulate saccade-related activity in monkey superior colliculus. Brain Res Bull. 1998;46:211–224. doi: 10.1016/s0361-9230(98)00007-0. [DOI] [PubMed] [Google Scholar]
- Garcia-Lazaro JA, Ahmed B, Schnupp JWH. Tuning to natural stimulus dynamics in primary auditory cortex. Curr Biol. 2006;16:264–271. doi: 10.1016/j.cub.2005.12.013. [DOI] [PubMed] [Google Scholar]
- Groh JM, Trause AS, Underhill AM, Clark KR, Inati S. Eye position influences auditory responses in primate inferior colliculus. Neuron. 2001;29:509–518. doi: 10.1016/s0896-6273(01)00222-7. [DOI] [PubMed] [Google Scholar]
- Groh JM, Kelly KA, Underhill AM. A monotonic code for sound azimuth in primate inferior colliculus. J Cogn Neurosci. 2003;15:1217–1231. doi: 10.1162/089892903322598166. [DOI] [PubMed] [Google Scholar]
- Jenison RL, Schnupp JW, Reale RA, Brugge JF. Auditory space-time receptive field dynamics revealed by spherical white-noise analysis. J Neurosci. 2001;21:4408–4415. doi: 10.1523/JNEUROSCI.21-12-04408.2001. [DOI] [PMC free article] [PubMed] [Google Scholar]
- Klein DJ, Simon JZ, Depireux DA, Shamma SA. Stimulus-invariant processing and spectrotemporal reverse correlation in primary auditory cortex. J Comput Neurosci. 2006;20:111–136. doi: 10.1007/s10827-005-3589-4. [DOI] [PubMed] [Google Scholar]
- Knudsen EI, Konishi M. A neural map of auditory space in the owl. Science. 1978;200:795–797. doi: 10.1126/science.644324. [DOI] [PubMed] [Google Scholar]
- Kowalski N, Depireux DA, Shamma SA. Analysis of dynamic spectra in ferret primary auditory cortex. I. Characteristics of single-unit responses to moving ripple spectra. J Neurophysiol. 1996a;76:3503–3523. doi: 10.1152/jn.1996.76.5.3503. [DOI] [PubMed] [Google Scholar]
- Kowalski N, Depireux DA, Shamma SA. Analysis of dynamic spectra in ferret primary auditory cortex. II. Prediction of unit responses to arbitrary dynamic spectra. J Neurophysiol. 1996b;76:3524–3534. doi: 10.1152/jn.1996.76.5.3524. [DOI] [PubMed] [Google Scholar]
- Langers DR, Backes WH, van Dijk P. Spectrotemporal features of the auditory cortex: the activation in response to dynamic ripples. Neuroimage. 2003;20:265–275. doi: 10.1016/s1053-8119(03)00258-1. [DOI] [PubMed] [Google Scholar]
- Langner G, Schreiner CE. Periodicity coding in the inferior colliculus of the cat. I. Neuronal mechanisms. J Neurophysiol. 1988;60:1799–1822. doi: 10.1152/jn.1988.60.6.1799. [DOI] [PubMed] [Google Scholar]
- Langner G, Albert M, Briede T. Temporal and spatial coding of periodicity information in the inferior colliculus of awake chinchilla (Chinchilla laniger) Hear Res. 2002;168:110–130. doi: 10.1016/s0378-5955(02)00367-2. [DOI] [PubMed] [Google Scholar]
- Lesica NA, Grothe B. Dynamic spectrotemporal feature selectivity in the auditory midbrain. J Neurosci. 2008;28:5412–5421. doi: 10.1523/JNEUROSCI.0073-08.2008. [DOI] [PMC free article] [PubMed] [Google Scholar]
- Linden JF, Liu RC, Sahani M, Schreiner CE, Merzenich MM. Spectrotemporal structure of receptive fields in areas AI and AAF of mouse auditory cortex. J Neurophysiol. 2003;90:2660–2675. doi: 10.1152/jn.00751.2002. [DOI] [PubMed] [Google Scholar]
- Mendelson JR, Cynader MS. Sensitivity of cat primary auditory cortex (AI) neurons to the direction and rate of frequency modulation. Brain Res. 1985;327:331–335. doi: 10.1016/0006-8993(85)91530-6. [DOI] [PubMed] [Google Scholar]
- Metzger RR, Greene NT, Porter KK, Groh JM. Effects of reward and behavioral context on neural activity in the primate inferior colliculus. J Neurosci. 2006;26:7468–7476. doi: 10.1523/JNEUROSCI.5401-05.2006. [DOI] [PMC free article] [PubMed] [Google Scholar]
- Miller LM, Escabí MA, Read HL, Schreiner CE. Spectrotemporal receptive fields in the lemniscal auditory thalamus and cortex. J Neurophysiol. 2002;87:516–527. doi: 10.1152/jn.00395.2001. [DOI] [PubMed] [Google Scholar]
- Palmer AR, Kuwada S. Binaural and spatial coding in the inferior colliculus. In: Winer JA, Schreiner CE, editors. The inferior colliculus. New York: Springer; 2005. pp. 377–410. [Google Scholar]
- Populin LC. Anesthetics change the excitation/inhibition balance that governs sensory processing in the cat superior colliculus. J Neurosci. 2005;25:5903–5914. doi: 10.1523/JNEUROSCI.1147-05.2005. [DOI] [PMC free article] [PubMed] [Google Scholar]
- Rees A, Langner G. Temporal coding in the auditory midbrain. In: Winer JA, Schreiner CE, editors. The inferior colliculus. New York: Springer; 2005. pp. 346–376. [Google Scholar]
- Rees A, Møller AR. Responses of neurons in the inferior colliculus of the rat to AM and FM tones. Hear Res. 1983;10:301–330. doi: 10.1016/0378-5955(83)90095-3. [DOI] [PubMed] [Google Scholar]
- Robinson DA. Eye movements evoked by collicular stimulation in the alert monkey. Vision Res. 1972;12:1795–1808. doi: 10.1016/0042-6989(72)90070-3. [DOI] [PubMed] [Google Scholar]
- Ryan A, Miller J. Effects of behavioral performance on single-unit firing patterns in inferior colliculus of the rhesus monkey. J Neurophysiol. 1977;40:943–956. doi: 10.1152/jn.1977.40.4.943. [DOI] [PubMed] [Google Scholar]
- Ryan A, Miller J. Single unit responses in the inferior colliculus of the awake and performing rhesus monkey. Exp Brain Res. 1978;32:389–407. doi: 10.1007/BF00238710. [DOI] [PubMed] [Google Scholar]
- Schnupp JW, Mrsic-Flogel TD, King AJ. Linear processing of spatial cues in primary auditory cortex. Nature. 2001;414:200–204. doi: 10.1038/35102568. [DOI] [PubMed] [Google Scholar]
- Schreiner CE, Langner G. Laminar fine structure of frequency organization in auditory midbrain. Nature. 1997;388:383–386. doi: 10.1038/41106. [DOI] [PubMed] [Google Scholar]
- Shamma SA, Versnel H, Kowalski N. Ripple analysis in ferret primary auditory cortex. I. Response characteristics of single units to sinusoidally rippled spectra. Aud Neurosci. 1995;1:233–254. [Google Scholar]
- Simon JZ, Depireux DA, Klein DJ, Fritz JB, Shamma SA. Temporal symmetry in primary auditory cortex: implications for cortical connectivity. Neural Comput. 2007;19:583–638. doi: 10.1162/neco.2007.19.3.583. [DOI] [PubMed] [Google Scholar]
- Snider RS, Lee JC. Chicago: University of Chicago; 1961. A sterotaxic atlas of the monkey brain (Macaca mulatta) [Google Scholar]
- Sparks DL. Translation of sensory signals into commands for control of saccadic eye movements: role of primate superior colliculus. Physiol Rev. 1986;66:118–171. doi: 10.1152/physrev.1986.66.1.118. [DOI] [PubMed] [Google Scholar]
- Theunissen FE, Sen K, Doupe AJ. Spectral-temporal receptive fields of nonlinear auditory neurons obtained using natural sounds. J Neurosci. 2000;20:2315–2331. doi: 10.1523/JNEUROSCI.20-06-02315.2000. [DOI] [PMC free article] [PubMed] [Google Scholar]
- Versnel H, Shamma SA. Spectral-ripple representation of steady-state vowels in primary auditory cortex. J Acoust Soc Am. 1998;103:2502–2514. doi: 10.1121/1.422771. [DOI] [PubMed] [Google Scholar]
- Zwiers MP, Versnel H, Van Opstal AJ. Involvement of monkey inferior colliculus in spatial hearing. J Neurosci. 2004;24:4145–4156. doi: 10.1523/JNEUROSCI.0199-04.2004. [DOI] [PMC free article] [PubMed] [Google Scholar]


