

Abstract
Traditionally, the calyx of Held synapse is viewed as a highly reliable relay in the sound localization circuit of the auditory brainstem, with every presynaptic action potential triggering a postsynaptic action potential in vivo. However, this view is at odds with slice recordings that report large short-term depression (STD). To investigate the reliability and precision of this synapse, we compared slice and in vivo recordings from medial nucleus of the trapezoid body neurons of young adult mice. We show that the extracellularly recorded complex waveform can be used to estimate both presynaptic release and postsynaptic excitability. Whereas under standard slice conditions the synapse underwent large STD, both extracellular and whole-cell recordings indicated that in vivo the size of the EPSPs was independent of recent history. The estimated quantal content was typically <20 in vivo, much lower than in the resting synapse under standard slice conditions. However, due to the large quantal size and summation of EPSPs, the safety factor of this synapse was generally still sufficiently large and postsynaptic failures were observed only infrequently in vivo. When present, failures were typically due to stochastic fluctuations in EPSP size or postsynaptic spike depression. In vivo, the calyx of Held synapse thus functions as a tonic synapse. The price it pays for its low release probability is an increase in jitter and synaptic latency and occasional postsynaptic failures.
Introduction
For sound localization, mice mainly rely on the analysis of interaural intensity differences by the lateral superior olive, which receives an ipsilateral, excitatory projection from the cochlear nucleus and a contralateral, inhibitory projection from the medial nucleus of the trapezoid body (MNTB) (Tollin, 2003). Each principal cell in the MNTB is contacted by a single, giant terminal, called the calyx of Held, which originates from a globular bushy cell of the anteroventral cochlear nucleus (AVCN). Because of the giant size of the calyx of Held, it is possible to record simultaneously the presynaptic and the postsynaptic spike during extracellular in vivo recordings (Guinan and Li, 1990). Measurements of these so-called complex waveforms have led to remarkably disparate conclusions about the reliability of the calyx of Held synapse, ranging from a safe relay that never fails (Mc Laughlin et al., 2008), to a synapse that fails to elicit a postsynaptic spike only at very high frequencies (Guinan and Li, 1990), or even to a frequently failing synapse (Kopp-Scheinpflug et al., 2003, 2008b). Part of this disagreement may be technical, as Mc Laughlin et al. (2008) provided evidence that failures observed earlier (Kopp-Scheinpflug et al., 2003) were actually due to contamination with a second unit.
Although challenged, the view of the calyx of Held synapse as a frequently failing synapse fits well with the many slice studies that show prominent short-term depression (STD) (for review, see von Gersdorff and Borst, 2002; Neher and Sakaba, 2008). Although the calyx can speed up the recovery of the readily releasable pool (RRP) during high-frequency stimulation via a calcium-dependent mechanism (Wang and Kaczmarek, 1998; Hosoi et al., 2007), full recovery from STD takes seconds. This slow component in the recovery has led to the view of this synapse as primarily a “phasic” synapse, a synapse with a large RRP at rest, which is rapidly depleted during high-frequency signaling (Neher and Sakaba, 2008). The high spontaneous frequencies observed in vivo (Kopp-Scheinpflug et al., 2008a) may thus chronically depress this synapse, leading to failures (Hermann et al., 2007, 2009). This hypothesis has not yet been directly tested in vivo, as the contribution of STD has not been studied in previous in vivo intracellular microelectrode studies (Sommer et al., 1993; Smith et al., 1998). Moreover, for technical reasons, many of the slice recordings have been done in animals before the onset of hearing, and at room temperature. It is well known, however, that synaptic transmission is critically dependent upon temperature and the calyx of Held synapse becomes more resistant to STD during development (Taschenberger and von Gersdorff, 2000; Futai et al., 2001; Joshi and Wang, 2002). To test the contribution of STD to precision and reliability of the calyx of Held synapse we therefore systematically compared in vivo and slice recordings from young adult mice. We find that the release probability is much lower in vivo than under standard slice conditions, and that in vivo the calyx of Held synapse functions as a tonic synapse.
Materials and Methods
Methods
Animals.
All experiments were conducted in accordance with the European Communities Council Directive (86/609/EEC) and approved by the animal ethics committee of the Erasmus MC. After brief exposure to isoflurane, a total of 22 young adult C57BL/6 mice (32 ± 2 d postnatal) were injected intraperitoneally with a ketamine–xylazine mixture (65/10 mg/kg). If the animal responded to pinching of the hindlimb with a withdrawal reflex, more ketamine–xylazine was injected intraperitoneally. Rectal temperature was maintained between 36.5 and 37.5°C with a homeothermic blanket system (Stoelting). The MTNB was accessed ventrally as described previously (Rodríguez-Contreras et al., 2008), with minor modifications. Animals were supine positioned, with their heads immobilized by a metal pedestal glued to the dorsal skull. Skin and soft tissue overlaying the trachea were removed. The trachea was intubated and gently pushed to the side. Animals continued breathing independently. The larynx and tissue beneath it were removed to uncover the ventral base of the skull. Based on cranial landmarks and vasculature that became visible when carefully thinning the bone, a 1-mm-diameter craniotomy was drilled, exposing the brain surface above the MNTB. Dura and pia were removed locally. Brain pulsations were reduced by application of agar (agarose 2% in 0.1 m phosphate buffer) or silicone elastomer (World Precision Instruments). Animals from which the recording location was examined histologically were killed at the end of the experiments with a lethal dose of Nembutal, after which they were perfused intracardially with successively saline and a 4% paraformaldehyde solution. Brains were further processed as described by Horikawa and Armstrong (1988) with minor modifications.
In vivo electrophysiology.
Thick-walled borosilicate glass micropipettes with filament (3.5–6 MΩ) were filled with the following (in mm): K-gluconate 125, KCl 20, Na2-phosphocreatine 10, Na2-GTP 0.3, Mg-ATP 4, EGTA 0.5, HEPES 10, pH 7.2. Biocytin (0.5%) was added for histological evaluation of the recording site. The MNTB was approached with high positive pressure, which was lowered at ∼150 μm below the surface to ∼10 mbar for extracellular recordings and 30 mbar for whole-cell recordings. If spikes were observed in the extracellular approach, pressure was slowly released while stepping 2–10 μm forward to isolate the neuron. Gigaohm seals and whole-cell recordings were established using standard techniques (Margrie et al., 2002). Average series resistance was 30 ± 14 MΩ (n = 6). Data were acquired with a MultiClamp 700A patch-clamp amplifier and pCLAMP 9.2 software (MDS Analytical Technologies). Whole-cell potentials were filtered at 10 kHz (eight-pole Bessel filter), while a 100 Hz high-pass digital filter was added for the extracellular recordings. Data were sampled at an interval of 10 μs with a 16-bit A/D converter (Digidata 1322A). Both spontaneous activity of the cell and auditory evoked responses were recorded.
Auditory stimulation.
Closed-field sound stimulation was presented as described previously (Tan and Borst, 2007). Speaker probes were inserted into both ear canals and stabilized with silicone elastomer (Kwik-Cast, WPI). A custom-made program written in MATLAB (version 7.0.4; The MathWorks) controlled auditory stimulus generation with Tucker Davis Technologies hardware (TDT, System 3, RP2.1 processor, PA5.1 attenuator, ED1 electrostatic driver, EC1 electrostatic speaker), which in turn triggered Clampex acquisition. Tones had durations of 50 ms plus a 1 ms rise/decay time. Sound intensities were calibrated between 0.5 and 64 kHz with a condenser microphone (ACO Pacific type 7017, MA3 stereo microphone amplifier, TDT SigCal) as described previously (Tan and Borst, 2007). All in vivo experiments were performed in a single-walled sound-attenuated chamber (Gretch-Ken Industries; attenuation ≥40 dB at 4–32 kHz).
Preparation of slices.
Brain slice preparation from postnatal day 21 (P21)–P36 mice (average age 27 ± 0.5 d), afferent stimulation, and electrophysiological recordings at physiological temperature (35−37°C) were done largely as previously described (Habets and Borst, 2007). Mice were anesthetized with isoflurane and decapitated, and the brainstem was dissected in ice-cold saline containing the following (in mm): 125 NaCl, 2.5 KCl, 3 MgSO4, 0.1 CaCl2, 1.25 NaH2PO4, 0.4 ascorbic acid, 3 myo-inositol, 2 pyruvic acid, 25 d-glucose, 25 NaHCO3 (Merck), pH 7.4. Slices were cut at a thickness of 150 or 200 μm.
Electrophysiological recordings.
Electrophysiological recordings were done in artificial CSF (aCSF) solution with the same composition as the slicing solution, except the concentrations of CaCl2 and MgSO4 were 2 and 1 mm, respectively. If the calcium concentration was lowered to 1.2 or 1.5 mm, it was replaced by equimolar concentrations of MgSO4. After incubation for 30 min at 37°C, slices were transferred in the recording chamber on an upright microscope (BX-50; Olympus). During recording, slices were continuously perfused with carbogenated (95% O2 and 5% CO2) aCSF maintained at physiological temperature (35−37°C).
Axons originating from the AVCN were stimulated at the trapezoid body using a bipolar electrode (FHC) and cells were selected for recording when extracellular recordings indicated postsynaptic action potential (AP) firing (Borst et al., 1995).
Whole-cell voltage and current-clamp and extracellular current-clamp data were acquired using an Axopatch 200B amplifier (MDS Analytical Technologies) with Clampex 8.2 and filtered at 2–10 kHz with a low pass four-pole Bessel filter. For whole-cell recordings borosilicate glass electrodes (2.5–4 MΩ) were filled with the same intracellular solution as described above except that biotin was not included; extracellular electrodes (2.5–6 MΩ) were filled with aCSF. To estimate the size of EPSPs, in some experiments the intracellular solution was supplemented with 5 mm QX-314 (Sigma) to block postsynaptic sodium channels.
Potentials were corrected for a −11 mV junction potential. In voltage-clamp experiments postsynaptic series resistance (<8.5 MΩ) was compensated by 95 to 98% with a lag of 7–10 μs. Although voltage clamp was imperfect in these studies, a simulation of voltage-clamp errors (Traynelis, 1998) suggested that the true depression may have been slightly larger, not smaller (results not shown).
For simultaneous whole-cell and extracellular recordings, the correlation between amplitudes of postsynaptic events in whole-cell voltage or current clamp and extracellular current clamp was calculated from the responses evoked by a 1 s, 500 Hz train. To estimate the time course and magnitude of depression and recovery, the calyces were stimulated with a train of 200 stimuli at 500 Hz followed at different intervals, ranging from 2 ms to 3 s, by a single recovery stimulus. The interval between depression trains with recovery stimuli was 5 s.
In experiments in which QX-314 was used the length of the stimulus train was 200 ms. Only cells with a minimum of three repetitions per configuration/protocol were considered for analysis.
Model.
A three-compartment model of a principal neuron was created with channel properties which were based on a previously published mouse MNTB principal neuron model (Wang et al., 1998) with minor modifications (Table S1, available at www.jneurosci.org as supplemental material).
Extracellular waveforms were calculated as the product of loose patch resistance and membrane current, whereas local field potentials were calculated by summing the point source potentials generated by current in all parts of the model neuron.
The model MNTB neuron included three compartments: soma, dendrite, and axon. Soma was a sphere of diameter 20 μm. Dendrite and axon were cylinders of 50 and 200 μm length and 3 and 2 μm diameters, respectively, oriented 90 degrees with respect to each other. Na-channel voltage dependence and kinetics from the mouse MNTB principal neuron model of Wang et al. (1998) were adjusted to match recordings at physiological temperature in adult animals. Following nomenclature of Wang et al. (1998) the parameters changed were as follows: ηam = 0.027, ηbm = 0.034. This change shifts the midpoint of Na-channel activation by −9 mV so that AP threshold was about −40 mV. The original model (Wang et al., 1998) was based on data recorded at room temperature from neonatal mice (P8–P14). Channel kinetics are generally temperature dependent and in the MNTB, K-channel activation becomes faster during early postnatal development (Nakamura and Takahashi, 2007). To fit action potentials recorded from young adult mice at physiological temperature it was necessary to increase channel kinetics substantially. This was accomplished by scaling the model channel kinetics to 37°C with Q 10 values of 3 for Na and low-threshold (LT) K-channel activation, 2.36 for Na-channel inactivation, and 5 for HT K-channel activation. The hemisphere opposite the axon contained synaptic conductance (reversal potential = 0 mV) given by g(t) = (1 − exp(−t/τ1))(exp(−t/τ2)), with τ1 = 0.1, τ2 = 0.16 ms. All segments also contained a passive leak conductance of 0.4 mS/cm2. Na+ and K+ reversal potentials were set to the calculated Nernst equilibrium potentials of 51 and −105 mV, respectively, based on the pipette solution used for whole-cell recordings and the aCSF composition. Reversal potential of the passive leak conductance was adjusted to give a resting potential of −70 mV. Na and K conductances were adjusted by hand until the overall shape of the action potential (maximum/minimum dV/dt during depolarization/repolarization, peak amplitude) approximated measured values.
The global extracellular potential resulting from current flow throughout the neuron was based on the assumption that small segments of membrane generate point source potentials proportional to membrane current, the extracellular resistivity (300 Ω · cm), and inversely proportional to the straight-line distance from recording site (Pettersen and Einevoll, 2008).
To model the potential recorded in a loose-seal configuration, we used two approaches. The first method assumed that the extracellular potential can be decomposed into the sum of resistive and capacitive coupling to the membrane potential. That is, the recorded potential is proportional to the weighted sum of V m and its first derivative. We shall refer to the weights as resistive and capacitive coupling constants, respectively. Resistive and capacitive coupling constants obtained from eight paired intracellular and extracellular recordings of action potentials were 25 ± 5 mV/V and 7.0 ± 0.85 μV/V/s, respectively. Note that these values were obtained by fitting the AP part of the EPSP/AP waveform. These values were used to calculate the extracellular potential. The second approach was to assume that the loose-seal recording is proportional to current (ionic and capacitive) through a patch of soma membrane. We modeled three configurations: uniform channel distribution, reduced Na channels in the soma, and reduced Na and LT K channels in the soma.
Analysis
Analysis was done in Clampfit (MDS Analytical Technologies) or by using custom procedures written in the NeuroMatic environment (version 2.00, kindly provided by Dr. J. Rothman, University College London, London, UK) within Igor Pro 6 (WaveMetrics).
Recovery from depression.
To estimate the baseline of the evoked EPSCs, a double exponential was fitted to the decay of each EPSC. The time constants were obtained from the fit to the average of all sweeps in each cell. The value of the fitted curve at the peak of the next EPSC was taken as the baseline.
Both depression and recovery of synaptic events were fitted with the sum of two exponential functions as follows:
where S is the amplitude of the synaptic event, S ∞ is its amplitude at t = ∞, and A 1 and A 2 are the amplitudes of the contribution of time constants τ1 and τ2, respectively. When calculating charge integrals, changes in the baseline current during the train were neglected.
In vivo patterns.
AP delays in slice recordings are measured between the start of the stimulus and the point at which the rate of rise of the EPSP or the AP was maximal. Jitter is defined as the SD of this value. A scaled, averaged stimulus artifact was subtracted before analysis.
Criteria for acceptance of extracellular data.
Signal-to-noise ratio (S/R) for in vivo extracellular recordings was calculated as the amplitude of the extracellular AP (eAP) divided by the SD of the baseline noise, which was estimated from a region of the trace without events; S/R had to be >35 to allow reliable waveform analysis (average 79 ± 23; n = 18). The resulting S/R for the EPSP detection was on average 21 ± 9 (minimum 9). Extracellular recordings in which superposition of spikes indicated multiunit activity (Mc Laughlin et al., 2008) were excluded. Whole-cell recordings had a resting potential more negative than −50 mV, with APs exceeding 20 mV. All in vivo recordings reported in this paper showed evidence for the presence of a prespike.
Waveform analysis.
Complex extracellular waveforms were analyzed with a custom written program, which calculated the peak and maximal rate of rise of the extracellular EPSP (eEPSP) and eAP. In each in vivo recording, >1000 complex waveforms were analyzed (average 9572 ± 5580; n = 24), with the exception of one extracellular recording with very low spontaneous activity (87 waveforms). Whole-cell data were differentiated and subsequently analyzed as the extracellular data. Complex extracellular waveforms were identified on a first-derivative threshold criterion. Its level and the minimally acceptable interval were adjusted to ensure that each complex waveform was captured only once. AP failures were identified on a threshold criterion in the repolarization rate. For suprathreshold EPSPs, the algorithm tried to find a point at which eEPSP and eAP could be separated. This so-called inflection point was either a local minimum of the second derivative or the point at which the second derivative crossed zero, whichever was found first going back in time from the peak of the eAP. A local maximum located at or before the inflection point was the eEPSP amplitude. The program allowed for differential digital Gaussian filtering for complex waveform detection, for analysis of the amplitude of eEPSPs and eAPs, and for analysis of the location of the prespike. In cells in which the inflection point was more subtle, the waveforms were interpolated with a cubic spline to a final resolution of 1 μs. Failures were identified by their slower repolarization rate. Analysis of whole-cell data was the same as for the extracellular data, except membrane potentials were first differentiated. Numerical differentiation was done using the central method.
Quantal analysis.
Spontaneous events in whole-cell currents or differentiated membrane potentials were identified using the template method provided with Clampfit, aligned to the rising phase, and averaged. Dividing the maximum rate of rise of the compound EPSPs by the maximum rate of rise of the spontaneous events yielded the quantal content.
AP depression.
The relation between the size of the eAP or the maximum rate of rise of the intracellular AP (iAP′) and inter-AP interval was fitted with a simple resource depletion model that was based on the model for short-term synaptic depression of Varela et al. (1997). In its most complex form, the normalized eAP or iAP′ amplitude depended on the availability of two factors, D 1 and D 2; both were constrained to be between 0 and 1. With each action potential, the two factors depleted with respective fractions d 1 and d 2, which were also constrained to be between 0 and 1 as follows:
 |
where i has a value of 1 or 2 and indicates the index of the resource or the depletion fraction. Following the spike, after a delay both resources recovered exponentially from depletion with time constant τ as follows:
 |
The delay was needed because interspike intervals were based on a threshold criterion in the rising phase, whereas recovery from depression does not start until AP repolarization.
The different resources (D 1, D 2) had different depletion fractions (d 1, d 2) and recovery time constants (τWaselusD1, τD2). The amplitude A of the eAP or the iAP′ depended in a multiplicative manner on the availability of the two resources as follows:
where A max is the amplitude of the eAP in the absence of depletion of the resources. All amplitudes from a given experiment were fit at once to incorporate the effects of cumulative inactivation. Fits were evaluated by plotting predicted against measured sizes to look for systematic deviations.
Statistical analysis.
Data are given as mean ± SE. Differences between two means were assessed by Student's t test; with more than two groups univariate ANOVA was used, followed by Tukey's post hoc test for pairwise differences. The significance level was set at 0.05.
Results
Spike failures at the calyx of Held synapse
To test the reliability of the calyx of Held synapse, we recorded from the MNTB of anesthetized mice using a ventral approach. Well-isolated single units displayed complex waveforms (Fig. 1 A,B), whose shape matched previous recordings with good signal-to-noise ratio in cats (Guinan and Li, 1990; Mc Laughlin et al., 2008) or gerbils (Green and Sanes, 2005; Hermann et al., 2007). The spontaneous frequency of these events was on average 71 ± 11 Hz (n = 18), but varied considerably between units (range 0.4–174 Hz). The spontaneous frequency generally did not change during approach or retraction of the pipette, and was typically stable for long periods (>15 min), suggesting that high spontaneous rates were not due to damage induced by the pipette. Cells responded to contralateral (n = 18), but not ipsilateral (14 of 14 cells) sound stimulation. During 80 dB tones at the characteristic frequency, which ranged from 3 to 32 kHz, firing frequency increased to 352 ± 34 Hz (n = 16). Histological confirmation that recordings were made from MNTB was obtained in five experiments. We conclude that the general properties of these units matched previous descriptions of extracellular recordings from the MNTB.
Figure 1.
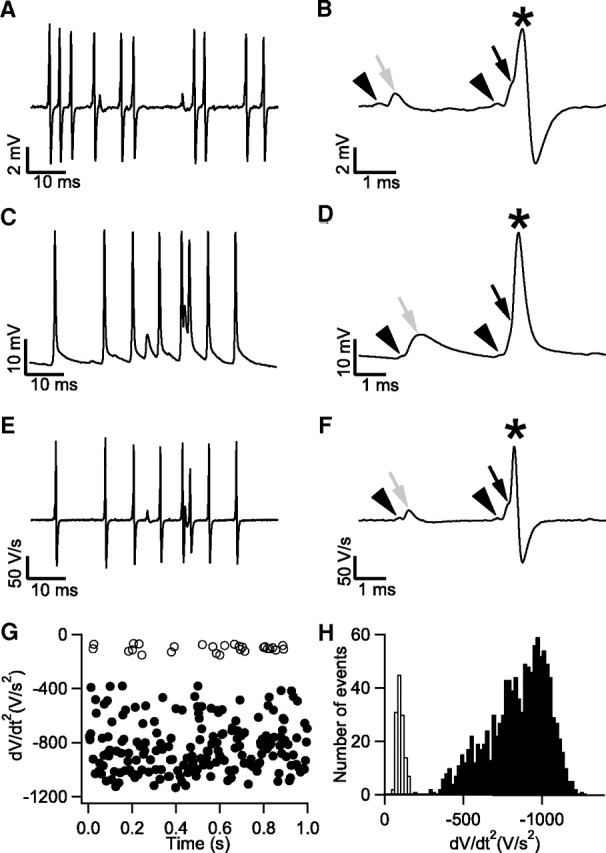
Spike failures in the adult mouse MNTB during in vivo extracellular and whole-cell recordings. A, Spontaneous activity during extracellular recording. B, part of A shown at higher time resolution containing two complex waveforms. Black arrowheads indicate prespikes, black arrow indicates suprathreshold eEPSP, gray arrow indicates subthreshold eEPSP, and star indicates eAP. C, Spontaneous activity of a principal cell recorded in whole-cell configuration. D, part of C containing a subthreshold (gray arrow) and a suprathreshold EPSP (black arrow). Prespikes are marked by the arrowheads, and the action potential is marked by a star. E, First derivative of traces shown in C. F, First derivative of traces shown in D. Note the resemblance with the extracellular waveform from the recording shown in B. G, The minimum of the second derivative during the repolarization phase of the membrane potential was much smaller for subthreshold EPSPs (open circles) than for action potentials (closed circles). H, Histogram illustrating the difference in minimum second derivative between subthreshold EPSPs (open bars) and action potentials (closed bars).
The complex waveforms consisted of two positive brief deflections, which have previously been shown to originate from the calyx of Held and the principal cell, respectively (Guinan and Li, 1990). Delay between the two positive peaks was 0.5 ± 0.05 ms (n = 8). The size of the first component (Fig. 1 B, arrowheads) ranged from 0.1 to 0.5 mV, and the average size of the second component ranged from 1.7 to 8.3 mV between units. The second component generally contained an inflection in its rising phase (Fig. 1 B, black arrow) which may reflect the delayed triggering of an action potential in the principal cell by a calyceal EPSP (Guinan and Li, 1990). We never observed evidence for the presence of an isolated first or second component, suggesting that complete failures of release do not exist in vivo and that all postsynaptic spikes are triggered by a calyceal EPSP, although additional contributions from noncalyceal EPSPs cannot be excluded. Sometimes, the inflection point was absent and the second component was much smaller, suggesting the presence of postsynaptic spike failures (Fig. 1 B, gray arrow).
Because the presence of postsynaptic spike failures in the MNTB is controversial, as discussed in the Introduction, we addressed this issue as directly as possible by making in vivo whole-cell recordings from the principal cells of the MNTB (Fig. 1 C,D). Spontaneous frequencies and responses to sound were similar in extracellular and whole-cell recordings. Principal cells had resting membrane potentials of −61 ± 3 mV (n = 6), a membrane resistance of 76 ± 5 MΩ and showed spontaneous action potentials that were triggered by large EPSPs. Action potential threshold was approximately −54 ± 2 mV. We did not observe evidence for the presence of IPSPs, although small IPSPs may have been missed due to small driving force for chloride ions (Tan and Borst, 2007). Action potentials lacked an undershoot in 4 of 6 recordings, but following high-frequency activity each cell had an afterhyperpolarization (Banks and Smith, 1992; Sommer et al., 1993), which was on average −2.1 ± 0.4 mV. Close inspection of the period before the spike showed a small, brief depolarization in these cells, whose latency, amplitude and time course indicated that it was the prespike, the capacitively coupled action potential of the calyx of Held (Fig. 1 D,F, arrowhead) (Forsythe, 1994). The postspike showed an inflection in the rising phase of the action potential, which could be observed more easily in the first (time) derivative (Fig. 1 F, arrow). In some cases an isolated EPSP was observed, indicating the presence of a postsynaptic AP failure. Isolated EPSPs showed a much slower repolarization rate than the spikes. This property could be used to separate failures and nonfailures, both in whole-cell (Fig. 1 G,H) and in extracellular recordings (data not shown). During spontaneous activity, 7 of 18 extracellular and 4 of 6 whole-cell recordings demonstrated failures, with an average failure rate of 13.1% (range 0.6–68.2%, median 5.2%; n = 11). Failure rate was slightly higher during auditory evoked activity (Fig. 2); 10 of 18 extracellular and 5 of 6 whole-cell recordings revealed failures at an average rate of 17.7% (range 1.0–73.3%, median 8.4%; n = 15). Our results therefore indicate that the mouse calyx of Held synapse is not a fail-safe relay, since in many cases it failed even during spontaneous activity. Since much of the controversy about the reliability of the calyx of Held synapse is due to differences in the interpretation of the complex waveforms (Mc Laughlin et al., 2008), we next investigated the origin of the complex waveform using simultaneous intracellular and extracellular postsynaptic slice recordings.
Figure 2.

Failures during tone-evoked activity. Top, Intracellular response to a 50 ms tone (green bar). Same whole-cell recording as depicted in Figure 1 C–H. The tone was at the cell's characteristic frequency (28 kHz) at maximal intensity (80 dB sound pressure level, 65 dB above minimum threshold). Membrane potential was −62 mV. Three spike failures are indicated by blue arrows. Postsynaptic potentials summated at short intervals, which may counteract the decrease in postsynaptic excitability. A silent period is observed for ∼25 ms after tone offset (orange arrow), which was also observed in all other in vivo whole-cell recordings. The absence of prespikes in this period indicates that the cause for the decreased activity lied peripherally from the MNTB. In all whole-cell recordings a small hyperpolarization was observed during this silent period. Bottom, Raster plot of responses to 10 tone presentations. EPSPs are indicated by blue (subthreshold) and red (suprathreshold) vertical bars, and APs by green bars, which have been vertically offset. Spike failures can be found during both evoked and spontaneous activity. Note the variable delay between EPSPs and APs. Green arrow marks example trace.
Origin of the complex waveform
The complex waveform has been a defining feature of extracellular recordings from the MNTB, but the exact contribution of the calyx of Held and its associated principal cell to the complex waveform is presently unknown. As mentioned above, the rise before the inflection has been hypothesized to be due to the calyceal EPSP (Guinan and Li, 1990), but this part has also been hypothesized to have a presynaptic origin (Wu and Kelly, 1993), whereas the inflection was not observed in previous axonal in vivo recordings (Sommer et al., 1993). The shape of the complex waveforms in the extracellular recording (Fig. 1 B) resembled the first derivative of the membrane potential in the whole-cell recordings (Fig. 1 F), suggesting that these extracellular in vivo recordings to a large extent reflected local membrane currents (Freygang and Frank, 1959). To test this interpretation, we made simultaneous intracellular and extracellular recordings from the same principal cell in slices containing the MNTB (Fig. 3 A). Figure 3 B shows the response to hyperpolarizing voltage steps in a voltage-clamped principal neuron, while at the same time the extracellular membrane potential was monitored with an independent patch pipette (Fig. 3 C). The two were similar, both consisting of a transient (capacitive) and a sustained (resistive) component, providing evidence for the hypothesis that the extracellular potentials reflect local membrane currents. The signal-to-noise ratio in extracellular recordings depended critically on the distance to the cell. To obtain a good signal-to-noise ratio it was necessary to get a loose seal resistance of at least twice the pipette resistance by pushing the electrode into the cell (Fig. S1, available at www.jneurosci.org as supplemental material). Similar results were obtained during in vivo recordings (seal resistance typically 30 MΩ). These results suggest that under our recording conditions, the complex extracellular waveforms reflected voltage changes due to local membrane currents, plus a much smaller global component with variable shape, which was less dependent upon distance.
Figure 3.

The complex extracellular waveform reflects local membrane currents. A, Infrared differential interference contrast image of the recording configuration, showing simultaneous whole-cell and extracellular slice recording from the same principal cell. B, Whole-cell membrane currents evoked by a −10 mV voltage step from a holding potential of −80 mV. Responses consist of both a component due to capacitive current and one due to resistive current. C, The extracellular voltage response recorded simultaneously with the response shown in B. D, Postsynaptic action potential evoked by afferent stimulation recorded in the whole-cell configuration. E, The complex extracellular waveform recorded simultaneously with the response shown in D. F, The complex extracellular waveform shown in E (black trace) can be approximated by the sum (red trace) of scaled versions of the intracellular voltage response (blue trace) shown in D and its first derivative (green trace). G, Simulations of intracellular action potentials assuming three channel distributions: homogenous (black), reduced soma Na channels (red), and reduced Na and K channels (blue). H, Simulations of extracellular waveforms under same conditions as in G. Voltages were calculated as the product of loose patch resistance and membrane current. I, Local field potential was calculated by summing current in all parts of neuron acting as point sources at the surface of the cell soma at the point of recording. Note the difference in voltage scale with H.
Next, we studied the relation between the extracellular and intracellular potentials during synaptic transmission. Stimulation of afferent fibers triggered EPSP-AP sequences in the principal cell (Fig. 3 D) while at the same time complex waveforms were recorded extracellularly (Fig. 3 E). Figure 3 F shows that the second part of the complex extracellular waveform could be well approximated by the sum of a scaled version of the intracellular membrane potential (resistive component) and a scaled version of the intracellular rate of change of the membrane potential (capacitive component). Similar results were obtained in four additional experiments.
To investigate the dependence of extracellular waveforms on the voltage-dependent ion channel distribution, we constructed a model of the MNTB principal neuron containing synaptic conductance, Na, K, and leak conductances and a semirealistic morphology, which was used to generate EPSP/AP waveforms (Fig. 3 G). The overall shape of the theoretical extracellular waveform generated by scaling V m and its first derivative by the phenomenological capacitive and resistive coupling constants obtained in paired slice recordings agreed reasonably well with the data (data not shown). To interpret these findings in terms of underlying conductances, we assumed that the potential picked up by the loose patch electrode was proportional to current through a patch of somatic membrane. We considered three different channel distributions (Table S1, available at www.jneurosci.org as supplemental material): uniform (Fig. 3 G–I, black traces), reduced soma sodium channels (red traces) and reduced soma sodium and low-threshold potassium channels (blue traces). All three configurations could generate similar intracellular action potentials (Fig. 3 G), confirming previous observations that the intracellular waveform constrains models of channel distributions poorly (Holt and Koch, 1999). However, the extracellular potentials did constrain the channel distribution (Fig. 3 H). The calculated waveform with the uniform channel distribution showed a negative peak at max dV/dt of the action potential, whereas extracellular recordings were always positive. Inspection of current components indicated that this was due to net inward current at peak dV/dt as sodium current discharges distal regions of the cell. Moving sodium channels out of the soma to the axon improved the fit greatly (red traces), especially during the depolarization phase of the AP. The fit during repolarization could be further improved by reducing potassium current in the soma (blue traces), although the experimentally observed repolarization phase of extracellular waveforms was variable and thus the model is less constrained in this respect. We also calculated the traditional “global” extracellular potential generated by current flow through all parts of the cell just above the surface of the cell (Fig. 3 I). Of the three channel distributions described above, the global extracellular potential was smallest for the first, as expected since in this case most ionic current returns locally as capacitive current, and larger for the nonuniform channel distributions. In all three cases, it was much smaller than the complex waveforms recorded in loose seal configuration, and we therefore conclude that most of the signal in our experimental recordings reflects local membrane currents. The relative lack of voltage-dependent ion channels makes it possible to get an estimate of the rate of rise of the intracellular potentials. It is in agreement with the low sodium channel density in cell-attached recordings from the soma of young mice or rats (Leão et al., 2005, 2008) and immunohistochemical evidence which indicates that low-threshold potassium channels are expressed in the axon of the MNTB postsynaptic neuron but not the soma (Kaczmarek et al., 2005). The exclusion of sodium channels from the soma may be an efficient way to allow high-frequency signaling (Ashida et al., 2007), with the somatic action potentials reflecting passive back-propagation from the initial segment in which they presumably are generated.
The complex waveform as a measure for both release and postsynaptic excitability
Next we tested whether the extracellular potentials could be used as an estimate for synaptic conductance or postsynaptic excitability. We first compared the size of the EPSPs and EPSCs recorded in the whole-cell configuration during 1 s, 500 Hz trains. At an extracellular calcium concentration of 2 mm, the EPSC size showed major depression (Fig. 4 A). After ∼50 stimuli, it reached a steady-state of ∼20% of the first EPSC (Fig. 4 B). In current-clamp recordings from the same cells, the component before the inflection had similar latency as the EPSC, identifying it as the EPSP (Fig. 4 C). Due to the presence of the APs, it was not possible to estimate its peak amplitude. However, the maximal rate of rise of the intracellular EPSP (iEPSP′) correlated well with the size of the EPSCs (Fig. 4 D,G) (r = 0.95 ± 0.01; n = 5).
Figure 4.
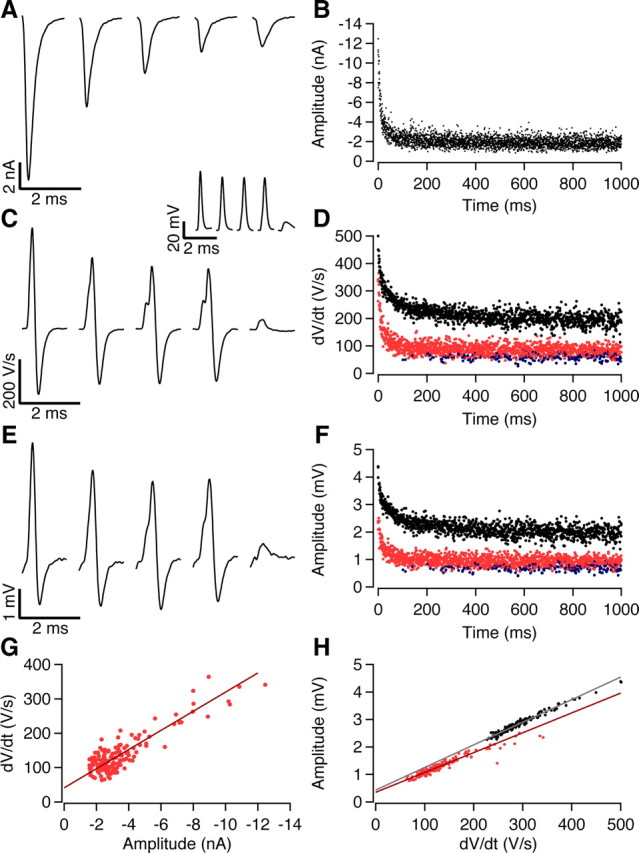
The complex extracellular waveform can be used to estimate both release and postsynaptic excitability. A, Whole-cell voltage-clamp slice recording showing EPSCs evoked at 0, 12, 48, and 102 ms during a 500 Hz stimulus train with a total duration of 1 s. B, Time course of synaptic depression during the 500 Hz stimulus train. Six repetitions have been overlaid. C, First derivative of synaptic potentials evoked at 0, 12, 48, and 102 ms during a 500 Hz train recorded in whole-cell configuration. Inset shows undifferentiated waveforms. The inflection becomes progressively more prominent as the rate of rise of the EPSP decreases due to STD. The last waveform shows the first postsynaptic failure. D, Time course of depression of iEPSP′ (red circles, suprathreshold; blue, failures) and iAP′ (black circles) during the 500 Hz train. Three repetitions have been overlaid. E, Extracellular potentials recorded simultaneously as responses shown in C. F, Time course of depression of eEPSP (red circles, suprathreshold; blue, failures) and eAP (black circles) during the 500 Hz train. Three repetitions have been overlaid. G, Relation between maximum rate of rise of the intracellular EPSP and EPSC amplitude. Solid line is the regression line (r = 0.96). H, Relation between either eEPSP and iEPSP′ (red; r = 0.95) or eAP and iAP (black; r = 0.98). In G and H, only the first 50 responses of the stimulus train are shown.
To test the relation between EPSPs and EPSCs in the absence of action potentials, we repeated these experiments in the presence of the intracellular sodium channel blocker QX-314 (Fig. S2, available at www.jneurosci.org as supplemental material). In the presence of QX-314, principal cells had a higher input resistance (370 ± 54 vs 134 ± 7 MΩ; p = 0.019) and a more negative membrane potential (−81 ± 5 vs −67 ± 1 mV; p < 0.0001), probably due to block of the persistent sodium conductance (Leão et al., 2005). Under these conditions, not only the maximal rate of rise (r = 0.97 ± 0.1; n = 4), but also the amplitude of the EPSPs correlated with the size of the EPSCs (r = 0.96 ± 0.01) (Fig. S2, available at www.jneurosci.org as supplemental material).
In the series of experiments illustrated in Figure 4, we simultaneously measured the extracellular potentials. During the train, the eEPSPs showed a similar decrease as the iEPSP′ (Fig. 4 E–G) (r = 0.95 ± 0.02; n = 5).
Not only the EPSPs, but also the rate of rise of the intracellularly recorded action potentials (iAP′) decreased during the stimulus train, presumably as a result of sodium channel inactivation, although activation of potassium channels may have also contributed (Fig. 4 C,D). Due to the combination of synaptic depression and spike depression, the smallest EPSPs became subthreshold. The decrease in the iAP′ could be observed in the extracellular recording as a decrease in the size of the eAP (Fig. 4 C–F,H) (r = 0.91 ± 0.04).
We also examined the relationship between excitatory postsynaptic conductance (EPSg) and the peak of either the eEPSP or its first derivative in a simulation. The model predicts better linearity for the latter, but both were adequate provided the EPSg was not too large. Deviation of eEPSP vs. EPSg from linearity was ∼6% for an EPSg corresponding to an 8 nA EPSC at −80 mV, typical of our recordings (Fig. S3, available at www.jneurosci.org as supplemental material). A similar analysis showed a linear relationship between Na-channel availability and the peak extracellular action potential which we used as a measure of postsynaptic excitability (Fig. S3, available at www.jneurosci.org as supplemental material).
From these experiments we conclude that both the amplitude of the eEPSP and the iEPSP′ can be used as an estimate of the size of the glutamatergic conductance change. Since desensitization and saturation of AMPA receptors are unlikely in the adult calyx of Held synapse (Yamashita et al., 2003; Renden et al., 2005), the amplitude of the eEPSP and the iEPSP′ should thus be proportional to transmitter release, except when the EPSPs are so large that there was little inflection. In addition, the eAP is proportional to the rate of rise of the postsynaptic action potential, and therefore constitutes a measure of postsynaptic excitability. We used this information to test systematically how the EPSP and the AP component depended on recent history during in vivo signaling.
Spike depression
By analyzing the shape of the extracellular and intracellular waveforms as a function of the interval between events, we could identify two different causes for the failures that we observed during in vivo recordings, a reduction in the postsynaptic excitability and a small EPSP size. We will first discuss the reduction in the postsynaptic excitability. In Figure 1, a decrease in the eAP and the maximum rate of rise of the whole-cell action potential (iAP′) can be observed at short intervals. A plot of the relation between the eAP or iAP′ with the interspike interval illustrates this decrease, both in extracellular and in whole-cell recordings (Fig. 5 A,B). We fitted the spike depression with a model which took cumulative effects into account, as detailed in Materials and Methods. Two cells were excluded because fitting yielded negative delay times, one cell because it had too few data points and one cell because it could be fitted with only 1 time constant. Except for very short intervals, the decrease in the eAP or the iAP′ could be well described by the sum of two exponents (Fig. 5 C,D), with a fast time constant of 0.66 ± 0.04 ms (n = 18) and a slow time constant which was around 18 ms in most cells (17.8 ± 2.1 ms; n = 18), but much longer in the remaining cells (>100 ms; n = 4). Delay was 0.74 ± 0.05 ms (n = 22). A grand average is shown in Figure 5 E, results for intracellular and extracellular recordings are pooled since normalized amplitudes of iAPs and eAPs did not differ significantly (univariate ANOVA, binned interval and recording type as factors, p = 0.999). Although other ion channels may also contribute, it seems likely that inactivation of sodium channels made a large contribution to the spike depression, since its recovery time course was similar to the time course of recovery from inactivation of the sodium channels in the principal cells (Leão et al., 2005). As shown below, spike depression contributed to a decrease in the reliability of the calyx of Held synapse.
Figure 5.

Postsynaptic spike depression. A, Relation between eAP amplitude and interspike interval for an in vivo extracellular recording. B, Relation between iAP′ amplitude and interspike interval for an in vivo whole-cell recording. C, Relation between model prediction and measured amplitudes for data shown in A. Recovery time constants (Eq. 3) were 0.8 and 17 ms, delay was 0.5 ms. Solid gray identity line indicates perfect fit. D, Model prediction for data shown in B, with time constants of 1.1 and 18 ms and a delay of 1 ms. E, Amplitudes of all cells (18 extracellular and 6 whole-cell recordings) were normalized by dividing by the mean amplitude of the three longest binned intervals, averaged across cells and plotted with SE against spike interval. Due to variation in maximum and minimum intervals, the number of averaged cells varied per interval (range 3–24).
The rate of rise of the EPSP does not depend on recent history
The young adult calyx of Held synapse shows pronounced short-term synaptic depression under standard slice conditions (Fig. 4 B), suggesting depressed EPSPs as a cause of spike failures. Because the size of the iEPSP′ or the eEPSP can be used to estimate the strength of transmission (Fig. 4), we studied the relation between the iEPSP′ or eEPSP with the interval between events to assess the contribution of short-term depression to the spike failures. To our surprise, both the iEPSP′ and the eEPSP did not depend on interval, although small effects could have been present in individual cases and measurements at very small intervals (<3 ms) were less accurate due to overlap with the repolarization phase of the preceding spike. Four representative examples are shown in Figure 6 A–D. Normalized amplitudes of iEPSPs and eEPSPs did not differ significantly (univariate ANOVA, binned interval and recording type as factors, p = 0.887) and the pooled data across all experiments also indicated an overall lack of a dependence of the size of eEPSP or iEPSP′ on recent history (Fig. 6 E). Using the maximal rate of rise of the eEPSP or iEPSP′ as a measure for synaptic transmission (Fig. S2, available at www.jneurosci.org as supplemental material) yielded similar results (data not shown).
Figure 6.
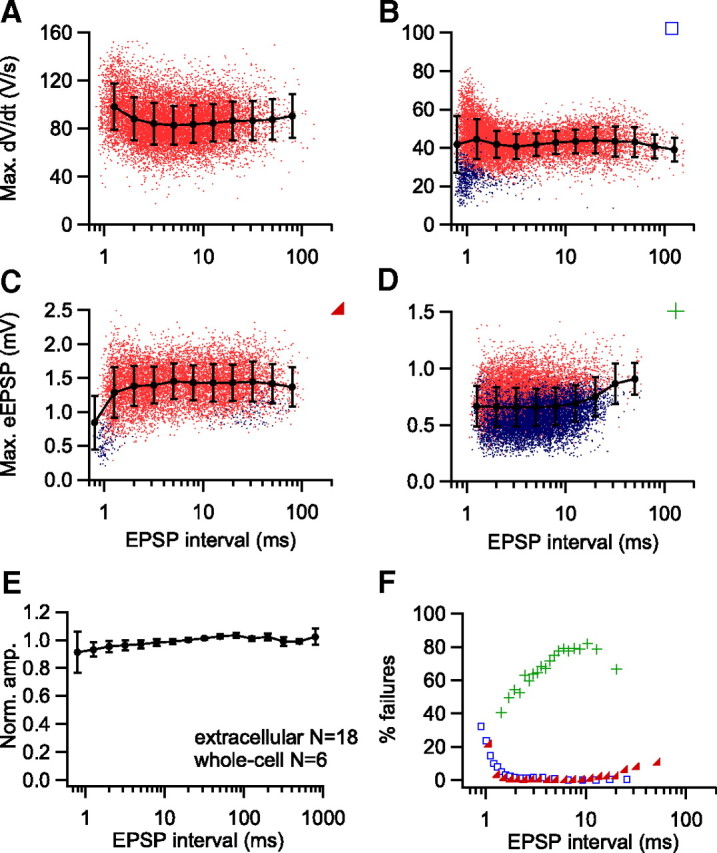
Amplitude of synaptic potentials does not depend on recent history in in vivo recordings. A, Relation between maximal amplitudes of first derivative of EPSP (iEPSP′) and interspike interval for an in vivo whole-cell recording. Black line shows binned averages with SDs, red dots show individual events. No failures were observed in this recording. B, As A, but in this whole-cell recording some iEPSP′ at short intervals remained subthreshold (blue dots). C, Relation between maximal amplitudes of EPSP component of the extracellular waveform (eEPSP) and interspike interval for an in vivo extracellular recording. D, As C, but different recording. E, Relation between mean normalized amplitudes of synaptic events and inter-EPSP interval in all cells. Before averaging, amplitudes were normalized by dividing through the mean amplitude of the three longest binned intervals. Error bars show SE. Due to variation in maximum and minimum intervals, the number of averaged cells varied per interval (range 3–24). F, Relation between failure rate and EPSP interval for the three cells illustrated in B–D. Blue squares, Increasing failure percentage at short intervals (B); red triangles, U-shaped curve (C); green crosses, increasing failure percentage at long intervals (D).
Despite the lack of evidence for the presence of short-term depression, the eEPSP and the iEPSP′ were excellent predictors for the presence of failures. Within cells, subthreshold EPSPs generally had a smaller size than suprathreshold EPSPs and the border between failures and nonfailures was typically rather sharp (Figs. 6 B–D). In whole-cell data this border was at around 30 V/s. A close inspection of this relation revealed that although for a given interval range the eEPSP or iEPSP′ were always a good predictor of failure, the level of this border and thus the failure percentage could be interval-dependent. Three cell types could be discerned based on the shape of the relation between failure fraction and interval: refractory, long interval, and U-shaped (Fig. 6 F). Most cells (64.3% of cells with spike failures) (Fig. 6 B) failed mainly at short intervals. In these cells, the percentage of failures and the interval were inversely related, suggesting a major contribution of the refractory period. The percentage of failures increased strongly at intervals <1 ms (Fig. 6 E), and approached 100% at an interval of 0.9 ms (n = 5), indicating that this was close to the absolute refractory period of MNTB principal cells. A smaller percentage of cells (14.4%) (Fig. 6 D) showed the opposite, an increasing failure rate at longer intervals. The remainder (21.3%) (Fig. 6 C) failed both at short and long intervals, but less so at intermediate intervals, resulting in a U-shaped relation between failure fraction and interval. The observation that a larger eEPSP or iEPSP′ was needed to trigger a spike at long intervals (more than ∼10 ms) than at intermediate intervals (2–10 ms) was unexpected considering the reduction in the postsynaptic excitability at intermediate intervals. Figures 1 C and 2 reveal that EPSPs summated on top of previous EPSPs and APs at intervals below ∼10 ms. At short intervals the maximum rate of rise of the EPSPs was reached at more positive potentials (Fig. S4, available at www.jneurosci.org as supplemental material). Our data therefore suggest that summation can counteract the decrease in postsynaptic excitability. The two cells with increasing failure percentage at longer intervals had high failure rates at all intervals, thus reducing the impact of spike depression at short intervals. In cells with a U-shaped failure curve, failures at short intervals were mostly due to the reduced excitability, whereas at long intervals, failures were due to small EPSPs.
In conclusion, we identified two causes for postsynaptic failures at the calyx of Held synapse: a decrease in postsynaptic excitability at short intervals and a small EPSP size.
Low release probability of the calyx of Held synapse
Remarkably enough there was no clear evidence for a role of short-term depression, since the eEPSP or the iEPSP′ did not depend on recent history. Due to the high spontaneous rates observed in vivo, it is possible that the synapses are chronically depressed (Hermann et al., 2007). Moreover, experiments on synaptic depression have been done on younger animals than were used in our experiments, allowing room for possible further developmental changes (Taschenberger and von Gersdorff, 2000; Futai et al., 2001; Joshi and Wang, 2002), although we showed in Figure 4 B that young adult synapses can still show considerable depression. We therefore tested the time course of recovery from depression at physiological temperatures in slices of young adult mice (P24–P32). At an external calcium concentration of 2 mm, the concentration used in virtually all mammalian slice or culture studies of short-term plasticity, the recovery from depression could be reasonably well described by the sum of two exponential functions, with a fast time constant ∼60 ms and a much slower time constant which was typically >1 s (Fig. 7 A–C, black traces; Table S2, available at www.jneurosci.org as supplemental material). Similar results were obtained in current clamp (Fig. 7 D–F; Table S2, available at www.jneurosci.org as supplemental material). Because a large part of the recovery was quite rapid, it should have been evident in all in vivo recordings, despite the often high spontaneous frequencies. A major difference between the in vivo experiments and the experiments performed under standard slice conditions was that the maximal rate of rise of the EPSP at the beginning of the train was much larger in slices. Since the minimum rate of rise of the EPSP needed to trigger a spike and the AP threshold were similar under both conditions (Table S3, available at www.jneurosci.org as supplemental material), it is unlikely that this difference was due to the slicing procedure. In vivo, the maximal rate of rise of the AP was generally much larger than of the EPSP, arguing against an artificially low rate of rise due to the filtering of the membrane potential resulting from the high series resistance typically obtained during the in vivo recordings. Since it is known that in vivo the calcium concentrations are lower than 2 mm, we repeated the experiments at lower calcium concentrations. At a calcium concentration of 1.5 mm, which should be close to the physiological concentration in the interstitial fluid (Hansen, 1985; Jones and Keep, 1988; Silver and Erecińska, 1990), STD was reduced, but a clear fast recovery component was present and the maximal rate of rise of the first EPSP was still more than three times larger than the values observed in vivo (Fig. 7, red traces). At a calcium concentration of 1.2 mm, the depression of the synaptic currents or potentials was further reduced, but the fast recovery phase was still present (Fig. 7, green traces). Interestingly, the steady-state amplitude of the EPSCs during the high-frequency train was similar for all three calcium concentrations (Fig. 7 B). Although experiments at different calcium concentrations were performed in different cells, these results nevertheless suggest that at all three calcium concentrations the output during the 500 Hz train approached the maximally possible output.
Figure 7.

Synaptic depression at different extracellular calcium concentrations. A, Synaptic currents recorded in principal cells in brain slices during and following a 400 ms, 500 Hz stimulus train at three different calcium concentrations: 1.2 (green), 1.5 (red), and 2 mm (black). Time axis indicates start of individual EPSCs relative to the end of the stimulus train. B, Time course of synaptic depression and recovery from synaptic depression of EPSCs during the 500 Hz train. Solid lines show the fit of the recovery phase with the sum of two exponential functions (Table S2, available at www.jneurosci.org as supplemental material). C, As B, except amplitudes have been divided by the average amplitude of the first EPSC before averaging across experiments. D, As A, but showing first derivative of current-clamp recording. Peak amplitude of the iEPSP′ is marked with a small blue cross. E, Time course of synaptic depression and recovery from synaptic depression of the rate of rise of the EPSPs during the 500 Hz train. Solid lines show the fit of the recovery phase with the sum of two exponential functions (Table S2, available at www.jneurosci.org as supplemental material). F, As E, except potentials have been normalized to the first one.
In conclusion, the lack of a dependency of the average eEPSP or iEPSP′ size on interval which we observed during in vivo recordings was best reproduced by reducing release probability to values that were much lower than during standard slice conditions.
Quantal analysis of the calyx of Held synapse
The results of the slice experiments suggested that in vivo the quantal content at rest is relatively low. We therefore performed a quantal analysis both in vivo and in slices. In slice recordings, the size of the spontaneous EPSCs was on average −151 ± 7 pA (Fig. 8 A,B) (n = 21). This is much larger than previous estimates obtained at younger ages (Borst and Sakmann, 1996), but in agreement with the developmental increase around or shortly after the onset of hearing (Taschenberger et al., 2002; Wang et al., 2008) and the larger size of spontaneous EPSCs at physiological temperatures (Kushmerick et al., 2006; Postlethwaite et al., 2007). If quantal content was calculated as the ratio between the peak amplitude of evoked and spontaneous EPSCs (Borst and Sakmann, 1996), a value of only 13 ± 1 was obtained at the steady-state level of the 500 Hz train (Table S3, available at www.jneurosci.org as supplemental material). A larger value (32 ± 1) was obtained if charge integrals were compared. This analysis was repeated for the current-clamp slice recordings, yielding a quantal size of 5.5 ± 0.3 V/s (Fig. 8 C,D). Estimated quantal content at the steady-state level of the 500 Hz trains was 13 ± 1. The quantal iEPSP′ size for in vivo whole-cell recordings was 3.2 ± 0.6 V/s (n = 5) (Fig. 8 E,F), yielding an estimate of the quantal content of 17 ± 1. The quantal content estimate obtained for in vivo whole-cell recordings did not differ significantly from the values obtained at the end of 500 Hz trains in all three calcium concentrations or at the start of the train at 1.2 mm calcium for both voltage-clamp and current-clamp slice recordings (Fig. 8 G).
Figure 8.

Quantal analysis of the calyx of Held synapse. A, Example trace showing individual spontaneous EPSCs in slice recordings of principal MNTB cells. Inset shows rapid time course of the event indicated with a box. B, Histogram of amplitudes of spontaneous EPSCs (black bars) and baseline noise (gray bars). To allow a comparison, both were divided by their respective maximum values. C, First derivative of membrane potential during whole-cell current-clamp slice recording showing individual spontaneous events. Inset shows iEPSP′ indicated with box at higher time resolution. D, Normalized histogram of spontaneous iEPSP′ amplitudes (black bars) and baseline noise (gray bars) in slice recording. E, As C, except in vivo whole-cell current-clamp recording. F, As D, except in vivo whole-cell current-clamp recording. G, Summary of estimated quantal content obtained either in voltage clamp (VC) or in current clamp (CC) for the first stimulus of the train (“#1”) or the average value of the last 50 stimuli of the 500 Hz train (“ss”) at three different extracellular calcium concentrations (1.2, 1.5, 2 mm). The bar on the right shows the estimate obtained in vivo.
In conclusion, the quantal analysis showed that the quantal size in the young adult calyx of Held synapse is remarkably large and that in vivo the quantal content is remarkably low, similar to the quantal content attained during high-frequency signaling in slices.
Precision of the calyx of Held synapse
Because spontaneous firing frequencies of the calyx of Held synapse are high, it is possible that this synapse is chronically depressed in vivo (Hermann et al., 2007). However, the consequences of high-frequency signaling for synaptic latency and jitter will depend on initial release probability (Fedchyshyn and Wang, 2007). In slice experiments we therefore tested the impact of both the spontaneous frequency and the low release probability on synaptic delay and jitter. We electrically stimulated the calyx of Held synapse in slice recordings with a pattern that was obtained from a whole-cell in vivo recording during sound stimulation (Fig. S5, available at www.jneurosci.org as supplemental material). This pattern was presented 10–20 times both with and without preceding 50 Hz stimulation at extracellular calcium concentrations of 1.2, 1.5, or 2 mm. At a calcium concentration of 2 mm, in the absence of spontaneous activity, the first EPSP evoked by the in vivo pattern had a clearly higher rate of rise than in the presence of 50 Hz stimulation (Fig. 9 A–D; Fig. S6G, available at www.jneurosci.org as supplemental material) (228 ± 37 vs 151 ± 22 V/s; n = 5 cells; p = 0.025, paired t test). As a result, spike delay (0.78 ± 0.06 vs 0.89 ± 0.06 ms; p < 0.01) and jitter (0.013 ± 0.002 vs 0.036 ± 0.010 ms; p = 0.07) were smaller than in the presence of spontaneous activity (Fig. 9 D, black vs inverted red triangles; Fig. S6B,D, available at www.jneurosci.org as supplemental material, black vs inverted red triangles). At the end of the in vivo train the EPSPs had depressed to similar steady-state values in the absence and presence of spontaneous activity (83 ± 12 V/s vs 84 ± 13 V/s, average of last 10 EPSPs; p = 0.65). In combination with the spike depression, this resulted in a considerable increase in spike delay and jitter during the train, and at the end of train the effect of the preceding spontaneous activity on spike delay (1.08 ± 0.07 vs 1.08 ± 0.07 ms; p = 0.9) or jitter (0.09 ± 0.01 vs 0.09 ± 0.01 ms; p = 0.7) was no longer apparent. The fraction of failures was also similar under both conditions (Fig. S6A, available at www.jneurosci.org as supplemental material; Fig. 9 D, top) (0.56 ± 0.15 vs 0.50 ± 0.15; p = 0.16). These results show that the possible beneficial effect of a high release probability on precision and reliability were counteracted by the spontaneous activity, in agreement with the results of Hermann et al. (2007), but they also show that after a few spikes of the in vivo train this effect was already very small. At a calcium concentration of 1.2 mm, the condition that best matched the in vivo situation, the impact of spontaneous activity was much smaller. The rate of rise of the EPSPs at the start of the in vivo train was similar (124 ± 36 vs 102 ± 29 V/s; n = 4 cells; p = 0.20). The effect of the 50 Hz spontaneous activity on AP delay (0.87 ± 0.02 vs 0.96 ± 0.02 ms; p = 0.04) or jitter (0.043 ± 0.017 vs 0.058 ± 0.015 ms; p = 0.01) at the start of the in vivo train were also reduced compared with the results obtained with 2 mm and both values were similar to the responses obtained at the end of the in vivo train in 2 mm. Due to the lower release probability, the synaptic depression during the in vivo train was reduced in 1.2 mm and at the end of the in vivo train, the rate of rise of the EPSPs (99 ± 28 vs 100 ± 29 V/s; p = 0.67), AP delay (0.98 ± 0.02 vs 0.99 ± 0.01 ms; p = 0.33), jitter (0.068 ± 0.017 vs 0.057 ± 0.015 ms; p = 0.01), or fraction of failures (0.22 ± 0.18 vs 0.19 ± 0.16; p = 0.23) were similar in the absence of presence of spontaneous activity (Fig. 9 E–H; Fig. S6A,B,D, available at www.jneurosci.org as supplemental material). Results obtained at a calcium concentration of 1.5 mm were intermediate between those at 1.2 and 2 mm (Fig. S6, available at www.jneurosci.org as supplemental material) (n = 4 cells).
Figure 9.
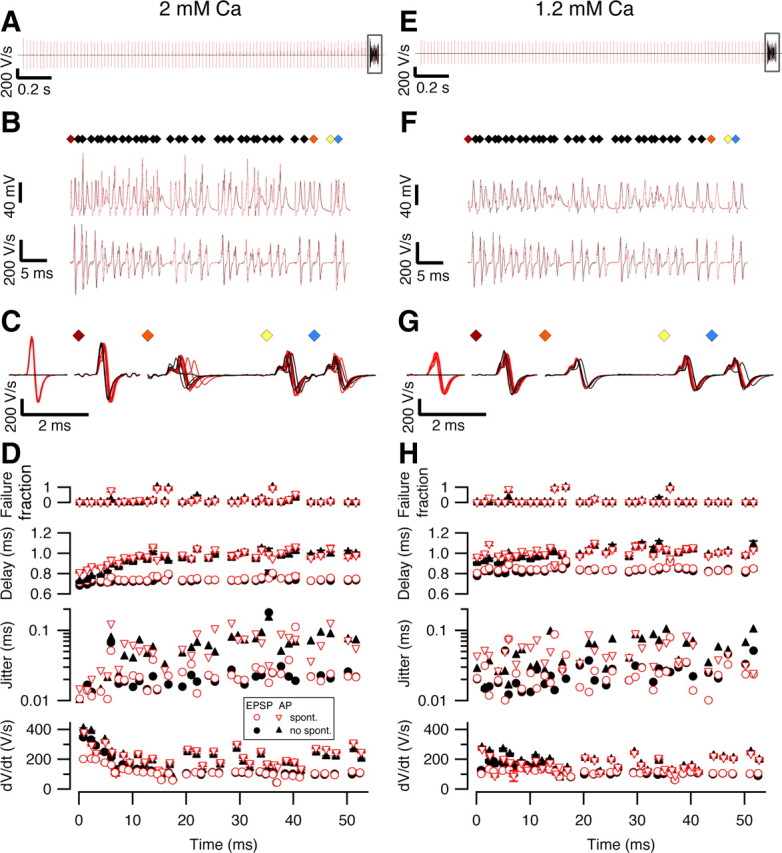
Contribution of spontaneous activity to precision and reliability of the calyx of Held synapse. A–H, Cells were stimulated with a pattern obtained from an in vivo postsynaptic auditory response (Fig. S5, available at www.jneurosci.org as supplemental material) at a calcium concentration of either 2 mm (A–D) or 1.2 mm (E–H). In all panels, red traces or symbols indicate responses obtained following a 2 s, 50 Hz spontaneous activity train, as illustrated in A and E. Boxed areas in A and E are shown at higher time resolution in B and F, respectively, in which diamonds in top panel mark stimuli, middle traces show raw data including (partially truncated) stimulus artifacts, and lower traces show first derivatives with stimulus artifacts subtracted. The first and last three stimuli of the in vivo pattern (colored diamonds) are shown in C and G at higher time resolution. Two example traces, one with and one without spontaneous activity, have been overlaid in A and B. Five traces have been displayed for each condition in C and G. In D and H, from top to bottom, fraction of postsynaptic spike failures during the 10 repetitions of the in vivo pattern, delay from the start of the stimulus, SD of this delay (jitter), and rate of rise are shown. For the last three panels, triangles indicate action potential measurements, whereas circles indicate measurements made on the synaptic potentials. Data in D and H are shown as mean ± SE of the 10 repeats of the in vivo pattern, except when SE was smaller than symbol size.
In conclusion, our data suggest that the precision and reliability of the calyx of Held synapse can be greatly increased if the quantal content is raised to the level that has typically been obtained at rest under standard slice conditions (2 mm Ca). However, our data also show that under these conditions precision and reliability rapidly deteriorated due to the spike depression and synaptic depression induced by high, in vivo-like firing frequencies. Moreover, the high precision was also counteracted by the presence of spontaneous activity. Our data therefore indicate that the very high precision and reliability which can be observed at rest under standard slice conditions would have a limited impact in vivo due to spike depression and synaptic depression induced by both spontaneous and sound-evoked activity. When the release probability was reduced in the slice experiments by lowering the extracellular calcium concentration from 2 to 1.2 mm, precision and reliability of the calyx of Held synapse became much less dependent on firing frequencies and the calyx of Held synapse started to behave as a tonic synapse, in agreement with our in vivo results.
Discussion
In this paper we present the first in vivo whole-cell recordings from the principal cells of the MNTB. We find clear evidence for postsynaptic failures in about half of the cells, both in whole-cell and in extracellular recordings. These failures were due to stochastic fluctuations in EPSP size and a decrease in postsynaptic excitability at short intervals. Surprisingly, there was no evidence for a contribution of STD. The findings obtained in vivo could be approximated in the slice recordings by lowering the release probability substantially compared with standard conditions.
Complex waveforms signify both transmitter release and postsynaptic excitability
From our slice experiments and simulations we conclude that the low density of voltage-dependent channels on the principal cell membrane fortuitously makes it possible to get an estimate for transmitter release, postsynaptic excitability and synaptic latency from a single recording. We therefore expect in vivo loose patch recordings of the calyx of Held synapse to become an important tool for studying within the intact mouse brain, using natural stimuli, the impact of presynaptic or postsynaptic genetic modifications.
Reliability of the calyx of Held synapse
The complex extracellular waveforms were very different when the calyceal EPSPs remained subthreshold, allowing us to discriminate between failures and nonfailures in extracellular recordings. Our results unambiguously showed the presence of failures in more than half of the units. Similar results were obtained in a smaller set of whole-cell recordings, suggesting that our results were independent of the recording method. Kopp-Scheinpflug et al. (2003) also observed evidence for postsynaptic spike failures, but the recordings they presented had a much lower signal-to-noise ratio. Under these conditions, the recorded complex waveforms have a much more variable shape, including the presence of negative peaks in the depolarization phase (Kopp-Scheinpflug et al., 2003; Mc Laughlin et al., 2008), which may be due to axonal sinks (Gold et al., 2006). This problem is exacerbated by our observation that the shape of the waveform depended on interspike interval, as also seen in cats (Guinan and Li, 1990; Mc Laughlin et al., 2008). The systematic changes in waveform we observed due to spike depression will significantly hinder attempts to unambiguously identify individual units in multiunit recordings (Harris et al., 2000). We therefore agree with the conclusion of Mc Laughlin et al. (2008) that in the absence of a good signal-to-noise ratio, the correct interpretation of extracellular unit recordings in the MNTB becomes a daunting task, and it cannot be excluded that at least some of the failures observed in the gerbil by Kopp-Scheinpflug et al. (2003) may have been contaminations with a separate unit. Mc Laughlin et al. (2008) reported that they never observed any postsynaptic spike failures in the cat, although they did not provide information on how they excluded the possibility that some eEPSPs were not followed by an eAP. At present it is therefore difficult to tell whether the reported remaining differences are due to genuine species differences or merely due to differences in recording or analysis methods.
EPSP summation counteracts the effects of decreased postsynaptic excitability
In the mouse MNTB, the two main factors contributing to failures were the decrease in postsynaptic excitability at short intervals and the presence of small synaptic potentials. We observed that the size of the eEPSP or the rate of rise of the iEPSP was a good predictor of failure, but, to our surprise, the size of the synaptic potentials was independent of recent synaptic activity. With the size of the EPSP showing little dependence on recent synaptic history and the postsynaptic excitability decreasing at low intervals, one would expect that larger synaptic potentials would be needed at short intervals to reach spiking threshold. Inspection of in vivo whole-cell recordings, however, showed that at short intervals, summation of EPSPs compensated at least partly for the decrease in postsynaptic excitability. EPSP summation may have a similar role in the globular bushy cells of the anteroventral cochlear nucleus (Paolini et al., 1997) or at the lateral geniculate nucleus (Carandini et al., 2007).
Lack of evidence for the presence of short-term depression
The calyx of Held synapse has been used extensively to study the mechanisms underlying different forms of short-term plasticity (for review, see von Gersdorff and Borst, 2002; Neher and Sakaba, 2008). Especially STD has been studied in great detail. It was therefore unexpected that we did not observe evidence for its presence during in vivo recordings. Since the calyx of Held synapse undergoes major postnatal developmental changes, we tested whether the apparent lack of STD during in vivo recordings was due to developmental changes. We found that in the adult synapse under the experimental conditions that have generally been used when studying the calyx synapse (2 mm Ca) the release probability is so high that STD during a 500 Hz train is quite substantial. This stimulation frequency was within the range of what we observed in MNTB neurons during sound stimulation. At this frequency we observed that the recovery from STD was clearly biphasic. There was a fast component with a time constant of ∼60 ms at physiological temperature, which most likely corresponds to the calcium-dependent component in the recovery that has been extensively characterized at the calyx of Held synapse (for review, see Neher and Sakaba, 2008). This component was so rapid and large that its absence during in vivo recordings was quite conspicuous. Another major difference between the slice recordings under standard conditions and the in vivo recordings was that in slices, the first EPSPs evoked by a high-frequency train had a rate of rise which was much higher than in the in vivo recordings. Since input resistance differed by only 50% on average, the most likely explanation is that these differences were due to a relatively low release probability in vivo. A further possible explanation for the lack of evidence for the presence of STD in vivo came from quantal analysis. The estimated quantal content during a long 500 Hz train in slices was only ∼15, similar to the estimate obtained in vivo. Our results thus suggest that as a result of STD in slices, during high-frequency signaling the output drops to about the same level as observed in vivo, but that in vivo the output was independent of recent history. The most likely explanation for the presence of small EPSPs was therefore that these were due to stochastic fluctuations in the number of released vesicles.
The unexpected lack of evidence for the rapid recovery component in our in vivo recordings does not mean that it is absent. The second component for recovery from STD is so slow (seconds) that it is virtually useless in counteracting depletion during auditory stimulation. It therefore seems likely that the fast recovery plays an essential role in allowing the calyx synapse to speed up recovery when necessary, but that these effects subside rapidly when demands are lowered again.
Our observation that the in vivo impact of STD has been overestimated in slice studies of the calyx of Held seems also to be valid for other synapses. The endbulb of Held synapse of the AVCN, the synapse between retinal ganglion neurons and relay neurons in the lateral geniculate nucleus or the thalamocortical input to the visual cortex have been shown to undergo prominent short-term depression in slice studies (Bannister et al., 2002; Chen et al., 2002; Wang and Manis, 2008; Yang and Xu-Friedman, 2008), whereas synaptic depression seems to be much less prominent or absent at these synapses in vivo (Boudreau and Ferster, 2005; Rancz et al., 2007; Sincich et al., 2007; Young and Sachs, 2008). In addition, our observation that responses obtained at 1.2 mm calcium correspond to in vivo responses much better than responses obtained at 2 mm calcium agrees with results obtained in cortex and cerebellum (Reig et al., 2006; Rancz et al., 2007).
Causes for low release probability in vivo
One likely cause for the observed difference in release probability is a difference in the calcium concentration between standard aCSF solution and the in vivo situation. However, it is unlikely that this can entirely explain the observed difference. In vivo estimates correspond to a total calcium concentration in the aCSF solution of ∼1.5 mm (Jones and Keep, 1988). However, we observed that even in the presence of 1.2 mm calcium, the fast component for the recovery from STD was still present. This suggests that in vivo, the amount of steady-state depression is less than what was observed in the experiments with 1.2 mm calcium (∼40%). One possible explanation for this discrepancy in the apparent extent of depression in vivo and in slices at presumably similar calcium concentrations is that in vivo release is tonically inhibited by ambient neurotransmitter (Cavelier et al., 2005). The calyx of Held contains a rich repertoire of neurotransmitter receptors that can reduce release probability (Schneggenburger and Forsythe, 2006). It is thus tempting to speculate that the ambient concentrations of GABA, glutamate, adenosine, 5-HT, or noradrenalin provide tonic inhibition for the calyx of Held synapse in vivo, but not in slices.
Precision and reliability of the calyx of Held synapse
We confirmed earlier results of increased latency and jitter due to spontaneous activity (Hermann et al., 2007), but we observed that even at high release probability, the effect of prior background activity was only apparent for the first few stimuli of an in vivo-like stimulus pattern in slices. At the conditions which best mimicked the in vivo situation, the impact of the spontaneous activity on latency and jitter became small.
We observed that spike depression, rather than synaptic depression, limits high-frequency signaling and that synaptic summation, rather than synaptic facilitation, helps to counteract the spike depression. The relatively big impact that single vesicles have on adult principal cells allows the calyx to be economical with its resources. Due to its low release probability and large number of release sites, its average output can be kept constant, regardless of firing frequency. Its low quantal output thus allows it to be a tonic synapse, but the price it pays is an increase in jitter and synaptic latency and occasional postsynaptic failures.
Footnotes
This study was supported by a Sixth Framework Programme European Union grant (EUSynapse, LSHM-CT-2005-019055), Nederlandse Organisatie voor Wetenschappelijk Onderzoek Aard- en Levenswetenschappen (Moving Vesicles, 814.02.004), and a Neuro-Bsik grant (Senter, The Netherlands). C.K. is supported by Conselho Nacional de Desenvolvimento Científico e Tecnológico and Fundação de Amparo à Pesquisa de Minas Gerais (Brazil). We thank Martine Groen for help with analysis and Bohdana Hruskova for help with collecting data.
References
- Ashida G, Abe K, Funabiki K, Konishi M. Passive soma facilitates submillisecond coincidence detection in the owl's auditory system. J Neurophysiol. 2007;97:2267–2282. doi: 10.1152/jn.00399.2006. [DOI] [PubMed] [Google Scholar]
- Banks MI, Smith PH. Intracellular recordings from neurobiotin-labeled cells in brain slices of the rat medial nucleus of the trapezoid body. J Neurosci. 1992;12:2819–2837. doi: 10.1523/JNEUROSCI.12-07-02819.1992. [DOI] [PMC free article] [PubMed] [Google Scholar]
- Bannister NJ, Nelson JC, Jack JJ. Excitatory inputs to spiny cells in layers 4 and 6 of cat striate cortex. Philos Trans R Soc Lond B Biol Sci. 2002;357:1793–1808. doi: 10.1098/rstb.2002.1160. [DOI] [PMC free article] [PubMed] [Google Scholar]
- Borst JG, Sakmann B. Calcium influx and transmitter release in a fast CNS synapse. Nature. 1996;383:431–434. doi: 10.1038/383431a0. [DOI] [PubMed] [Google Scholar]
- Borst JG, Helmchen F, Sakmann B. Pre- and postsynaptic whole-cell recordings in the medial nucleus of the trapezoid body of the rat. J Physiol. 1995;489:825–840. doi: 10.1113/jphysiol.1995.sp021095. [DOI] [PMC free article] [PubMed] [Google Scholar]
- Boudreau CE, Ferster D. Short-term depression in thalamocortical synapses of cat primary visual cortex. J Neurosci. 2005;25:7179–7190. doi: 10.1523/JNEUROSCI.1445-05.2005. [DOI] [PMC free article] [PubMed] [Google Scholar]
- Carandini M, Horton JC, Sincich LC. Thalamic filtering of retinal spike trains by postsynaptic summation. J Vis. 2007;7:20.1–20.11. doi: 10.1167/7.14.20. [DOI] [PMC free article] [PubMed] [Google Scholar]
- Cavelier P, Hamann M, Rossi D, Mobbs P, Attwell D. Tonic excitation and inhibition of neurons: ambient transmitter sources and computational consequences. Prog Biophys Mol Biol. 2005;87:3–16. doi: 10.1016/j.pbiomolbio.2004.06.001. [DOI] [PMC free article] [PubMed] [Google Scholar]
- Chen C, Blitz DM, Regehr WG. Contributions of receptor desensitization and saturation to plasticity at the retinogeniculate synapse. Neuron. 2002;33:779–788. doi: 10.1016/s0896-6273(02)00611-6. [DOI] [PubMed] [Google Scholar]
- Fedchyshyn MJ, Wang LY. Activity-dependent changes in temporal components of neurotransmission at the juvenile mouse calyx of Held synapse. J Physiol. 2007;581:581–602. doi: 10.1113/jphysiol.2007.129833. [DOI] [PMC free article] [PubMed] [Google Scholar]
- Forsythe ID. Direct patch recording from identified presynaptic terminals mediating glutamatergic EPSCs in the rat CNS, in vitro . J Physiol. 1994;479:381–387. doi: 10.1113/jphysiol.1994.sp020303. [DOI] [PMC free article] [PubMed] [Google Scholar]
- Freygang WH, Jr, Frank K. Extracellular potentials from single spinal motoneurons. J Gen Physiol. 1959;42:749–760. doi: 10.1085/jgp.42.4.749. [DOI] [PMC free article] [PubMed] [Google Scholar]
- Futai K, Okada M, Matsuyama K, Takahashi T. High-fidelity transmission acquired via a developmental decrease in NMDA receptor expression at an auditory synapse. J Neurosci. 2001;21:3342–3349. doi: 10.1523/JNEUROSCI.21-10-03342.2001. [DOI] [PMC free article] [PubMed] [Google Scholar]
- Gold C, Henze DA, Koch C, Buzsáki G. On the origin of the extracellular action potential waveform: a modeling study. J Neurophysiol. 2006;95:3113–3128. doi: 10.1152/jn.00979.2005. [DOI] [PubMed] [Google Scholar]
- Green JS, Sanes DH. Early appearance of inhibitory input to the MNTB supports binaural processing during development. J Neurophysiol. 2005;94:3826–3835. doi: 10.1152/jn.00601.2005. [DOI] [PubMed] [Google Scholar]
- Guinan JJ, Jr, Li RY. Signal processing in brainstem auditory neurons which receive giant endings (calyces of Held) in the medial nucleus of the trapezoid body of the cat. Hear Res. 1990;49:321–334. doi: 10.1016/0378-5955(90)90111-2. [DOI] [PubMed] [Google Scholar]
- Habets RL, Borst JG. Dynamics of the readily releasable pool during post-tetanic potentiation in the rat calyx of Held synapse. J Physiol. 2007;581:467–478. doi: 10.1113/jphysiol.2006.127365. [DOI] [PMC free article] [PubMed] [Google Scholar]
- Hansen AJ. Effect of anoxia on ion distribution in the brain. Physiol Rev. 1985;65:101–148. doi: 10.1152/physrev.1985.65.1.101. [DOI] [PubMed] [Google Scholar]
- Harris KD, Henze DA, Csicsvari J, Hirase H, Buzsáki G. Accuracy of tetrode spike separation as determined by simultaneous intracellular and extracellular measurements. J Neurophysiol. 2000;84:401–414. doi: 10.1152/jn.2000.84.1.401. [DOI] [PubMed] [Google Scholar]
- Hermann J, Pecka M, von Gersdorff H, Grothe B, Klug A. Synaptic transmission at the calyx of Held under in vivo-like activity levels. J Neurophysiol. 2007;98:807–820. doi: 10.1152/jn.00355.2007. [DOI] [PubMed] [Google Scholar]
- Hermann J, Grothe B, Klug A. Modeling short-term synaptic plasticity at the calyx of Held using in vivo-like stimulation patterns. J Neurophysiol. 2009;101:20–30. doi: 10.1152/jn.90243.2008. [DOI] [PubMed] [Google Scholar]
- Holt GR, Koch C. Electrical interactions via the extracellular potential near cell bodies. J Comput Neurosci. 1999;6:169–184. doi: 10.1023/a:1008832702585. [DOI] [PubMed] [Google Scholar]
- Horikawa K, Armstrong WE. A versatile means of intracellular labeling: injection of biocytin and its detection with avidin conjugates. J Neurosci Methods. 1988;25:1–11. doi: 10.1016/0165-0270(88)90114-8. [DOI] [PubMed] [Google Scholar]
- Hosoi N, Sakaba T, Neher E. Quantitative analysis of calcium-dependent vesicle recruitment and its functional role at the calyx of Held synapse. J Neurosci. 2007;27:14286–14298. doi: 10.1523/JNEUROSCI.4122-07.2007. [DOI] [PMC free article] [PubMed] [Google Scholar]
- Jones HC, Keep RF. Brain fluid calcium concentration and response to acute hypercalcaemia during development in the rat. J Physiol. 1988;402:579–593. doi: 10.1113/jphysiol.1988.sp017223. [DOI] [PMC free article] [PubMed] [Google Scholar]
- Joshi I, Wang LY. Developmental profiles of glutamate receptors and synaptic transmission at a single synapse in the mouse auditory brainstem. J Physiol. 2002;540:861–873. doi: 10.1113/jphysiol.2001.013506. [DOI] [PMC free article] [PubMed] [Google Scholar]
- Kaczmarek LK, Bhattacharjee A, Desai R, Gan L, Song P, von Hehn CA, Whim MD, Yang B. Regulation of the timing of MNTB neurons by short-term and long-term modulation of potassium channels. Hear Res. 2005;206:133–145. doi: 10.1016/j.heares.2004.11.023. [DOI] [PubMed] [Google Scholar]
- Kopp-Scheinpflug C, Lippe WR, Dörrscheidt GJ, Rübsamen R. The medial nucleus of the trapezoid body in the gerbil is more than a relay: comparison of pre- and postsynaptic activity. J Assoc Res Otolaryngol. 2003;4:1–23. doi: 10.1007/s10162-002-2010-5. [DOI] [PMC free article] [PubMed] [Google Scholar]
- Kopp-Scheinpflug C, Tolnai S, Malmierca MS, Rübsamen R. The medial nucleus of the trapezoid body: comparative physiology. Neuroscience. 2008a;154:160–170. doi: 10.1016/j.neuroscience.2008.01.088. [DOI] [PubMed] [Google Scholar]
- Kopp-Scheinpflug C, Dehmel S, Tolnai S, Dietz B, Milenkovic I, Rübsamen R. Glycine-mediated changes of onset reliability at a mammalian central synapse. Neuroscience. 2008b;157:432–445. doi: 10.1016/j.neuroscience.2008.08.068. [DOI] [PubMed] [Google Scholar]
- Kushmerick C, Renden R, von Gersdorff H. Physiological temperatures reduce the rate of vesicle pool depletion and short-term depression via an acceleration of vesicle recruitment. J Neurosci. 2006;26:1366–1377. doi: 10.1523/JNEUROSCI.3889-05.2006. [DOI] [PMC free article] [PubMed] [Google Scholar]
- Leão RM, Kushmerick C, Pinaud R, Renden R, Li GL, Taschenberger H, Spirou G, Levinson SR, von Gersdorff H. Presynaptic Na+ channels: locus, development, and recovery from inactivation at a high-fidelity synapse. J Neurosci. 2005;25:3724–3738. doi: 10.1523/JNEUROSCI.3983-04.2005. [DOI] [PMC free article] [PubMed] [Google Scholar]
- Leão RN, Leão RM, da Costa LF, Rock Levinson S, Walmsley B. A novel role for MNTB neuron dendrites in regulating action potential amplitude and cell excitability during repetitive firing. Eur J Neurosci. 2008;27:3095–3108. doi: 10.1111/j.1460-9568.2008.06297.x. [DOI] [PubMed] [Google Scholar]
- Margrie TW, Brecht M, Sakmann B. In vivo, low-resistance, whole-cell recordings from neurons in the anaesthetized and awake mammalian brain. Pflugers Arch. 2002;444:491–498. doi: 10.1007/s00424-002-0831-z. [DOI] [PubMed] [Google Scholar]
- Mc Laughlin M, van der Heijden M, Joris PX. How secure is in vivo synaptic transmission at the calyx of Held? J Neurosci. 2008;28:10206–10219. doi: 10.1523/JNEUROSCI.2735-08.2008. [DOI] [PMC free article] [PubMed] [Google Scholar]
- Nakamura Y, Takahashi T. Developmental changes in potassium currents at the rat calyx of Held presynaptic terminal. J Physiol. 2007;581:1101–1112. doi: 10.1113/jphysiol.2007.128702. [DOI] [PMC free article] [PubMed] [Google Scholar]
- Neher E, Sakaba T. Multiple roles of calcium ions in the regulation of neurotransmitter release. Neuron. 2008;59:861–872. doi: 10.1016/j.neuron.2008.08.019. [DOI] [PubMed] [Google Scholar]
- Paolini AG, Clark GM, Burkitt AN. Intracellular responses of the rat cochlear nucleus to sound and its role in temporal coding. Neuroreport. 1997;8:3415–3421. doi: 10.1097/00001756-199710200-00044. [DOI] [PubMed] [Google Scholar]
- Pettersen KH, Einevoll GT. Amplitude variability and extracellular low-pass filtering of neuronal spikes. Biophys J. 2008;94:784–802. doi: 10.1529/biophysj.107.111179. [DOI] [PMC free article] [PubMed] [Google Scholar]
- Postlethwaite M, Hennig MH, Steinert JR, Graham BP, Forsythe ID. Acceleration of AMPA receptor kinetics underlies temperature-dependent changes in synaptic strength at the rat calyx of Held. J Physiol. 2007;579:69–84. doi: 10.1113/jphysiol.2006.123612. [DOI] [PMC free article] [PubMed] [Google Scholar]
- Rancz EA, Ishikawa T, Duguid I, Chadderton P, Mahon S, Häusser M. High-fidelity transmission of sensory information by single cerebellar mossy fibre boutons. Nature. 2007;450:1245–1248. doi: 10.1038/nature05995. [DOI] [PMC free article] [PubMed] [Google Scholar]
- Reig R, Gallego R, Nowak LG, Sanchez-Vives MV. Impact of cortical network activity on short-term synaptic depression. Cereb Cortex. 2006;16:688–695. doi: 10.1093/cercor/bhj014. [DOI] [PubMed] [Google Scholar]
- Renden R, Taschenberger H, Puente N, Rusakov DA, Duvoisin R, Wang LY, Lehre KP, von Gersdorff H. Glutamate transporter studies reveal the pruning of metabotropic glutamate receptors and absence of AMPA receptor desensitization at mature calyx of Held synapses. J Neurosci. 2005;25:8482–8497. doi: 10.1523/JNEUROSCI.1848-05.2005. [DOI] [PMC free article] [PubMed] [Google Scholar]
- Rodríguez-Contreras A, van Hoeve JS, Habets RL, Locher H, Borst JG. Dynamic development of the calyx of Held synapse. Proc Natl Acad Sci U S A. 2008;105:5603–5608. doi: 10.1073/pnas.0801395105. [DOI] [PMC free article] [PubMed] [Google Scholar]
- Schneggenburger R, Forsythe ID. The calyx of Held. Cell Tissue Res. 2006;326:311–337. doi: 10.1007/s00441-006-0272-7. [DOI] [PubMed] [Google Scholar]
- Silver IA, Erecińska M. Intracellular and extracellular changes of [Ca2+] in hypoxia and ischemia in rat brain in vivo. J Gen Physiol. 1990;95:837–866. doi: 10.1085/jgp.95.5.837. [DOI] [PMC free article] [PubMed] [Google Scholar]
- Sincich LC, Adams DL, Economides JR, Horton JC. Transmission of spike trains at the retinogeniculate synapse. J Neurosci. 2007;27:2683–2692. doi: 10.1523/JNEUROSCI.5077-06.2007. [DOI] [PMC free article] [PubMed] [Google Scholar]
- Smith PH, Joris PX, Yin TC. Anatomy and physiology of principal cells of the medial nucleus of the trapezoid body (MNTB) of the cat. J Neurophysiol. 1998;79:3127–3142. doi: 10.1152/jn.1998.79.6.3127. [DOI] [PubMed] [Google Scholar]
- Sommer I, Lingenhöhl K, Friauf E. Principal cells of the rat medial nucleus of the trapezoid body: an intracellular in vivo study of their physiology and morphology. Exp Brain Res. 1993;95:223–239. doi: 10.1007/BF00229781. [DOI] [PubMed] [Google Scholar]
- Tan ML, Borst JG. Comparison of responses of neurons in the mouse inferior colliculus to current injections, tones of different durations, and sinusoidal amplitude-modulated tones. J Neurophysiol. 2007;98:454–466. doi: 10.1152/jn.00174.2007. [DOI] [PubMed] [Google Scholar]
- Taschenberger H, von Gersdorff H. Fine-tuning an auditory synapse for speed and fidelity: developmental changes in presynaptic waveform, EPSC kinetics, and synaptic plasticity. J Neurosci. 2000;20:9162–9173. doi: 10.1523/JNEUROSCI.20-24-09162.2000. [DOI] [PMC free article] [PubMed] [Google Scholar]
- Taschenberger H, Leão RM, Rowland KC, Spirou GA, von Gersdorff H. Optimizing synaptic architecture and efficiency for high-frequency transmission. Neuron. 2002;36:1127–1143. doi: 10.1016/s0896-6273(02)01137-6. [DOI] [PubMed] [Google Scholar]
- Tollin DJ. The lateral superior olive: a functional role in sound source localization. Neuroscientist. 2003;9:127–143. doi: 10.1177/1073858403252228. [DOI] [PubMed] [Google Scholar]
- Traynelis SF. Software-based correction of single compartment series resistance errors. J Neurosci Methods. 1998;86:25–34. doi: 10.1016/s0165-0270(98)00140-x. [DOI] [PubMed] [Google Scholar]
- Varela JA, Sen K, Gibson J, Fost J, Abbott LF, Nelson SB. A quantitative description of short-term plasticity at excitatory synapses in layer 2/3 of rat primary visual cortex. J Neurosci. 1997;17:7926–7940. doi: 10.1523/JNEUROSCI.17-20-07926.1997. [DOI] [PMC free article] [PubMed] [Google Scholar]
- von Gersdorff H, Borst JG. Short-term plasticity at the calyx of Held. Nat Rev Neurosci. 2002;3:53–64. doi: 10.1038/nrn705. [DOI] [PubMed] [Google Scholar]
- Wang LY, Kaczmarek LK. High-frequency firing helps replenish the readily releasable pool of synaptic vesicles. Nature. 1998;394:384–388. doi: 10.1038/28645. [DOI] [PubMed] [Google Scholar]
- Wang LY, Gan L, Forsythe ID, Kaczmarek LK. Contribution of the Kv3.1 potassium channel to high-frequency firing in mouse auditory neurones. J Physiol. 1998;509:183–194. doi: 10.1111/j.1469-7793.1998.183bo.x. [DOI] [PMC free article] [PubMed] [Google Scholar]
- Wang LY, Neher E, Taschenberger H. Synaptic vesicles in mature calyx of Held synapses sense higher nanodomain calcium concentrations during action potential-evoked glutamate release. J Neurosci. 2008;28:14450–14458. doi: 10.1523/JNEUROSCI.4245-08.2008. [DOI] [PMC free article] [PubMed] [Google Scholar]
- Wang Y, Manis PB. Short-term synaptic depression and recovery at the mature mammalian endbulb of Held synapse in mice. J Neurophysiol. 2008;100:1255–1264. doi: 10.1152/jn.90715.2008. [DOI] [PMC free article] [PubMed] [Google Scholar]
- Wu SH, Kelly JB. Response of neurons in the lateral superior olive and medial nucleus of the trapezoid body to repetitive stimulation: intracellular and extracellular recordings from mouse brain slice. Hear Res. 1993;68:189–201. doi: 10.1016/0378-5955(93)90123-i. [DOI] [PubMed] [Google Scholar]
- Yamashita T, Ishikawa T, Takahashi T. Developmental increase in vesicular glutamate content does not cause saturation of AMPA receptors at the calyx of Held synapse. J Neurosci. 2003;23:3633–3638. doi: 10.1523/JNEUROSCI.23-09-03633.2003. [DOI] [PMC free article] [PubMed] [Google Scholar]
- Yang H, Xu-Friedman MA. Relative roles of different mechanisms of depression at the mouse endbulb of Held. J Neurophysiol. 2008;99:2510–2521. doi: 10.1152/jn.01293.2007. [DOI] [PMC free article] [PubMed] [Google Scholar]
- Young ED, Sachs MB. Auditory nerve inputs to cochlear nucleus neurons studied with cross-correlation. Neuroscience. 2008;154:127–138. doi: 10.1016/j.neuroscience.2008.01.036. [DOI] [PMC free article] [PubMed] [Google Scholar]