

Abstract
Pyramidal cells of layer 6 in cat visual cortex are the source of the corticothalamic projection, and their recurrent collaterals provide substantially more excitatory synapses in layer 4 than does the thalamic input. They have predominantly simple receptive fields and can be driven monosynaptically by electrically stimulating thalamic relay cells. Layer 6 cells could thus provide a significant disynaptic amplification of the thalamic input to layer 4, particularly since their synapses facilitate, unlike the thalamic afferents whose synapses depress. However, purely geometric considerations of the relation of their dendritic trees to the thalamic input indicate that they should form a far smaller number of synapses with thalamic afferents than do the simple cells of layer 4. We thus analyzed quantitatively the thalamic input to identified corticothalamic cells by labeling the thalamic afferents and corticothalamic cells in vivo. We made a correlated light and electron microscopic study of 73 “contacts” between thalamic afferents and five corticothalamic cells. The electron microscope revealed that only 24 of the contacts identified at light microscope level were indeed synapses and, contrary to geometric predictions, virtually all were located on spines on the basal dendrites. Our quantitative estimates indicate that the corticothalamic cells form even fewer synapses with the thalamic afferents than predicted by geometric considerations and only 1/10 as many as do the layer 4 simple cells. These data strongly suggest it is the collective computation of cortical neurons, not the monosynaptic thalamic input, that determines the output of the corticothalamic cells.
Introduction
A feature of neocortex is its laminated structure, which reflects the organization of cell types and afferents, and provides a scaffold that constrains possible connections. In this study we investigated the pattern of thalamic input to the layer 6 corticothalamic (CT) pyramidal cells, which are unusual in having dendrites in two thalamorecipient layers: basal dendrites in layer 6 and apical dendrites in layer 4. The CT cells can be monosynaptically excited by electrical stimulation of the thalamic relay cells (Gilbert, 1977; Ferster and Lindström, 1983; Martin and Whitteridge, 1984) and, like neurons in layer 4, most have simple receptive fields (Harvey, 1978, 1980; Ferster and Lindström, 1983; Martin and Whitteridge, 1984; Grieve and Sillito, 1995) (but see Gilbert, 1977). In addition to their feedback to the thalamus, CT cells send a collateral projection to layer 4, where they form an estimated 9–19 times more synapses than the thalamic afferents (Ahmed et al., 1994; Binzegger et al., 2004), mainly with spiny neurons (McGuire et al., 1984; Ahmed et al., 1994; Anderson et al., 1994; Binzegger et al., 2004). Unlike the thalamic afferent synapses, which depress, CT synapses facilitate (Stratford et al., 1996). This disynaptic circuit of thalamic afferent to CT cell to layer 4, could be a significant pathway for relaying thalamic input to layer 4, since, by shear numbers it would amplify the thalamic input to cortex and so augment the direct thalamocortical pathway. Several studies have demonstrated such a facilitatory effect of layer 6 on layer 4 cells (Ferster and Lindström, 1985a,b; Grieve and Sillito, 1991).
The structure of simple RFs are thought to be determined by the thalamic input (Hubel and Wiesel, 1962; Reid and Alonso, 1995; Ferster et al., 1996; Chung and Ferster, 1998), which provides ∼6% of the excitatory synapses in layer 4 (100–300 synapses per neuron) (LeVay, 1986; Peters and Payne, 1993; Ahmed et al., 1994; Binzegger et al., 2004; da Costa and Martin, 2009). Our biologically realistic modeling of the spiny stellate cell of layer 4 indicated that these small numbers of thalamocortical synapses have to be activated within a very narrow time window to drive the cell to spike (Banitt et al., 2007). The electrotonically larger CT cells would thus require either more or stronger thalamocortical synapses. However, the strengths of the thalamocortical synapses in layer 4 and layer 6 are similar (Stratford et al., 1996; Bannister et al., 2002), so the question is, are there more thalamocortical synapses formed with the dendritic tree of a CT cell? Peters' rule (Peters and Feldman, 1976; Braitenberg and Schüz, 1991), which states that axons connect randomly in proportion to the amount of target dendrites in the neuropil, predicts that the CT cells should form only ∼55 synapses with the thalamic afferents (Binzegger et al., 2004). If confirmed, this would indicate that the thalamus is probably not a major driver of the CT cells. We tested this prediction using correlated light and electron microscopy to map the thalamic synapses formed with identified corticogeniculate neurons in area 17 of cat.
Materials and Methods
The material presented here was taken from five male cats. Animal treatment and surgical protocols were carried under license granted by the Kantonal Veterinaeramt of Zurich to K.A.C.M. Anesthesia was induced by a subcutaneous injection of xylazine (Rompun, Bayer, 0.5 mg/kg) and ketamine (Narketan 10, Vetoquinol, 10 mg/kg). Minor surgery to cannulate the femoral vein for delivery of intravenous anesthetic (alphaxalone/alphadolone “Saffan,” Schering-Plough Animal Health) was initially performed under additional gas anesthesia using 1–2% halothane (Arovet) in oxygen/nitrous oxide (50/50%). The cat was then intubated and moved to a stereotaxic apparatus, where it was respirated artificially with a mixture of oxygen/nitrous oxide (30/70%) with supplemental halothane (1%) and Saffan (0.1 ml boluses i.v.) as necessary to maintain surgical anesthesia during the craniotomy. For recording and injections, Saffan was infused continuously (0.1–0.2 ml/kg/h) together with the oxygen/nitrous oxide mixture (30/70%) to maintain stable balanced anesthesia. The EEG, ECG, heart rate, end-tidal CO2 (∼4.5%), and rectal temperature were monitored continuously.
Each animal received ionophoretic injections of the neuronal tracer biotinylated dextran amine (BDA, MW 10,000, Invitrogen) into the A laminae of the dorsal lateral geniculate nucleus (dLGN). The correct layer in the dLGN was located using a tungsten recording electrode at appropriate stereotaxic coordinates (Clarke and Henderson, 1914; Sanderson, 1971). Eye movements were reduced by a low dose of the muscle relaxant gallamine triethiodide (12 mg induction dose, 5 mg/kg/h thereafter, i.v.) (Sigma-Aldrich). When the appropriate lamina of the dLGN was found, the receptive field position and electrode position were noted and the tungsten electrode was replaced by a BDA-filled glass micropipette and the recordings were repeated to ensure the pipette tip (diameter 10–18 μm) was located in the correct position in the dLGN. Ionophoretic injections were made for 15–20 min at 2–4 μA. The BDA was delivered as a 10% solution in 0.01 m phosphate buffer (PB; pH 7.4) plus 0.2 m KCl; or 0.05 m Tris plus 0.4 m KCl. Delivery of the muscle relaxant was stopped 2–3 h before the end of the surgery. Respiration and muscular tone was monitored to assess the animal's recovery. After a 5–11 d survival period, the animals underwent an acute recording under general anesthesia for a related study (N. M. da Costa and K. A. C. Martin, unpublished work), before being deeply anesthetized with intravenous Saffan (20 mg/kg) and perfused transcardially with a normal saline solution, followed by a solution of 4% paraformaldehyde, 0.3% gluteraldehyde and 15% picric acid in 0.1 m PB, pH 7.4. The brain was blocked in a transverse stereotaxic plane and the block was sunk in a series of sucrose solutions of 10%, 20%, and 30% in 0.1 m PB to serve as cryoprotectant. The blocks were then freeze-thawed in liquid nitrogen and washed in 0.1 m PB for at least 1 h. Sections were cut from the blocks at 80 μm in the coronal plane and collected in 0.1 m PB. After washes in TBS the sections were left overnight (5°C) in an avidin–biotin complex (ABC kit Elite, Vector Laboratories). The peroxidase activity was identified using 3,3-diaminobenzidene tetrahydrochloride (Sigma-Aldrich) with nickel intensification. After assessment by light microscopy (LM) selected regions of tissue were treated with 1% osmium tetroxide in 0.1 m PB. Dehydration through alcohols (1% uranyl acetate in the 70% alcohol) and propylene oxide allowed flat mounting in Durcupan (Fluka Chemie) on glass slides.
Light microscope reconstructions.
Neurons and axons of interest were reconstructed from serial 80 μm sections in 2-D using a drawing tube attached to a light microscope, and then in 3-D using an in-house reconstruction system (TRAKA). The dendritic tree of all the neurons spanned several sections. The alignment of reconstructed dendrites through the serial sections was done using the incomplete ends of labeled profiles that were present in both sections. Only rotation and translation movements involving the entire forest structure were allowed for the alignment.
A toolbox was designed in Matlab to import, analyze, organize, plot, and manage in a database the 3-D reconstructions from TRAKA. The locations of single contacts between dLGN terminals and CT cells were noted on LM 3-D reconstructions. We scored a “contact” when no gap could be discerned between a labeled soma or dendrite (spine, shaft or varicosity) and a dLGN axon (shaft or bouton), at the LM level under oil (magnification of 1000×). The contacts between labeled neurons and labeled dLGN axons were digitally photographed at different magnifications from 50× to 1000×.
Optical disectors.
To quantify the density of dLGN boutons at the light microscopy level the optical disector technique was used (Gundersen, 1986). All optical disectors were performed using a Neurolucida system (MicroBrightField). A grid composed of 10 μm × 10 μm squares was randomly superimposed on the 80 μm section with the highest path length of labeled dendrite. The sampling region was approximately parallel to the lamina borders and was defined as the smallest rectangle in the X/Y plane that included all the labeled dendritic arbor in the layer of interest. Two sampling regions (one for layer 4 and one for layer 6) were chosen for each neuron. Sampling frames were then randomly sampled from the sampling region. Boutons were counted using an oil-immersion objective at a magnification of 1000×, and boutons were sampled from −10 μm from the surface (guard zone) to −50 μm so the full disector was 10 μm × 10 μm × 40 μm.
Peters' rule.
The implementation of Peters' rule that every component in the neuropil capable of forming an asymmetric synapse is a potential target of the thalamocortical afferents (Peters and Feldman, 1976) was based on that of Binzegger et al. (2004). Based on this rule, the number of synapses S that a neuron i receives in layer u from neuron dLGN is given by the following equation:
where SdLGNu is the number of synapses the dLGN forms in layer u, diu is the length of dendrite neuron i forms in layer u and Σknkdku is the sum length of all the dendrites in layer u, provided by all the neuron types k.
In the context of this work we apply Peters' rule not to synapses, but to the number of contacts made by dLGN axons with the dendrites of layer 6 pyramidal cells in layer 4 and 6. We were interested to know whether the ratio of contacts observed between layer 4 and 6 respects Peters' rule, and because of this, Si(dLGN)u was substituted by Ci(dLGN)u (where C is the number of contacts that neuron i forms in layer u). Also, instead of SdLGNu, we used the density of labeled boutons obtained through optical disectors, and used the Σknkdku per mm3.
To calculate the density of length of dendrite per layer, we used the length estimates of Binzegger et al. (2004) of 79.51 m for layer 4 and 38.3 m for layer 6. The volumes of layer 4 and 6 were calculated from their thickness, 510 μm for layer 4 and 344 for layer 6 (Beaulieu and Colonnier, 1983), and 399 mm2 as the total area of area 17 in the cat (Anderson et al., 1988).
Electron microscopy.
After LM observations of labeled axons, neurons, and contacts between dLGN axons and cortical dendrites were complete, we prepared regions of interest to be observed with transmission electron microscopy (EM). Serial ultrathin sections were collected at 60 nm thickness on Pioloform-coated single slot copper grids.
Synapse classification and measurements.
Synapses and associated structures were classified using conventional criteria (Gray, 1959; Colonnier, 1968). For a contact to be classified as an asymmetric synapse it had to form a postsynaptic density (PSD), separated by a synaptic cleft from the presynaptic terminal, where synaptic vesicles had to be observed in close vicinity or in contact with the presynaptic membrane.
Due to the shape of the synapse and the angle of sectioning, the synaptic cleft was sometimes very difficult to identify. To deal with this problem, the potential synapses between labeled cortical neurons and dLGN terminal were tilted in the EM.
The area of the postsynaptic density was calculated as the sum of the products of the length of the PSD in a single section and the section thickness:
 |
The distance between a contact and the soma was measured from the path length of dendrite taken from the 3-D LM reconstruction.
3-D reconstructions from serial ultrathin sections.
Photomicrographs of serial ultrathin sections were aligned, digitized, and reconstructed using Reconstruct (Fiala, 2005). Alignment was done serially so that every section was aligned with the preceding one using translation and rotation movements. Very rarely, when a strong deformation was present in the section, scale and shear movements were also used. Reference points found in both sections were used for the alignment (these included mitochondria, labeled profiles, blood vessels, and myelinated axons). When a section had to undergo scaling or shear we aligned the two adjacent sections with each other, instead of with the deformed photo. The reconstructed profiles were rendered using the open source software Blender (Stitching Blender Foundation).
LM contact analysis.
LM contacts were examined in the EM to investigate synaptic connectivity between the dLGN axon and the labeled cortical neurons. Blood vessels, labeled dendrites, and axons that were visible both at the LM and EM level were used to find the contact in the ultrathin sections. Once the particular contact was identified, we verified whether or not it was a synapse. Usually a high-power EM photograph (25,000× to 19,000×), a low-power EM photograph (3000× to 7900×), and a light micrograph were superimposed on each other to confirm the location of the contact in the EM. In some cases the presynaptic and postsynaptic structures were reconstructed from electron serial micrographs and the reconstruction superimposed on the light micrograph of the contact.
Results
Lateral geniculate nucleus injections
All the cats used in this study received injections in the contralateral A lamina of the dLGN. A few injections were also made into ipsilateral A1 and C laminae of the dLGN, and one into the medial interlaminar nucleus, but these are not reported here. In the thalamocortical pathway, BDA MW 10,000 behaves principally as an anterograde tracer and labels the thalamic afferents to visual areas; however, it is occasionally transported retrogradely along the axons of a small number of layer 6 CT-projecting cells.
We took advantage of this bidirectional transport of BDA to label CT cells in area 17, as well as their potential thalamic afferents. We reconstructed the dendritic arbors of five layer 6 cells (from five different cats) located in regions of area 17 in which the dLGN afferents to layers 6 and 4 were also labeled. In Figure 1 we show an example of one of these neurons surrounded by all of the dLGN boutons that were labeled in the region of its dendritic arbor. The other four pyramidal cells that were reconstructed are shown in Figure 2. The initial segment of the axons of the CT cells was visible, but we have not reconstructed the axons of these neurons. The reconstructed neurons had between 6 and 12 primary dendrites emerging from the soma. The apical dendrite always entered layer 4 and in four cases reached layer 3. The apical dendrites also branched in layers 4, 5, and 6 with a horizontal extent that was always larger than that of the basal dendrites (a detailed quantification of the dendritic tree is shown in supplemental Table 1, available at www.jneurosci.org as supplemental material). These features of the dendritic arbor of all five neurons identified them as the type I neurons first described by Katz (1987), which he showed to be the CT cells. The CT layer 6 pyramidal cells form very few boutons in layer 6 itself (Martin and Whitteridge, 1984; Katz, 1987), so they contribute few, if any, synapses, to the basal dendrites of other layer 6 pyramidal cells (Binzegger et al., 2004), but their local axon collaterals in layer 4 was a potential contaminant. Fortunately, the synaptic boutons formed by dLGN axons and axons of layer 6 neurons can be readily distinguished on morphological grounds. The axons of layer 6 pyramidal cells resemble a bottle brush, because they are studded with small boutons terminaux (Martin and Whitteridge, 1984; McGuire et al., 1984), whereas the thalamic axons form large en passant boutons (Freund et al., 1985; Humphrey et al., 1985; Ahmed et al., 1994).
Figure 1.
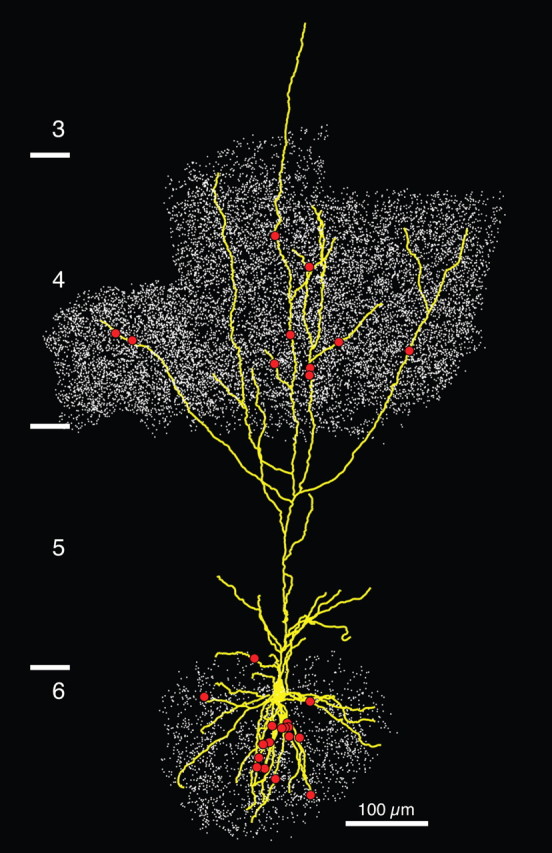
LM reconstruction of a corticothalamic cell (CT4) surrounded by dLGN boutons. LM reconstruction of the labeled neuron with dendrites in yellow and contacts with the dLGN boutons and axons represented by red dots. The white dots are the dLGN boutons as judged at LM that were in the vicinity of the neuron's dendrites in layers 4 and 6. Layer borders are shown on the left.
Figure 2.

LM reconstruction of four labeled CT cells (in black) with the locations of the contacts formed with dLGN boutons and axons represented by gray dots. A, CT1. B, CT2. C, CT3. D, CT5.
Contacts with the dLGN axons and boutons
We first mapped the positions on the dendritic tree of the CT cells where the dLGN axons formed synapses. As a first approximation we used light microscopy (10× ocular, oil 100× objective) to identify locations where, the dLGN axons appeared to touch the dendritic tree of the CT cell. We use the word “contact” to describe these points, which are potentially the locations of synapses. In Figure 3A we show a camera lucida reconstruction and light micrographs of such contacts. The LM examination showed that all five neurons were contacted multiple times by dLGN axons or boutons on both their apical and basal dendrites. Figures 1, 2, and 5 show the distribution of LM contacts along the dendritic tree of each neuron. Dendritic spines and dendritic shafts were contacted by dLGN axons (Fig. 3A). The high number of contacts with dendritic shafts (see supplemental Fig. 1, available at www.jneurosci.org as supplemental material) was unexpected, given that the dLGN axons form synapses mostly with spines (Garey and Powell, 1971; LeVay and Gilbert, 1976; Davis and Sterling, 1979; Winfield and Powell, 1983; Freund et al., 1985; Anderson et al., 2009). However, ∼60% of these shaft contacts were made by interbouton segments, so we were curious to see whether these LM contacts were in fact synapses.
Figure 3.
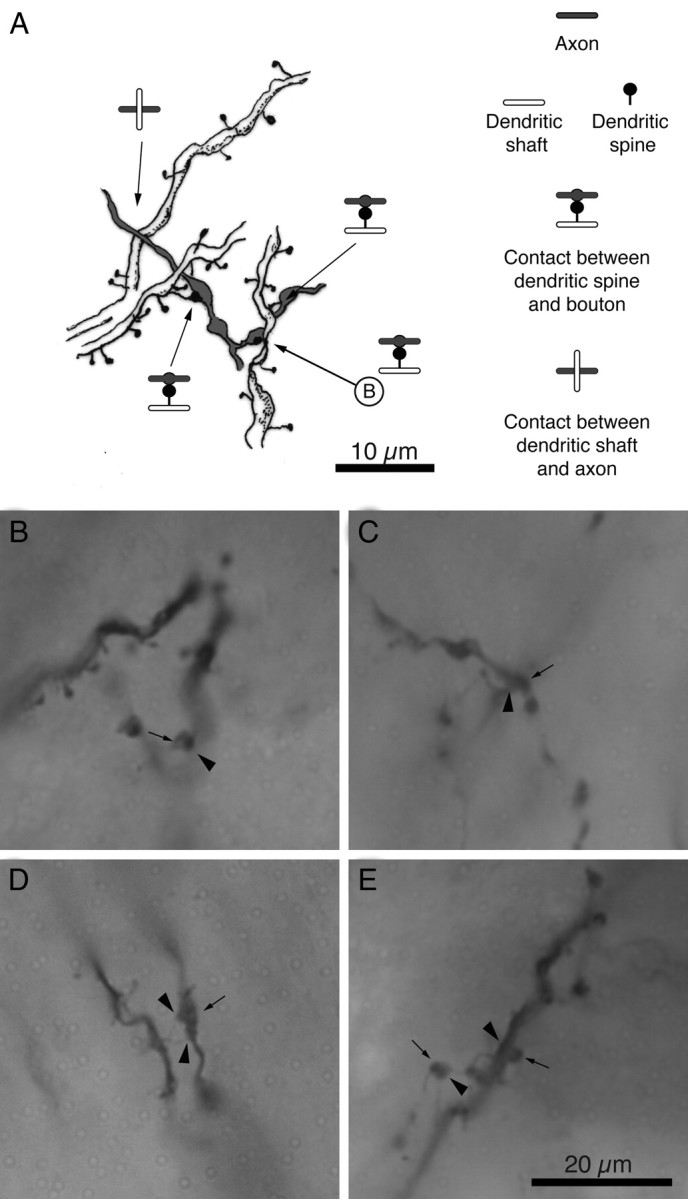
Light microscopy of contacts between CT neurons and individual dLGN axons. A, Camera lucida drawing of a segment of a dendrite of a layer 6 corticothalamic neuron being contacted on the shaft and spines by a dLGN axon. In one of the contacts the axon formed no bouton. Axons are shown in gray, dendritic shafts in white, and dendritic spines in black. The serial EM reconstruction is shown in Figure 4A. B–E, Light micrographs of contacts between the dendrites of corticothalamic neurons and dLGN axon. Presynaptic terminals are indicated with arrows and postsynaptic targets with arrowheads. B, Contact between a spine and bouton (camera lucida drawing in A, EM in Fig. 4A). C, Contact between a shaft and a bouton. D, Contact between two spines and bouton (EM in Fig. 4B,G,H). E, Contacts between a spine and a bouton and between a shaft and a bouton.
Figure 5.

Location of dLGN contacts on the dendritic trees of CT cells. A–E, Dendrograms of CT cells. Arrows of the same color indicate synapses formed by the same dLGN axon. F, Histogram showing the number of contacts between the dLGN axons and the CT cells that were synaptic and nonsynaptic for the five neurons analyzed.
On the basis of Peters' rule, Binzegger et al. (2004) predicted that layer 6 pyramidal cells should form twice as many synapses with the dLGN afferents in layer 4 than in layer 6. To test whether our LM data could support such a claim, we calculated for each cell the ratio between the expected number of contacts from the dLGN in layer 6 C(PyrNeuron)(LGN)6 and the expected number of contacts in layer 4 C(PyrNeuron)(LGN)4, given the following: the total length of dendrite of each neuron in layers 4 and 6 (supplemental Table 1, available at www.jneurosci.org as supplemental material), the density of labeled boutons around the dendrites calculated with an optical disector (Table 1), and the overall density of all dendrites in each layer (Binzegger et al., 2004). We compared these results with the ratio observed in our dataset. With the exception of cell CT1, all others did not fit the prediction and showed a much higher ratio than expected, suggesting that either there are more contacts than expected in layer 6, fewer contacts than expected in layer 4, or both. These results also raise the question of how the dLGN axons target the basal and apical dendrites of CT cells. At present only the EM provides the resolution necessary to confirm the existence of a synapse and provide definitive answers to these questions.
Table 1.
Comparison between the ratio of contacts made by the dLGN on dendrites in layers 4 and 6
| Corticothalamic neuron | CT1 | CT2 | CT3 | CT4 | CT5a | |
|---|---|---|---|---|---|---|
| dLGN contacts in layer 4 | 7 | 19 | 3 | 10 | 2 | |
| dLGN contacts in layer 6 | 35 | 5 | 37 | 16 | 14 | |
| dLGN bouton density in layer 4 (bt × 106/mm3) | 4.0 ± 0.2 (47) | 4.5 ± 0.2 (30) | 3.4 ± 0.1 (30) | 4.4 ± 0.3 (45) | 2.8 ± 0.3b (14) | |
| 0.7 ± 0.1c (20) | ||||||
| dLGN bouton density in layer 6 (bt × 106/mm3) | 2.3 ± 0.4 (16) | 1 ± 0.2 (25) | 1.5 ± 0.2 (20) | 1 ± 0.2 (22) | 0.2 ± 0.07 (20) | |
|
|
4.91 | 0.82 | 4.04 | 0.37 | 0.34 | |
|
|
5 | 3.8 | 12.3 | 1.6 | 7 |
C6/C4 is the expected ratio calculated using Peters' rule (see Materials and Methods). Observed6/Observed4 is the ratio calculated using the observed number of contacts in each layer. Data are shown as mean ± SEM, and n values are given in parentheses. Values are not corrected for shrinkage. bt, Boutons.
aNeuron CT5 had a portion of its dendrite in a dense region of dLGN boutons and another portion in a less dense region, and so the dLGN bouton density was calculated separately.
bDense region of boutons.
cLess dense region of boutons.
LM contacts and EM synapses
All five neurons were prepared for EM. The relevant portions of neurons CT3 and CT4 were almost completely resectioned, and we checked most of the LM contacts (some were lost in the process). Of the three remaining layer 6 pyramidal cells, we only examined in the EM those contacts that were present in a single 80-μm-thick section of layer 4 and layer 6. In all, we examined 73 LM contacts with layer 6 CT cells at the EM level. The dLGN boutons were filled with vesicles and contained mitochondria. Mitochondria in boutons are known to form contorted shapes (Anderson et al., 1998), so it is likely that the multiple profiles visible in most single sections reflect just a few mitochondria appearing many times within a single section. We also found a few smaller boutons that did not look like varicosities at LM, but at EM we discover that they were filled with vesicles, had mitochondria, and formed synapses. Synapses formed by regions of axon between varicosities are rare, but have been described for thalamocortical axons innervating mouse barrel cortex (White et al., 2004).
We did not reconstruct completely every target spine, but those we did reconstruct had typical spine heads, sometimes with long necks (Fig. 4A,B). In the younger animals, some of the spine heads were very small, as were the synapses. In Figure 4 we show examples of contacts, three of which form synapses (Fig. 4C–E). In these examples all the synapses were formed between a dLGN bouton and a spine, which was the case for all 24 synapses found on all the neurons. In the examples shown in Figure 4, A and B, a single dLGN axon formed multiple synapses with the same dendrite. The two examples are from different neurons and we have observed a third case where a dLGN bouton formed two synapses with the same dendrite. We have not followed and reconstructed individual dLGN axons, and so we do not know how often these multiple synapses occur.
Figure 4.
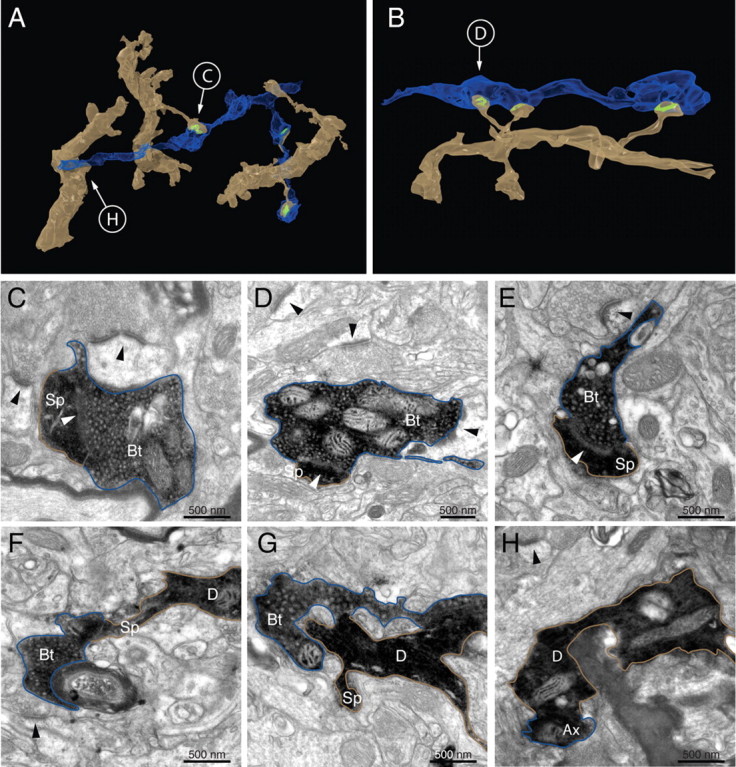
Electron microscopy of contacts between CT cells and individual dLGN axons. A, B, Reconstructions made from serial electron micrographs of two dLGN axons (blue) forming several synapses (green) with the basal dendrites (light brown) of corticothalamic neurons. In the case of B, two of the spines formed synapses with the same bouton. The same axon and dendrite formed a fourth synapse more distally. C–E, Electron micrographs of contacts judged at LM that form synapses between labeled spines (Sp) and labeled dLGN boutons (Bt). F–H, Electron micrographs of contacts judged at LM that did not form synapses between labeled profiles. Arrowheads indicate asymmetric synapses, dendrites are indicated by a “D,” and axons are indicated by an “Ax.”
Of the 36 spine contacts identified at LM, 50% formed synapses (18 synapses), while only 10% of contacts with dendritic shafts formed synapses (n = 30 LM contacts, 3 synapses). In the latter case, even though the LM contacts were identified as being between a labeled dendritic shaft and a labeled bouton, at the EM level we found the synapse was formed with a labeled spine that was not seen at LM. We also found three synapses formed between labeled structures that were not identified as a contact at LM. In one case the axon was not visible and in a second case, a small spine head had insufficient contrast to distinguish it from the bouton. The third case is particularly interesting, because it is a synapse formed between an axon shaft and a spine. There was a slight thickening of the axon, which contained vesicles and mitochondria, but there was no clear bouton.
These results show that it is not possible to predict from an LM observation whether a given contact forms a synapse. A closer look at contacts that did not form a synapse between labeled profiles revealed two slightly different scenarios. In 56% of cases the two labeled profiles were apposed, but did not form a synapse (Fig. 4F–H). In 44% of cases, EM revealed that the labeled profiles were separated by small profiles. Labeled boutons always formed a synapse or synapses, either with a labeled spine, or with other nonlabeled targets. In all but one case, the labeled spines always formed a synapse. The single labeled spine that did not form a classic synapse had no postsynaptic density, but was apposed to a dLGN bouton with a presynaptic density. However, it was in physical contact with a dLGN bouton. In layer 4, only 2 of 16 contacts (12.5%) formed synapses, and in layer 6, 19 of 54 (35%) formed synapses. The EM observations of these contacts showed that almost all of the synapses between dLGN boutons and layer 6 pyramidal cells were formed with the basal dendrites in layer 6. These results indicate that the dendrites of layer 6 CT pyramidal cells in layer 4 and in layer 6 have different probabilities of forming synapses with a dLGN afferents.
The five neurons examined were different in the proportions of contacts that formed synapses between labeled structures (Fig. 5). In one neuron, not one contact was found to form a synapse, although this was the CT cell that had the greatest number of contacts investigated (n = 19) in the EM.
Synapse area
We measured the synapse areas of all but two confirmed synapses (one cut at an awkward plane of section and in the second the series was incomplete) between the dLGN boutons and the CT cells. The distribution of the areas is shown in Figure 6. As mentioned above, we found three axons in which we could identify more than one synapse with a target CT cell. The areas of these synapses are plotted in Figure 6 as circles (cell CT4) and triangles (cell CT5). Synapses formed by the same dLGN axon are linked together.
Figure 6.

Area of dLGN synapses formed with CT cells. A, Histogram showing the area of dLGN synapses formed with CT cells in layer 6. When a single axon formed more than one synapse with a neuron its area was indicated by a circle (neuron CT4) or a triangle (neuron CT5). A line connects synapses formed by the same axon. B, Distribution of dLGN synaptic areas onto the basal dendrites of corticothalamic neurons according to distance.
It has been proposed that the conductances of synapses might scale according to their distance from the soma (Magee and Cook, 2000). Since synaptic area correlates with AMPA receptor numbers (Nusser et al., 1998), we were particularly interested to see whether we could observe such an indication of structural synaptic scaling with the dLGN synapses on basal dendrites. Figure 6B shows for each synapse the relation between the PSD area and the distance from the soma. Even though the pooled data suggested an increase of synapse area with distance, the data for individual neurons showed no consistent relationship. In the four neurons analyzed, synapse area varies differently with distance from the soma. Moreover, the smaller and most proximal synapses were collected from young cats (cat 1 and cat 2, age 9 weeks), which had significantly smaller synapses than the older animals (cat 3 and cat 4, age 16 and 19 months)(t test, p = 0.02). The mean area (±SD) of synapses formed between the CT cells and the thalamic axons was 0.12 μm2 ± 0.4 μm2 for the adult cats and 0.07 μm2 ± 0.05 μm2 for the young cats.
Synapse location
The dendrograms of Figure 5 show that the dLGN input is not restricted to a single basal dendrite. However, not all basal dendrites of a single neuron form a synapse with the dLGN afferents. We cannot say whether this is due to the fact that we have not labeled all the dLGN axons, or whether there is simply a sparse innervation. Some dendrites formed more than one synapse with dLGN boutons, which were located on the same or on different branches of the dendrite. In three cases the dendrite formed more than one synapse with the same dLGN axon collateral. Since we could not reconstruct single dLGN axons, we do not know how many different axons contribute to our sample of identified synapses, but multiple synapses were the exception.
From all twenty-four confirmed synapses with the CT cells, only two were not on terminal branches of the dendrite (one in layer 4 and one in layer 6). In layer 6 the average path length distance (±SD) from the synapse to the cell body was 79.8 ± 24.5 μm (n = 22, range 35.1 μm to 131.5 μm). We have slightly under-sampled contacts at more distal dendritic locations, which might lead to some underestimation of the mean distance to the soma (supplemental Fig. 2, available at www.jneurosci.org as supplemental material).
The distribution of the dLGN synapse to soma distances in layer 6 was not statistically different from the same measure of dLGN synapses to spiny stellate soma in layer 4 (t test, p = 0.7521) (N. M. da Costa and K. A. C. Martin, unpublished work). All of the 22 synapses found in layer 6 are shown in the summary dendrogram of Figure 7. From the 171 contacts seen at LM with layer 6 CT pyramidal cells, 73 were contacts with the apical dendrite or apical oblique dendrites. We investigated 27 of these contacts with the apical dendrite in the EM and found only 2 actually formed synapses, both in layer 4. Of the 27 contacts on the apical dendrite investigated in the EM, 10 were located on the segment in layer 6, but none of these formed synapses.
Figure 7.
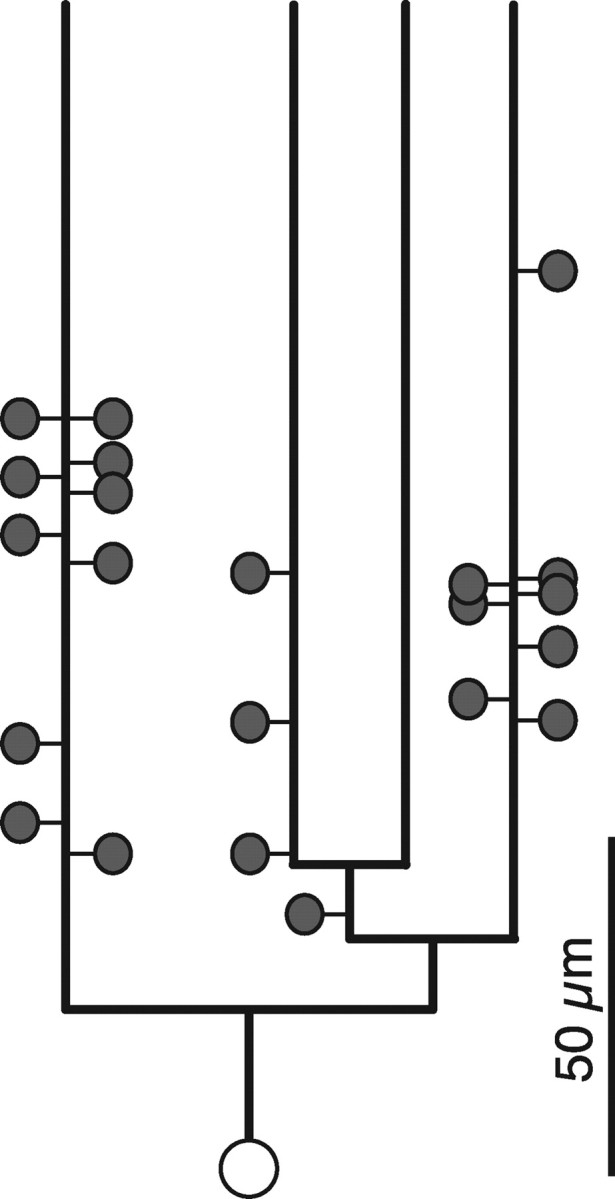
Summary of the location of the synapses found between dLGN axons and basal dendrites of CT cells. Each synapse was plotted as a spine at the path length distance to the soma and branch order. The distance between the root and the tip of a dendrite in the dendrogram is the mean tip to root path length distance of a basal dendrite. Most of the synapses were formed with terminal segments of dendrite. Each thalamic synapse was indicated as a spine and the soma as a white circle.
Differences between adults and young cats
Three CT cells were obtained from 9-week-old cats. Even though the overall pattern of the thalamic synapses in young and adult CT cells was the same, there were some qualitative differences. The dLGN boutons in young cats were smaller than in the adult, and this difference was already obvious at LM. At the ultrastructural level the dLGN boutons of young cats looked like a scaled-down version of the adult. All the neurons from young cats showed a large number of spines with very small heads. Ramón y Cajal first described these structures as “irregular projections that rarely ended as bulbs” (cited by DeFelipe, 2006), and they are now known as filopodia. Such filopodia could be longer than 2 μm and usually formed a small synapse on their tip. These were never seen in the CT cells from adult cats.
Discussion
The question we posed in the Introduction was whether the CT pyramidal cells could mediate a significant disynaptic input from the dLGN to layer 4? A key test of this hypothesis was to determine the number and location of the thalamic synapses in these pyramidal cells. For comparison, our previous work indicated that the biophysically compact spiny stellate cells formed 100–300 synapses with the thalamic afferents (Ahmed et al., 1994; Binzegger et al., 2004) and that these had to be activated synchronously to drive the spiny stellate to threshold (Banitt et al., 2007). Although the dendritic trees of CT cells span two thalamorecipient layers, our new results show that thalamic afferents form synapses almost exclusively with spines located on the basal dendrites of the CT cells. This is unexpected, given that the thalamic afferents form 10 times more synapses in layer 4 than in layer 6. Binzegger et al. (2004), on the basis of Peters' rule, estimate that layer 6 pyramidal cells form only ∼20 synapses with the thalamic afferents in layer 6, compared with the 55 estimated when the thalamic input to layer 4 is included.
That CT cells form so few synapses with the dLGN afferents implies that they do not mediate a significant parallel route for thalamic input to drive layer 4, since only if they were poised near threshold could the thalamic input evoke a spike. In the light of this finding, the fact that most corticothalamic neurons have simple RFs (Harvey, 1978, 1980; Ferster and Lindström, 1983; Martin and Whitteridge, 1984; Grieve and Sillito, 1995) (but see Gilbert, 1977) raises additional questions, because it is generally assumed that simple cells are created by their thalamic input (Hubel and Wiesel, 1962; Bullier et al., 1982; Tanaka, 1983; Ferster, 1987; Reid and Alonso, 1995; Alonso et al., 2001; Hirsch and Martinez, 2006).
dLGN and simple receptive fields of corticothalamic neurons
How many thalamic synapses are necessary to generate the simple RF? Various estimates have been made of the convergence of thalamic afferents on simple cells, but there are no direct physiological estimates of the number of synapses involved. However, Banitt et al. (2007) brought together all relevant experimental data to construct a biologically realistic computational model of simple cells. Their simulation results indicate that ∼200 thalamic synapses have to be activated synchronously to drive a spiny stellate cell to spike, but they only achieve this if the membrane is already depolarized by spontaneous activity from cortical cells. That a spiny stellate requires all its dLGN synapses to be active is perhaps not surprising, but the simulation provides a constraint on the minimum number of dLGN synapses needed. Since the synaptic weights of the putative dLGN afferent synapses in layer 6 are similar to those in layer 4 (Stratford et al., 1996; Bannister et al., 2002) these simulation results indicate that the 20 or so dLGN synapses formed with CT cells are an order of magnitude too few to contribute significantly to the structure of their simple receptive fields.
The simulation results of Banitt et al. (2007) emphasize the importance of relative synchrony in driving a cortical neuron. When activated in very tight synchrony by electrical stimulation, 20 thalamic synapses, each producing at least 1 mV (Bannister et al., 2002) would of course be sufficient to drive some layer 6 neurons to threshold, as is found experimentally (Bullier and Henry, 1979; Martin and Whitteridge, 1984). However, as in layer 4 spiny stellate cells (Stratford et al., 1996), the thalamic synapses formed with layer 6 pyramidal cells depress (Bannister et al., 2002) so that the repetitive stimulation evoked in vivo reduces the probability of evoking a spike (Boudreau and Ferster, 2005; Banitt et al., 2007). Ferster and Lindström (1983) also showed that while electrical stimulation of the dLGN evokes a monosynaptic compound EPSP in all layer 6 neurons recorded, the EPSP “appeared somewhat smaller” than those recorded in layer 4 neurons, and it was common that it was too small to evoke an action potential. Moreover, intracellularly recorded action potentials usually were delayed from the thalamic EPSP by one millisecond. This was in contrast with recording from cells in layer 4 where the latency of the action potentials lagged behind the thalamic EPSP by a “few tenths of milliseconds.”
The presence of so few dLGN synapses leaves open the possibility that in circumstances where the cortical input depolarizes CT cells to near threshold, a small number of dLGN synapses firing in synchrony might still be enough to drive CT cells to spike. Since layer 6 pyramidal cells form ∼45% of all excitatory synapses in layer 4 (Ahmed et al., 1994), even one or two spikes added to the discharge of CT cells might have a significant effect because of the fan-out of their axons in layer 4. In this scenario, any disynaptic amplification of the thalamic input to the layer 6 cells that project to layer 4, would still be under the control of the collective computation of the cortical circuit.
Regional specificity in input to the CT cells
Our results raise questions about the computation performed by the CT cells and the role of the feedback to the dLGN. According to the model of Gilbert and Wiesel (1983), the excitatory input to the CT cells is dominated by one of the longest loops in the cortical circuit: one that begins in layer 4 and then is transmitted to layer 3, to layer 5, which then drives layer 6 (Gilbert and Wiesel, 1983; Douglas and Martin, 2004). However, the paradox is that the simple RFs of most CT cells do not resemble those of the layer 5 pyramidal cells, which typically have large complex RFs (Hubel and Wiesel, 1962). Thus, we must reconsider the source of the CT receptive field properties. The segment of the CT cell's apical dendrite in layer 4 forms ∼1600 asymmetric synapses (Binzegger et al., 2004), but since few if any of these synapses are provided by the dLGN afferents, most must be provided by spiny stellate cells, which have simple RFs. The apical and oblique dendritic segments in layer 5 form ∼900 synapses (Binzegger et al., 2004), most of which could well originate from those layer 3 pyramidal cells with simple RFs (Hubel and Wiesel, 1962; Bullier and Henry, 1979; Martin and Whitteridge, 1984). These two inputs, together with the weak dLGN input to the basal dendrites, may generate the simple receptive field (Fig. 8). The input from layer 5 complex cells to the basal dendrites of the CT cells would provide a phase-insensitive subthreshold depolarization upon which the phase-aligned inputs from layers 3 and 4 and dLGN could play. In this scenario, the layer 5 input from large complex RFs would increase the sensitivity of the CT cells representing the region of the visual field where that visual stimulus will soon appear (Gabbott et al., 1987). The CT cells will then propagate this “belief” both to layer 4 and to the dLGN. The projection from the CT cells to the dLGN has been shown to be effective in synchronizing the thalamic relay neurons (Sillito et al., 1994) and modulating their bursting activity (Wang et al., 2006). Both of these effects can increase the efficacy of the thalamic afferent excitation.
Figure 8.
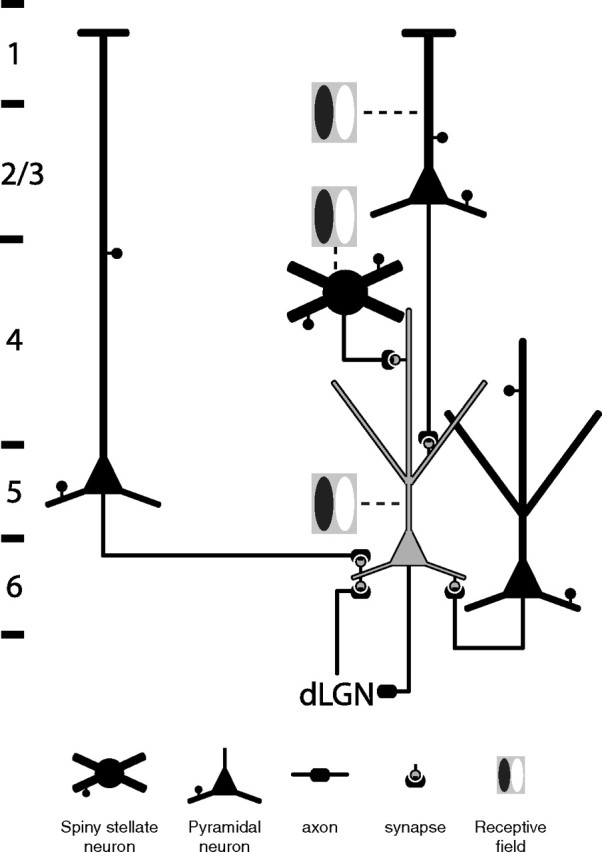
Schematic diagram summarizing the major excitatory inputs to a CT cell shown in gray. Layer borders are shown on the left.
Conclusion
The main advantage of these time-consuming anatomical methods over the more commonly used in vitro physiological methods for mapping the source and relative weight of synaptic inputs onto identified target cells is that it is possible to identify the precise location of the synapses and to give a precise estimate of the number of synapses involved. The precise location is important, because, despite more than 50 years of study of the cable properties of dendrites, and the intriguing simulations of possible computations that might be performed if synapses were in particular relations with one another, we still have only a low-power view of how different projections map onto the dendritic tree of individual neurons. The absolute numbers of synapses contributed by particular projections are important, because of our accumulating evidence that for many, if not all cortical neurons, it is the “minor” inputs that are actually the key players in determining their RF properties. The fine grain mapping we have made here is an important means of linking the subcellular biophysics of dendritic processing to the high level circuit properties that determine the cells contribution to the cortical computations.
Footnotes
This work was supported by European Union Daisy Project Grant FP6-2005-015803. N.M.d.C. was a fellow from Fundação para a Ciencia e Tecnologia in the Gulbenkian PhD Program in Biology and Medicine (Grant SFRH/BD2724/2000). We thank Rita Bopp and German Koestinger for their expert technical assistance and John Anderson for helpful discussions and critical reading of the manuscript. We also thank Anita Schmid, Pamela Baker, and Cyrille Girardin for their help in the experiments.
References
- Ahmed B, Anderson JC, Douglas RJ, Martin KAC, Nelson JC. Polyneuronal innervation of spiny stellate neurons in cat visual cortex. J Comp Neurol. 1994;341:39–49. doi: 10.1002/cne.903410105. [DOI] [PubMed] [Google Scholar]
- Alonso JM, Usrey WM, Reid RC. Rules of connectivity between geniculate cells and simple cells in cat primary visual cortex. J Neurosci. 2001;21:4002–4015. doi: 10.1523/JNEUROSCI.21-11-04002.2001. [DOI] [PMC free article] [PubMed] [Google Scholar]
- Anderson JC, Douglas RJ, Martin KAC, Nelson JC. Map of the synapses formed with the dendrites of spiny stellate neurons of cat visual cortex. J Comp Neurol. 1994;341:25–38. doi: 10.1002/cne.903410104. [DOI] [PubMed] [Google Scholar]
- Anderson JC, Binzegger T, Martin KAC, Rockland KS. The connection from cortical area V1 to V5: a light and electron microscopic study. J Neurosci. 1998;18:10525–10540. doi: 10.1523/JNEUROSCI.18-24-10525.1998. [DOI] [PMC free article] [PubMed] [Google Scholar]
- Anderson JC, da Costa NM, Martin KAC. The W cell pathway to cat primary visual cortex. J Comp Neurol. 2009;516:20–35. doi: 10.1002/cne.22085. [DOI] [PubMed] [Google Scholar]
- Anderson PA, Olavarria J, Van Sluyters RC. The overall pattern of ocular dominance bands in cat visual cortex. J Neurosci. 1988;8:2183–2200. doi: 10.1523/JNEUROSCI.08-06-02183.1988. [DOI] [PMC free article] [PubMed] [Google Scholar]
- Banitt Y, Martin KAC, Segev I. A biologically realistic model of contrast invariant orientation tuning by thalamocortical synaptic depression. J Neurosci. 2007;27:10230–10239. doi: 10.1523/JNEUROSCI.1640-07.2007. [DOI] [PMC free article] [PubMed] [Google Scholar]
- Bannister NJ, Nelson JC, Jack JJ. Excitatory inputs to spiny cells in layers 4 and 6 of cat striate cortex. Philos Trans R Soc Lond B Biol Sci. 2002;357:1793–1808. doi: 10.1098/rstb.2002.1160. [DOI] [PMC free article] [PubMed] [Google Scholar]
- Beaulieu C, Colonnier M. The number of neurons in the different laminae of the binocular and monocular regions of area 17 in the cat, Canada. J Comp Neurol. 1983;217:337–344. doi: 10.1002/cne.902170308. [DOI] [PubMed] [Google Scholar]
- Binzegger T, Douglas RJ, Martin KAC. A quantitative map of the circuit of cat primary visual cortex. J Neurosci. 2004;24:8441–8453. doi: 10.1523/JNEUROSCI.1400-04.2004. [DOI] [PMC free article] [PubMed] [Google Scholar]
- Boudreau CE, Ferster D. Short-term depression in thalamocortical synapses of cat primary visual cortex. J Neurosci. 2005;25:7179–7190. doi: 10.1523/JNEUROSCI.1445-05.2005. [DOI] [PMC free article] [PubMed] [Google Scholar]
- Braitenberg V, Schüz A. Anatomy of the cortex. Berlin: Springer; 1991. Peters' rule and White's exceptions. [Google Scholar]
- Bullier J, Henry GH. Laminar distribution of first-order neurons and afferent terminals in cat striate cortex. J Neurophysiol. 1979;42:1271–1281. doi: 10.1152/jn.1979.42.5.1271. [DOI] [PubMed] [Google Scholar]
- Bullier J, Mustari MJ, Henry GH. Receptive-field transformations between LGN neurons and S-cells of cat-striate cortex. J Neurophysiol. 1982;47:417–438. doi: 10.1152/jn.1982.47.3.417. [DOI] [PubMed] [Google Scholar]
- Chung S, Ferster D. Strength and orientation tuning of the thalamic input to simple cells revealed by electrically evoked cortical suppression. Neuron. 1998;20:1177–1189. doi: 10.1016/s0896-6273(00)80498-5. [DOI] [PubMed] [Google Scholar]
- Clarke RH, Henderson EE. Atlas of photographs of sections of the frozen cranium and brain of the cat. II. Frontal sections. J Psychol Neurol. 1914;21:273–277. [Google Scholar]
- Colonnier M. Synaptic patterns on different cell types in the different laminae of the cat visual cortex. An electron microscope study. Brain Res. 1968;9:268–287. doi: 10.1016/0006-8993(68)90234-5. [DOI] [PubMed] [Google Scholar]
- da Costa NM, Martin KAC. The proportion of synapses formed by the axons of the lateral geniculate nucleus in layer 4 of area 17 of the cat. J Comp Neurol. 2009;516:264–276. doi: 10.1002/cne.22133. [DOI] [PubMed] [Google Scholar]
- Davis TL, Sterling P. Microcircuitry of cat visual cortex: classification of neurons in layer IV of area 17, and identification of the patterns of lateral geniculate input. J Comp Neurol. 1979;188:599–627. doi: 10.1002/cne.901880407. [DOI] [PubMed] [Google Scholar]
- DeFelipe J. Brain plasticity and mental processes: Cajal again. Nat Rev Neurosci. 2006;7:811–817. doi: 10.1038/nrn2005. [DOI] [PubMed] [Google Scholar]
- Douglas RJ, Martin KAC. Neuronal circuits of the neocortex. Annu Rev Neurosci. 2004;27:419–451. doi: 10.1146/annurev.neuro.27.070203.144152. [DOI] [PubMed] [Google Scholar]
- Ferster D. Origin of orientation-selective EPSPs in simple cells of cat visual cortex. J Neurosci. 1987;7:1780–1791. doi: 10.1523/JNEUROSCI.07-06-01780.1987. [DOI] [PMC free article] [PubMed] [Google Scholar]
- Ferster D, Lindström S. An intracellular analysis of geniculo-cortical connectivity in area 17 of the cat. J Physiol. 1983;342:181–215. doi: 10.1113/jphysiol.1983.sp014846. [DOI] [PMC free article] [PubMed] [Google Scholar]
- Ferster D, Lindström S. Augmenting responses evoked in area 17 of the cat by intracortical axon collaterals of cortico-geniculate cells. J Physiol. 1985a;367:217–232. doi: 10.1113/jphysiol.1985.sp015821. [DOI] [PMC free article] [PubMed] [Google Scholar]
- Ferster D, Lindström S. Synaptic excitation of neurones in area 17 of the cat by intracortical axon collaterals of cortico-geniculate cells. J Physiol. 1985b;367:233–252. doi: 10.1113/jphysiol.1985.sp015822. [DOI] [PMC free article] [PubMed] [Google Scholar]
- Ferster D, Chung S, Wheat H. Orientation selectivity of thalamic input to simple cells of cat visual cortex. Nature. 1996;380:249–252. doi: 10.1038/380249a0. [DOI] [PubMed] [Google Scholar]
- Fiala JC. Reconstruct: a free editor for serial section microscopy. J Microsc. 2005;218:52–61. doi: 10.1111/j.1365-2818.2005.01466.x. [DOI] [PubMed] [Google Scholar]
- Freund TF, Martin KAC, Whitteridge D. Innervation of cat visual areas 17 and 18 by physiologically identified X- and Y-type thalamic afferents. I. Arborization patterns and quantitative distribution of postsynaptic elements. J Comp Neurol. 1985;242:263–274. doi: 10.1002/cne.902420208. [DOI] [PubMed] [Google Scholar]
- Gabbott PL, Martin KA, Whitteridge D. Connections between pyramidal neurons in layer 5 of cat visual cortex (area 17) J Comp Neurol. 1987;259:364–381. doi: 10.1002/cne.902590305. [DOI] [PubMed] [Google Scholar]
- Garey LJ, Powell TP. An experimental study of the termination of the lateral geniculo-cortical pathway in the cat and monkey. Proc R Soc Lond B Biol Sci. 1971;179:41–63. doi: 10.1098/rspb.1971.0080. [DOI] [PubMed] [Google Scholar]
- Gilbert CD. Laminar differences in receptive field properties of cells in cat primary visual cortex. J Physiol. 1977;268:391–421. doi: 10.1113/jphysiol.1977.sp011863. [DOI] [PMC free article] [PubMed] [Google Scholar]
- Gilbert CD, Wiesel TN. Functional organization of the visual cortex. Prog Brain Res. 1983;58:209–218. doi: 10.1016/S0079-6123(08)60022-9. [DOI] [PubMed] [Google Scholar]
- Gray EG. Axo-somatic and axo-dendritic synapses of the cerebral cortex: an electron microscope study. J Anat. 1959;93:420–433. [PMC free article] [PubMed] [Google Scholar]
- Grieve KL, Sillito AM. A re-appraisal of the role of layer VI of the visual cortex in the generation of cortical end inhibition. Exp Brain Res. 1991;87:521–529. doi: 10.1007/BF00227077. [DOI] [PubMed] [Google Scholar]
- Grieve KL, Sillito AM. Differential properties of cells in the feline primary visual cortex providing the corticofugal feedback to the lateral geniculate nucleus and visual claustrum. J Neurosci. 1995;15:4868–4874. doi: 10.1523/JNEUROSCI.15-07-04868.1995. [DOI] [PMC free article] [PubMed] [Google Scholar]
- Gundersen HJ. Stereology of arbitrary particles. A review of unbiased number and size estimators and the presentation of some new ones, in memory of William R. Thompson. J Microsc. 1986;143:3–45. [PubMed] [Google Scholar]
- Harvey AR. Characteristics of corticothalamic neurons in area 17 of the cat. Neurosci Lett. 1978;7:177–181. doi: 10.1016/0304-3940(78)90164-7. [DOI] [PubMed] [Google Scholar]
- Harvey AR. A physiological analysis of subcortical and commissural projections of areas 17 and 18 of the cat. J Physiol. 1980;302:507–534. doi: 10.1113/jphysiol.1980.sp013258. [DOI] [PMC free article] [PubMed] [Google Scholar]
- Hirsch JA, Martinez LM. Circuits that build visual cortical receptive fields. Trends Neurosci. 2006;29:30–39. doi: 10.1016/j.tins.2005.11.001. [DOI] [PubMed] [Google Scholar]
- Hubel DH, Wiesel TN. Receptive fields, binocular interaction and functional architecture in the cat's visual cortex. J Physiol. 1962;160:106–154. doi: 10.1113/jphysiol.1962.sp006837. [DOI] [PMC free article] [PubMed] [Google Scholar]
- Humphrey AL, Sur M, Uhlrich DJ, Sherman SM. Projection patterns of individual X- and Y-cell axons from the lateral geniculate nucleus to cortical area 17 in the cat. J Comp Neurol. 1985;233:159–189. doi: 10.1002/cne.902330203. [DOI] [PubMed] [Google Scholar]
- Katz LC. Local circuitry of identified projection neurons in cat visual cortex brain slices. J Neurosci. 1987;7:1223–1249. doi: 10.1523/JNEUROSCI.07-04-01223.1987. [DOI] [PMC free article] [PubMed] [Google Scholar]
- LeVay S. Synaptic organization of claustral and geniculate afferents to the visual cortex of the cat. J Neurosci. 1986;6:3564–3575. doi: 10.1523/JNEUROSCI.06-12-03564.1986. [DOI] [PMC free article] [PubMed] [Google Scholar]
- LeVay S, Gilbert CD. Laminar patterns of geniculocortical projection in the cat. Brain Res. 1976;113:1–19. doi: 10.1016/0006-8993(76)90002-0. [DOI] [PubMed] [Google Scholar]
- Magee JC, Cook EP. Somatic EPSP amplitude is independent of synapse location in hippocampal pyramidal neurons. Nat Neurosci. 2000;3:895–903. doi: 10.1038/78800. [DOI] [PubMed] [Google Scholar]
- Martin KAC, Whitteridge D. Form, function and intracortical projections of spiny neurones in the striate visual cortex of the cat. J Physiol. 1984;353:463–504. doi: 10.1113/jphysiol.1984.sp015347. [DOI] [PMC free article] [PubMed] [Google Scholar]
- McGuire BA, Hornung JP, Gilbert CD, Wiesel TN. Patterns of synaptic input to layer 4 of cat striate cortex. J Neurosci. 1984;4:3021–3033. doi: 10.1523/JNEUROSCI.04-12-03021.1984. [DOI] [PMC free article] [PubMed] [Google Scholar]
- Nusser Z, Lujan R, Laube G, Roberts JD, Molnar E, Somogyi P. Cell type and pathway dependence of synaptic AMPA receptor number and variability in the hippocampus. Neuron. 1998;21:545–559. doi: 10.1016/s0896-6273(00)80565-6. [DOI] [PubMed] [Google Scholar]
- Peters A, Feldman ML. The projection of the lateral geniculate nucleus to area 17 of the rat cerebral cortex. I. General description. J Neurocytol. 1976;5:63–84. doi: 10.1007/BF01176183. [DOI] [PubMed] [Google Scholar]
- Peters A, Payne BR. Numerical relationships between geniculocortical afferents and pyramidal cell modules in cat primary visual cortex. Cereb Cortex. 1993;3:69–78. doi: 10.1093/cercor/3.1.69. [DOI] [PubMed] [Google Scholar]
- Reid RC, Alonso JM. Specificity of monosynaptic connections from thalamus to visual cortex. Nature. 1995;378:281–284. doi: 10.1038/378281a0. [DOI] [PubMed] [Google Scholar]
- Sanderson KJ. The projection of the visual field to the lateral geniculate and medial interlaminar nuclei in the cat. J Comp Neurol. 1971;143:101–108. doi: 10.1002/cne.901430107. [DOI] [PubMed] [Google Scholar]
- Sillito AM, Jones HE, Gerstein GL, West DC. Feature-linked synchronization of thalamic relay cell firing induced by feedback from the visual contex. Nature. 1994;369:479–482. doi: 10.1038/369479a0. [DOI] [PubMed] [Google Scholar]
- Stratford KJ, Tarczy-Hornoch K, Martin KAC, Bannister NJ, Jack JJ. Excitatory synaptic inputs to spiny stellate cells in cat visual cortex. Nature. 1996;382:258–261. doi: 10.1038/382258a0. [DOI] [PubMed] [Google Scholar]
- Tanaka K. Cross-correlation analysis of geniculostriate neuronal relationships in cats. J Neurophysiol. 1983;49:1303–1318. doi: 10.1152/jn.1983.49.6.1303. [DOI] [PubMed] [Google Scholar]
- Wang W, Jones HE, Andolina IM, Salt TE, Sillito AM. Functional alignment of feedback effects from visual cortex to thalamus. Nat Neurosci. 2006;9:1330–1336. doi: 10.1038/nn1768. [DOI] [PubMed] [Google Scholar]
- White EL, Weinfeld E, Lev DL. Quantitative analysis of synaptic distribution along thalamocortical axons in adult mouse barrels. J Comp Neurol. 2004;479:56–69. doi: 10.1002/cne.20300. [DOI] [PubMed] [Google Scholar]
- Winfield DA, Powell TP. Laminar cell counts and geniculo-cortical boutons in area 17 of cat and monkey. Brain Res. 1983;277:223–229. doi: 10.1016/0006-8993(83)90929-0. [DOI] [PubMed] [Google Scholar]