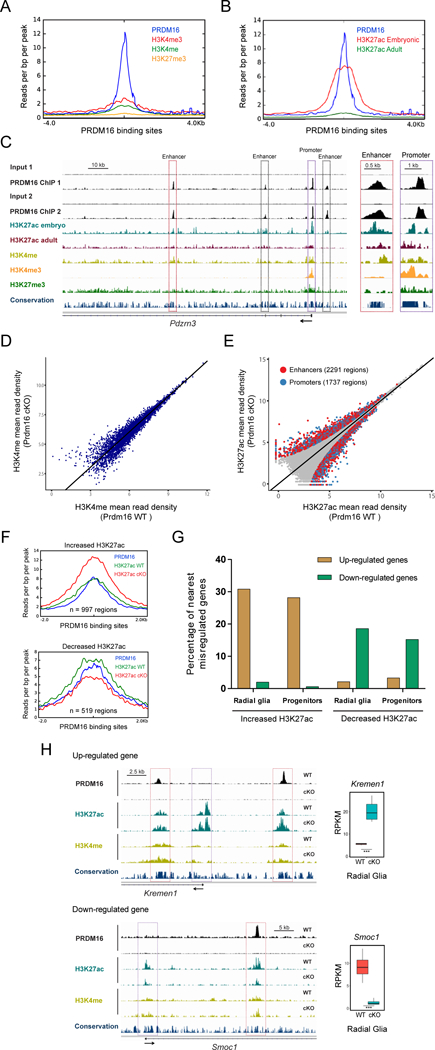
Figure 6. PRDM16 regulates transcriptional enhancers in the embryonic cortex.

(A) H3K4me3, H3K4me, and H3K27me3 profile within a genomic window centered on PRDM16 binding sites in the embryonic cortex.
(B) H3K27ac embryonic and adult profile within a genomic window centered on PRDM16 binding sites in the embryonic cortex.
(C) Profile of histone modifications and PRDM16 binding near the transcription start site of Pdzrn3. Inset shows closer view of the Pdzrn3 promoter (purple box) and one enhancer (red box).
(D) Genome-wide comparison of H3K4me in E15.5 WT and Prdm16 cKO cortex (n=2).
(E) Genome-wide comparison of H3K27ac in E15.5 WT and Prdm16 cKO cortex (n=3). Differential H3K27ac enrichment within enhancers and promoters (FDR < 0.05) are highlighted as red and blue circles, respectively.
(F) Overlap of PRDM16 binding sites with regions showing differential H3K27ac between WT and Prdm16 cKO cortex.
(G) Percentage of nearest misregulated genes in the cKO cortex with regions of differential H3K27ac enrichment.
(H) Genome tracks showing regions with differential H3K27ac enrichment near Kremen1 and Smoc1, which are shown as examples of up-regulated and down-regulated genes, respectively. Significant changes in H3K27ac (FDR < 0.05) are indicated at enhancers (red boxes) and promoters (purple boxes).
Statistically significant gene expression changes were identified using a FDR < 0.05 (*** adjusted p-value < 0.001).
